The diffuse ionized gas (DIG) in star-forming galaxies: the influence of aperture effects on local H ii regions
Abstract
The Diffuse Ionized Gas (DIG) contributes to the nebular emission of galaxies, resulting in emission line flux ratios that can be significantly different from those produced by H ii regions. Comparing the emission of [SII]6717,31 between pointed observations of H ii regions in nearby galaxies and integrated spectra of more distant galaxies, it has been recently claimed that the DIG can also deeply affect the emission of bright, star-forming galaxies, and that a large correction must be applied to observed line ratios to recover the genuine contribution from H ii regions. Here we show instead that the effect of DIG on the integrated spectra of star-forming galaxies is lower than assumed in previous work. Indeed, aperture effects on the spectroscopy of nearby H ii regions are largely responsible for the observed difference: when spectra of local H ii regions are extracted using large enough apertures while still avoiding the DIG, the observed line ratios are the same as in more distant galaxies. This result is highly relevant for the use of strong-line methods to measure metallicity.
keywords:
ISM: abundances – HII regions – galaxies: ISM – galaxies: abundances1 Introduction
Emission lines are a fundamental probe of the physical properties of the interstellar medium (ISM) and reveal a large number of characteristics of the emitting galaxies, such as star formation rates (SFR), gas-phase metallicity and abundance ratios, dust extinction, dynamical mass, presence of outflows, and presence of an active galactic nucleus (AGN). In many cases, optical emission lines are dominated by ionization by young, massive stars, but different ionization sources are also present. Specifically, shocks and hot, evolved stars can contribute to the total emission (see, e.g., Peimbert et al. 2017; Maiolino & Mannucci 2019; Kewley et al. 2019).
Most of our knowledge of the distant universe comes from spectra of spatially unresolved or poorly resolved ( kpc) galaxies. Even if spectra are often modelled by the emission of single, homogeneous H ii region, reality is clearly not that simple. Galaxies contain a complex, multi-phase ISM characterized by different values of density, temperature, ionization, and metallicity.
The warm (°K), ionized component of the ISM can be subdivided into H ii regions, where Hydrogen is fully ionized by hot, young stars, and the diffuse ionized gas (DIG), a more diffuse medium found outside H ii regions, and particularly evident above and below the galactic plane.
With respect to H ii regions, the DIG is characterized by lower densities, lower ionization parameters, a harder ionizing spectrum, a potential presence of shocks, lower equivalent widths (EW) of line emission, and a lower surface brightness (SB) (Reynolds, 1984; Minter & Balser, 1997; Hidalgo-Gámez, 2005; Haffner et al., 2009; Belfiore et al., 2016; Kumari et al., 2019; Vale Asari et al., 2019; Della Bruna et al., 2020). As a consequence, the DIG shows line ratios that could differ substantially from those observed in H ii regions, with much stronger emission of the low ionization lines as [OII]3726,29 and, in particular, [SII]6717,31 (e,g., Zhang et al. 2017).
The DIG consists of several, physically distinct components that should not be confused even if they are given the same name. 1) part of the DIG is ionized by photons from young, hot stars leaking out of the H ii regions and ionizing gas at larger distances, at lower densities, producing lower ionization parameters. (e.g. Ferguson et al., 1996; Voges & Walterbos, 2006). This gas sees an ionizing spectrum similar to that of the H ii region, hardened by partial absorption (e.g. Giammanco et al., 2004; Zhang et al., 2017). Its position in the Baldwin-Phillips-Terlevich (BPT) diagram ([OIII]5007/H vs. [NII]6584/H) is generally expected to be the same as H ii regions, with similar emission line ratios (Zhang et al. 2017, Belfiore et al., in prep). Clearly there is continuity between the properties of H ii regions and of the surrounding DIG, and there is no clear boundary between the two. Being produced by the hot, young stars, the amount of this "leaking-DIG" is expected to be proportional to the SFR, as the emission from the H ii regions. As such, it is dominant in star-forming galaxies. 2) part of the DIG is ionized by old, post-AGB stars, sometimes named HOLMES (hot low-mass evolved stars). This "HOLMES-DIG" component is dominant in quenched galaxies with no or low levels of star formation (e.g., Byler et al. 2019). Emission line flux ratios can be very different from those from H ii regions and their position on the BPT diagram is in the low-ionisation emission-line region (LIER) part (Kumari et al., 2019). Its relative contribution to line emission is expected to change greatly from galaxy to galaxy, depending on the specific SFR (sSFR), and with cosmic time. 3) part of the DIG is due to ionization by shocks or by the hot-cold gas interface (e.g. Rand, 1998; Collins & Rand, 2001; Haffner et al., 2009; Zhang et al., 2017). This "shocked-DIG" also produces line ratios in the LIER part of the BPT diagram, and can also be revealed by larger line widths (Tüllmann & Dettmar, 2000; Hidalgo-Gámez, 2005). It contribution is related to the star-formation activity (e.g. Rossa & Dettmar, 2003), and can be particularly evident at high galactic latitudes and at large distances from the disk.
HOLMES-DIG and shocked-DIG are preferentially selected when either BPT diagrams and/or cuts in EW(H) are used (e.g. Lacerda et al., 2018; Kumari et al., 2019; Law et al., 2021, see Fig 2 and section 2.1.)
In contrast, when H ii regions are (often subjectively) isolated from the surrounding medium based on morphology or surface brightness (SB) of the emission lines, the remaining emission is usually dominated by leaking-DIG.
Throughout this paper we do not consider the ISM ionized by the hard radiation typical of AGNs.
The influence of DIG on the integrated properties of galaxies is subject of active debate. The DIG gives an important contribution to the emission of the Milky Way (e.g., Zurita et al. 2000) and of the local galaxies (e.g., Oey et al. 2007; Della Bruna et al. 2020): depending on the definition, this contribution can be even larger than 90%. In more distant galaxies, however, the contribution of the DIG to the total line emission cannot be measured directly. In most cases, only integrated spectra, or spectroscopy with poor spatial resolution, are available, and it is not possible to spatially separate H ii regions and the DIG. As the total spectrum is a flux-weighted sum of all the emission, the much larger SB of H ii regions can easily dominate the emission as soon as the SFR is significant, nevertheless the underlying contribution of DIG can alter the observed emission line flux ratios.
A large influence of the DIG on the spectra of star-forming galaxies would have a significant impact on many results
on the determination of their physical properties. In particular, the methods to measure ISM metallicity from the strong-line ratios (see, e.g., Maiolino &
Mannucci 2019) are calibrated on H ii regions or on star-forming galaxies, and cannot be safely applied on galaxies with different levels of contribution from the DIG due to different levels of sSFR .
Also, contamination from DIGs would significantly affect our picture of the evolution of the mass-metallicity relation (MZR, e.g., Tremonti
et al. 2004) and of the Fundamental metallicity relation (FMR, e.g., Mannucci et al. 2010).
A promising method to quantify the contribution of the DIG is to compare the spectra of local H ii regions with the integrated spectra of galaxies. The DIG contribution to the former set of spectra is expected to be negligible, while the intrinsic properties of nearby and distant H ii regions are expected to be similar. With these two assumptions the differences in spectra can be attributed to the contribution of DIG to the spectra using apertures much larger than the H ii regions.
This method was recently employed, for example, by Sanders et al. (2017) and Sanders et al. (2019), who compared the spectra in nearby, H ii regions observed using pointed long slit spectra, with integrated spectra, like the SDSS (Abazajian et al., 2009), or with low resolution, kpc-scale spectra like CALIFA (Sánchez et al., 2012) and MaNGA (Bundy et al., 2015). They revealed large differences is some line ratios, in particular in those including the low ionization [SII]6717,31 doublet. Here we will show that this difference is actually dominated by aperture effect in the local sample of H ii regions.
1.1 Radial dependence of line ratios and aperture effects
H ii regions are expected to be stratified. Specifically, higher ionization species like and dominate the inner regions, closer to the ionizing source, while lower ionization species are more abundant in the outer part. The ionization structure of a spherically-symmetric H ii region around a ionization source can be theoretically computed with dedicated software, such as CLOUDY (Ferland
et al., 2013) or MAPPINGS (Dopita et al., 2014). H ii region models have been presented in many works (see, for example, Levesque
et al. 2010, Pellegrini et al. 2012, Xiao
et al. 2018, and Kewley et al. 2019). The high ionization lines like [OIII]5007 and [SIII]9069,9531 are emitted by the inner part of the regions, surrounded by the intermediate- ([NII]6854) and low-ionization lines ([OII]3727 and [SII]6717,31). For example,
Xiao
et al. (2018) find a 0.6 dex increase in the [SII]6717,31/H ratio between the central and outer part of their modelled H ii regions.
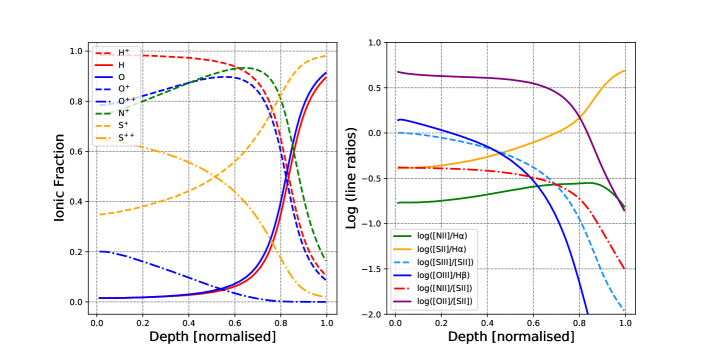
This effect is exemplified in Fig. 1, which shows the results of CLOUDY model for a H ii region ionized by a 2 Myr-old simple stellar population, with density of , metallicity [Fe/H]=–0.2, and ionization parameter log(U)=–3.5. The input spectrum is generated using the flexible stellar population synthesis code fsps v3.1 of (Conroy
et al., 2009) and MIST isochrones (Choi et al., 2016; Dotter, 2016). More details are presented in Belfiore et al., in prep. The models show that most of the low ionization lines from and, in particular, (left panel) are emitted by the outer shell of the H ii region. As a consequence, the line ratios (right panel) have a strong radial dependence: for example log([SII]6717,31/H) changes by more than one order of magnitude, from near the inner edge of the ionized gas to near the outer edge. As a consequence, spectra covering only the inner part of an H ii regions would show line ratios which are not representative of the entire region.
The spectra of nearby H ii regions are, in most cases, obtained using long slits with typical apertures of , giving physical spatial scales of 10–50 pc at distances of a few Mpc. (Pilyugin et al., 2012). The recent catalog of H ii spectra of the CHAOS project (Berg et al., 2015; Croxall et al., 2015, 2016; Berg et al., 2020) is often used because of its high S/N ratio, large spectral coverage, homogeneity, and number of targets. This catalog is based of high-quality LBT observations of about 200 H ii regions in three galaxies (NGC628, M51, and M101), between 7.2 Mpc and 9.8 Mpc, for which the 1 slit width samples 35-45pc. Recently, the CHAOS team has published data for one additional galaxy, NGC2403, much closer that the others and, as a consequence, sampling even smaller physical sizes (Rogers et al., 2021).
1.2 H ii region size
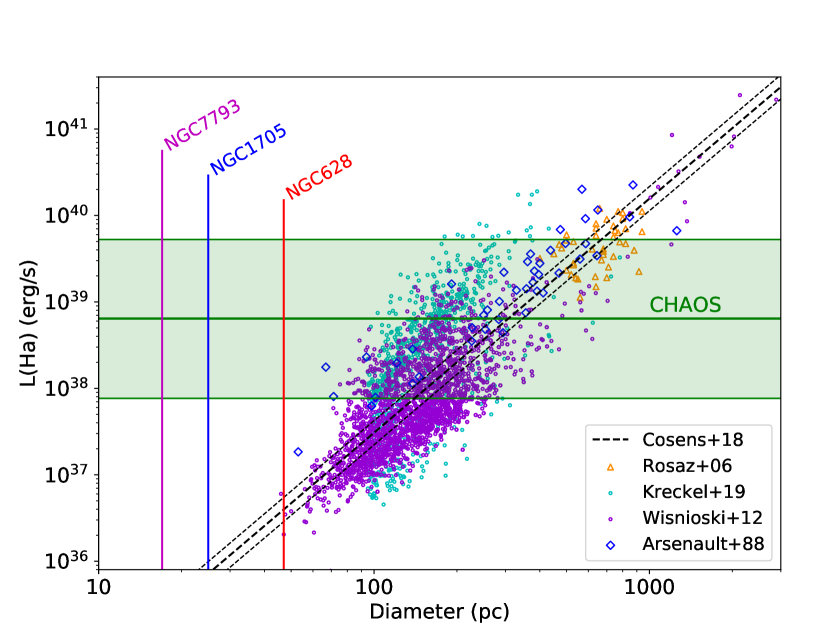
H ii region radii scale with luminosity following a a well-defined relation (e.g., Kennicutt 1984; Youngblood & Hunter 1999; Oey et al. 2003; Ferreiro & Pastoriza 2004; Pellegrini et al. 2012; Wisnioski et al. 2012; Beaton et al. 2014; Cosens et al. 2018). This relation is shown in Fig. 3, together with the linear fit by Cosens et al. (2018). At the typical H luminosities targeted by the CHAOS project, shown by the green band containing 90% of sample, the H ii region diameters are between 80 and 800 pc, while the 1″ slit samples between 35pc and 55pc. Using apertures smaller than these size scales may therefore result in biased line ratios, because the spectroscopic aperture would collect only a low fraction of [SII]6717,31/H. Evidences of varying line ratios along slits centered on H ii regions and long enough to cover the surrounding regions have been found in nearby galaxies for distance scales of pc (Hoopes & Walterbos, 2003; Voges & Walterbos, 2006), even if long-slit spectra cannot recover the full emission of a spatially-resolved H ii region.
In this work we want use IFU spectra to test if this aperture effect is present in the CHAOS data, and what its consequences are in estimating the contribution of the DIG in integrated spectra of galaxies.
2 Integrated, DIG-free Spectra of nearby H ii regions
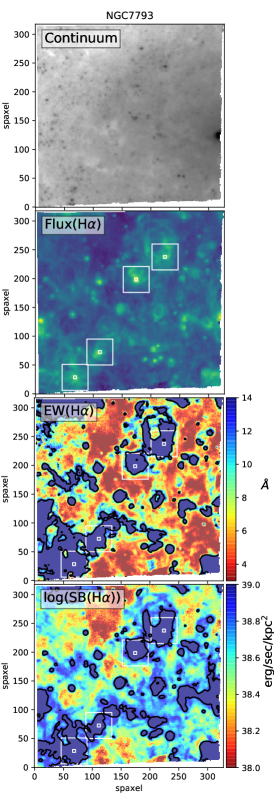
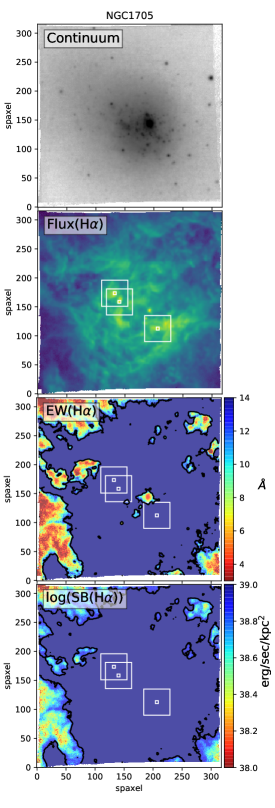
To study the effect of aperture choice on line ratios, we have selected three local galaxies, with distance below 10Mpc, across a large range of metallicity, and for which MUSE/VLT integral-field-unit (IFU) spectra are available, see Table 1. MUSE spectra cover the optical wavelength range from 0.46m to 0.93m and allow us to observe most of the bright emission lines that characterize star-forming galaxies in the local universe. The large field-of-view (FoV) and high sampling (0.2/spaxel) of the instrument, together with the excellent seeing at Paranal (typically 0.6-0.8 FWHM) allow us to sample scales of 20–30 pc, below the typical dimensions of average-luminosity H ii regions (see, e.g, Wisnioski et al. 2012 and Beaton et al. 2014). Line fluxes were obtained for each spaxel of the datacube by a multi-gaussian fit to each emission line, as described in Marasco et al. (2020). We have used these IFU spectra to study the effect of different apertures on the resulting spectra, avoiding any contribution from the DIG.
2.1 DIG definition
Commonly, DIG is defined using the H line, selecting regions with either low SB(H), or low EW(H). Conversely, H ii regions are identified with regions of high SB(H) or high EW(H), once AGN-dominated regions are removed. The two definitions are physically different but, at least in local galaxies, lead to similar results.
The definition based on SB(H) is motivated both by the observed change in line ratios with SB (Oey et al., 2007), and the physical expectations from leaking photons from H ii regions. High-resolution studies of local galaxies divide H ii regions from DIG regions using SB down to erg/s/kpc2 (Hoopes et al., 1996; Ferguson et al., 1996; Della Bruna et al., 2020). Here we follow Zhang et al. (2017) and Kumari et al. (2019) and use a significantly higher threshold, defining a region as H ii-dominated if it has SB(H) erg/s/kpc2, value at which the line ratios start to change significantly. Our results do not depend critically on the use SB threshold, and changing its value by 0.5dex does not change the conclusions. The DIG contribution to these regions is therefore expected to be negligible.
Using spatially resolved data from CALIFA, Lacerda et al. (2018) proposed a scheme were the emitting regions can be divided into three classes based on EW(H). The DIG dominates regions with EW(H)3Å, at EW(H)14Åthe ionization is purely due to H ii regions, while in between there are various levels of mixing. They showed that EW(H) correlates tightly with the position on the BPT diagrams, with regions with EW(H)14Å having line ratios typical of H ii regions. Also, only EW(H)3Å are observed in early type galaxies, while in galaxies later than Sc are dominated by regions with EW(H)14Å. Finally, extraplanar emission, far from star-forming regions, is dominated by low EW(H) regions, while disks are dominated by high EW(H) regions.
The strong relation between EW(H) and position on the BPT can also be seen in the MaNGA data, as shown in Fig. 2 (Westfall et al., 2019; Belfiore et al., 2019; Mingozzi et al., 2020): when the 4686 AGN-hosting galaxies (9% of the total sample) are removed using the central spectrum, the remaining spaxels with high EW(H) also have line ratios typical of star-forming galaxies, while gas ionized by shock and post-AGB stars shows low values of EW(H).
We have applied these two DIG definitions based and EW(H) and SB(H) to our sample of galaxies.
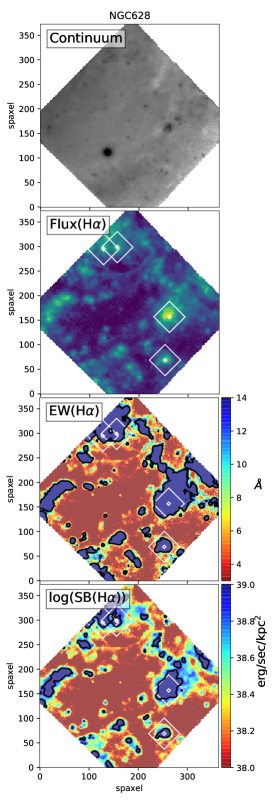
In Fig. 4 we show the maps of stellar continuum, H luminosity, EW(H) and SB(H), for the three fields. In all galaxies compact, bright regions are present together with a more diffused, low SB(H) and low EW(H) emission. The colour-coding in the EW(H) and SB(H) maps is such that, in both cases, regions totally dominated by H ii emission (EW(H)14Å or SB(H) erg/s/kpc2) are shown in blue, and DIG-dominated regions (EW(H)3Å or SB(H) erg/s/kpc2) are shown in red.
Intermediate colors map regions with both contributions.
The two classification schemes are very similar,
with a good match even on the scale of individual spaxels.
In this work we use the definition of DIG based on EW(H), but the results do not depend much on this choice.
| H ii region | RA | DEC | L(H) | log([NII]/H) | log([OIII]/H) | log([SII]/H) | log([SIII]/[SII]) | ||||
|---|---|---|---|---|---|---|---|---|---|---|---|
| erg/s | |||||||||||
| NGC628 A | 01:36:36.73 | 15:46:33.8 | 6.34 | –0.54 | –0.55 | –0.43 | –0.70 | –0.76 | –0.65 | +0.19 | –0.10 |
| NGC628 B | 01:36:38.53 | 15:47:00.8 | 1.52 | –0.53 | –0.53 | –0.91 | –0.68 | –0.80 | –0.62 | +0.06 | –0.41 |
| NGC628 C | 01:36:36.78 | 15:46:15.6 | 0.965 | –0.61 | –0.54 | –0.80 | –0.78 | –0.89 | –0.66 | +0.14 | –0.23 |
| NGC628 D | 01:36:38.15 | 15:47:01.4 | 1.38 | –0.56 | –0.53 | –0.90 | –0.68 | –0.80 | –0.61 | +0.08 | –0.37 |
| NGC7793 A | 23:57:52.01 | 32:35:14.2 | 0.757 | –0.92 | –0.71 | +0.27 | +0.35 | –0.94 | –0.50 | +0.55 | –0.16 |
| NGC7793 B | 23:57:53.04 | 32:35:39.8 | 0.437 | –0.90 | –0.70 | –0.26 | –0.23 | –0.92 | –0.49 | +0.38 | –0.12 |
| NGC7793 C | 23:57:52.70 | 32:35:48.5 | 0.635 | –0.81 | –0.77 | –0.67 | –0.36 | –0.67 | –0.51 | +0.01 | –0.21 |
| NGC7793 D | 23:57:51.23 | 32:35:06.9 | 0.553 | –0.71 | –0.60 | –0.14 | –0.26 | –0.68 | –0.39 | +0.05 | –0.30 |
| NGC1705 A | 04:54:14.65 | 53:21:37.1 | 14.6 | –1.43 | –1.31 | +0.68 | +0.61 | –0.99 | –0.77 | +0.31 | –0.07 |
| NGC1705 B | 04:54:14.83 | 53:21:37.1 | 11.9 | –1.52 | –1.28 | +0.59 | +0.54 | –1.04 | –0.73 | +0.31 | –0.12 |
| NGC1705 C | 04:54:13.18 | 53:21:46.1 | 17.2 | –1.58 | –1.38 | +0.67 | +0.68 | –1.04 | –0.89 | +0.25 | +0.04 |
2.2 Spectra of H ii regions of different apertures
In the three fields we selected a representative sample of the 11 H ii regions showing the brightest H emission, see Tab. 2. These regions are always characterized by high EW(H) and high SB(H), showing that they are dominated by ionization by hot, young stars. These are the regions usually observed in pointed H ii observations like CHAOS. Their luminosity, L(H)erg/s, places them among the typical H ii regions and significantly below the giant H ii regions (L(H)erg/s) Ferreiro & Pastoriza, 2004; Helmboldt et al., 2005; Bradley et al., 2006).
Spectra with apertures of are extracted at the position of each H ii region, to reproduce what is usually observed by long-slit observations. This aperture corresponds to 15-45 pc, depending of the galaxy distance, similar to or smaller than what is sampled by CHAOS (typically 45 pc). As MUSE only covers the wavelength range between 0.46m and 0.93m, the total flux of the [SIII] doublet is obtained by using the theoretical flux ratio [SIII]9531/[SIII]9069=2.47 as used in PYNEB (Luridiana et al., 2015; Mingozzi et al., 2020). A second spectrum is extracted at the same position with apertures up to (140-420 pc), large enough to sample most of the H ii region emission. This aperture also mimics the area covered by IFU surveys such as CALIFA or MaNGA. The fibers used for these surveys are physically smaller (2 and 3, respectively), but the target galaxies are usually more distant. Inside these apertures, only H ii spaxels, i.e., with EW(H)14Å, were considered, all the spaxels below this threshold are masked out. This procedure produces an integrated spectrum of the H ii regions avoiding contamination by the DIG. As a consequence, these two spectra refer to the same DIG-free H ii region but with two different physical coverage, few tens of pc for the aperture, and few hundreds of pc for , sampling most of the H ii regions (even if the H ii regions in the galaxy with the lowest metallicity can be even more extended).
3 Results
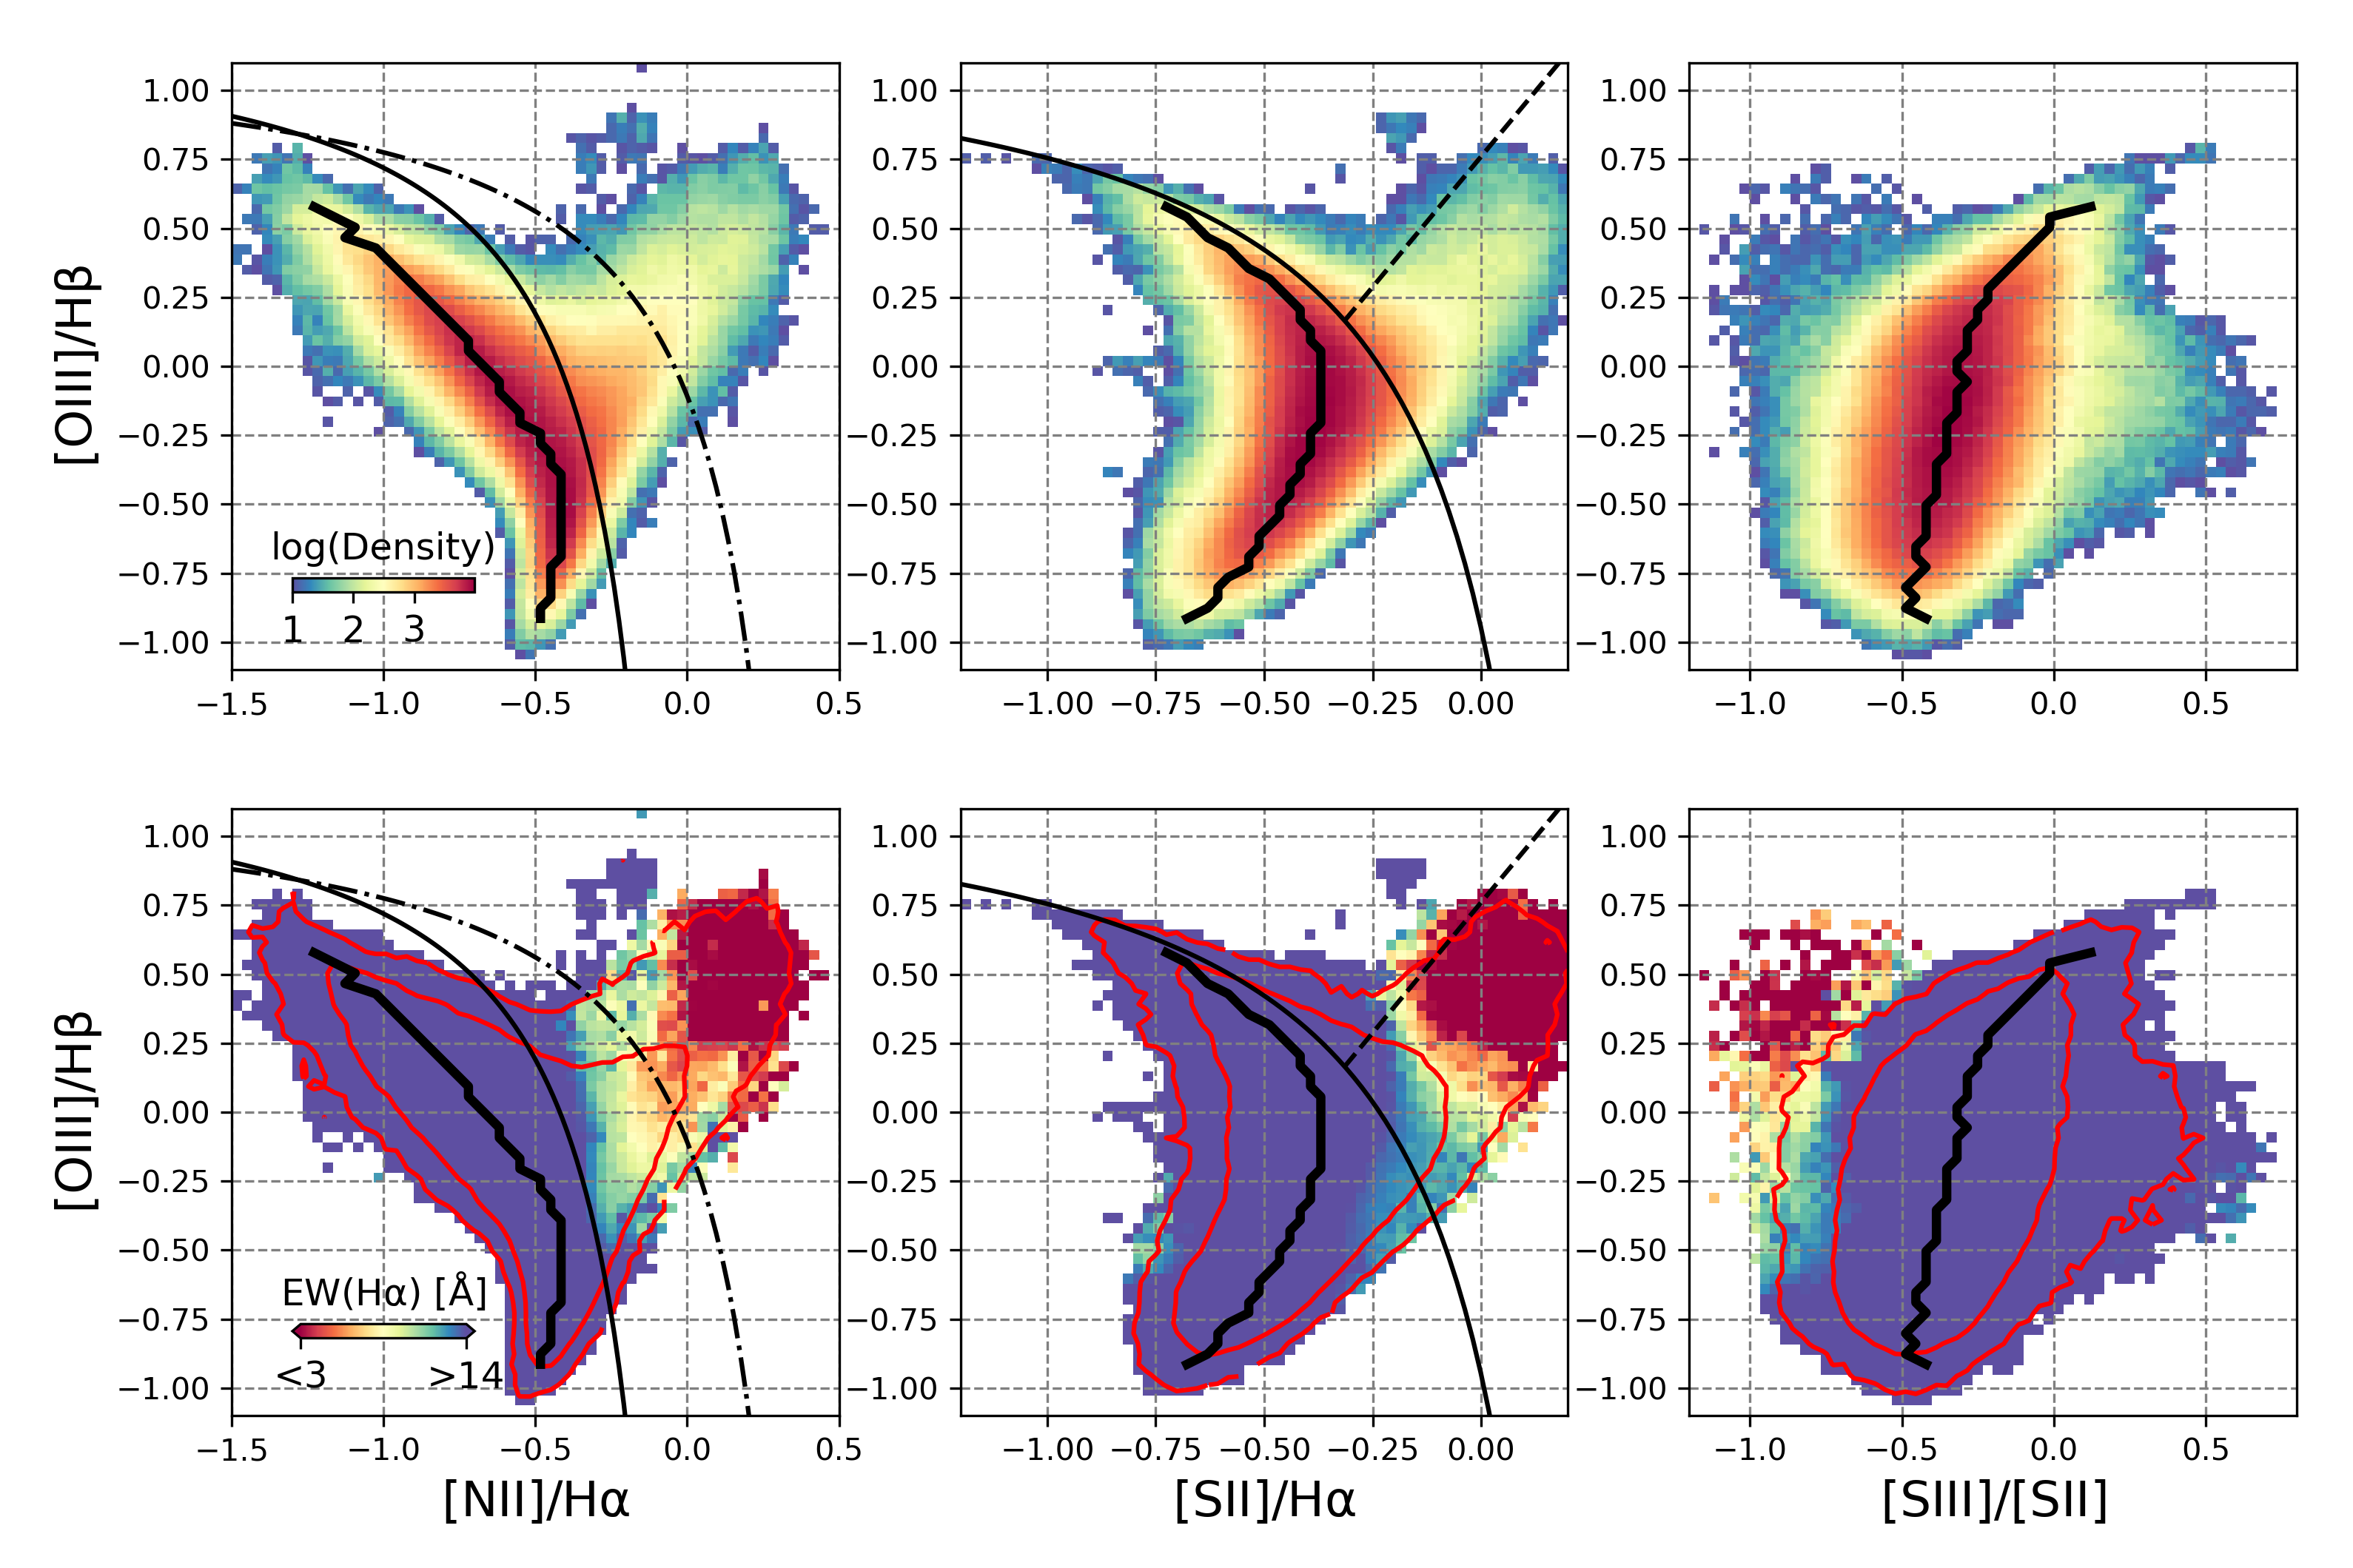
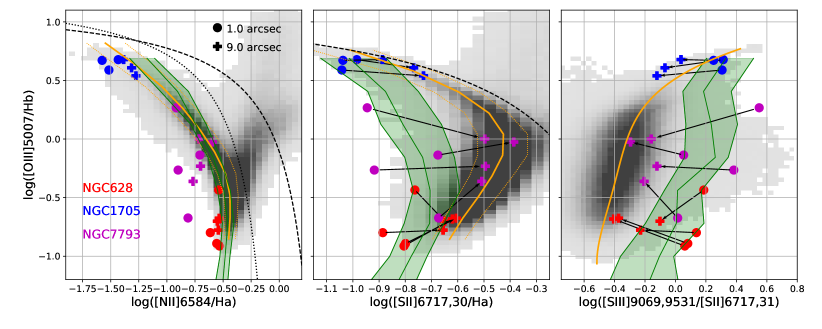
The results on several line ratios are presented in Fig 5. Circles and crosses show the results using small and large apertures, respectively. The grey-scale images and orange lines show kpc-scale spectra from SDSS and MaNGA with S/N5 for each line, S/N for [SIII]9069,9531. The green-shaded area show the positions of single H ii regions from the CHAOS project.
The aperture has hardly any effect of the [NII]6584/H and [OIII]5007/H line ratios, as shown if the left panel of the figure.
In contrast, line ratios involving [SII]6717,31 are deeply affected. [SII]6717/H (middle panel) increases significantly when increasing the aperture. The line ratios obtained with the small apertures are consistent with those obtained by CHAOS, while when using large aperture the results are similar to what obtained by SDSS and MaNGA. Same effect is seen for the [SIII]9069,9531/[SII]6717,31 (lower panel): the ratio decreases significantly with aperture, becoming consistent with MaNGA at large apertures. Large-aperture line ratios are also consistent with those obtained by Kreckel et al. (2019) for a sample of nearby H ii regions with luminosities (L(H) erg/s) and spectroscopic apertures (d= pc) similar to our sample. We stress that the large apertures are still inside the H ii boundary as defined above and avoid any significant contribution from DIG.
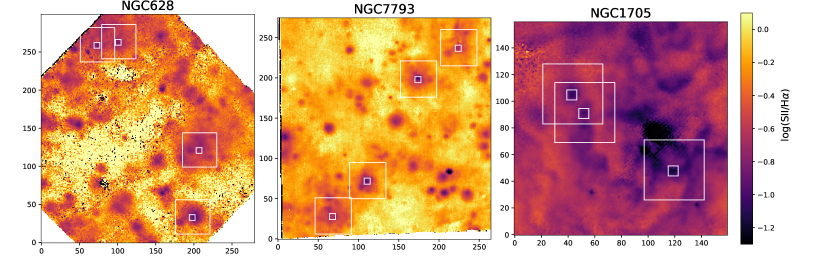
This dependence of line ratios on apertures can also be directly seen in the map of the line ratio, as shown in Fig. 6. We can only present the [SII]6717,31/H line ratio because [SIII]9531 is outside the MUSE wavelength range, and [SIII]9069 is too faint to be detected in individual spaxels outside the core of the H ii regions. The average value of this ratio is determined by the metallicity of the galaxy (e.g., Curti et al. 2020). Compared to the average value, this ratio has clear minima close to the center of the H ii regions, where SB(H) is maximum, with dimensions of a few arcsec, and shows a significant radial increase, even inside the region with large EW(H). This shows that the H ii regions are actually resolved in the galaxies at 3-10 Mpc of distances, and the ionizing structure in Fig. 1 can be observed.
These results show that the difference in low-ionization line fluxes between local H ii regions and galaxies outside the local group is dominated by aperture effects in the local sample. The outputs of the photoionization models should be better compared with the total spectra of H ii regions obtained with larger physical apertures.
Overall, the unresolved or partially-resolved spectra from SDSS and MaNGA seem to be dominated by H ii emission and do not show strong contribution from the DIG. For this reason high-redshift galaxies with high specific SFRs and low levels of DIG contamination are expected to have spectra more similar to SDSS and MaNGA rather than to the spectra of the over-resolved H ii regions. In fact, Sanders
et al. (2019) showed that the MOSDEF galaxies at have
[SII]6717,31/H and
[SIII]9069,9531/[SII]6717,31 line ratios
totally consistent with the local SDSS and MaNGA spectra. Finally, applying large DIG corrections based on the local H ii regions when using strong-line methods to compute metallicities may lead to biased results.
4 Summary
H ii regions in local galaxies show different properties from the total or kpc-scale spectra of star-forming galaxies when the flux ratios involving low-ionization emission lines are considered. This difference is often attributed to an increasing contribution of the DIG, absent in the local H ii regions but deeply affecting galaxy spectra when regions of a few kpc are sampled. We have studied if aperture effects in spectra of H ii regions in local galaxies can contribute to the differences.
We have selected a number of H ii regions in local galaxies for which MUSE IFU spectra are available. To obtain spectra of the whole H ii regions, we have used different apertures while avoiding spaxels showing significant contribution from the DIG. The spectra from small and large apertures show remarkable differences, especially in the [SII]6717,31 low ionization doublet. When using small, apertures, the line ratios are similar to what observed by long-slit surveys as CHAOS; when larger apertures are used, even if still inside the H ii regions, line ratios similar to what observed by MaNGA and SDSS are derived. This is due a radial gradient in [SII]6717,31/H inside the H ii regions.
The strong gradient of the [SII]6717,31/H ratio can also be directly seen in the maps of line ratio, exhibiting minima close to the peak of H emission and showing that seeing-limited observation of these galaxies can resolve the H ii regions.
These results show that the difference between spectra of local H ii regions and more distant galaxies is not due to contamination from the DIG but by the smaller angular size of the slit with respect to the projected size of the H ii regions. As a consequence, the similar spectra of local and distant galaxies implies that the DIG has a secondary effect on the total spectra of star-forming galaxies. Ongoing and future large IFU surveys of local galaxies with VLT/MUSE (e.g., PHANGS, Schinnerer et al. 2019) and SDSS-V (Kollmeier et al., 2019) are providing a large number of resolved spectra of H ii regions with high S/N ratio, large spectral coverage, and across a large rage of physical properties to better understand the radial and integrated emission of the H ii regions and their separation with the DIG.
Data Availability
The raw and reduced MUSE data underlying this article are available in the ESO archive services.
Acknowledgements
We thanks E. Wisnioski and K. Kreckel for sharing their data on HII sizes with us, and the anonymous referee for helping improving the manuscript. F.M., G.C., and A.M. acknowledge support from the INAF PRIN-SKA 2017 programme 1.05.01.88.04, and from PRIN MIUR project “Black Hole winds and the Baryon Life Cycle of Galaxies: the stone-guest at the galaxy evolution supper”, contract 2017PH3WAT. R.M. and M.C. acknowledges support by the Science and Technology Facilities Council (STFC) and ERC Advanced Grant 695671 "QUENCH".
References
- Abazajian et al. (2009) Abazajian K. N., et al., 2009, ApJS, 182, 543
- Aguado et al. (2019) Aguado D. S., et al., 2019, ApJS, 240, 23
- Anand et al. (2021) Anand G. S., et al., 2021, AJ, 162, 80
- Annibali et al. (2015) Annibali F., Tosi M., Pasquali A., Aloisi A., Mignoli M., Romano D., 2015, AJ, 150, 143
- Arsenault & Roy (1988) Arsenault R., Roy J. R., 1988, A&A, 201, 199
- Beaton et al. (2014) Beaton R. L., et al., 2014, The Astrophysical Journal, 790, 117
- Belfiore et al. (2016) Belfiore F., et al., 2016, MNRAS, 461, 3111
- Belfiore et al. (2019) Belfiore F., et al., 2019, AJ, 158, 160
- Berg et al. (2015) Berg D. A., Skillman E. D., Croxall K. V., Pogge R. W., Moustakas J., Johnson-Groh M., 2015, ApJ, 806, 16
- Berg et al. (2020) Berg D. A., Pogge R. W., Skillman E. D., Croxall K. V., Moustakas J., Rogers N. S. J., Sun J., 2020, ApJ, 893, 96
- Bradley et al. (2006) Bradley T. R., Knapen J. H., Beckman J. E., Folkes S. L., 2006, A&A, 459, L13
- Bundy et al. (2015) Bundy K., et al., 2015, ApJ, 798, 7
- Byler et al. (2019) Byler N., Dalcanton J. J., Conroy C., Johnson B. D., Choi J., Dotter A., Rosenfield P., 2019, AJ, 158, 2
- Choi et al. (2016) Choi J., Dotter A., Conroy C., Cantiello M., Paxton B., Johnson B. D., 2016, ApJ, 823, 102
- Collins & Rand (2001) Collins J. A., Rand R. J., 2001, ApJ, 551, 57
- Conroy et al. (2009) Conroy C., Gunn J. E., White M., 2009, ApJ, 699, 486
- Cosens et al. (2018) Cosens M., et al., 2018, ApJ, 869, 11
- Croxall et al. (2015) Croxall K. V., Pogge R. W., Berg D. A., Skillman E. D., Moustakas J., 2015, ApJ, 808, 42
- Croxall et al. (2016) Croxall K. V., Pogge R. W., Berg D. A., Skillman E. D., Moustakas J., 2016, ApJ, 830, 4
- Curti et al. (2020) Curti M., Mannucci F., Cresci G., Maiolino R., 2020, MNRAS, 491, 944
- Della Bruna et al. (2020) Della Bruna L., et al., 2020, A&A, 635, A134
- Dopita et al. (2014) Dopita M. A., Rich J., Vogt F. P. A., Kewley L. J., Ho I. T., Basurah H. M., Ali A., Amer M. A., 2014, Ap&SS, 350, 741
- Dotter (2016) Dotter A., 2016, ApJS, 222, 8
- Ferguson et al. (1996) Ferguson A. M. N., Wyse R. F. G., Gallagher J. S. I., Hunter D. A., 1996, AJ, 111, 2265
- Ferland et al. (2013) Ferland G. J., et al., 2013, Rev. Mex. Astron. Astrofis., 49, 137
- Ferreiro & Pastoriza (2004) Ferreiro D. L., Pastoriza M. G., 2004, A&A, 428, 837
- Giammanco et al. (2004) Giammanco C., Beckman J. E., Zurita A., Relaño M., 2004, A&A, 424, 877
- Haffner et al. (2009) Haffner L. M., et al., 2009, Reviews of Modern Physics, 81, 969
- Helmboldt et al. (2005) Helmboldt J. F., Walterbos R. A. M., Bothun G. D., O’Neil K., 2005, ApJ, 630, 824
- Hidalgo-Gámez (2005) Hidalgo-Gámez A. M., 2005, in Hidalgo-Gámez A. M., González J. J., Rodríguez Espinosa J. M., Torres-Peimbert S., eds, Revista Mexicana de Astronomia y Astrofisica Conference Series Vol. 24, Revista Mexicana de Astronomia y Astrofisica Conference Series. pp 288–293
- Hoopes & Walterbos (2003) Hoopes C. G., Walterbos R. A. M., 2003, ApJ, 586, 902
- Hoopes et al. (1996) Hoopes C. G., Walterbos R. A. M., Greenwalt B. E., 1996, AJ, 112, 1429
- Kauffmann et al. (2003) Kauffmann G., et al., 2003, MNRAS, 346, 1055
- Kennicutt (1984) Kennicutt R. C. J., 1984, ApJ, 287, 116
- Kewley et al. (2001) Kewley L. J., Heisler C. A., Dopita M. A., Lumsden S., 2001, ApJS, 132, 37
- Kewley et al. (2006) Kewley L. J., Groves B., Kauffmann G., Heckman T., 2006, MNRAS, 372, 961
- Kewley et al. (2019) Kewley L. J., Nicholls D. C., Sutherland R. S., 2019, ARA&A, 57, 511
- Kollmeier et al. (2019) Kollmeier J., et al., 2019, in Bulletin of the American Astronomical Society. p. 274
- Kreckel et al. (2019) Kreckel K., et al., 2019, ApJ, 887, 80
- Kumari et al. (2019) Kumari N., Maiolino R., Belfiore F., Curti M., 2019, MNRAS, 485, 367
- Lacerda et al. (2018) Lacerda E. A. D., et al., 2018, MNRAS, 474, 3727
- Law et al. (2021) Law D. R., et al., 2021, ApJ, 915, 35
- Levesque et al. (2010) Levesque E. M., Kewley L. J., Larson K. L., 2010, AJ, 139, 712
- Luridiana et al. (2015) Luridiana V., Morisset C., Shaw R. A., 2015, A&A, 573, A42
- Maiolino & Mannucci (2019) Maiolino R., Mannucci F., 2019, A&ARv, 27, 3
- Mannucci et al. (2010) Mannucci F., Cresci G., Maiolino R., Marconi A., Gnerucci A., 2010, MNRAS, 408, 2115
- Marasco et al. (2020) Marasco A., et al., 2020, A&A, 644, A15
- Mingozzi et al. (2020) Mingozzi M., et al., 2020, A&A, 636, A42
- Minter & Balser (1997) Minter A. H., Balser D. S., 1997, ApJ, 484, L133
- Oey et al. (2003) Oey M. S., Parker J. S., Mikles V. J., Zhang X., 2003, AJ, 126, 2317
- Oey et al. (2007) Oey M. S., et al., 2007, ApJ, 661, 801
- Peimbert et al. (2017) Peimbert M., Peimbert A., Delgado-Inglada G., 2017, PASP, 129, 082001
- Pellegrini et al. (2012) Pellegrini E. W., Oey M. S., Winkler P. F., Points S. D., Smith R. C., Jaskot A. E., Zastrow J., 2012, ApJ, 755, 40
- Pilyugin et al. (2012) Pilyugin L. S., Grebel E. K., Mattsson L., 2012, MNRAS, 424, 2316
- Pilyugin et al. (2014) Pilyugin L. S., Grebel E. K., Kniazev A. Y., 2014, AJ, 147, 131
- Rand (1998) Rand R. J., 1998, ApJ, 501, 137
- Reynolds (1984) Reynolds R. J., 1984, ApJ, 282, 191
- Rogers et al. (2021) Rogers N. S. J., Skillman E. D., Pogge R. W., Berg D. A., Moustakas J., Croxall K. V., Sun J., 2021, ApJ, 915, 21
- Rossa & Dettmar (2003) Rossa J., Dettmar R. J., 2003, A&A, 406, 493
- Rozas et al. (2006) Rozas M., Richer M. G., López J. A., Relaño M., Beckman J. E., 2006, A&A, 455, 539
- Sabbi et al. (2018) Sabbi E., et al., 2018, ApJS, 235, 23
- Sánchez et al. (2012) Sánchez S. F., et al., 2012, A&A, 538, A8
- Sanders et al. (2017) Sanders R. L., Shapley A. E., Zhang K., Yan R., 2017, ApJ, 850, 136
- Sanders et al. (2019) Sanders R. L., et al., 2019, arXiv e-prints, p. arXiv:1910.13594
- Schinnerer et al. (2019) Schinnerer E., et al., 2019, The Messenger, 177, 36
- Tremonti et al. (2004) Tremonti C. A., et al., 2004, ApJ, 613, 898
- Tüllmann & Dettmar (2000) Tüllmann R., Dettmar R. J., 2000, A&A, 362, 119
- Vale Asari et al. (2019) Vale Asari N., Couto G. S., Cid Fernandes R., Stasińska G., de Amorim A. L., Ruschel-Dutra D., Werle A., Florido T. Z., 2019, MNRAS, 489, 4721
- Voges & Walterbos (2006) Voges E. S., Walterbos R. A. M., 2006, ApJ, 644, L29
- Westfall et al. (2019) Westfall K. B., et al., 2019, AJ, 158, 231
- Wisnioski et al. (2012) Wisnioski E., Glazebrook K., Blake C., Poole G. B., Green A. W., Wyder T., Martin C., 2012, MNRAS, 422, 3339
- Xiao et al. (2018) Xiao L., Stanway E. R., Eldridge J. J., 2018, MNRAS, 477, 904
- Youngblood & Hunter (1999) Youngblood A. J., Hunter D. A., 1999, The Astrophysical Journal, 519, 55
- Zhang et al. (2017) Zhang K., et al., 2017, MNRAS, 466, 3217
- Zurita et al. (2000) Zurita A., Rozas M., Beckman J. E., 2000, A&A, 363, 9