Uncovering the Limits of Text-based Emotion Detection
Abstract
Identifying emotions from text is crucial for a variety of real world tasks. We consider the two largest now-available corpora for emotion classification: GoEmotions, with 58k messages labelled by readers, and Vent, with 33M writer-labelled messages. We design a benchmark and evaluate several feature spaces and learning algorithms, including two simple yet novel models on top of BERT that outperform previous strong baselines on GoEmotions. Through an experiment with human participants, we also analyze the differences between how writers express emotions and how readers perceive them. Our results suggest that emotions expressed by writers are harder to identify than emotions that readers perceive. We share a public web interface for researchers to explore our models.
1 Introduction
Identifying emotional signals is key to a series of downstream tasks. For instance, emotion detection is necessary for empathetic chat-bots that can respond to the emotional needs of their users Fung et al. (2018). Distinguishing emotional content is required to study viral Guerini and Staiano (2015), educational Ortigosa et al. (2014), political Mohammad et al. (2015), or incendiary Brassard-Gourdeau and Khoury (2019) interactions on social media. Capturing the evolution of user-provided emotional content can help prevent harassment Agrawal and Awekar (2018) or develop early indicators for depression Husseini Orabi et al. (2018); Ramírez-Cifuentes et al. (2020). Facial expressions Li and Deng (2020), speech El Ayadi et al. (2011), body movements Noroozi et al. (2018) and text Poria et al. (2019) are sources from which emotions may be automatically extracted.
Emotion analysis contrasts sentiment analysis, which characterizes text in terms of polarity (positive, negative or neutral), by involving a larger set of classes, often influenced by aspects such as ambiguity, misunderstandings, irony or sarcasm Mohammad (2021); Chauhan et al. (2020). Recent progress in the field has been enabled by the success of pre-trained language models, such as Bidirectional Encoder Representations from Transformers (BERT) Devlin et al. (2019), and the release of high-quality large-scale annotated datasets.
In this work, we analyze the limits of text-based emotion detection on the two largest now-available corpora: GoEmotions Demszky et al. (2020) and Vent Lykousas et al. (2019). GoEmotions contains 58k Reddit comments tagged with possibly multiple labels out 28 emotions, annotated by third-person readers. The raw Vent corpus Lykousas et al. (2019) includes 33M messages tagged with one out of 705 emotions by their original first-person writers. The unprecedented volume of these datasets makes them suitable to study textual emotion detection at scale from different perspectives.
We first focus on the predictive performance of several feature spaces and learning algorithms. Our benchmark includes simple models that outperform previous baselines, including a strong BERT baseline on GoEmotions. We find that statistical methods such as TF-IDF outperform more complex word-level embeddings such as FastText. Finally, we release a web interface showcasing our models.
Second, we analyze the hierarchical structure of the label space for models trained on Vent. Our models capture the cluster structure defined by emotion categories to a large extent, despite not explicitly observing emotion categories during training.
Finally, we design an experiment with human participants to evaluate our model and the differences between emotions provided by writers and those perceived by participants (readers). Our models outperform readers at predicting emotions intended by writers, and they also predict the emotions annotated by readers even more accurately, with important implications for emotion analysis.
2 Related Work
We discuss three domains of related work: the existing taxonomies to represent emotions, the corpora used to build and evaluate emotion detection systems, and the NLP approaches that may be used to implement text-based emotion detection systems.
2.1 Emotion Taxonomies
The landscape of human emotion has been represented by several different taxonomies and approaches. Ekman Ekman and Friesen (1971) proposed 6 basic emotions expressed through facial expressions across cultures: joy, sadness, anger, surprise, disgust and fear. Independently, Plutchik Plutchik (1980) introduced a similar taxonomy that added anticipation and trust, characterizing emotions through his Wheel of Emotion Plutchik (1980).Finer-grained emotion taxonomies have been recently proposed, capturing high-dimensional relationships of up to 600 different emotions, clustering emotion concepts using machine learning techniques Cowen et al. (2019). These taxonomies show the multifaceted nature of emotions across cultures in vocalization Cowen et al. (2018), music Cowen et al. (2020), or facial expressions Cowen and Keltner (2019). Beyond these discrete categorizations, other models such as the affective-circumplex model of emotions Russell (2003), have captured emotions as proportions on three dimensions rather than discrete categories: Valence (positive or negative), Activation (active or passive), and Dominance (dominant or submissive). Finally, a small number of works extend these taxonomies to include the perspective of senders and receivers of emotional communication Ptaszynski et al. (2009); Mohammad and Turney (2013); Buechel and Hahn (2017b, a).
In this work, we focus on categorical approaches with recent emotional taxonomies covering a rich spectrum of emotions from the perspectives of senders and receivers.
2.2 Emotion Detection Text Corpora
To build Emotion Detection systems, practitioners require text data containing emotional signals. Early works like SentiStrength Thelwall et al. (2010) and ANEW Nielsen (2011) used lexical associations for sentiment analysis, capturing whether text was positive, negative or neutral and to which degree. Lexical approaches can be used in rule-based systems, where words contribute to a sentiment or emotion signal. Sophisticated rule-based models like VADER Hutto and Gilbert (2014) rely on human-annotated word sentiments, alongside with slang, modifiers, emphasis or punctuation. Other approaches went beyond polarity: LIWC Tausczik and Pennebaker (2010) presented labelled dictionaries mapping words to their emotional and polarity probabilities. Likewise, EmoLex Mohammad et al. (2013) crowd-sourced a word-emotion association lexicon labelling words in terms of sentiment and emotion following Plutchik’s taxonomy.
Another approach is to treat emotion detection as a supervised learning problem, with corpora including emotional information varying in size, scope and labelling approach Bostan and Klinger (2018). Early datasets such as Affective Text Strapparava and Mihalcea (2007) were small, with 1,250 headlines labelled for valence and Ekman’s emotions. To reduce data acquisition efforts, some works have explored corpora mined from emotion-rich environments such as social networks. For instance, Crowdflower’s emotion dataset Crowdflower (2016) labelled 40K tweets expanding Ekman’s emotions with enthusiasm, fun, hate, neutral, love, boredom, relief and empty. Similarly, EmoNet Abdul-Mageed and Ungar (2017) applied distant supervision by labelling tweets using hashtags among the ‘circles’ within Plutchik’s Wheel. Finally, in parallel to our work, Malko et al. (2021) used Vent data on a limited number of emotion categories overlapping with Ekman’s emotions, and concluded that the self-annotated labels of Vent are indicative of emotional contents expressed in the text, supporting more detailed analyses of emotion expression.
If emotion detection is treated as a learning problem, datasets present a trade-off between size and quality. Human-annotated datasets span thousands of samples, often targeting a small number of emotions, such as SocialNLP 2019 EmotionX challenge or Crowdflower Strapparava and Mihalcea (2007); Crowdflower (2016); Shmueli and Ku (2019). Approaches like EmoNet Abdul-Mageed and Ungar (2017) can comprise millions of samples collected from social media using distantly supervised labels, allowing for larger datasets at the time of publication. However, datasets collected from social media may be private, with direct dataset sharing often being forbidden, and content routinely getting deleted, limiting reproducibility. Additionally, labels produced by distant supervision using hashtags might not align with how humans generally perceive or express emotions across domains.
2.3 NLP Emotion Detection Models
Approaches to Emotion Detection are often constrained by the difficulties of extracting emotional signals from small collections of labelled data Alswaidan and Menai (2020); Acheampong et al. (2020), using both feature-engineered and neural models. Some feature-based models introduce emotional priors by using word-emotion associations as features for supervised classifiers Mohammad et al. (2013). Other approaches employ statistical methods such Bag-of-Words to represent documents, placing the effort of learning emotional associations on the model Silva et al. (2014).
Recently, larger datasets have allowed to train neural models that outperform their traditional counterparts. For instance, EmoNet involved collecting a 1.6M tweet dataset, and training RNN-based models on the same data Abdul-Mageed and Ungar (2017). After the release of BERT Devlin et al. (2019), an explosion of novel work has focused on fine-tuning transformer models to learn from scarce emotion data. For example, the top performing models on the SocialNLP 2019 EmotionX Challenge Shmueli and Ku (2019) outperform the best previous existing model by a 19% increase in micro-F1. In this direction, GoEmotions introduced a fine-tuned BERT multi-label classifier baseline with 46% macro-F1 across 28 possible labels Demszky et al. (2020). Modelling choices have often depended on the availability of data: rule-based Hutto and Gilbert (2014); Tausczik and Pennebaker (2010) and lexical approaches Mohammad et al. (2013) when training data was too sparse for ML-based solutions, non-neural methods as datasets scaled Silva et al. (2014) and, more recently, pre-trained neural models and transformer architectures. The outstanding results of fine-tuned transformers have driven a majority of recent work, including the SocialNLP 2019 EmotionX challenge Shmueli and Ku (2019), GoEmotions Demszky et al. (2020), and emotion detection and sentiment analysis benchmarks Acheampong et al. (2021).
We explore simple Transformer-based baselines on this common ground, in which we use BERT as a representation layer and include lightweight models on top of the contextualized embeddings, outperforming previous BERT baselines on micro-F1 by 11.8%. However, we also study non-neural and non-Transformer methods that remain popular in industry. Our contribution covers different approaches on large scale emotion datasets with rich label spaces and 58K / 9.75M sample texts. Rather than narrowly benchmarking variations of specific architectures, e.g., fine-tuning transformer language models, we work with a variety of established methods to help practitioners choose a modelling approach in terms of predictive performance and model complexity.
3 Emotion Detection in Text
A text snippet can have several associated emotions in cases of ambiguity, or when expressing multiple feelings at once, as seen in Table 1. As such, we represent the problem as multiple valid labels being possible for a given snippet.
| Text | Emotion | ||||
|---|---|---|---|---|---|
|
Surprise | ||||
|
Confusion | ||||
|
|
3.1 Task Definition
We formulate emotion detection as a multi-label classification task. Given an input text and a set of emotions, our task is to produce (learn) a function that maps into independent probabilities for each emotions . Treating emotion detection as a multi-label task allows us to apply the same architecture on multi-class datasets. It also allows us to account for ambiguity, even in datasets where only a single output class is expected, such as Vent.
4 Experimental Design
Here we briefly describe the GoEmotions and Vent datasets, our multi-label classification benchmark design, and the representation and modelling approaches that serve as the building blocks for our emotion detectors. We include extensive details on the experimental design, hyper-parameters, additional results, and data analyzes in the Supplemental Materials.
4.1 GoEmotions
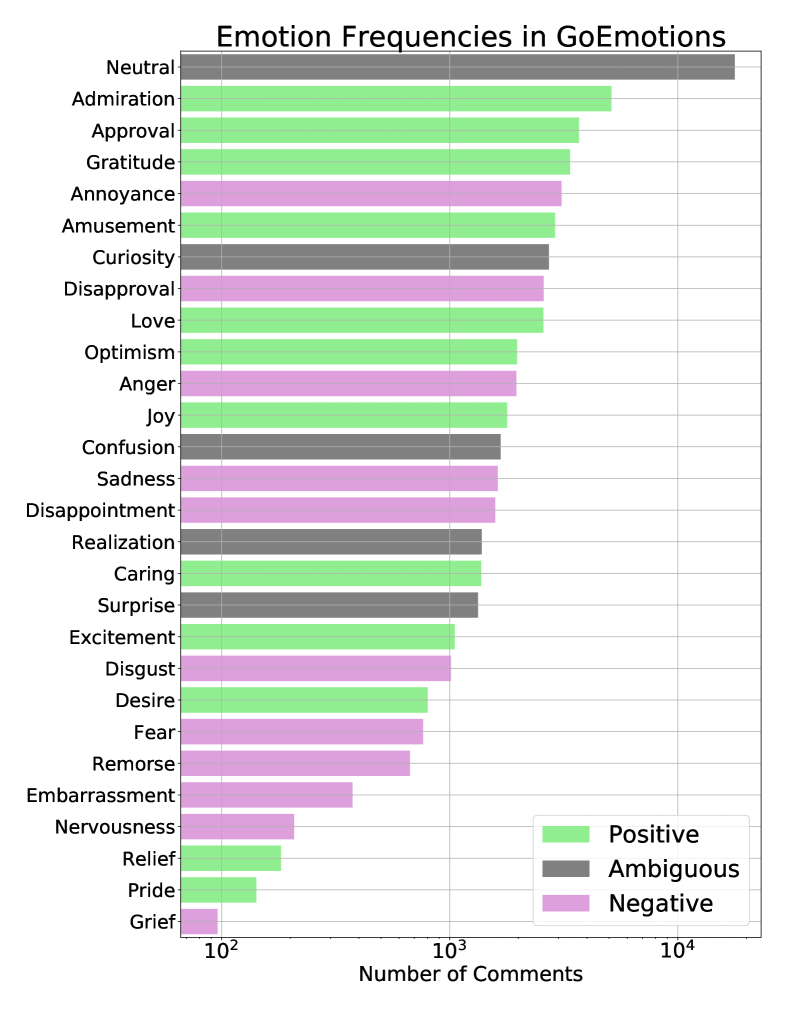
The GoEmotions dataset Demszky et al. (2020) contains 58,009 text snippets collected from English Reddit comments. A minimum of 3 raters labelled each snippet into multiple emotions from 27 emotion categories plus a neutral category, keeping only snippets where 2+ raters agree on one or more labels. Figure 1 shows the frequencies and types of each emotion in the dataset. Raters were asked to label comments as “Neutral” when they were not able to clearly assign an emotion to a comment. The dataset is accompanied with a strong baseline fine-tuned BERT classifier built on top of BERT-base Devlin et al. (2019) that predicts the 28 emotions from the contextualized embedding of the last token, achieving 0.46 macro-F1 and 0.51 micro-F1 scores.
4.2 Vent
The Vent dataset Lykousas et al. (2019) contains more than M comments from a social network and its accompanied mobile app, predominantly in English. Each comment or “vent” is self-annotated by the author, which we will refer to as “venter”, according to their emotional state. Emotions are structured into 63 emotion categories covering 704 emotions.
In contrast to GoEmotions where comments are labelled with “reader” emotions that annotators infer from text, Vent is a “writer” emotion dataset—every Vent comment is labelled with one subjective emotional label provided by its writer. The dataset is provided as-is, with minimal pre-processing anonymising user and URL references. To normalize the corpus, we (a) remove stylistic highlighting such as italics, (b) eliminate extraneous white space, and (c) map user and URL references to special fixed tokens. Since the length of Vents is heterogeneous, we limit comment length to the range between 3 and 32 tokens (75-th percentile). We restrict ourselves to categories that contain at least one valid emotion, and ignore emotions marked as disabled, not used at least once per month, or whose meaning is ambiguous, e.g., those containing emoji like “Mushy”. The filtered data contains 9.75M comments in 88 emotions that are grouped into 9 categories.
4.3 Multi-Label Benchmark Design
We design a common architecture that lets us train, evaluate, and optionally transfer our models, and only use methods that may be applied in a streaming mini-batch fashion. Our approach is composed of three components, shown as sequential steps in Figure 2.
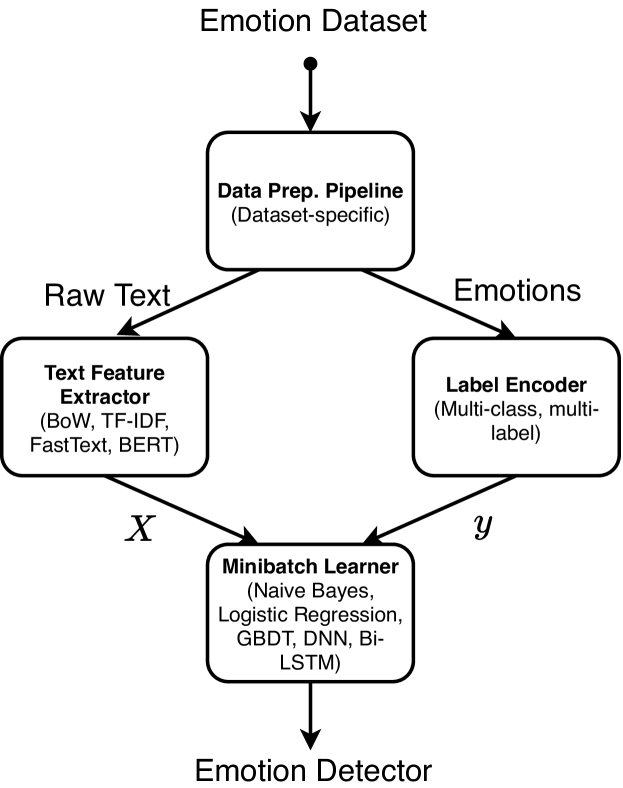
We implement two statistical and two embedding representation approaches, combined with five different learning algorithms. For statistical representations we use Bag-of-Words and TF-IDF, training Naive Bayes, Logistic Regression, and Incremental Random Forests models. For neural-LM representations, we only evaluate pre-trained English models, exploring word-level representations with FastText and contextualized representations using BERT with fine-tuning.
As models for neural-LM representations, we design two simple neural architectures that receive embedding sequences as input and pool over output units to produce their outputs, as shown in Figure 3. We implement a multi-label classification objective, minimising the average binary cross-entropy loss over target emotions.
-
1.
(Pooled) Deep Neural Network. We apply a DNN over every embedded token independently in parallel.
-
2.
(Bi)-LSTM. We apply stacked (Bi)-LSTMs consuming the embedded sequence in a sequence to sequence manner.


5 Experimental Results
In this section, we study the results of our benchmark, evaluate the behaviour of the trained models, and analyze the differences between writer and reader emotions on Vent.
5.1 Emotion Benchmark Evaluation
First, we evaluate the emotion detection methods that we introduced in subsection 4.3. We focus on four multi-label classification metrics: Macro F1, micro F1, and micro-averaged Precision and Recall. We use the original splits from the GoEmotion datasets, while we split Vent in 80 / 10 / 10 splits ordered by publication time for training, validation and testing. Our analysis is described on a per-dataset basis, with Table 2 and Table 3 containing the results for GoEmotions and Vent respectively, showing the best performing models in bold.
| Repr. | Model | M-F1 | m-F1 | Pre | Rec |
|---|---|---|---|---|---|
| BoW | N. Bayes | 0.34 | 0.46 | 0.43 | 0.52 |
| Log. Reg. | 0.45 | 0.53 | 0.48 | 0.61 | |
| R. Forest | 0.45 | 0.52 | 0.50 | 0.59 | |
| TF-IDF | N. Bayes | 0.33 | 0.44 | 0.43 | 0.49 |
| Log. Reg. | 0.47 | 0.53 | 0.49 | 0.60 | |
| R. Forest | 0.45 | 0.52 | 0.48 | 0.60 | |
| FT | DNN Pool | 0.42 | 0.49 | 0.45 | 0.61 |
| Bi-LSTM | 0.44 | 0.54 | 0.51 | 0.58 | |
| BERT | Baseline* | 0.46 | 0.51 | — | — |
| DNN Pool | 0.48 | 0.55 | 0.52 | 0.61 | |
| Bi-LSTM | 0.47 | 0.57 | 0.53 | 0.62 |
*Results as reported by Demszky et al. (2020)
| Repr. | Model | M-F1 | m-F1 | Pre | Rec |
|---|---|---|---|---|---|
| — | Random | 0.02 | 0.04 | 0.02 | 0.69 |
| BoW | N. Bayes | 0.13 | 0.15 | 0.12 | 0.23 |
| Log. Reg. | 0.13 | 0.15 | 0.12 | 0.20 | |
| R. Forest | 0.11 | 0.13 | 0.12 | 0.18 | |
| TF-IDF | N. Bayes | 0.14 | 0.16 | 0.13 | 0.21 |
| Log. Reg. | 0.14 | 0.16 | 0.14 | 0.21 | |
| R. Forest | 0.11 | 0.13 | 0.12 | 0.19 | |
| FT | DNN Pool | 0.08 | 0.10 | 0.08 | 0.30 |
| Bi-LSTM | 0.08 | 0.11 | 0.08 | 0.21 | |
| BERT | DNN Pool | 0.17 | 0.19 | 0.16 | 0.24 |
| Bi-LSTM | 0.19 | 0.21 | 0.19 | 0.26 |
BERT representations outperform every other configuration in both datasets. Furthermore, our results show that Logistic Regressions outperform Naive Bayes and Incremental Random Forests on configurations using Bag-of-Words or TF-IDF. On GoEmotions, our highest micro-F1 score is 0.57, while on Vent the highest micro-F1 score is 0.21.
Our results on GoEmotions outperform the previous strong baseline using BERT, increasing macro-F1 from 0.46 to 0.47 and micro-F1 from 0.51 to 0.57. The positive results indicate that our design approach for the benchmark was appropriate to achieve a robust comparison between neural and non-neural methods.
A possible explanation for the performance gains in our models over the baseline Demszky et al. (2020) is that our approach pools over each token in the input while the baseline uses the contextualized embedding of the last token in the sentence for its prediction. We observe a modest improvement from statistical methods over the baseline, which might be due to emotional information being largely encoded at the word level.
On Vent, we find that the BERT model with pooled Bi-LSTM layers significantly outperform other methods. In comparison with GoEmotions, non-BERT models perform significantly worse than BERT-based models. A possible explanation for this is the noisy nature of venter-annotated text from social media posts, whose chosen emotions might at times be arbitrary, and the increased ambiguity from the 88 emotion labels in Vent compared to the 28 targets in GoEmotions. When we vary the fraction of the whole training set used for training, we find that statistical models perform closer to BERT when there is a reduced amount of data. A possible explanation for this behaviour might be due to our design approach, namely, by the introduction of layers on top of BERT that slow down convergence, as shown in Figure 3.
To our surprise, we find that FastText consistently underperforms in comparison to statistical models. In particular, the TF-IDF logistic regression model significantly outperforms FastText on Vent. Furthermore, TF-IDF models using logistic regressions or random forests show similar performance to the FastText model using pooled Bi-LSTMs on GoEmotions despite the relative simplicity of the models. A possible explanation for the the observed difference in performance between Vent and GoEmotions might be that pretrained FastText models are unable to represent slang, typos and platform-specific vocabulary from Vent despite their underlying -gram model.
5.2 Hierarchy of Emotions in Vent
The Vent dataset includes a single emotion provided by the writer, in contrast to other datasets, e.g., GoEmotions, that provide readers annotations. However, our multi-label approach produces probabilities for each emotion given a text message. This allows us to analyze the complex structure of emotions represented by our model from Vent.
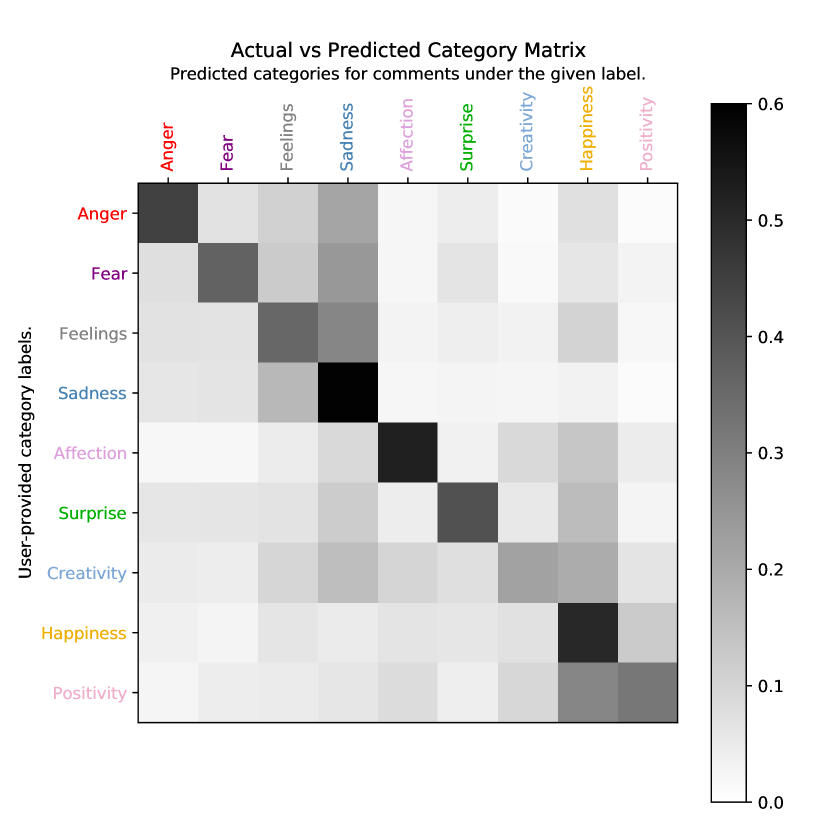


Instead of analysing pairwise correlations between emotions as is typically done, we build a (normalized) confusion matrix , where is the proportion of observing predicted emotion when a vent message is labelled with the -th emotion. The resulting confusion matrix at the category level is shown in Figure 4 (see Supplementary Materials for the confusion matrix at the emotion level). We observe that negative categories (Anger, Fear, Feelings, and Sadness) and positive categories (Affection, Surprise, Creativity, Happiness, and Positivity) are more often ‘confused’ within each group than they are across both groups.
Each row in matrix represents an emotion activation pattern in the target space. We perform agglomerative clustering to discover the hierarchical structure of such space. Figure 5 shows the obtained dendrogram using the Euclidean distance between each pair of rows in as linkage metric. We show dendrograms at the emotion and category levels, max-pooling the activation patterns across emotion categories.
We observe that clusters of emotions generally align with emotion categories, despite category labels not being used during training. Top levels of the hierarchy clearly split positive and negative categories, while subsequent levels provide a sensible hierarchy of emotion clusters at different scales. At the emotion level, we find cases where clusters contain emotions belonging to different categories, but which appear to be semantically meaningful, e.g., the clusters formed by Jealous, Insecure, Disappointed, and Upset, or the cluster formed by Sleepy, Exhausted, and Tired in Figure 5.
5.3 Experimental Evaluation
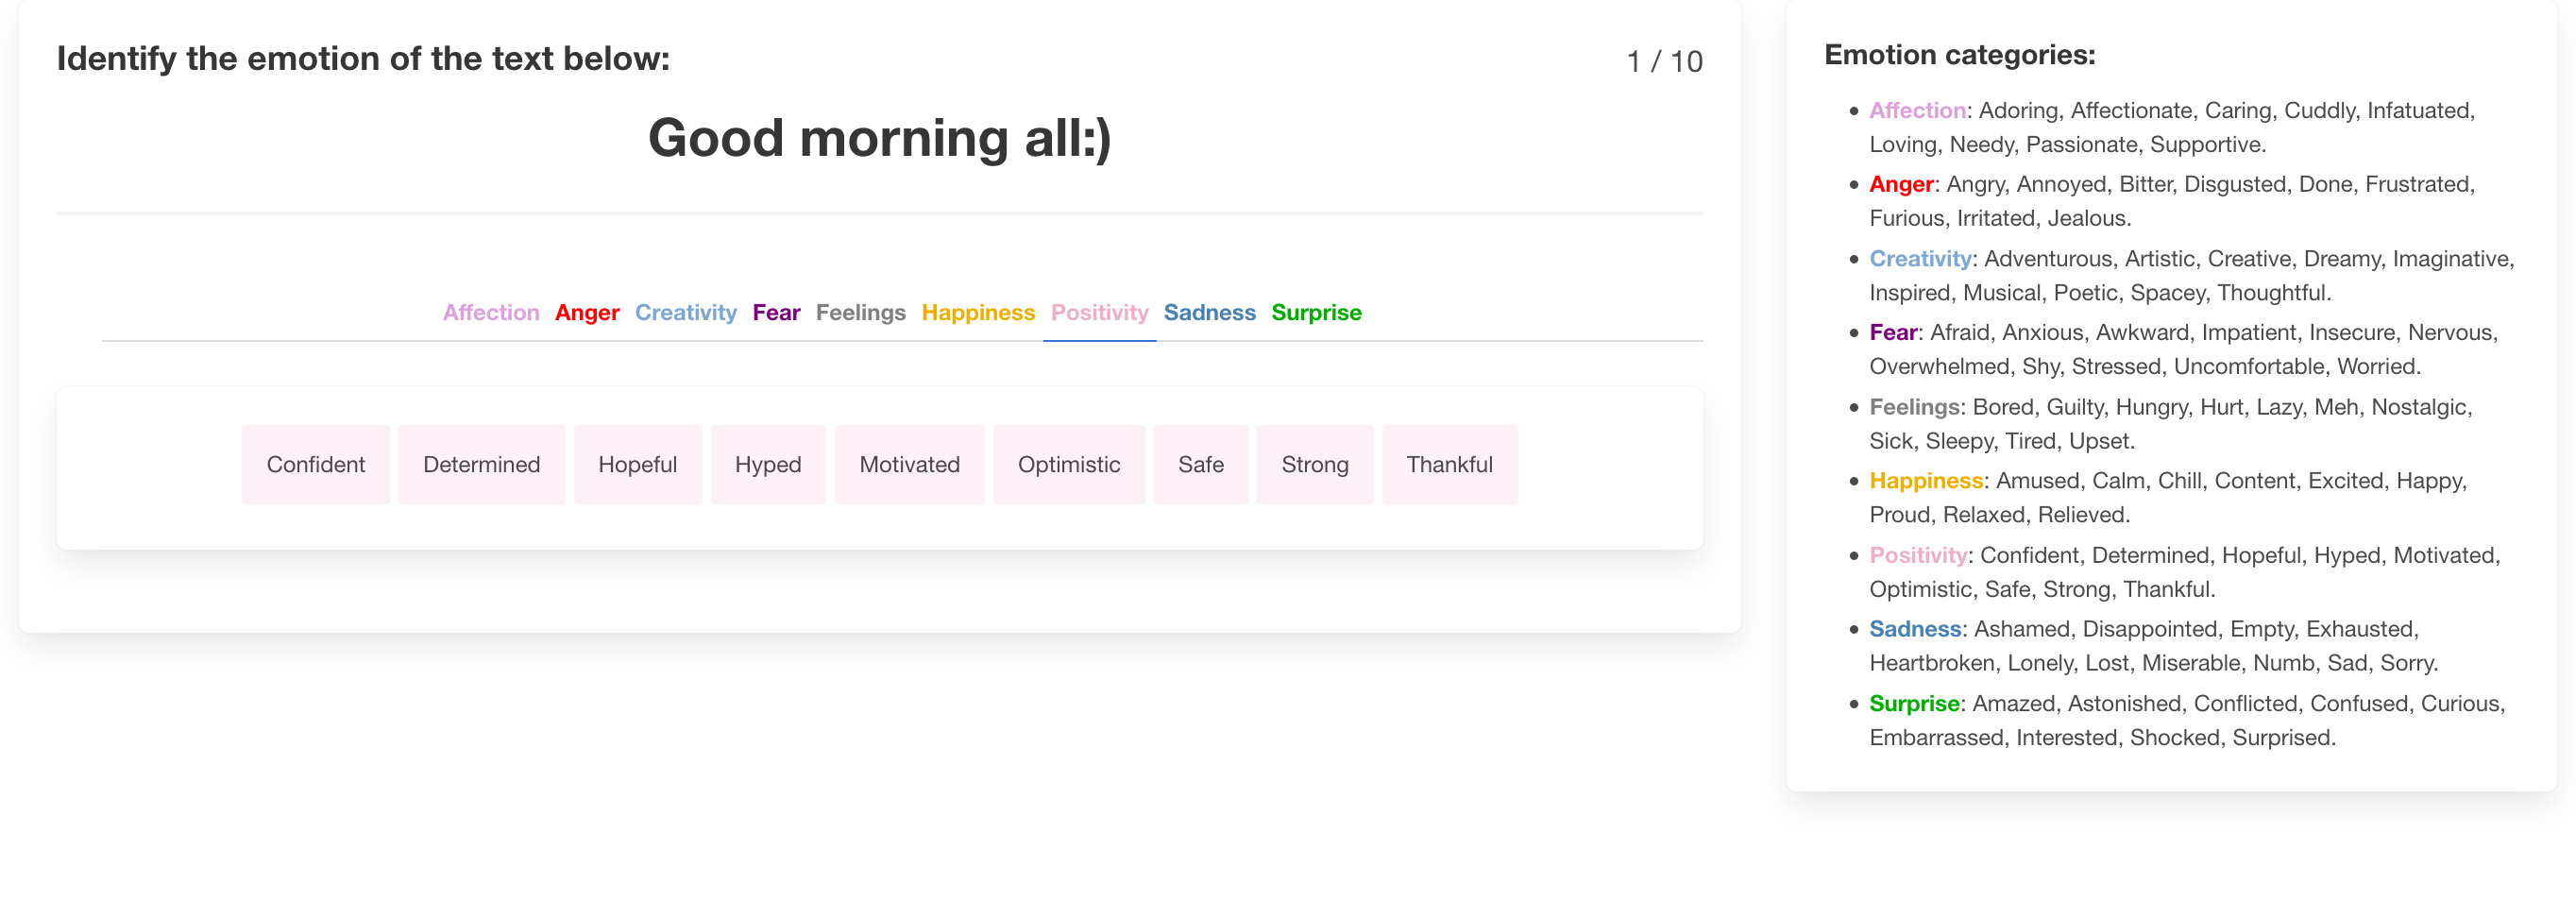
We design a HIT task using Amazon’s Mechanical Turk (MTurk) to evaluate the model and the differences between reader and writer emotions.
5.3.1 HIT Design
We sample 30 Vent comments at random from the test split for each of the 88 emotions, building a dataset of 2,640 comments. We normalize snippets in the same manner as described in section 4. Additionally, we exclude comments that contain either vent or nsfw (Not Safe For Work) terms to reduce the amount of self-referential or inappropriate content readers are exposed to. Comments are grouped in HITs of 10 comments, with 5 different readers assigned to each HIT, subject to an approval process to ensure quality annotations. We submit 264 HITs and receive work from 84 different readers with an average emotion accuracy of 11.43% and an average category accuracy of 34.26%.
Based on reader annotations, we analyse inter-annotator agreement and find that on average 1.81 ( 0.88) readers out of the assigned 5 agree with the most frequently assigned emotion. At the category level, we find that 2.95 ( 1.03) readers agree on average with the most frequent label. We find that the majority of readers can agree upon an emotion category, while generally not agreeing upon specific emotions within a category. We provide additional details on the inter-annotator agreement of readers in Section E.4.2.
The model outperforms human annotators (readers) on the subset of snippets submitted for labelling at the category level–0.395 vs 0.383 micro-F1, respectively. Readers show higher recall (0.725 vs 0.472) but lower precision (0.261 vs 0.356). This is expected, as we do not perform additional post-processing, i.e., filtering to select the majority label, to the readers’ annotations.
The Vent dataset is collected from a social network with unknown user demographics, so emotion labels provided by writers might be noisy and/or biased. Therefore, we use reader annotations to study the appropriateness of Vent for learning emotions at scale.
To do so, we invert the task: we predict the annotations provided by readers, using the model trained on Vent. We seek to measure the overlap between the model, readers, and writers, evaluating whether the model aligns with what readers expect more than the original Vent labels (i.e. writers).
| Task | Label | Predictor | M-F1 | m-F1 |
|---|---|---|---|---|
| Emotion | Writer | Reader | 0.151 | 0.151 |
| Model | 0.181 | 0.181 | ||
| Reader | Model | 0.241 | 0.246 | |
| Writer | 0.151 | 0.136 | ||
| Category | Writer | Reader | 0.383 | 0.383 |
| Model | 0.395 | 0.395 | ||
| Reader | Model | 0.467 | 0.471 | |
| Writer | 0.383 | 0.382 |
Table 4 shows emotion and category level macro- and micro-F1 scores for the model, readers, and writers. The model outperforms readers on the writer prediction task–that is, when the labels are given by writers and the predictors are either our model or readers–by 19.9% and 3.1% at the emotion and category levels in terms of relative micro-F1 (0.181 vs. 0.151 and 0.395 vs. 0.383 respectively). Surprisingly, the model is also capable of predicting the ambiguous emotional labels from readers for the same texts, despite not being explicitly trained on the task. Specifically, the model achieves 35.9% higher micro-F1 when evaluated against readers rather than writers at the emotion level (0.246 vs. 0.181), and 19.2% at the category level (0.471 vs. 0.395). As a control experiment, we also compare with writer-provided emotions as a predictor of worker-provided emotions. We observe a micro-F1 gap which may be caused by non-uniform biases from readers towards certain emotions, which impact per-emotion support††Differences between readers and writers depend on the support (# examples per target label) when micro-averaging, as values for precision/recall swap at the label level..
Our findings show that models trained on large amounts of writer-provided emotional labels from Vent are capable of capturing emotions perceived by readers. Our model achieves better performance when measured against readers rather than writers in terms of micro-F1, which aligns with existing literature on perspective-based emotion detection. For instance, previous work Buechel and Hahn (2017a) found readers’ perspectives to be superior than writers’ in terms of inter-annotator agreement on the VAD emotion model. These findings may explain the predictable nature of worker annotations, and the lower performances we observe when evaluating on writer-provided emotions. Our results are the first to consider both author and reader perspectives on categorical taxonomies in large English corpora collected from social media, which to our knowledge had not been studied in the emotion detection literature.
6 Conclusions
We present a principled analysis of emotion detection techniques on the two largest available datasets to date: GoEmotions and Vent. Our thorough benchmark shows how different models behave, with BERT-based architectures consistently achieving the best performance across datasets. We release EmotionUI, a web interface for researchers to explore our models†† http://emotionui.nur.systems/†† https://github.com/nur-ag/emotion-ui/, and share our code, tools, annotations and experiment data†† https://github.com/nur-ag/emotion-classification/.
On GoEmotions, our best performing model shows an improvement over the previous baseline by 11.8% relative micro-F1. On Vent, we train a model that outperforms readers at predicting emotions provided by writers by 19.9% relative micro-F1. Surprisingly, the same model shows better performance when evaluated against emotional labels provided by readers by 35.9% relative micro-F1 despite not being trained on this task. Our findings show that models trained on Vent outperform readers in the task of predicting writer-provided emotions, even though the model performs better on reader-provided emotions rather than the original ground truth labels provided by Vent users (writers). These findings open new research directions on the automatic detection of emotions between readers and writers in discrete emotion taxonomies, and its implications for emotion detection systems. Our work suggests that the task of predicting the emotions that writers aim to express is harder than detecting those perceived by readers. However, the majority of current annotated emotion detection studies focus on reader emotions.
7 Acknowledgements
The project leading to these results has also received funding from “La Caixa” Foundation (ID 100010434), under the agreement LCF/PR/PR16 /51110009. Nurudin’s research is partially funded by project 2018DI047 of the Catalan Industrial Doctorates Plan. Vicenç Gómez is supported by the Ramon y Cajal program RYC-2015-18878 (AEI/MINEICO/FSE,UE). Andreas Kaltenbrunner acknowledges support from Intesa Sanpaolo Innovation Center. The funder had no role in study design, data collection and analysis, decision to publish, or preparation of the manuscript.
8 Data Biases and Ethical Considerations
We present mechanisms to extract emotion information using text data from two social networks: Reddit and Vent. We believe that the user-generated nature of the data limits the generality of our results. For instance, it is understood that young adult males are over represented in the user base of Reddit Center (2016). For Vent, no demographics data is available, which should further warrant caution on the part of researchers and practitioners building upon our work. Although there is evidence for language use differences across genders, age-groups and personality traits Schwartz et al. (2013), data mined from social settings might amplify spurious relationships and lead to incomplete and biased accounts of such differences.
As emotional aspects of language are neither objective nor universal, we expect annotation biases in the target labels. In the case of GoEmotions, each Reddit comment was annotated by either 3 or 5 human judges given a list of 27 emotion definitions. However, the judges all share the same location, despite known cultural differences in the expression and understanding of emotions Scollon et al. (2004); Jackson et al. (2019). As such, the labels might not generalise across different cultures even when the language–English–is the same. In the case of Vent, emotions are provided by each person according to their own emotional state within a cultural group (the Vent community). In this sense, the usage patterns of may have shaped variation in how writers in Vent conceptualize emotions.
There are privacy and discrimination considerations on both data and models. The GoEmotions dataset is anonymised to ensure that the identity of the commenting users is kept safe. On Vent, user identifiers and hyperlinks in comments are masked to prevent user linking. However, due to the size of the dataset, it is possible that other personal details such as real names are contained in the complete text dumps. As such, the authors of Lykousas et al. (2019) provide the dataset on a private at-request basis. Large language models retrained on either dataset, and particularly those trained on Vent, might end up encoding personal information in a way that can later be extracted Carlini et al. (2020). However, we believe that in the context our work, the risk is reduced as we do not fine-tune the underlying language model in a generative task that would promote BERT to memorise parts of Vent.
A broader risk of our work is the potential emotion detection models to amplify and produce abuse. In recent years, generative methods to produce comments for news articles have been published at large academic venues Yang et al. (2019), raising concerns of their potential to shape public perception or augment the reach of fake news stories. We believe that emotion detection systems may be used to further enhance comment generation models, allowing their designers to adversarially craft content aiming shape the emotional perceptions of readers. Models trained on a large-scale dataset such as Vent might be used to condition generated comments so that they foster a desired kind of emotional discourse, positive or negative. Because of this, we will provide our models on request to interested researchers rather than making them fully available upon publication to limit their usage by unknown third parties.
References
- Abdul-Mageed and Ungar (2017) Muhammad Abdul-Mageed and Lyle Ungar. 2017. EmoNet: Fine-grained emotion detection with gated recurrent neural networks. In 55th Annual Meeting of the Association for Computational Linguistics.
- Acheampong et al. (2021) Francisca A Acheampong, Henry Nunoo-Mensah, and Wenyu Chen. 2021. Transformer models for text-based emotion detection: a review of bert-based approaches. Artificial Intelligence Review, pages 1–41.
- Acheampong et al. (2020) Francisca Adoma Acheampong, Chen Wenyu, and Henry Nunoo-Mensah. 2020. Text-based emotion detection: Advances, challenges, and opportunities. Engineering Reports, 2(7):e12189.
- Agrawal and Awekar (2018) Sweta Agrawal and Amit Awekar. 2018. Deep learning for detecting cyberbullying across multiple social media platforms. In Advances in Information Retrieval, pages 141–153. Springer International Publishing.
- Alswaidan and Menai (2020) Nourah Alswaidan and Mohamed Menai. 2020. A survey of state-of-the-art approaches for emotion recognition in text. Knowledge and Information Systems, 62.
- Bojanowski et al. (2017) Piotr Bojanowski, Edouard Grave, Armand Joulin, and Tomas Mikolov. 2017. Enriching word vectors with subword information. Transactions of the Association for Computational Linguistics, 5:135–146.
- Bostan and Klinger (2018) Laura-Ana-Maria Bostan and Roman Klinger. 2018. An analysis of annotated corpora for emotion classification in text. In 27th International Conference on Computational Linguistics.
- Brassard-Gourdeau and Khoury (2019) Eloi Brassard-Gourdeau and Richard Khoury. 2019. Subversive toxicity detection using sentiment information. In Third Workshop on Abusive Language Online.
- Buechel and Hahn (2017a) Sven Buechel and Udo Hahn. 2017a. EmoBank: Studying the impact of annotation perspective and representation format on dimensional emotion analysis. In 15th Conference of the European Chapter of the Association for Computational Linguistics.
- Buechel and Hahn (2017b) Sven Buechel and Udo Hahn. 2017b. Readers vs. writers vs. texts: Coping with different perspectives of text understanding in emotion annotation. In 11th Linguistic Annotation Workshop, pages 1–12.
- Carlini et al. (2020) Nicholas Carlini, Florian Tramèr, Eric Wallace, Matthew Jagielski, Ariel Herbert-Voss, Katherine Lee, Adam Roberts, Tom B. Brown, Dawn Song, Úlfar Erlingsson, Alina Oprea, and Colin Raffel. 2020. Extracting training data from large language models. CoRR, abs/2012.07805.
- Center (2016) Pew Research Center. 2016. Nearly eight-in-ten Reddit users get news on the site.
- Chauhan et al. (2020) Dushyant Singh Chauhan, Dhanush S R, Asif Ekbal, and Pushpak Bhattacharyya. 2020. Sentiment and emotion help sarcasm? A multi-task learning framework for multi-modal sarcasm, sentiment and emotion analysis. In Proceedings of the 58th Annual Meeting of the Association for Computational Linguistics, pages 4351–4360, Online. Association for Computational Linguistics.
- Cowen et al. (2018) Alan Cowen, Hillary Elfenbein, Petri Laukka, and Dacher Keltner. 2018. Mapping 24 emotions conveyed by brief human vocalization. American Psychologist.
- Cowen and Keltner (2019) Alan Cowen and Dacher Keltner. 2019. What the face displays: Mapping 28 emotions conveyed by naturalistic expression. American Psychologist, 75.
- Cowen et al. (2019) Alan Cowen, Disa Sauter, Jessica L. Tracy, and Dacher Keltner. 2019. Mapping the passions: Toward a high-dimensional taxonomy of emotional experience and expression. Psychological Science in the Public Interest, 20(1):69–90.
- Cowen et al. (2020) Alan S. Cowen, Xia Fang, Disa Sauter, and Dacher Keltner. 2020. What music makes us feel: At least 13 dimensions organize subjective experiences associated with music across different cultures. Proceedings of the National Academy of Sciences, 117(4):1924–1934.
- Crowdflower (2016) Crowdflower. 2016. The emotion in text. https://www.figure-eight.com/data/sentiment-analysis-emotion-text/.
- Danescu-Niculescu-Mizil et al. (2013) Cristian Danescu-Niculescu-Mizil, Robert West, Dan Jurafsky, Jure Leskovec, and Christopher Potts. 2013. No country for old members: User lifecycle and linguistic change in online communities. In Proceedings of the 22nd International Conference on World Wide Web, WWW ’13, page 307–318, New York, NY, USA. Association for Computing Machinery.
- Demszky et al. (2020) Dorottya Demszky, Dana Movshovitz-Attias, Jeongwoo Ko, Alan Cowen, Gaurav Nemade, and Sujith Ravi. 2020. GoEmotions: A dataset of fine-grained emotions. In 58th Annual Meeting of the Association for Computational Linguistics.
- Devlin et al. (2019) Jacob Devlin, Ming-Wei Chang, Kenton Lee, and Kristina Toutanova. 2019. BERT: Pre-training of deep bidirectional transformers for language understanding. In Proceedings of the 2019 Conference of the North American Chapter of the Association for Computational Linguistics: Human Language Technologies, pages 4171–4186.
- Ekman and Friesen (1971) Paul Ekman and Wallace V. Friesen. 1971. Constants across cultures in the face and emotion. Journal of Personality and Social Psychology, 17(2):124–129.
- El Ayadi et al. (2011) Moataz El Ayadi, Mohamed S. Kamel, and Fakhri Karray. 2011. Survey on speech emotion recognition: Features, classification schemes, and databases. Pattern Recognition, 44(3):572 – 587.
- Fung et al. (2018) Pascale Fung, Dario Bertero, Yan Wan, Anik Dey, Ricky Ho Yin Chan, Farhad Bin Siddique, Yang Yang, Chien-Sheng Wu, and Ruixi Lin. 2018. Towards empathetic human-robot interactions. In Computational Linguistics and Intelligent Text Processing, pages 173–193.
- (25) Gareth Jones (Garethjns). IncrementalTrees: Online Tree Learners on top of Scikit-learn. https://github.com/garethjns/IncrementalTrees.
- Guerini and Staiano (2015) Marco Guerini and Jacopo Staiano. 2015. Deep feelings: A massive cross-lingual study on the relation between emotions and virality. In 24th International Conference on World Wide Web.
- Husseini Orabi et al. (2018) Ahmed Husseini Orabi, Prasadith Buddhitha, Mahmoud Husseini Orabi, and Diana Inkpen. 2018. Deep learning for depression detection of Twitter users. In Fifth Workshop on Computational Linguistics and Clinical Psychology: From Keyboard to Clinic, pages 88–97.
- Hutto and Gilbert (2014) Clayton Hutto and Eric Gilbert. 2014. Vader: A parsimonious rule-based model for sentiment analysis of social media text. In 7th International AAAI Conference on Web and Social Media, volume 8.
- Jackson et al. (2019) Joshua Conrad Jackson, Joseph Watts, Teague R. Henry, Johann-Mattis List, Robert Forkel, Peter J. Mucha, Simon J. Greenhill, Russell D. Gray, and Kristen A. Lindquist. 2019. Emotion semantics show both cultural variation and universal structure. Science, 366(6472):1517–1522.
- Li and Deng (2020) S. Li and W. Deng. 2020. Deep facial expression recognition: A survey. IEEE Transactions on Affective Computing, pages 1–1.
- Lykousas et al. (2019) Nikolaos Lykousas, Constantinos Patsakis, Andreas Kaltenbrunner, and Vicenç Gómez. 2019. Sharing emotions at scale: The vent dataset. 13th International AAAI Conference on Weblogs and Social Media, 13(01):611–619.
- Malko et al. (2021) Anton Malko, Cecile Paris, Andreas Duenser, Maria Kangas, Diego Molla, Ross Sparks, and Stephen Wan. 2021. Demonstrating the reliability of self-annotated emotion data. In Proceedings of the Seventh Workshop on Computational Linguistics and Clinical Psychology: Improving Access, pages 45–54, Online. Association for Computational Linguistics.
- Mohammad (2021) Saif M Mohammad. 2021. Sentiment analysis: Automatically detecting valence, emotions, and other affectual states from text. In Emotion Measurement, pages 323–379. Elsevier.
- Mohammad et al. (2013) Saif M Mohammad, Svetlana Kiritchenko, and Xiaodan Zhu. 2013. NRC-Canada: Building the state-of-the-art in sentiment analysis of tweets. In Second Joint Conference on Lexical and Computational Semantics, pages 321–327.
- Mohammad and Turney (2013) Saif M Mohammad and Peter Turney. 2013. Crowdsourcing a word-emotion association lexicon. Computational Intelligence, 29.
- Mohammad et al. (2015) Saif M. Mohammad, Xiaodan Zhu, Svetlana Kiritchenko, and Joel Martin. 2015. Sentiment, emotion, purpose, and style in electoral tweets. Information Processing and Management, 51(4):480–499.
- Nielsen (2011) Finn Nielsen. 2011. A new ANEW: evaluation of a word list for sentiment analysis in microblogs. In ESWC2011 Workshop on ’Making Sense of Microposts’, volume 718 of CEUR Workshop Proceedings, pages 93–98.
- Noroozi et al. (2018) Fatemeh Noroozi, Dorota Kaminska, Ciprian Corneanu, Tomasz Sapinski, Sergio Escalera, and Gholamreza Anbarjafari. 2018. Survey on emotional body gesture recognition. IEEE transactions on affective computing.
- Ortigosa et al. (2014) Alvaro Ortigosa, José M. Martín, and Rosa M. Carro. 2014. Sentiment analysis in facebook and its application to e-learning. Computers in Human Behavior, 31:527 – 541.
- Pedregosa et al. (2011) F. Pedregosa, G. Varoquaux, A. Gramfort, V. Michel, B. Thirion, O. Grisel, M. Blondel, P. Prettenhofer, R. Weiss, V. Dubourg, J. Vanderplas, A. Passos, D. Cournapeau, M. Brucher, M. Perrot, and E. Duchesnay. 2011. Scikit-learn: Machine learning in Python. Journal of Machine Learning Research, 12:2825–2830.
- Plutchik (1980) Robert Plutchik. 1980. A general psychoevolutionary theory of emotion. In Robert Plutchik and Henry Kellerman, editors, Theories of Emotion, pages 3 – 33. Academic Press.
- Poria et al. (2019) Soujanya Poria, Navonil Majumderd, Rada Mihalceae, and Eduard Hovy. 2019. Emotion recognition in conversation: Research challenges, datasets, and recent advances. IEEE Access, PP:1–1.
- Ptaszynski et al. (2009) M. Ptaszynski, Pawel Dybala, Wenhan Shi, Rafal Rzepka, and K. Araki. 2009. A system for affect analysis of utterances in japanese supported with web mining. Journal of Japan Society for Fuzzy Theory and Intelligent Informatics, 21:194–213.
- Ramírez-Cifuentes et al. (2020) Diana Ramírez-Cifuentes, Ana Freire, Ricardo Baeza-Yates, Joaquim Puntí, Pilar Medina-Bravo, Diego Alejandro Velazquez, Josep Maria Gonfaus, and Jordi Gonzàlez. 2020. Detection of suicidal ideation on social media: Multimodal, relational, and behavioral analysis. Journal of Medical Internet Research, 22(7).
- Russell (2003) James Russell. 2003. Core affect and the psychological construction of emotion. Psychological review, 110:145–72.
- Schwartz et al. (2013) H. Andrew Schwartz, Johannes C. Eichstaedt, Margaret L. Kern, Lukasz Dziurzynski, Stephanie M. Ramones, Megha Agrawal, Achal Shah, Michal Kosinski, David Stillwell, Martin E. P. Seligman, and Lyle H. Ungar. 2013. Personality, gender, and age in the language of social media: The open-vocabulary approach. PLOS ONE, 8(9):1–16.
- Scollon et al. (2004) Christie N. Scollon, Ed Diener, Shigehiro Oishi, and Robert Biswas-Diener. 2004. Emotions across cultures and methods. Journal of Cross-Cultural Psychology, 35(3):304–326.
- Shmueli and Ku (2019) Boaz Shmueli and Lun-Wei Ku. 2019. Socialnlp emotionx 2019 challenge overview: Predicting emotions in spoken dialogues and chats.
- Silva et al. (2014) N. F. D. Silva, E. Hruschka, and Estevam R. Hruschka. 2014. Tweet sentiment analysis with classifier ensembles. Decis. Support Syst., 66:170–179.
- Strapparava and Mihalcea (2007) Carlo Strapparava and Rada Mihalcea. 2007. SemEval-2007 task 14: Affective text. In Proceedings of the Fourth International Workshop on Semantic Evaluations (SemEval-2007), pages 70–74, Prague, Czech Republic. Association for Computational Linguistics.
- Tausczik and Pennebaker (2010) Yla Tausczik and James Pennebaker. 2010. The psychological meaning of words: Liwc and computerized text analysis methods. Journal of Language and Social Psychology, 29:24–54.
- Thelwall et al. (2010) Mike Thelwall, Kevan Buckley, Georgios Paltoglou, Di Cai, and Arvid Kappas. 2010. Sentiment strength detection in short informal text. Journal of the American Society for Information Science and Technology, 61:2544–2558.
- Yang et al. (2019) Ze Yang, Can Xu, Wei Wu, and Zhoujun Li. 2019. Read, attend and comment: A deep architecture for automatic news comment generation. In Conference on Empirical Methods in Natural Language Processing and the 9th International Joint Conference on Natural Language Processing (EMNLP-IJCNLP).
Appendix A Dataset Details
A.1 GoEmotions
The GoEmotions dataset is built from comments sampled from a Reddit dump from 2005 to 2019. Snippets are filtered to (a) reduce profanity and offensive or discriminating content, (b) keep a consistent comment length of under 30 tokens with a median of 12 tokens per comment and (c) balance sentiment, emotion and subreddit popularities. Proper names and religions are masked with special, replacing their occurrences in the text with [NAME] and [RELIGION] respectively.
| # examples | 58,009 | ||
|---|---|---|---|
| # emotions | 27 + neutral | ||
| # unique raters | 82 | ||
| # raters / example | 3 or 5 | ||
|
1.6% | ||
| Labels per example | 1: 83% | ||
| 2: 15% | |||
| 3: 2% | |||
| 4+: .2% | |||
|
54,263 (94%) | ||
|
17,763 (31%) |
A.2 Vent
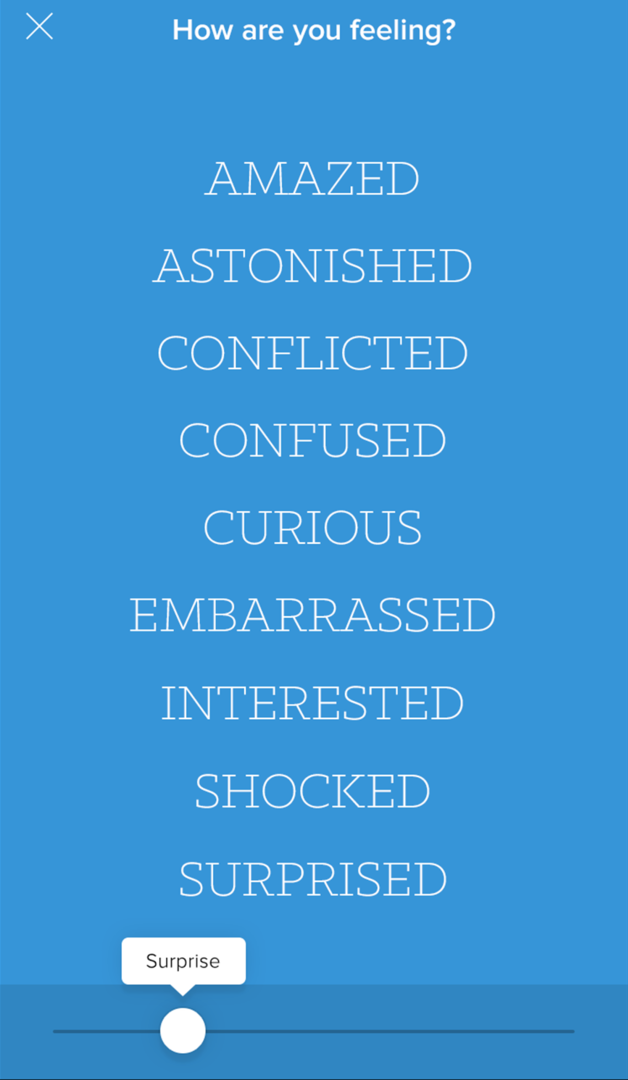
The Vent dataset is self-annotated by Vent users (writers) using the interfaces shown in Figure 6. The distribution of comment lengths in number of tokens is shown in Figure 7. We used 32 as the maximum number of tokens per Vent in alignment with the th percentile in the length distribution.


A.2.1 Filtering procedure
We filter the dataset to (a) contain months with sufficient volume and (b) only contain stable emotions that appear every month onwards from the chosen point.
In Figure 8, we show the distribution of emotions over time in terms of the overall frequency of emotions from each of the 9 emotion categories. In Lykousas et al. (2019), the authors report user activity peaks in April 2015, and slowly decreases afterwards.
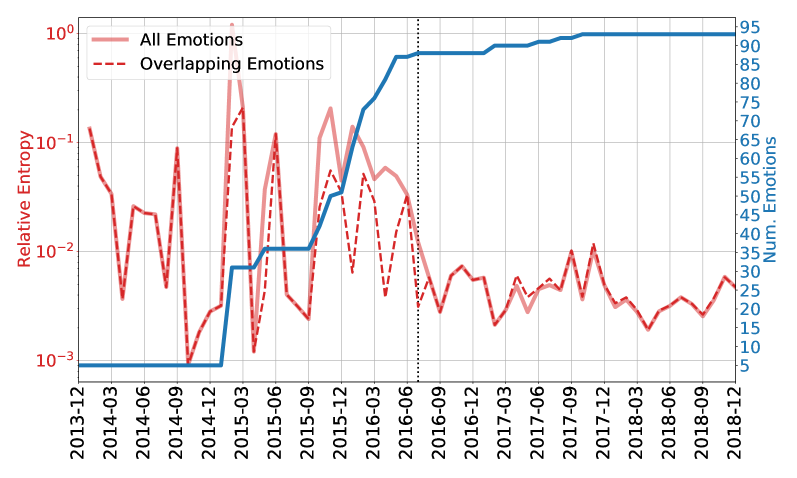
We select the filter in July 2016 according to two criteria: first, we compute the number of valid distinct emotions over time (see main text for definition of a valid emotion). This is shown in Figure 9 (blue line). We observe that after July 2016, the large majority of distinct emotions have been created. Second, to characterize their stability, we compute the relative entropy between the emotion distributions of two consecutive months. This is shown in Figure 9 (red lines). The emotion distributions consider the intersection (dashed red) or union (solid red) of emotions in each pair of consecutive months. We observe that after our cut-off in July 2016 both curves show that relative entropy takes regular values below , indicating that the use of emotions is stable after that month.

A.2.2 Obscene Word Analysis
Unlike other works like GoEmotions Demszky et al. (2020), we do not exclude content with foul language from the training process. Our rationale is that Vent is a dataset collected from a moderated social network. In this sense, we assume moderators remove toxic or unacceptable behaviour, while hypothesizing that foul language is a strong emotional signal that is necessary to capture emotional messages in certain categories. We note, however, that we do filter nsfw (not safe for work) content during the human annotation task to avoid exposing readers to inappropriate content.
In order to justify the decision to keep obscene terms, we study whether there are significant differences in the degree of obscenity for each emotion and category. We flag whether or not a comment is obscene by detecting 763 words from two publicly available obscene ††https://github.com/RobertJGabriel/Google-profanity-words/blob/master/list.txt and bad word ††https://code.google.com/archive/p/badwordslist/downloads lists. We exclude frequency analysis from our study: rather than accounting for obscene word frequencies, we use a binary indicator that signals whether an obscene word from either list is observed in a Vent comment.
We observe significant differences (, using bootstrapped z-tests) in the percentage of vents containing obscene words between categories, estimated with bootstrapping on 100 independent runs with 10% of the dataset sampled with replacement. We find that 10% comments in the Positive category contain obscene words (lowest) while 32% of Anger vents use obscene language (highest). Figure 10 provides an overview of the number of snippets per emotion and category, and the proportion of obscene comments for each emotion.

Appendix B Benchmark Design
B.1 Representation Approaches
We implement statistical and embedded representations. In particular, we employ 4 different algorithms:
-
1.
Bag-of-Words. Each document is represented as a sparse vector containing the counts of every word. We limit the vocabulary size after filtering English stop words using Scikit-learn’s list Pedregosa et al. (2011) but without applying any transformations like stemming. Our vocabulary contains only the most frequent words, which we tune as a hyper-parameter shown in Table 6.
-
2.
TF-IDF. Each document is represented as a sparse vector containing the normalized term-frequency divided by inverse document frequency. We apply the same vocabulary-building policy as on Bag-of-Words, including stop-word filtering and using the top most frequent words tuned as a hyper-parameter shown in Table 6.
-
3.
FastText. We use a pre-trained unsupervised English FastText Bojanowski et al. (2017) model to embed the sequence of tokens in a sentence. We limit the length of the sentence as a hyper-parameter.
-
4.
BERT. We use a pre-trained BERT Devlin et al. (2019) English model to tokenise and embed the sequence of tokens in a sentence. Our design permits gradients to propagate when BERT is used as an input to a downstream neural model. We limit the length in total tokens and whether or not to propagate gradients (e.g. freeze BERT) as hyper-parameters shown in Table 6.
B.2 Modeling Methods
We employ five different learners:
-
1.
Naive Bayes. We employ Scikit-learn Pedregosa et al. (2011)’s implementation of Multinomial Naive Bayes in a one-vs-rest setting for multi-label classification.
-
2.
Logistic Regression. Likewise, we use Scikit-learn’s SGD-based Logistic Regression in a one-vs-rest setting for multi-label classification.
-
3.
Incremental Random Forests. We use an extension to Scikit-learn’s Random Forest classifier to incrementally build the forest in a mini-batch fashion, using the incremental-trees Python library () (Garethjns). Each mini-batch grows a fixed number of trees, up to a maximum number, for all batches.
-
4.
(Pooled) Neural Networks. We implement a simple DNN architecture, applied to every embedded token in parallel with output neurons, as many as there are classes. The final result is computed by applying a pooling function over the states, as shown in 3(a).
-
5.
(Bi)-LSTM. We implement a stacked (Bi)-LSTM architecture that consumes an embedded sequence in a seq2seq manner, optionally processing in a single direction. The recurrent network captures inter-token relationships and produces output neurons per token. The final result is computed by applying a pooling function over each token, as shown in 3(b).
Appendix C Hyper-parameter Configuration
All the hyper-parameters used when tuning the algorithms used in our experiments are shown in Table 6. Each row shows a hyper-parameter affecting either the whole training process, the representation method, or the learning algorithm. Values in bold were chosen through Grid Search as the best performing values for that particular component and data set. Our grid search optimizes micro-F1 for each method, running on a Slurm cluster with 8GB Nvidia GPUs. Each configuration was executed once to identify candidates, with the final experiments executing the best performing configuration on 5 independent runs using different seeds. In the code samples, we provide the original .json files containing the exact run configurations for reproducibility, including execution files that contain the per-run evaluation metrics to trace the notebooks used to compute the values reported in the paper.
| Dataset | Component | Hyper-parameter | Values | ||
| GoEmotions | Global | Batch Size |
|
||
| Bag-of-Words | Vocabulary Size | 5000, 10000, 20000, 40000 | |||
| TF-IDF | Vocabulary Size | 5000, 10000, 20000, 40000 | |||
| BERT | Freeze | True, False | |||
| Model | bert-base-cased, bert-base-uncased | ||||
| Max Length | 25 | ||||
| FastText | Model | Common Crawl English Model | |||
| Max Length | 25 | ||||
| Log. Reg. | Epochs | 1, 10, 50, 100 | |||
| 0.00001, 0.0001, 0.001, 0.01, 0.1, 1.0 | |||||
| Tolerance | 0.001 | ||||
| Naive Bayes | Smoothing Factor | 1, 0.1, 0.01, 0.001, …, 1e-10 | |||
| Random Forest | Trees per Batch | 1000, 2000, 3000 | |||
| Max. Depth | 3, 4, 5, 6, 7 | ||||
| Max. Features Fraction | 0.05, 0.1, 0.2, 0.4 | ||||
| Split Criterion | Entropy | ||||
| DNN Pool | Hidden Size | 100 | |||
| Num. Layers | 1, 2, 3 | ||||
| Num. Epochs | 30, 40, 50, 60 | ||||
| Learning Rate | 0.01, 0.001, 0.0001 | ||||
| Epsilon | 1e-5, 1e-6, 1e-7 | ||||
| Activation | ELU, Tanh | ||||
| Pooling Function | Attention, Mean, Max | ||||
| Optimizer | AdamW | ||||
| Bi-LSTM | Hidden Size | 100 | |||
| Num. Layers | 1, 2 | ||||
| Num. Epochs | 30, 40, 50, 60 | ||||
| Learning Rate | 0.01, 0.001, 0.0001 | ||||
| Epsilon | 1e-5, 1e-6, 1e-7 | ||||
| Bidirectional | True, False | ||||
| Pooling Function | Attention, Mean, Max | ||||
| Optimizer | AdamW | ||||
| Vent | Global | Batch Size |
|
||
| Bag-of-Words | Vocabulary Size | 5000, 10000, 20000, 40000, 80000 | |||
| TF-IDF | Vocabulary Size | 5000, 10000, 20000, 40000, 80000 | |||
| BERT | Freeze | True, False | |||
| Model | bert-base-cased, bert-base-uncased | ||||
| Max Length | 40 | ||||
| FastText | Model | Common Crawl English Model | |||
| Max Length | 40 | ||||
| Log. Reg. | Epochs | 1, 2, 10, 50, 100 | |||
| 0.00001, 0.0001, 0.001, 0.01, 0.1, 1.0 | |||||
| Tolerance | 0.001 | ||||
| Naive Bayes | Smoothing Factor | 1, 0.1, 0.01, 0.001, …, 1e-10 | |||
| Random Forest | Trees per Batch | 66, 125, 250, 500 | |||
| Max. Depth | 4, 5 | ||||
| Max. Features Fraction | 0.05, 0.1, 0.2, 0.4 | ||||
| Split Criterion | Entropy | ||||
| DNN Pool | Hidden Size | 100, 200 | |||
| Num. Layers | 1, 2, 3, 4, 5 | ||||
| Num. Epochs | 1, 2, 3 | ||||
| Learning Rate | 0.01, 0.001, 0.0001 | ||||
| Epsilon | 1e-5, 1e-6, 1e-7 | ||||
| Activation | ELU, Tanh | ||||
| Pooling Function | Attention, Mean, Max | ||||
| Optimizer | AdamW | ||||
| Bi-LSTM | Hidden Size | 100, 200, 400 | |||
| Num. Layers | 1, 2, 3 | ||||
| Num. Epochs | 1, 2 | ||||
| Learning Rate | 0.01, 0.001, 0.0001 | ||||
| Epsilon | 1e-5, 1e-6, 1e-7 | ||||
| Pooling Function | Attention, Mean, Max | ||||
| Bidirectional | True, False | ||||
| Optimizer | AdamW |
Appendix D Experimental Setting
We perform 5 independent experiment runs using different seeds for all underlying libraries used in our implementation. For every experiment configuration, we report the average performance across the 5 runs computed for each metric.
Appendix E Experiment Results
We report per-category performances beyond the results reported in the main text in Table 7, and show the confusion matrix for all emotions in Figure 17.
| Category | Precision | Recall | F1-Score |
|---|---|---|---|
| Affection | 0.51 | 0.48 | 0.49 |
| Anger | 0.42 | 0.37 | 0.40 |
| Creativity | 0.25 | 0.41 | 0.31 |
| Fear | 0.39 | 0.36 | 0.35 |
| Feelings | 0.33 | 0.45 | 0.38 |
| Happiness | 0.41 | 0.45 | 0.43 |
| Positivity | 0.29 | 0.26 | 0.27 |
| Sadness | 0.51 | 0.52 | 0.51 |
| Surprise | 0.30 | 0.35 | 0.33 |
E.1 Model Performance vs Dataset Size
To check the performance that our models as a function of the data size, we analyze how models perform under different fractions of the Vent dataset. Figure 11 shows the micro-F1 score curves for given percentage of data available.
We find that statistical models show stable performance, which we explain by the fact that the vocabulary sizes are chosen by searching on a limited set of values. We also observe that FastText slowly improves but requires a much higher data intensity than other methods, which we believe is caused by the inability of re-training the FastText model through backpropagation due to limitations in the implementation.

E.2 Temporal Impact Emotional Data
We compare whether training with Vent using uniformly random splits to study whether the data is non-stationary. We take the Robust subset of Vent and divide randomly it in 3 splits whose sizes match the previous 80 / 10 / 10 setting. Our findings show consistently worse results, as observed in Table 8. For instance, the performance of the BERT / Bi-LSTM model in terms of micro-F1 is 0.19, against the 0.21 observed for the model trained with temporal splits which we discuss in the main body of the paper. We believe this behavior might be caused by the homophilic nature of social networks: as the network grows, new members join existing communities and over time their vocabularies homogenize, becoming more predictable over time. This would be consistent with studies on the socio-linguistic evolution of communities Danescu-Niculescu-Mizil et al. (2013), which predict the duration of the life span of a user in a community given their posting behaviour—with users that do not align with the linguistic expectations of the community deciding to leave, and those that fall in line reinforcing their cultural norms.
| Repr. | Model | M-F1 | m-F1 | Pre | Rec |
|---|---|---|---|---|---|
| — | Random | 0.02 | 0.04 | 0.02 | 0.60 |
| BoW | N. Bayes | 0.13 | 0.15 | 0.12 | 0.22 |
| Log. Reg. | 0.13 | 0.15 | 0.13 | 0.20 | |
| R. Forest | 0.11 | 0.13 | 0.12 | 0.17 | |
| TF-IDF | N. Bayes | 0.14 | 0.16 | 0.13 | 0.20 |
| Log. Reg. | 0.14 | 0.16 | 0.14 | 0.20 | |
| R. Forest | 0.11 | 0.13 | 0.12 | 0.17 | |
| FT | DNN Pool | 0.10 | 0.13 | 0.10 | 0.21 |
| Bi-LSTM | 0.04 | 0.05 | 0.03 | 0.32 | |
| BERT | DNN Pool | 0.16 | 0.18 | 0.16 | 0.23 |
| Bi-LSTM | 0.18 | 0.19 | 0.17 | 0.24 |
E.3 Emotional Transfer Learning
Vent is a large dataset which we expect to help specialise BERT for emotion recognition tasks. We expect that the resulting GoEmotions model will perform better (as measured by micro F1-Score) than the model trained directly on GoEmotions, as the last layers of BERT will have been fine-tuned with the emotional content of Vent.
To measure the amount of emotional information in Vent, we implement a transfer learning task with GoEmotions. We train model with the best performing BERT / Bi-LSTM configuration on different Vent subsets. For every trained model, we take the finetuned BERT embedder and use it as the seed embedding model to repeat our experiments GoEmotions changing no other hyper-parameter. No improvements are found on the transfer learning task (results not shown), so we believe that the signal is encoded in the task-specific Bi-LSTM model rather than within the BERT layers.
E.4 Human Reader Evaluation
We provide additional details on the design of the HIT, experimental results, and our compensation structure to ensure that workers on our HITs receive a fair compensation.
E.4.1 Annotation Procedure
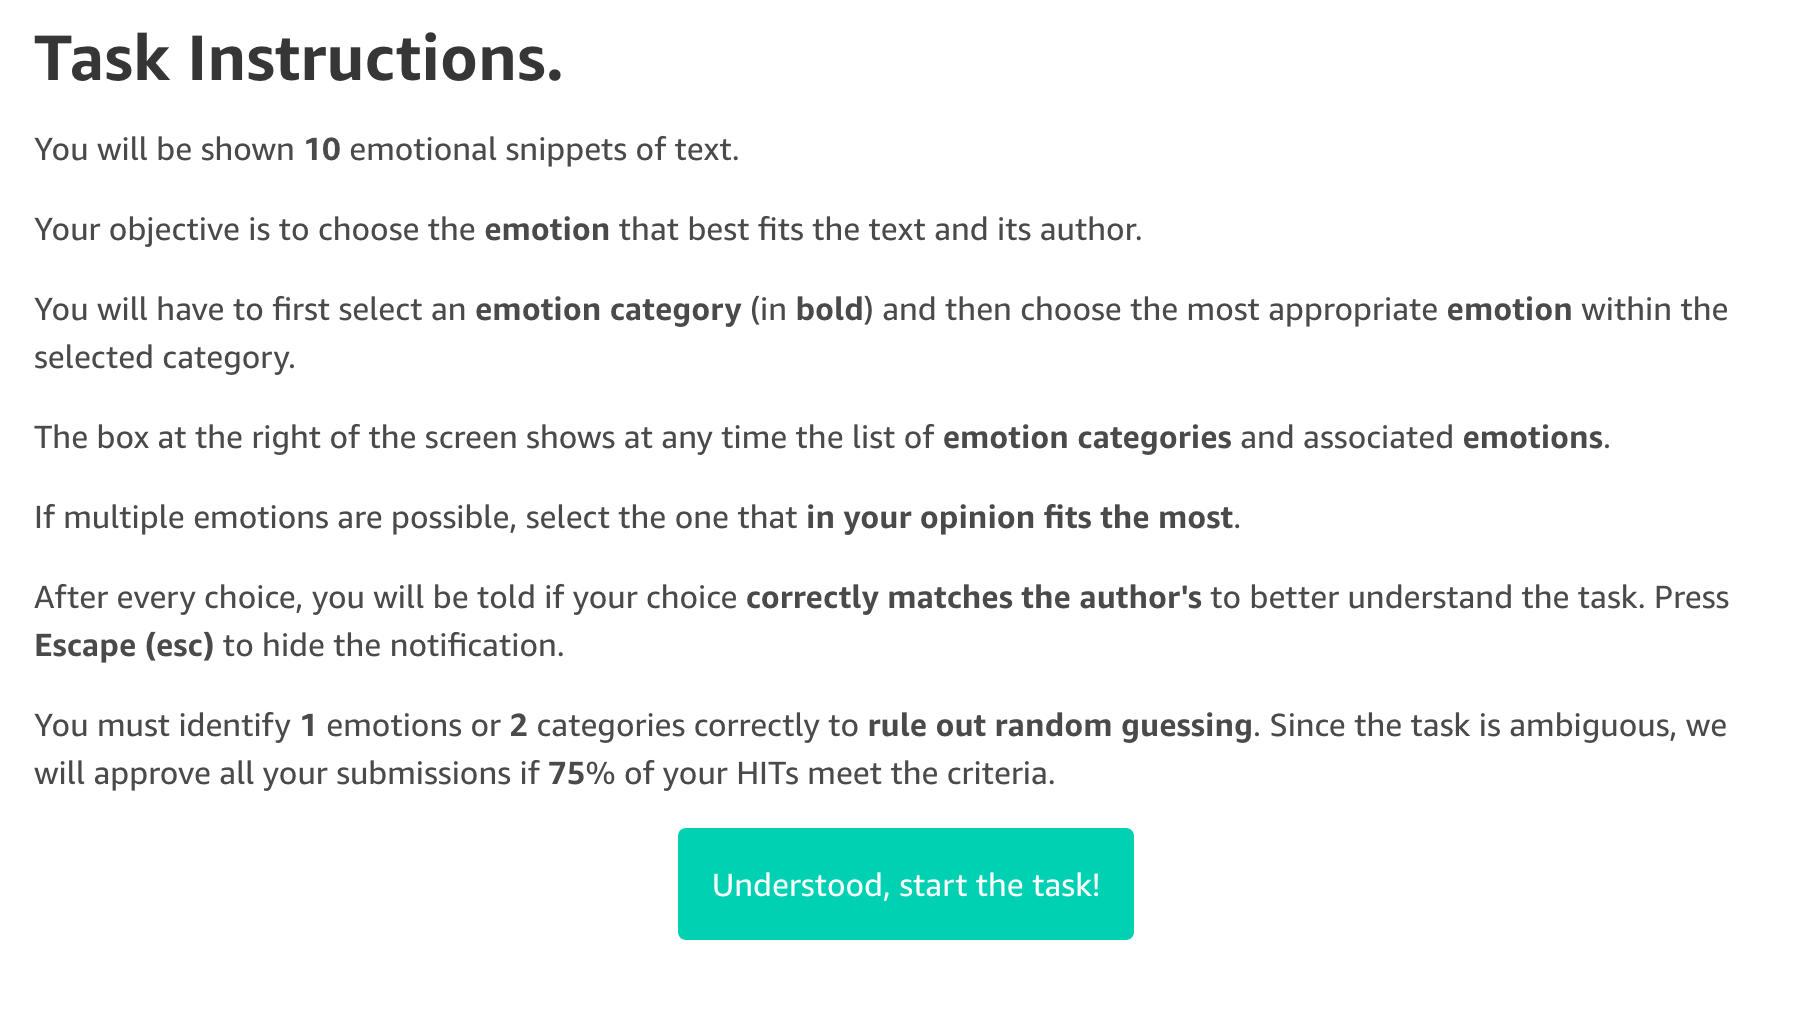
Workers are tasked to annotate the emotions for 10 comments, whose order is shuffled in every distinct session to avoid position biases. The annotation workflow starts with a set of instructions, shown in Figure 13, emphasizing they have to match the author’s (writer) emotion. Then the task starts showing texts, as illustrated in Figure 16. Workers first select an emotion category and then choose the emotion according to the previous instructions. Upon selecting an emotion, a message prompts the worker on whether the prediction was correct or not at the emotion and category level, given the original Vent ground truth.
To ensure that workers submit quality work, and that the assessment is equal for all workers, we define approval rules based on their predictive performance. For any submission, we expect that it is distinguishable from random choices, which means that it must contain correct predictions for at least 1 out of 88 emotions or 2 out of 9 emotion categories. We implement both constraints as an automated check of annotator quality, accepting or rejecting the provided annotations for every new submission.
In order to account for the ambiguity of the task and avoid penalising quality workers††During our trial run (whose data we do not use in our final study), workers contacted us about the ambiguity and meaninglessness of the emotions provided by Vent users and the impact of rejections in their future earnings on the platform., we approve all tasks submitted by workers that meet the quality criteria in 75% of their work. By the end of our 264 HIT batch, we approved 97.33% of the submissions sent by 84 different readers with an average emotion accuracy of 11.43% and an average category accuracy of 34.26%. The distribution of accuracy scores is shown in Figure 12.

E.4.2 Inter-annotator Agreement
To validate that the emotion labels in Vent contain meaningful emotional information, we analyze the agreement between annotators (readers). The set of readers performing the annotations varies across snippets, so we focus on the number of readers that assign the same emotion and emotion category to any given snippet. For a given snippet, we consider the reader overlap as the total number of readers that agree with the most frequently assigned label. Since every snippet is shown to 5 different readers, the maximum level of agreement is 5, meaning that all readers agreed on the same judgement, while an agreement of 1 means that each reader chose a different label. The frequency of the overlaps observed across all snippets are shown in Figure 14. At the emotion level (blue), we find an average agreement of 1.81 ( 0.88) readers while at the category level (orange) we find that 2.95 ( 1.03) readers agree on average with the most frequent label. These results show that the majority of annotators agree on the category labels, but specific emotions are hard to pin down.

E.4.3 Human vs. Model Performance
We provide detailed results at the category level of the best performing BERT + Bi-LSTM model and readers in Table 9 and Table 10 respectively. As highlighted in the paper, we find that the precision of the model is lower across all categories while readers show consistently higher recall. On Affection and Fear, readers and the model achieve the same F1-score (0.44 and 0.42 respectively) while otherwise the model outperforms readers in all emotion categories except for Creativity and Surprise, which are the worst-performing categories for the model.
| Emotion | Prec | Rec | F1 | Sup |
|---|---|---|---|---|
| Affection | 0.47 | 0.41 | 0.44 | 270 |
| Anger | 0.44 | 0.50 | 0.46 | 270 |
| Creativity | 0.26 | 0.50 | 0.34 | 300 |
| Fear | 0.45 | 0.40 | 0.42 | 330 |
| Feelings | 0.28 | 0.51 | 0.36 | 330 |
| Happiness | 0.29 | 0.57 | 0.38 | 270 |
| Positivity | 0.35 | 0.38 | 0.37 | 270 |
| Sadness | 0.35 | 0.62 | 0.44 | 330 |
| Surprise | 0.34 | 0.34 | 0.34 | 270 |
| Emotion | Prec | Rec | F1 | Sup |
|---|---|---|---|---|
| Affection | 0.31 | 0.79 | 0.44 | 270 |
| Anger | 0.27 | 0.80 | 0.41 | 270 |
| Creativity | 0.23 | 0.66 | 0.35 | 300 |
| Fear | 0.30 | 0.66 | 0.42 | 330 |
| Feelings | 0.23 | 0.70 | 0.35 | 330 |
| Happiness | 0.25 | 0.69 | 0.37 | 270 |
| Positivity | 0.23 | 0.70 | 0.34 | 270 |
| Sadness | 0.27 | 0.85 | 0.41 | 330 |
| Surprise | 0.24 | 0.68 | 0.36 | 270 |
We also analyze the confusion matrices between readers and the model (constructed as per the main text). Figure 18 shows that the model is more precisely predicts emotions given a particular author-provided label than the MTurk workers (the diagonal vector is more clearly defined). However, we observe that the confusion between negative (Anger, Fear, Feelings, and Sadness) and positive (Affection, Surprise, Creativity, Happiness, and Positivity) categories is more apparent for workers.
To further understand the differences between readers and the model, we compute deltas between confusion matrices in Figure 19. For an expected -th emotion (row), red cells show when readers are more likely to predict the -th emotion (column) than the model, while blue cells show the opposite case with the model having higher likelihood than readers. To ensure the results are significant, we compute differences over 10,000 bootstrapping runs with the sample size of the evaluation data set (2640 snippets) and perform z-tests on the differences between model and readers.
Figure 19 shows that the model is more likely to output Creativity or Happiness, while workers are more likely to predict Surprise, Affection and Positivity. We also find blue colors along the diagonals, which agrees with our results on the model having higher precision than the readers.
E.4.4 Worker Compensation Analysis
Finally, we discuss the annotator reward of our task, which we defined to ensure that MTurk workers receive fair compensation of at least $7.25, which is the minimum federal wage in the United States. Upon designing our task and annotation tool, we benchmark ourselves on a sample of 10 HITs using the Requester and Worker Sandbox. In doing so, we identify a minimum amount of time to show feedback after each example (4 seconds), and estimate that every task takes around 90 seconds.
With our first internal estimate, we schedule a test batch with 10% of the data and a reward of $0.20 per task, which we expect to translate into $8 per hour. Our test batch helped us identify serious problems with our annotation tool, which allowed workers to submit incomplete tasks. Our acceptance rules flagged their submissions as invalid, which meant that workers could potentially get several rejections. Workers on MTurk depend on a high approval rate to access tasks, so they contacted us and promptly addressed the limitation.
Additionally, using data from this batch and input from workers, we observed that the task took longer to complete without prior context, and thus our reward was not enough to meet our goal. Given a median amount of time per task of around 130 seconds, we conservatively raise the reward per HIT to $0.32. This brings our expected payout to $8.86 per hour, which we use to submit our full batch.
In Figure 15, we show the distribution of compensations per HIT and the overall median compensation per HIT (red vertical line), which is equivalent to $7.48 per hour. We notice a large variability in the results, and observe that the final reward per task is lower than expected. This might be caused by the fact that despite text snippets in a HIT being chosen at random, some of the specific HITs remain more challenging than others. Additionally, it might be the case that some workers are more capable of performing the task than others, or that can trade off annotation quality for speed without bypassing our quality checks. Our results show that we achieve our goal of fairly compensating workers per HIT above minimum wage.