MoB2 under Pressure: Superconducting Mo Enhanced by Boron
Abstract
The discovery of the first high critical temperature (Tc) transition metal diboride superconductor, MgB2 structure -MoB2 under pressure with Tc up to 32 K at 100 GPa, provides new input into some unexplained aspects of electron-phonon coupling in intermetallic compounds. We establish that MoB2 is a phonon-mediated superconductor but has little in common with MgB2 (Tc=40 K at zero pressure). MoB2 is a strongly metallic, three dimensional, multi-Fermi surface material, becoming of additional interest because it displays a frequency separation of Mo and B vibrations that mirrors that of metal superhydrides with Tc approaching room temperature. This separation, which is unusual in intermetallic compounds, allows an analysis separately for Mo and B providing, amongst the other parameters essential for understanding phonon coupling, the matrix elements for scattering by the individual atoms. Strong coupling (=1.48) is provided by Mo (total 1.67). A factor of 15 weaker coupling to each B atom is compensated by that coupling being to mean high frequency modes around 85-90 meV (maximum of 140 meV), versus 18-20 meV for Mo. As a result, B enhances Tc by 43% over the Mo-only value, to 33 K, corresponding to the experimental value. These results provide a guideline for designing higher Tc materials from a cooperation of strong coupling from heavy atoms with weakly coupled light atoms. The new high Tc paradigm discovered here highlights the need for studying and engineering larger ionic scattering matrix elements.
I Background
The discovery two decades agoNagamatsu2001 of superconductivity in MgB2 at 40 K reinvigorated interest in electron-phonon (EP) coupled superconductors. The maximum at that time, after 20 years of very active research in the 1960s and 1970s, was 23 K, and there were suggestions that 30 K would be the limit for the EP mechanism. Perhaps more remarkable was that the previous highest Tc materials had been high symmetry (essentially cubic) transition metal dominated compounds, whereas MgB2 is an - metal with two dimensional (2D) Fermi surfaces that provide the high Tc carriers An2001 ; Kortus2001 ; Bohnen2001 ; Kong2001 ; Liu2001 ; Choi2002 ; Yildirim2002 ; Choi2002b . MgB2 broke nearly all of the “Matthias rules” of supposed HTS. The breakthrough in cuprates (largely a non-EP mechanism) broke the final Matthias rule by requiring oxygen to be a crucial actor in the electronic and magnetic structure.
The remarkable example of MgB2 prompted exploration of other diborides, especially transition metal (TM) diborides which provided the seemingly important elements: a covalent boron sublattice together with TM bands that can provide metallic-covalent TM-boron bonding and thereby additional coupling. The theoretical (and experimental) results were disappointing:Rosner2001 disrupting the simple electron donation (to the B honeycomb sublattice) did not lead to increased Tc.
The recent discovery MoB2 of Tc up to 32 K in non-magnetic MoB2, albeit under pressure, should provide avenues to pursue to obtain higher Tc materials, if its lessons can be identified. Useful exploration requires new understanding: what is it in MoB2 that makes it so different from other diborides, and what causes the rapid increase in Tc under pressure, when the majority of superconductors show a decrease in Tc with pressure. MoB2 itself is not superconducting, but is stabilized by 4% of Zr for Mo that produces stoichiometric materials, with T K Muzzy2002 . MoB2, and several other transition metal borides, are difficult metallurgically Muzzy2002 ; Tang2020 ; Ren2008 , and good prospects in this class have been difficult to find Rosner2001 . MoB2 thus provides a new, yet to be understood, paradigm in metal-metalloid superconductivity. This discovery also extends the realization that high pressure can produce high Tc in intermetallic materials, such as up to 19 K above 150 GPa in a Nb-Ti alloy Guo2019 .
Metal hydrides at high pressure, viz. H3S at 200 K and a few others reported with Tc up to 280 K, introduced their own paradigm Duan2014 ; Drozdov2015 ; Einaga2016 ; Duan2017 ; ME2018a ; MS2019 ; ME2018b ; Ma2014 ; Pickett2021 . As anticipated by Ashcroft Ashcroft , the hard H vibrational modes provide sufficient coupling to lead to the ultrahigh Tc values approaching room temperature Duan2014 ; Ma2014 ; Papa2015 ; errea2015 ; bernstein2015 ; akashi2015 ; jose2016 ; Quan2016 . Calculations based on density functional theory (DFT) for electrons and phonons, and Eliashberg theory for their coupling, accounted very well for the extreme values of , but with limited understanding because both metal and H atoms are entangled in the basic material properties (see Sec. II). Initial impressions of the hydrides were that since the metal atom vibrations provide 10-20% of the EP coupling strength , they contributed similarly to .
More detailed analysis Quan2019 enabled by the large mass difference of metal and H atoms, whose formalism is presented in Sec. II, shows that the metal modes in hydrides are useless for increasing , because their frequencies are low compared to the light atom H vibrations and they reduce the mean phonon frequency. In fact the metal contributions impede the understanding of origin and trends in . New analysis revealed that the contribution of the metal atom can even be negative (harmful, but by a small amount) Quan2019 . What we find in this study, by applying the same analysis, is that MoB2 provides a new paradigm: while the Mo modes and B modes are separated in frequency as in the hydrides, the combination of coupling strength and frequency range provide a new example of how specific pairs of atoms may cooperate to promote high Tc, in a compound in which the contributions of each atom type can be disentangled in detail.
Section II presents the formalism necessary to perform the new (but straightforward) analysis of atom-resolved material characteristics. Section III provides descriptions of the crystal structures that will be studied, followed by the computational methods used in the electronic structure, phonon spectrum and coupling, and analysis. In Sec. IV we provide the main computational results for band structure and Fermi surfaces. The results from density functional theory (DFT) and Eliashberg theory are presented and analyzed in Sec. V, including the atom-specific isotope shifts of Tc. Collecting the results to learn why MoB2 is a high temperature superconductor is done in Sec. VI. Section VII provides a summary of our results.
II Formalism
II.1 Background
The critical temperature Tc (and other superconducting properties) in a phonon-coupled superconductor are determined by the frequency resolved Eliashberg spectral function and a Coulomb repulsion parameter . This latter parameter is around 0.10-0.15 in most superconductors and will not be considered here. is the phonon density of states, and is a frequency resolved coupling strength. The conventional coupling strength is the -weighted moment given by
| (1) |
Understanding is facilitated by defining the shape functionpba1972 ; alldyn
| (2) |
whose integral is normalized to unity. Frequency moments of the spectrum, independent of the strength but weighted by coupling strength, are defined by
| (3) |
with the limit alldyn giving the logarithmic moment . Moments are a non-decreasing function of ; for an Einstein spectrum all moments are equal to ; the broader the spectrum, the more the moments are separated.
Except for highly unusual shapes, the first few moments provide a useful characterization of . This observation led Allen and Dynes (AD) alldyn to fit a generalization of the McMillan equation McMillan T to a more accurate analytic form fitted to 200 experimental or model forms of with known . We also mention (and use) the observation of Leavens and Carbotte leavens that, at least for the strong coupling superconductors of the time, the empirical relation reproduced experimental and calculational data at the time; this product involves only the area under leavenscomment . It was established by Quan et al. Quan2019 that this expression holds well (with the same constant) for metal hydrides of three structural classes, if the low frequency contribution of the metal atom is neglected. How MoB2 fits into this picture will be discussed in Sec. V.
Much of the early literature addressing how to increase focused on increasing , with a seminal study by Bergmann and Rainer Rainer providing a frequency resolved functional derivative from Eliashberg theory which is non-negative and for standard shapes peaks around (=1, =1 units). Experimentally, however, one can rarely simply add a -function contribution to (as the functional derivative does), instead one makes a change in a material that produces changes of magnitude or even sign in different ranges of frequency. The understanding of how physical changes in affect is a rather subtle undertaking Quan2019 .
II.2 The microscopic properties
From the definition of McMillan obtained for an elemental material McMillan , and Hopfield studied Hopfield , the decomposition
| (4) |
where N↑(0) is single-spinalldyn Fermi level (equal to zero) density of states (DOS), is the Fermi surface averaged squared electron-ion matrix element, is the atomic mass, and is the second frequency moment of . The scattering strength is given by the change in crystal potential due to the displacement of the atom at
| (5) |
where the large brackets indicate a double average of over the Fermi surface, leaving independent of . It is an atomic property, but material dependent, and the degree and character of its material dependence is one of the fundamental open questions in formulating strategies for increasing . Details of the formal theory of electron-phonon coupling, and several aspects of implementation, can be found in the review of Giustino Giustino2017 .
The final expression in Eq. (4) specifies the McMillan-Hopfield quantity and an effective sublattice stiffness that, like the simple harmonic oscillator, are independent of mass AllenMitrovic . This simple form, with available from calculation and from experiment (or in recent years, from DFT), has provided the basis of thinking about how to increase . For general compounds, all of these material parameters include contributions from all atom types, which have largely halted quantitative analysis. The Gaspari-Györffy rigid muffin-tin model for has allowed some progress in understanding individual atomic contributions GG (see also Sec. VI).
As mentioned, compounds present challenges in obtaining the relative importance of the various constituent atoms, because each of the quantities in Eq. (4) depends on all atomic species in the unit cell. However, pressurized metal hydrides have provided examples that can be handled quantitatively and accurately because the spectra of , and separate into disjoint frequency ranges, for the metal atom at low frequency and for H vibrations at high frequency. With excellent accuracy, one obtains expression for for each atom as in Eq. (4). Specifically,
| (6) |
must be divided into atomic contributions (preferably including the interstitial contribution). From these expressions one obtains the atomic values, the one central quantity that is in most need for increasing and understanding its variation with respect to changes, viz. pressure. then is the sum of atomic contributions, and frequency moments can be obtained for each atom. The entire function still provides and the full frequency moments from all atoms.
II.3 Isotope shift
Not mentioned previously is that the atom-specific isotope shifts of can be obtained trivially. If one atom type, say B, is changed from to , it is only necessary to scale the B frequency spectrum (i.e. the B moments) by and reevaluate the frequency moments and then . For a general compound, one must replace the atomic mass(es) and recalculate the phonon spectrum and Eliashberg function. (We have neglected here an esoteric mass dependence of .)
The separation of atomic phonon spectra makes it simple to calculate the isotope shift for each atom, using the Allen-Dynes equation. First, the lattice stiffness for each atom does not depend on the isotope. Second, the atomic frequency moments behave in a simple way (since they are independent of other atom masses): for all modes , so the entire atomic spectrum shifts simply by scaling the frequency.
First, the relationship between the atomic (Mo or B) moments and the net moment is obtained by writing and normalizing each region separately,
| (7) | |||||
The denominator integrals over the Mo region (respectively B region) are needed to provide the correctly normalized values of and , which involve averages over only their own spectral region. For , it is the logarithm that is averaged:
| (8) |
With the change in an isotope from mass to , and electronic properties are unchanged, so (including each atomic contribution) remains unchanged. The isotope effect arises from how frequency moments appear in Tc. We will use the Allen-Dynes equation, which is systematic and simple, but reasonably accurate and widely used. It includes the moment straightforwardly in the prefactor, and in the strong-coupling correction, and their ratio in the shape factor.
When the isotope of Mo (analogously for B) is decreased by 1 amu from to , the Mo frequency spectrum is stretched by : The individual moments are a function of the shape in their part of the spectrum; specifically, they are independent of the other atom and of the coupling strengths. With the new mass, the normalized shape function is . The changes in the moments are immediate:
| (9) |
The corresponding and numbers of Mo must be combined with the B moments using the expressions above, and substituted into the Tc equation. The difference in Tc provides the isotope shift coefficients for each atom, for the discrete amu. The results are presented and discussed for -MoB2 in Sec. V E.
II.4 Earlier application to metal hydrides
For binary hydrides ( is a metal atom), the various atom-specific and total quantities were obtained and applied Quan2019 ; RHtheory ; LaH10theory ; eva1 ; eva2 to great advantage to better understand the origins of their high and provide insight into limits of . Three crystal classes encompassing five hydrides were studied. An important point of this formalism is that, given , can be obtained for each atom, and its variation – for example with pressure – can be extracted and analyzed.
This formalism allowed the quantitative importance for of H versus the metal atom. Hydrogen’s dominance is, in effect, total. While the low vibrations of the metal provide a significant contribution to (typically 15%), it does not contribute to : the increase in is offset by the decrease in frequency moments, and sometimes the metal contribution to is negative. Another discovery was that the H value of varied by a factor of five over these hydrides, all high examples. Also, the pressure (volume) variation was not very systematic nor particularly large, although tended to increase with pressure whereas a simple picture involving additional screening due to increased electronic density would suggest the opposite. Various ways to explore correlations between H quantities were presented and discussed.
Based on early data on H3S and anticipated similar cases with distinct metal and H spectra (similarly, acoustic and optical spectra), Gorkov and Kresin present expressions for Tc in various regimes Gorkov2018 based on the two corresponding coupling constants and , and mean frequencies. We do not in this paper try to generalize expressions for Tc. A primary aim of this paper is to extend the previous analysis for hydrides Quan2019 to the metal-metalloid superconductor MoB2, whose is predicted and observed to be in the 30-35 K range at megabar pressures.
III Structure and Methods
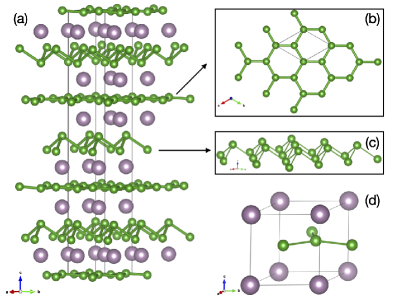
Pressure studies of MoB2 have revealed two polymorphs:MoB2 -MoB2 up to 60 GPa pressure with Tc increasing rapidly from 3 K to 28 K in the 25-60 GPa range, followed by -MoB2 where Tc continues to increase but more slowly, to 32 K at 110 GPa. Both structures include triangular Mo sublattices with honeycomb B6 layers. The high pressure phase has the well known AlB2-structure of MgB2, symmorphic with inversion. The polymorph, pictured in Fig. 1(a-c), differs in the stacking sequence of graphene structure layers of B6, with symmetry allowing puckering of these planes. Alternate B planes are large and small degrees of puckering.
| (GPa) | Phase | (Å) | (Å) | Mo-B1 | Mo-B2 | B1-B1 | B2-B2 | ||||
|---|---|---|---|---|---|---|---|---|---|---|---|
| 0.3 | 3.010 | 21.734 | 0.0747 | 0.3353 | 0.1729 | 2.349 | 2.134 | 1.740 | 1.759 | ||
| 90 | 2.859 | 19.796 | 0.0753 | 0.3297 | 0.1944 | 2.177 | 2.076 | 1.657 | 1.983 | ||
| 90 | 2.884 | [18.102] | - | - | - | 2.247 | 2.247 | 1.665 | 1.665 | ||
| 0.3∗ | 3.010 | 21.734 | 0.0768 | 0.3320 | 0.1817 | 2.390 | 2.281 | 1.739 | 1.857 | ||
| 60∗ | 2.880 | 20.200 | 0.0760 | 0.3319 | 0.1827 | 2.242 | 2.159 | 1.664 | 1.785 | ||
| 90∗ | 2.859 | 19.796 | 0.0756 | 0.3319 | 0.1830 | 2.211 | 2.124 | 1.652 | 1.773 |
The experimental structural parameters and atomic distances MoB2 at 0.3 GPa and 90 GPa are given in Table 1. These values show that 60 GPa pressure in the phase distorts the nearly equal B-B distance at low pressure to dimerized values differing by 20%. In addition, the Mo-B1 distance shortens by almost 8% while the Mo-B2 distance hardly changes, being 8% smaller than the Mo-B distance in the -phase at 90 GPa. The structural transition at 60 GPa thus causes a substantial rearrangement in Mo-B and B-B bonding, with its return to the high symmetry AlB2 structure.
The band structure and Fermi surfaces are studied with the full potential, all-electron code fplo fplo using the semi-local generalized gradient approximation (GGA) GGA exchange-correlation functional. This code uses a basis of pre-determined atomic orbital-like functions, with various numerical techniques to handle the full potential and general charge density of the crystal. These calculations use valence and virtual and orbitals for B, and valence and virtual and orbitals and orbitals for Mo.
The pseudopotential code quantum espresso (QE) QE is used to carry out linear response electron-phonon calculations. The electron band - and phonon branch -meshes are Monkhorst-Pack type with 181818 and 666 points, respectively. The optimized norm conserving pseudopotentials Hamann were used.
IV Electronic structure
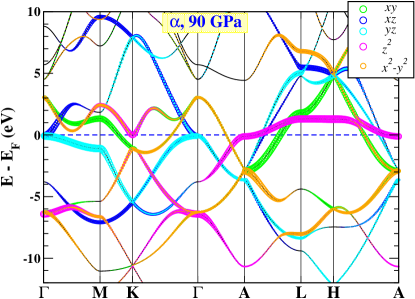
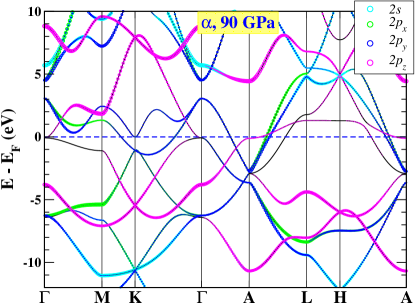
We focus on the highest Tc material – -phase at 90 GPa – with a few results for the critical pressure =60 GPa of the structural transition. Several results for the -phase are presented in the Appendix. The 90 GPa band structure of -MoB2, i.e. the high phase, is shown in Fig. 2 in orbital-projected fatbands fashion. The bands around EF, and in the range -5 eV to +5 eV, are predominantly Mo , with the bandwidth strongly modulated by coupling to B states. States threading the Fermi level have strong but not predominant character; all orbitals have some contribution at EF. The partially filled B - bands are somewhat repelled from the Fermi level region. This behavior is entirely different from MgB2, where Mg donates its electrons to the B bonding bands crossing EF, leaving negligible Mg participation at EF. This strong difference is not surprising, as an open-shell transition metal is nothing like a electropositive divalent - atom.
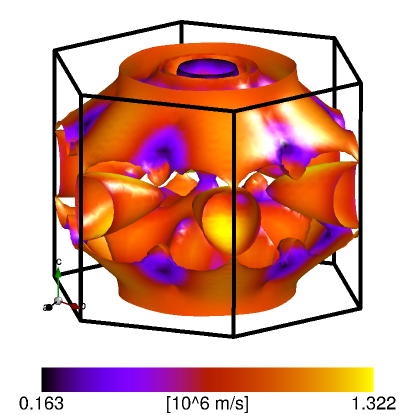
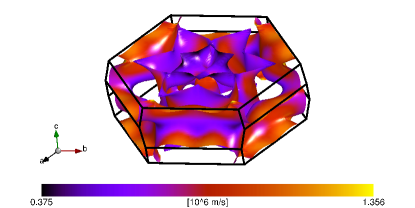
The Fermi surfaces of -MoB2 at 90 GPa, shown in Fig. 3, are comprised of three large, three dimensional (3D) sheets without apparent nesting features. The r.m.s. Fermi velocity is 8 cm/s, with small regions of a low velocity as low as 3 cm/s, and highest values up to 13 cm/s. This range of velocities, several large FSs, and 3D character indicate that a -averaged, “single band” (i.e. single gap) characterization should apply.
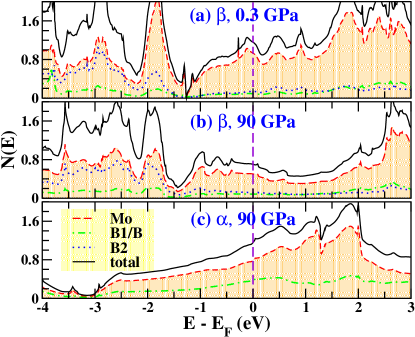
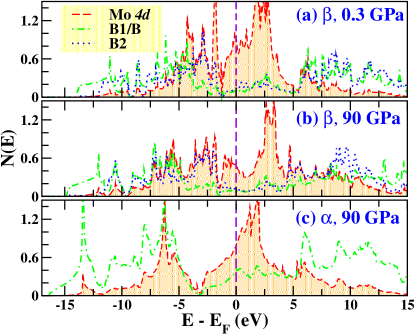
The projected densities of states (PDOS) for (a) at 0.3 GPa, (b) at 90 GPa, and (c) at 90 GPa are displayed in Fig. 4(a,b,c) respectively. The values of N(0), equal to (a) 1.16, (b) 0.70, and (c) 1.16 states per eV, respectively, are 70-80% Mo . The effect of pressure on -MoB2 is primarily to broaden the bands, with some band and DOS rearrangement around EF that lowers N(0) substantially. Recall that this pressure region is where the observed Tc appears and increases substantially, to 28 K. The structural transition from to phase, where the honeycomb layers flatten, changes considerably around EF, leaving a smooth increase from -2.5 eV to +0.5 eV. Experimentally, Tc continues to increase MoB2 , but more modestly, above this pressure to 32 K.
| = | T | ||||||||||
|---|---|---|---|---|---|---|---|---|---|---|---|
| (1/eV-spin) | (eV/Å)2 | (eV/Å2) | (eV/Å) | (meV) | (meV) | (meV/Å2) | (meV) | (K) | (K) | ||
| Total | 0.58 | 21.8 | 36.1 | 23. | 39.5 | 1.67 | 33.7 | ||||
| Mo | 0.38 | 35.1 | 13.6 | 5.9 | 18.2 | 19.7 | 9.9 | 14. | 24.0 | 1.48 | 23.6 |
| B2 | 0.20 | 21.2 | 4.6 | 4.6 | 85.2 | 91.5 | 23.1 | 9. | 15.5 | 0.19 | 0.0 |
V Phonon dispersion and electron-phonon coupling
V.1 The frequency spectrum
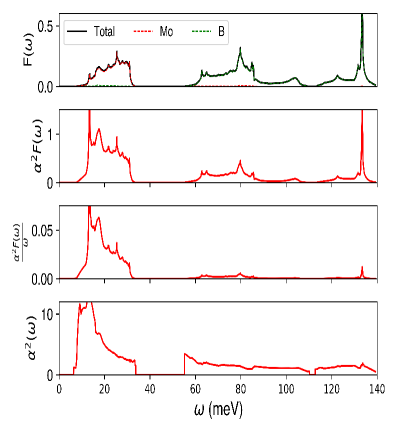
The atom-projected phonon density of states (phDOS), shown in the top panel of Fig. 5, reveals a key aspect of our analysis: the Mo and B modes are disjoint to very good approximation: Mo (acoustic) modes in the 15-35 meV range, and B (optic) modes from 60 meV to 140 meV, with a gap at 115 meV between the lower four and the upper two branches. This atomic separation allows the formalism of Sec. II to apply. Also shown are , , and the ratio .
In the weight is divided 60-40 (Mo, B). This weight is the area emphasized by Leavens and Carbotte leavens , as a simple yet reasonably reliable indication of importance leading to their empirical equation
| (10) |
The area for each atom (Mo, B2) is given, along with the other quantities that are important for superconductivity, in Table 2. The total area =23 meV gives T=39 K: 24 K from Mo, 15 K from B. This is a noticeable overestimate given the previous accuracy of this expression, which can be ascribed to the overestimate of the contribution of B. For reference, in five high Tc metal hydrides over three structural classes at high pressure Quan2019 , the Leavens-Carbotte expression gave impressively good estimates over a range of Tc values of 180-280 K. We now extend this comparison of Mo and B contributions.
V.2 Importance of Mo versus B2
Here we provide a few ways of interpreting the relative importance for Tc of the low and high frequency regions of the spectrum. In , whose integral gives /2, the low frequency Mo weight dominates mightily, within =7.5 (see Table 2), or 15 times larger for Mo than for each B. From the frequency moments given in the table, the net (full spectrum) gives = 21.8 meV, = 36.1 meV, the ratio of 1.66 indicating a large “shape” aspect to the spectrum and resulting coupling. For each atom separately, the shape ratio is: Mo, 1.08; B, 1.07. This small shape factor for B, and the moments themselves, indicate almost negligible effect of the upper two-thirds of in the B region (which is hardly visible in Fig. 5).
Boron contributes (i.e. adds to the Mo contribution) a 13% increase in , a 20% increase in , and a much larger 83% increase in . Recall that “sets the scale” for Tc (in the Allen-Dynes Tc equation), while the increase in increases the denominator in by its square. Including the B contribution fully does offset this somewhat by decreasing the mass factor in ; because it is a compound one cannot be more quantitative, except that the increase in finally is only 13%. On balance, it is clear that B plays a crucial role in the resulting 43% increase in compared to the value for Mo alone, in spite of its seeming near irrelevance in the plot.
MoB2 is thus another example, from the high Tc metal hydrides and several other viewpoints, that so far, raising Tc has been very largely a matter of getting coupling at high frequency, or at least some of the coupling. For the past 50 years, the highest known EP superconductors have had not much larger than two, whereas Tc has increased by a factor of 12 (23 K to 280 K). Meanwhile there has been little progress in reaching the “large ” regime, which is typically considered to be . The importance of increasing has been seriously overvalued in the quest to raise Tc Pickett2021 .
V.3 Frequency dependence of the coupling
The spectra in Fig. 5 are informative. The phDOS is about as might be expected given the nearly factor of nine between the masses. The acoustic modes, up to 35 meV, are essentially all Mo character, the optic (B) modes run from 60 meV to 140 meV. They include three and six branches, respectively. The B modes are split into bond-stretching modes above the small gap at 110 meV, with the bond-bending modes lying below. shows a relative strength in the Mo region and weakness for B. The plot of , which integrates to , makes vivid the dominance of Mo for , from which this dominance might be thought to extend to Tc. As discussed above, the understanding is not really so simple: coupling to B provides almost one-third of Tc when viewed as being on top of the Mo contribution. The B contribution is difficult to see but finally integrates to something useful.
The fourth (lowest) panel provides , how the strength of coupling – including mass and frequency dependence in the matrix elements but independent of the phDOS – is distributed. It is strongest in the (Mo) acoustic region, being strongest in the lower third of the frequency range (the data in these curves below 6 meV is missing due to the numerical cost of handling the low phase space region near the point, which is unimportant for Tc anyway). In the B part of the spectrum, is largest in the lower region, slowly decreasing then leveling off. Notable is that is no different for stretching versus bending modes; in MgB2 the bond stretches are all-important. The average of in each region is related to the electron-ion matrix elements discussed next, though not in a simple manner (note the difference in units).
V.4 Electron-ion matrix elements
EP matrix elements, whose understanding is still at a primitive stage, consist of an electron-ion scattering strength (its rms value after averaging over the FS) divided by a phonon factor (for elements, or for disjoint atomic modes such as in MoB2). At the core is the change in self-consistent electronic potential upon small displacement of an atom, Eq. (5). This change requires the static electronic response, which is available in electronic structure codes from self-consistent linear response methods, but is not yet extracted in any enlightening way. What we find here is that for MoB2,
| (11) |
These are averages over all modes of each atom, obtained because , , and are known for each atom. Further discussion is provided in the next section.
These can be compared with high pressure metal superhydrides, with Tc in the 175-275 K range. In the hydrides Quan2019 it was found that systematics could be obtained if the metal atom contribution was neglected: it raises but decreases frequency moments, with little – and sometimes negative – effect on Tc. Values of ranged from 4.5 eV/Å to 10.5 eV/Å, with values correlating positively (but only roughly) with Tc. There was also a relatively small but positive correlation with increasing pressure, all features yet to be understood because is a derived quantity in this analysis, not separately calculated and analyzed although the capability is essentially in place in existing codes. A simple picture would suggest that higher would lead to more static screening hence a smaller value of , but study of such relationships remains to be done.
V.5 Isotope shift of Tc
Using the formalism of Sec. II.C and our calculated data, we have calculated the individual isotope shift coefficients for Mo and B isotope replacements individually. In BCS theory where there is a single elemental mass, no Coulomb , and no strong coupling or shape factors, this shift is , corresponding to the dependence of the phonon energy scale on the square root of the mass. The calculations were done for =0.13 as in the rest of this study. This value is just a choice as in the middle of the common 0.10-0.15 range. We repeated calculations of this section for =0.10, and Tc by more than 10%. Thus the choice of must be considered when making absolute comparisons with (say) experiment, whereas trends will not be much affected.
The values obtained are
| (12) |
(We note that these values are changed by -0.003 and +0.003 respectively for =0.10.) These values follow the general expectation: Tc is mostly due to the Mo contribution to , much less to the B contribution although it does boost Tc. The changes, for 1 amu change in mass, in the atomic values of and respectively are about 0.5% for Mo (0.1 meV), and 5% (4.5 meV) for B, while and the individual atomic contributions to of course do not change.
A point of interest pertains to the strong coupling and shape factors in the Tc equation alldyn ; recall that =1.67 is strong coupling, and the shape of is bifurcated. These values are =1.09, =1.056, together giving a 15% larger value of Tc than from the ‘modified McMillan equation’ alldyn where these factors are not present.
VI Why MoB2 at 90 GPa is a HTS
VI.1 Background: historical studies
Except for the compressed metal hydrides, electron-phonon superconductors rarely display Tc above 23 K (even under pressure), with MgB2 being the exception. (The mechanisms for metal fullerides and (Ba,K)BiO3 remain unclear, as they may involve Coulomb contributions.) All of the atom-specific factors in are available, and the phonon frequency spectrum and coupling to obtain have been calculated. This enables one to begin to make comparisons with other good superconductors, although such full detailed data is often not available from the publications. We consider Mo in the context of transition metals in the middle of the periodic table, which have dominated the high Tc conventional superconductors.
The conundrum of raising Tc has a substantial, and informative, literature. One has a coupling strength that is to be increased, and a phonon energy scale – we’ll use here – to be increased. However, so increasing the frequency decreases coupling strength, as the square. Increasing enhances the renormalization downward of due to EP coupling, thus decreasing and with many examples of the lattice being driven unstable as Tc increases. This renormalization involves electronic screening, with few general and useful guidelines having emerged. In the expression for in Eq. (4), and have received a great deal of attention, with the scattering strength remaining mostly a mystery. Also, the strong coupling limit alldyn T focuses attention on , and Allen and Dynes noted that high Tc superconductors at that time achieved it by means of large values of .
Essentially all studies of have applied the Gaspari-Györffy (GG) model GG of a rigidly displaced atomic potential treated with scattering theory (rigid muffin-tin approximation). The immediate result of the formalism is a scattering amplitude for each atomic partial wave (angular momentum value 0, 1, 2, 3), weighted by corresponding partial values to give and thereby . Hopfield suggested as an atomic property Hopfield , but it is that is more nearly so since can vary so strongly depending on band details. Phillips suggested Phillips1972 that in binary compounds with widely differing masses, the total coupling can be imagined as contributions from the separate atoms, as described in Sec. II.
The separation outlined in Sec. II was first applied by Klein and Papaconstantopoulos BMK-DAP-1974 to V, Nb, and (Nb,Ta,Hf)C, all superconducting except the latter. Nb, neighboring Mo in the periodic table, had (all in eV/Å) elemental =2.9 where Tc=9.2 K, and 4.5 in the carbide (Tc=11.1 K), a considerable difference especially when squared. The C values, by the way, were very similar to Nb and Ta in the carbides. A following study of Nb and V materials (elements, carbides and nitrides, A15 compounds) BMK1979 concluded that is reasonably considered as an atomic property, equal to 3-3.7 eV/Å throughout these classes, roughly consistent with the quotes above. In the same classes, the value for V materials was 2.4-2.7 eV/Å. Adding to these materials an enlarged set of A15 compounds, it was found that, at least at the GG level, for Nb =3.0-3.8 eV/Å, and for V =2.3-2.6 eV/Å, for wide variations in Tc. Thus seems very much to be an atomic property, at ambient pressure Pickett1982 .
VI.2 Molybdenum
Now we address Mo. Rocksalt MoN, predicted to be a 30 K superconductor, was calculated from GG theory to have =3.5 eV/Å for Mo. It was its very large that resulted in large coupling and high Tc; later it was found calculationally to be elastically unstable Mehl , also surely due to its large . Our analysis for MoB2 provides new data about the importance of atomic scattering. Table II provides the value =5.9 eV/Å, significantly larger than the values for Nb, moreover its square is nearly three times larger than for Mo in MoN. Our observation just above that may be a transferable atomic property does not hold well for Mo when pressure is applied. Perhaps pressure gives important enhancement of . Support for this interpretation has been given by Papaconstantopoulos et al. in their study of H3S Papa2015 , where for pressures from 50-300 GPa the value of for hydrogen increased from 3 eV/Å to nearly 5 eV/Å.
The value for B of 4.6 eV/Å in MoB2 is similarly impressive, though other factors finally result in weak B coupling, as measured by . This is another indication that the integrand strongly penalizes coupling at high frequency: has been overly emphasized in the quest for higher Tc for several decades. This was the crux of the Leavens-Carbotte picture. The relative importance of Mo and B is consistent with observations from earlier in this paper: MoB2 is well characterized as a Mo superconductor enhanced, surprisingly strongly, by some modest coupling to B high frequency modes. How Mo obtains the large value of , viz. what is operating in the pressure response of the displacement of potential, remains the important question for further study. This seems, given that is not large, to be the attribute responsibility for 32 K superconductivity in MoB2.
VII Summary
MoB2 is one of several transition metal diborides that have been studied, hoping without success to find Tc approaching or possibly exceeding that of MgB2. In fact, MoB2 at ambient pressure is not superconducting. High pressure produces an onset and impressive increase of Tc in the -phase, after which a transformation to the higher symmetry -phase (AlB2 structure type) occurs and Tc continues to rise, but more slowly. Like most other TM diborides with this AlB2 structure, MoB2 is a three dimensional, multiple Fermi surface metal with very strong metal character. Also similarly, states at and around the Fermi level are primarily Mo in character. The theoretical value of Tc at 90 GPa is in excellent agreement with the experimental data.
A main, and immediate, conclusion here is that MoB2 is not only very different from MgB2 as anticipated, it is also different from the metal hydrides with Tc approaching room temperature under pressure, with analysis facilitated Quan2019 by the large mass difference of the atoms, as occurs in MoB2. Like the hydrides, MoB2 has disjoint metal and light atom phonon spectra that enable simplification of analysis of the origins of electron-phonon coupling and superconductivity. However, in the hydrides it is best to neglect the mutually compensating metal atom contributions Quan2019 , after which understanding arises from the metallic hydrogen properties alone Quan2019 . In MoB2, the two atom types cooperate to produce the observed 32 K superconductivity. We have found that even weak coupling from the B atoms contributes substantially, by increasing frequency moments with minor coupling strength that raises Tc by 43%. Individual atomic contributions to can be misleading when wanting to understand contributions to Tc. In hydrides, the metal contribution of 15% is useless; in MoB2, the B contribution of a similar fraction is important, because it arises from high frequency.
These results – the experimental data and theoretical analysis – encourage future studies of TM diborides at higher pressure. Some of them should display a larger value of , which is a positive contributor until it promotes electronic (magnetic, structural) instability and thus return to a less favorable material. Future work should include more attention to the electron scattering amplitude , which our analysis as been able to unravel from other calculational data. Is Mo the best element for providing a large value of ?
The same separation of the phonon spectrum into atomic contributions allows simple calculations of the isotope shift of Tc for each atom, without full recalculation of phonon frequencies and matrix elements. It is found, as likely expected, that the Mo isotope shift is dominant and close to the BCS value, while the B shift is minor. This separation corresponds more closely to the atomic contributions to than to the impact of the coupling on Tc. Given that B boosts Tc so effectively, it is somewhat of a puzzle why its isotope shift is so small.
The analysis provided by Sec. II has revealed the source of the high Tc of MoB2. The Fermi level density of states is ordinary, the phonon spectra as summarized in the atomic values of are not unusual. What is distinctive is the electron-displaced atom scattering factor , which is 2-3 times larger than in zero pressure compounds based on comparable transition metal atoms (V, Nb, Mo) in other compounds. The study of is the primary, perhaps the only, factor yet to be understood for conventional superconductors Pickett2021 .
The calculated behavior of the -phase Tc(P) is an item for future study. The observed increase in Tc, from zero to 28 K for pressures of 0.3 GPa to 60 GPa, raises interesting questions, more so because we calculate a strongly decreasing in this same pressure range. It seems that this increase in Tc must be due partially to an increase in frequency moments, but may require a strong increase in matrix elements as well. is, after all, one of the important factors in and it is unclear how a strong decrease in can be compensated by other factors in . Evidently confirmation of the observed behavior by another experimental group, preferably with somewhat different probes, is highly desirable.
VIII Acknowledgment
We acknowledge Yanpeng Qi for providing and clarifying unpublished structure information. D. A. Papaconstantopoulos provided useful comments on the manuscript. Y.Q. thanks Stony Brook Research Computing and Cyberinfrastructure, and the Institute for Advanced Computational Science at Stony Brook University for access to the innovative high-performance Ookami computing system, which was made possible by National Science Foundation grant 1927880. Y.Q. and W.E.P. have also used the computational resources on the Pittsburgh Supercomputing Center machine bridges2, supported by NSF TG-DMR 180112. K.W.L. was supported by National Research Foundation of Korea Grant No. NRF2019R1A2C1009588. W.E.P acknowledges support from U.S. National Science Foundation Grant DMR 1607139.
IX appendix
Because superconductivity in MoB2 is a new research area, and especially that the rise in Tc in the phase will attract more study, we provide more results on the basic electronic structure: band structure, density of states, and Fermi surfaces.
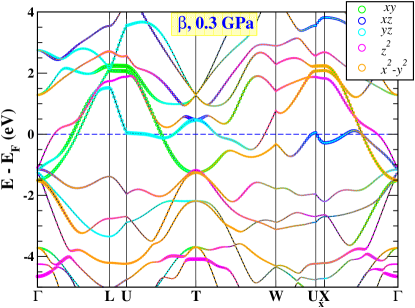
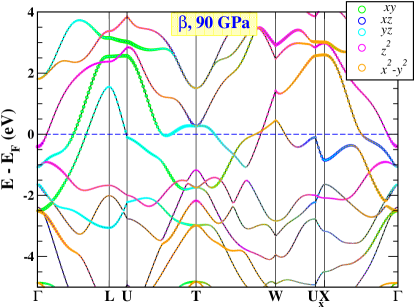
In Fig. 6 the band structures of the rhombohedral -phase are compared at low and at 90 GPa pressures. While there are many detailed changes, in both cases there are multiple Fermi surfaces, including large ones. The increase in bandwidth with volume reduction is not so obvious in the figure, but the states at reveal that the =0 eigenvalues spread in energy, and several have disappeared below the panel of 90 GPa bands. The average of the density of states will decrease accordingly.
The corresponding DOSs in Fig. 7 provide the basic picture. These results indicate, first, that there are rather modest changes in the -phase given these are at low and 90 GPa pressure. The change in is however substantial, being about half at high pressure where Tc is observed to have increased incredibly. Since nominally is proportional to , this change is unexpected and unexplained (our focus in the main text has been on the -phase). Large changes in the frequency spectrum and coupling are needed to clarify the origin of the emergent superconductivity.
The structural transition occurs primarily at 60 GPa and certainly is complete at 90 GPa. The difference between and at 90 GPa, also shown in Fig. 7, are obvious, with changes in position of large spectral density and a large increase in . Since no discontinuity in Tc(P) is apparent, this area is another one of interest for further study.
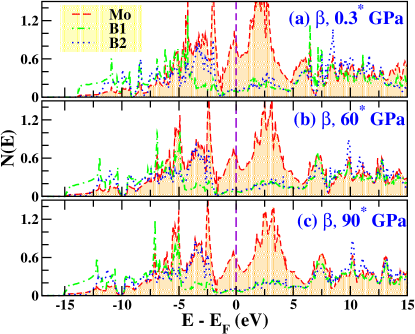
Figure 8 shows similar curves, but we focus on the two representative pressures, the critical pressure =60 GPa of the structural transition, and =90 GPa, which is representative of the high Tc -phase. structures in the -phase, and also comparing the DOS in the phase at 60 GPa and 90 GPa. This figure illustrates, as mentioned in the main text, that within a given structure, the DOS varies regularly with pressure for MoB2. The change at the phase transition provides a different picture of the Mo bands (which of course are hybridized with B states). A near-zero in at -3 eV suggests a partition between strongly bonding states below, and less bonding states in the region of EF. The B DOS reflects a similar behavior. This character is likely connected with the buckling of the B honeycomb layers, with their changes in Mo-B and B-B bond lengths provided in the main text. For these relaxed structures, the variation of is regular; interestingly, EF remains at a sharp peak while the peak, and , lose amplitude with increasing pressure.
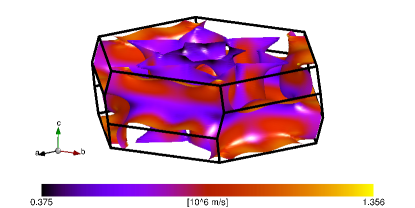
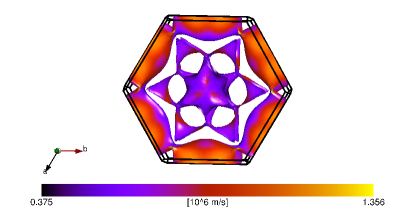
Lastly, Fig. 9 provides three angles of view of the multisheeted -phase Fermi surfaces at 90 GPa. Some two-dimensional character may be arising; the FS has more sheets crossing the top face than the side faces. The top view (center panel) confirms this, as there are “columns” of 2D slices with no FS, while the top panel – a near side view – shows nothing like this. The third view provides yet another indication of the degree of two dimensionality. This character, which is not evident from the band structures, is distinct from that of the phase, discussed in the main text.
References
- (1) J. Nagamatsu, N. Nakagawa, T. Muranaka, Y. Zenitani, and J. Akimitsu, Superconductivity at 39 K in magnesium diboride, Nature (London) 410, 63 (2001).
- (2) J. M. An and W. E. Pickett, Superconductivity of MgB2: Covalent Bonds Driven Metallic, Phys. Rev. Lett. 86, 4366 (2001).
- (3) J. Kortus, I. I. Mazin, K. D. Belashchenko, V. P. Antropov, and L. L. Boyer, Superconductivity of Metallic Boron in MgB2, Phys. Rev. Lett. 86, 4656 (2001).
- (4) K. P. Bohnen, R. Heid, and B. Renker, Phonon Dispersion and Electron-Phonon Coupling in MgB2 and AlB2, Phys. Rev. Lett. 86, 5771 (2001).
- (5) Y. Kong, O. V. Dolgov, O. Jepsen, and O. K. Andersen, Electron-phonon interaction in the normal and superconducting states of MgB2, Phys. Rev. B 64, 020501 (2001).
- (6) A. Y. Liu, I. I. Mazin, and J. Kortus, Beyond Eliashberg Superconductivity in MgB2: Anharmonicity, Two-Phonon Scattering, and Multiple Gaps, Phys. Rev. Lett. 87, 087005 (2001).
- (7) H. J. Choi, D. Roundy, H. Sun, M. L. Cohen, and S. G. Louie, The origin of the anomalous superconducting properties of MgB2, Nature (London) 418, 758 (2002).
- (8) T. Yildirim O. Gülseren, J. W. Lynn, C. M. Brown, T. J. Udovic, Q. Huang, N. Rogado, K. A. Regan, M. A. Hayward, J. S. Slusky, T. He, M. K. Haas, P. Khalifah, K. Inumaru, and R. J. Cava, Giant Anharmonicity and Nonlinear Electron-Phonon Coupling in MgB2: A Combined First-Principles Calculation and Neutron Scattering Study, Phys. Rev. Lett. 87, 037001 (2001).
- (9) H. J. Choi, D. Roundy, H. Sun, M. L. Cohen, and S. G. Louie, First-principles calculation of the superconducting transition in MgB2 within the anisotropic Eliashberg formalism, Phys. Rev. B 66, 020513 (2002).
- (10) H. Rosner, W. E. Pickett, S.-L. Drechsler, A. Handstein, G. Behr, G. Fuchs, K. Nenkov, K.-H. Müller, and H. Eschrig, Electronic structure and weak electron-phonon coupling in TaB2, Phys. Rev. B 64, 144516 (2001).
- (11) C. Pei, J. Zhang, Q. Wang, Y. Zhao, L. Gao, C. Gong, S. Tian, R. Luo, Z.-y. Lu, H. Lei, K. Liu, and Y. Qi, Pressure-indiced Superconductivity at 32 K in MoB2, arXiv:2105.13250.
- (12) L. E. Muzzy. M. Avdeev, G. Lawes, M. K. Haas, H. W. Zandbergen, A. P. Ramirez, J. D. Jorgensen, and R. J. Cava, Structure and superconductivity in Zr-stabilized, nonstoichiometric molybdenum diboride, Physica C: Superconductivity 382, 153 (2002).
- (13) H. Tang, X. Gao, J. Zhang, B. Gao, W. Zhou, B. Yan, X. Li, Q. Zhang, S. Peng, D. Huang, L. Zhang, X. Yuan, B. Wan, C. Peng, L. Wu, D. Zhang, H. Liu, L. Gu, F. Gao, T. Irifune, R. Ahuja, H.-K. Mao, and H. Gou, Boron-Rich Molybdenum Boride with Unusual Short-Range Vacancy Ordering, Anisotropic Hardness, and Superconductivity, Chem. Mater. 32, 459 (2020)
- (14) Z.-A. Ren, S. Kuroiwa, Y.Tomita, and J. Akimitsu, Structural phase evolution and superconductivity in the non-stoichiometric intermetallic compound niobium diboride, Physica C: Superconductivit 468, 411 (2008).
- (15) J. Guo, G. Lin, S. Cai, C. Xi, C. Zhang, W. Sun, Q. Wang, K. Yang, A. Li, Q. Wu, Y. Zhang, T. Xiang, R. J. Cava, and L. Sun, Record-High Superconductivity in Niobium-Titanium Alloy, Adv. Mater. 31, 1807240 (2019).
- (16) D. Duan, Y. Liu, F. Tian, D. Li, X. Huang, Z. Zhao, H. Yu, B. Liu, W. Tian, and T. Cui, Pressure-induced metalization of dense (H2S)2H2 with high-Tc superconductivity, Sci. Rep. 4, 6968 (2014).
- (17) A. P. Drozdov, M. I. Eremets, I. A. Troyan, V. Ksenofontov, and S. I. Shylin, Conventional superconductivity at 203 kelvin at high pressures in the sulfur hydride system, Nature (London) 525, 73 (2015).
- (18) M. Einaga, M. Sakata, T. Ishikawa, K. Shimizu, M. I. Eremets, A. P. Drozdov, I. A. Troyan, N. Hirao, and Y. Ohishi, Crystal structure of the superconducting phase of sulfur hydride. Nat. Phys. 12, 835 (2016).
- (19) D. Duan, Y. Liu, Y. Ma, Z. Shao, B. Liu, and T. Cui, Structure and superconductivity of hydrides at high pressure, Natl. Sci. Rev. 4, 121 (2017).
- (20) A. P. Drozdov, V. S. Minkov, S. P. Besedin, P. P. Kong, M. A. Kuzovnikov, D. A. Knyazev, and M. I. Eremets, Superconductivity at 215 K in lanthanum hydride at high pressures, arXiv:1808.07039 (2018).
- (21) M. Somayazulu, M. Ahart, A. K Mishra, Z. M. Geballe, M. Baldini, Y. Meng, V. V. Struzhkin, and R. J. Hemley, Evidence for superconductivity above 260 K in lanthanum superhydride at megabar pressures, Phys. Rev. Lett. 122, 027001 (2019).
- (22) A. P. Drozdov, P. P. Kong, V. S. Minkov, S. P. Besedin, M. A. Kuzovnikov, S. Mozaffari, L. Balicas, F. Balakirev, D. E. Graf, V. P. Prakapenka, E. Greenberg, D. A. Knyazev, M. Tkacz, and M. I. Eremets, Superconductivity at 250 K in lanthanum hydride under high pressures, Nature (London) 569, 528 (2019).
- (23) Y. Li, J. Hao, H. Liu, Y. Li, and Y. Ma, The metallization and superconductivity of dense hydrogen sulfide, J. Chem. Phys. 140, 174712 (2014).
- (24) L. Boeri, R. Hennig, P. Hirschfeld, G. Profeta, A. Sanna, E. Zurek, W. E. Pickett, M. Amsler, R. Dias, M. I. Eremets et al., The 2021 Room-Temperature Roadmap, J. Phys.: Condens. Matter (in press, 2021).
- (25) N. W. Ashcroft, Hydrogen Dominant Metallic Alloys: High Temperature Superconductors?, Phys. Rev. Lett. 92, 187002 (2004).
- (26) D. A. Papaconstantopoulos, B. M. Klein, M. J. Mehl, and W. E. Pickett, Cubic H3S around 200 GPa: an atomic hydrogen superconductor stabilized by sulfur, Phys. Rev. B 91, 184511 (2015).
- (27) I. Errea, M. Calandra, C. J. Pickard, J. Nelson, R. J. Needs, Y. Li, H. Liu, Y. Zhang, Y. Ma, and F. Mauri, High-pressure hydrogen sulfide from first principles: a strongly anharmonic phonon-mediated superconductor, Phys. Rev. Lett. 114, 157004, (2015).
- (28) J. A. Flores-Livas, A. Sanna, and E. K. U. Gross, High temperature superconductivity in sulfur and selenium hydrides at high pressure, Eur. Phys. J. B 89, 63 (2016).
- (29) N. Bernstein, C. S. Hellberg, M. D. Johannes, I. I. Mazin, and M. J. Mehl, What superconducts in sulfur hydrides under pressure and why, Phys. Rev. B 91, 060511(R) (2015).
- (30) R. Akashi, M. Kawamura, S. Tsuneyuki, Y. Nomura, and R. Arita, First-principles study of the pressure and crystal-structure dependences of the superconducting transition temperature in compressed sulfur hydrides, Phys. Rev. B 91, 224513 (2015).
- (31) Y. Quan and W. E. Pickett, van Hove singularities and spectral smearing in high temperature superconducting H3S, Phys. Rev. B 93, 104526 (2016).
- (32) Y. Quan, S. S. Ghosh, and W. E. Pickett, Compressed hydrides as metallic hydrogen superconductors, Phys. Rev. B 100, 184505 (2019).
- (33) P. B. Allen, Neutron spectroscopy of superconductors, Phys. Rev. B 6, 2577 (1972).
- (34) P. B. Allen and R. C. Dynes, Transition temperature of strong-coupled superconductors reanalyzed, Phys. Rev. B 12, 905 (1975).
- (35) W. L. McMillan, Transition temperature of strong-coupled superconductors, Phys. Rev. B 167, 331 (1968).
- (36) C. R. Leavens and J. P. Carbotte, An important parameter in high-temperature superconductivity, J. Low Temp. Phys. 14, 195 (1974).
- (37) The Leavens-Carbotte expressions neglects the effect, so consideration of this expression should take that into account.
- (38) G. Bergmann and D. Rainer, The sensitivity of the transition temperature to changes in , Z. f. Physik 263, 59 (1973).
- (39) J. J. Hopfield, Angular momentum and transition-metal superconductivity, Phys. Rev. 168, 443 (1969).
- (40) F. Giustino, Electron-phonon interactions from first principles, Rev. Mod. Phys. 89, 015003 (2017).
- (41) P. B. Allen and B. Mitrović, in Solid State Physics Vol. 37, (Academic Press, 1982), pp. 2-92. See Secs. 13 and 14 for discussion of approximate Tc equations, including effects of different frequency regions.
- (42) G. Gaspari and B. L. Györffy, Electron-phonon interactions, resonances, and superconductivity in transition metals, Phys. Rev. Lett. 28, 801 (1972).
- (43) F. Peng, Y. Sun, C. J. Pickard, R. J. Needs, Q. Wu, and Y. Ma, Hydrogen clathrate structures in rare earth hydrides at high pressures: possible route to room-temperature superconductivity, Phys. Rev. Lett. 119, 107001 (2017).
- (44) H. Liu, I. I. Naumov, R. Hoffmann, N. W. Ashcroft, and R. J. Hemley, Potential high-Tc superconducting lanthanum and yttrium hydrides at high pressure, Proc. Natl. Acad. Sci. USA 114, 6990 (2017).
- (45) T. Bi, N. Zarifi, T. Terpstra, and E. Zurek, The search for superconductivity in high pressure hydrides, Reference Module in Chemistry, Molecular Sciences, and Chemical Engineering, arXiv:1806.00163 (2019). https://doi.org/10.1016/B978-0-12-409547-2.11435-0
- (46) E. Zurek and T. Bi, High-temperature superconductivity in alkaline and rare earth polyhydrides at high pressure: a theoretical perspective, J. Chem. Phys. 150, 050901 (2018).
- (47) L. P. Gor’kov and V. Z. Kresin, Colloquium: High pressure and road to room temperature superconductivity, Rev. Mod. Phys. 90. 011001 (2018).
- (48) K. Koepernik and H. Eschrig, Full-potential nonorthogonal local-orbital minimum-basis band-structure scheme, Phys. Rev. B 59, 1743 (1999).
- (49) J. P. Perdew, K. Burke, and M. Ernzerhof, Generalized gradient approximation made simple, Phys. Rev. Lett. 77, 3865 (1996).
- (50) P. Giannozzi, O. Andreussi, T. Brumme, O. Bunau, M. B. Nardelli, M. Calandra, R. Car, C. Cavazzoni, D. Ceresoli, M. Cococcioni et al., Advanced capabilities for materials modelling with quantum espresso, J. Phys.: Condens. Matter 29, 465901 (2017).
- (51) D. R. Hamann, Optimized norm-conserving Vanderbilt pseudopotentials, Phys. Rev. B 88, 085117 (2013).
- (52) J. C. Phillips, in Superconductivity in d- and f-Band Metals, AIP Conference Proceedings No. 4, edited by D. H. Douglass, Jr. (American Institute of Physics, New York, 1972).
- (53) B. M. Klein and D. A. Papaconstantopoulos, Electron-Phonon Interaction in Transition Metals and Transition-Metal Carbides, Phys. Rev. Lett. 32, 1193 (1974). The anomlously large value of for Hf in HfC reported in this paper carries large uncertainty due to the small value of , more than an order of magnitude smaller than the other carbides.
- (54) B. M. Klein, L. L. Boyer, and D. A. Papaconstantopoulos, Superconducting Properties of A15 Compounds Derived from Band-Structure Results, Phys. Rev. Lett. 42, 530 (1979).
- (55) W. E. Pickett, Transferability and the electron-phonon interaction: A reinterpretation of the rigid-muffin-tin approximation, Phys Rev. B 25, 745 (1982).
- (56) J. Chen, L. L. Boyer, H. Krakauer, and M. J. Mehl, Elastic constants of NbC and MoN: Instability of B1-MoN, Phys. Rev. B 37, 3295 (1988).