A shallow dark matter halo in Ultra Diffuse Galaxy AGC 242019:
are UDGs structurally similar to low surface brightness galaxies?
Abstract
A central question regarding Ultra Diffuse Galaxies (UDGs) is whether they are a separate category to Low Surface Brightness (LSB) galaxies, or just their natural continuation towards low stellar masses. In this letter, we show that the rotation curve of the gas rich UDG AGC 242019 is well fit by a dark matter halo with inner slope that asymptotes to -0.54, and that such fit provides a concentration parameter that matches theoretical expectations. This finding, together with previously works in which shallow inner profiles are derived for UDGs, shows that the structural properties of these galaxies are like other observed LSBs. UDGs show slowly rising rotation curves and this favours formation scenarios in which internal processes, such as SNae driven gas outflows, are acting to modify UDGs profiles.
1 Introduction
Low surface brightness galaxies (LSBs) generally show slowly rising rotation curves (e.g. Impey & Bothun 1997; Bothun et al. 1997). Thanks to their low baryonic content, it is possible to use the gas dynamics to faithful estimate their dark matter distribution, which turn out to be best fit by models with a flat inner density (e.g. de Blok et al. 2001, 2008; Oh et al. 2011; Lelli et al. 2016; Katz et al. 2017). Empirically based models for such profiles have largely used inner “cores” which asymptote to a slope of zero at the lowest radii (Burkert 1995). By contrast, dark matter halos that form within gravity only cosmological simulations have “cuspy” inner density profiles, which asymptote to a slope of minus one (Navarro et al. 1996b, the “NFW” profile).
More recent theoretical models based on hydrodynamical simulations within cold dark matter cosmology have shown that outflows of gas can cause the expansion of dark matter (e.g. Navarro et al. 1996a; Read & Gilmore 2005; Governato et al. 2010; Macciò et al. 2012; Pontzen & Governato 2012). Such models allow a larger range of inner densities, which depend primarily on the stellar and total mass of the galaxy (Di Cintio et al. 2014b, a; Tollet et al. 2016; Chan et al. 2015). Such mass dependent density profiles have been shown to provide better fits to the rotation curves of observed galaxies than the self-similar profiles found in N-body simulations (Katz et al. 2017; Lazar et al. 2020).
Ultra diffuse galaxies (UDGs) are an interesting class of galaxies, not only due to the difficulties in finding (e.g. Bothun et al. 1991, 1997; van Dokkum et al. 2015; Román & Trujillo 2017) and analysing them (e.g. Ruiz-Lara et al. 2018; Forbes et al. 2021), but because their diffuse baryonic component allows the underlying dark matter density profiles to be well constrained, particularly when there is sufficient gas within a disk that allows the measurement of rotation velocities (Mancera Piña et al. 2020; Shi et al. 2021). Various claims have been made about unusual properties of UDGs, such as unusually large (van Dokkum et al. 2016) or small (van Dokkum et al. 2018) quantities of dark matter (see however Trujillo et al. 2019 and Montes et al. 2020 for a rebuttal of these claims), and the fact that some UDGs seem to fall off the baryonic Tully-Fisher relation (Mancera Piña et al. 2020).
Different formation mechanisms have been proposed for UDGs and more generally for LSBs. Scenarios that invoke environmental effects, such as tidal heating and ram pressure stripping, are most relevant for UDGs found within clusters or groups (Jiang et al., 2019; Martin et al., 2019; Carleton et al., 2019; Tremmel et al., 2020; Sales et al., 2020), while for isolated field UDGs it has been proposed that they may form in the high spin tail haloes of a regular LSB dwarf population (Amorisco & Loeb, 2016), or that fluctuations in the gravitational potential, driven by galactic outflows, could be able to expand the stellar populations within such galaxies (Di Cintio et al. 2017; Chan et al. 2018 see also Teyssier et al. 2013). Finally, some particular merger configurations can add angular momentum to the disk and/or a temporary boost in spin, and cause star formation to be redistributed to the outskirts of galaxies (Di Cintio et al., 2019; Wright et al., 2021).
These formation mechanisms would presumably predict different dark matter density profiles. If caused by high spin, the process of accreting high angular momentum gas would not affect the underlying dark matter. However, one may expect a low concentration halo in such cases (Macciò et al., 2007) although the existence of a relation between spin and concentration is not entirely settled: it has been suggested the relation may be due to unrelaxed systems (Neto et al. 2007; Macciò et al. 2007). Regarding the other scenario, if a stellar distribution had been affected by feedback processes, one could expect the dark matter to also be expanded. This means that it is interesting to measure the underlying mass profiles of UDGs in order to discriminate amongst formation scenarios.
Furthermore, given that it is well established that LSB galaxies tend to have relatively flat inner density profiles, it is important to determine whether UDGs have similar properties, which would favour a close relation between these two classes of galaxies, and may indicate that they are better considered as a single class of galaxies (see McGaugh 1996).
A recent study by Shi et al. 2021, hereafter Shi21, has claimed that the gas rich UDG AGC 242019, identified within the ALFALFA survey of HI galaxies (Leisman et al., 2017), has a well resolved rotation curve that is best fit by a cuspy NFW profile. However, their recovered fit provides a concentration of the dark matter halo as low as 2, a value which is more than 5 off of the predicted c-M relation at such masses (e.g. Dutton & Macciò 2014).
In this letter, we show instead that galaxy AGC 242019 has a rotation curve well fitted by a dark matter halo with inner slope that asymptotes towards -0.54, and that such fit provides a concentration parameter that is far closer to what is theoretically expected. This finding, together with previously reported works in which a shallow inner profile is derived for UDGs (Leisman et al., 2017; van Dokkum et al., 2019) favours a formation scenario in which inner processes are acting to modify the UDGs inner profiles (Di Cintio et al., 2017; Chan et al., 2018), and confirms that UDGs are like observed LSBs: they show slowly rising rotation curves.
The paper is organised as follows: data and methods are introduced in Section 2, the results are presented in Section 3, while a conclusions is discussed in Section 4.
2 Data and Methods
Found by the Arecibo Legacy Fast ALFA (ALFALFA) survey of HI galaxies (Leisman et al. 2017), AGC 242019 is a UDG with stellar mass 1.37108M⊙, HI mass 8.51108M⊙ and star formation rate 8.210-3M⊙ yr-1.
The rotation velocity for the galaxy was derived by Shi21 from HI data using the Karl G. Jansky Very Large Array, and H data from the Wide-Field Spectrograph on the Australian National University 2.3 m telescope. Details of the data and modelling are found in Shi21, who applied a tilted-ring model to the HI 3-D datacube with 3DBarolo (Di Teodoro & Fraternali 2015) and combined this with a rotation curve derived from the H data by assuming the same ring parameters. In this study we simply take the derived rotation curve and corresponding density profile at face value. We use the fiducial model of Shi21, but our results are qualitatively robust to to their models that use different mass to light ratios, distances and disc heights, with only small quantitive changes.
We then use a double power law density profile (Jaffe, 1983; Merritt et al., 2006), that has been shown to provide excellent results on a large variety of simulated and observed galaxies (Di Cintio et al., 2014b; Katz et al., 2017), to fit the data:
| (1) |
where is the scale radius and the scale density. and are characteristics of each halo, related to their mass and formation time (e.g. Bullock et al., 2001; Macciò et al., 2007). The inner and outer regions have logarithmic slopes and , respectively, while regulates how sharp the transition is from the inner to the outer region. The NFW profile has .
3 Results
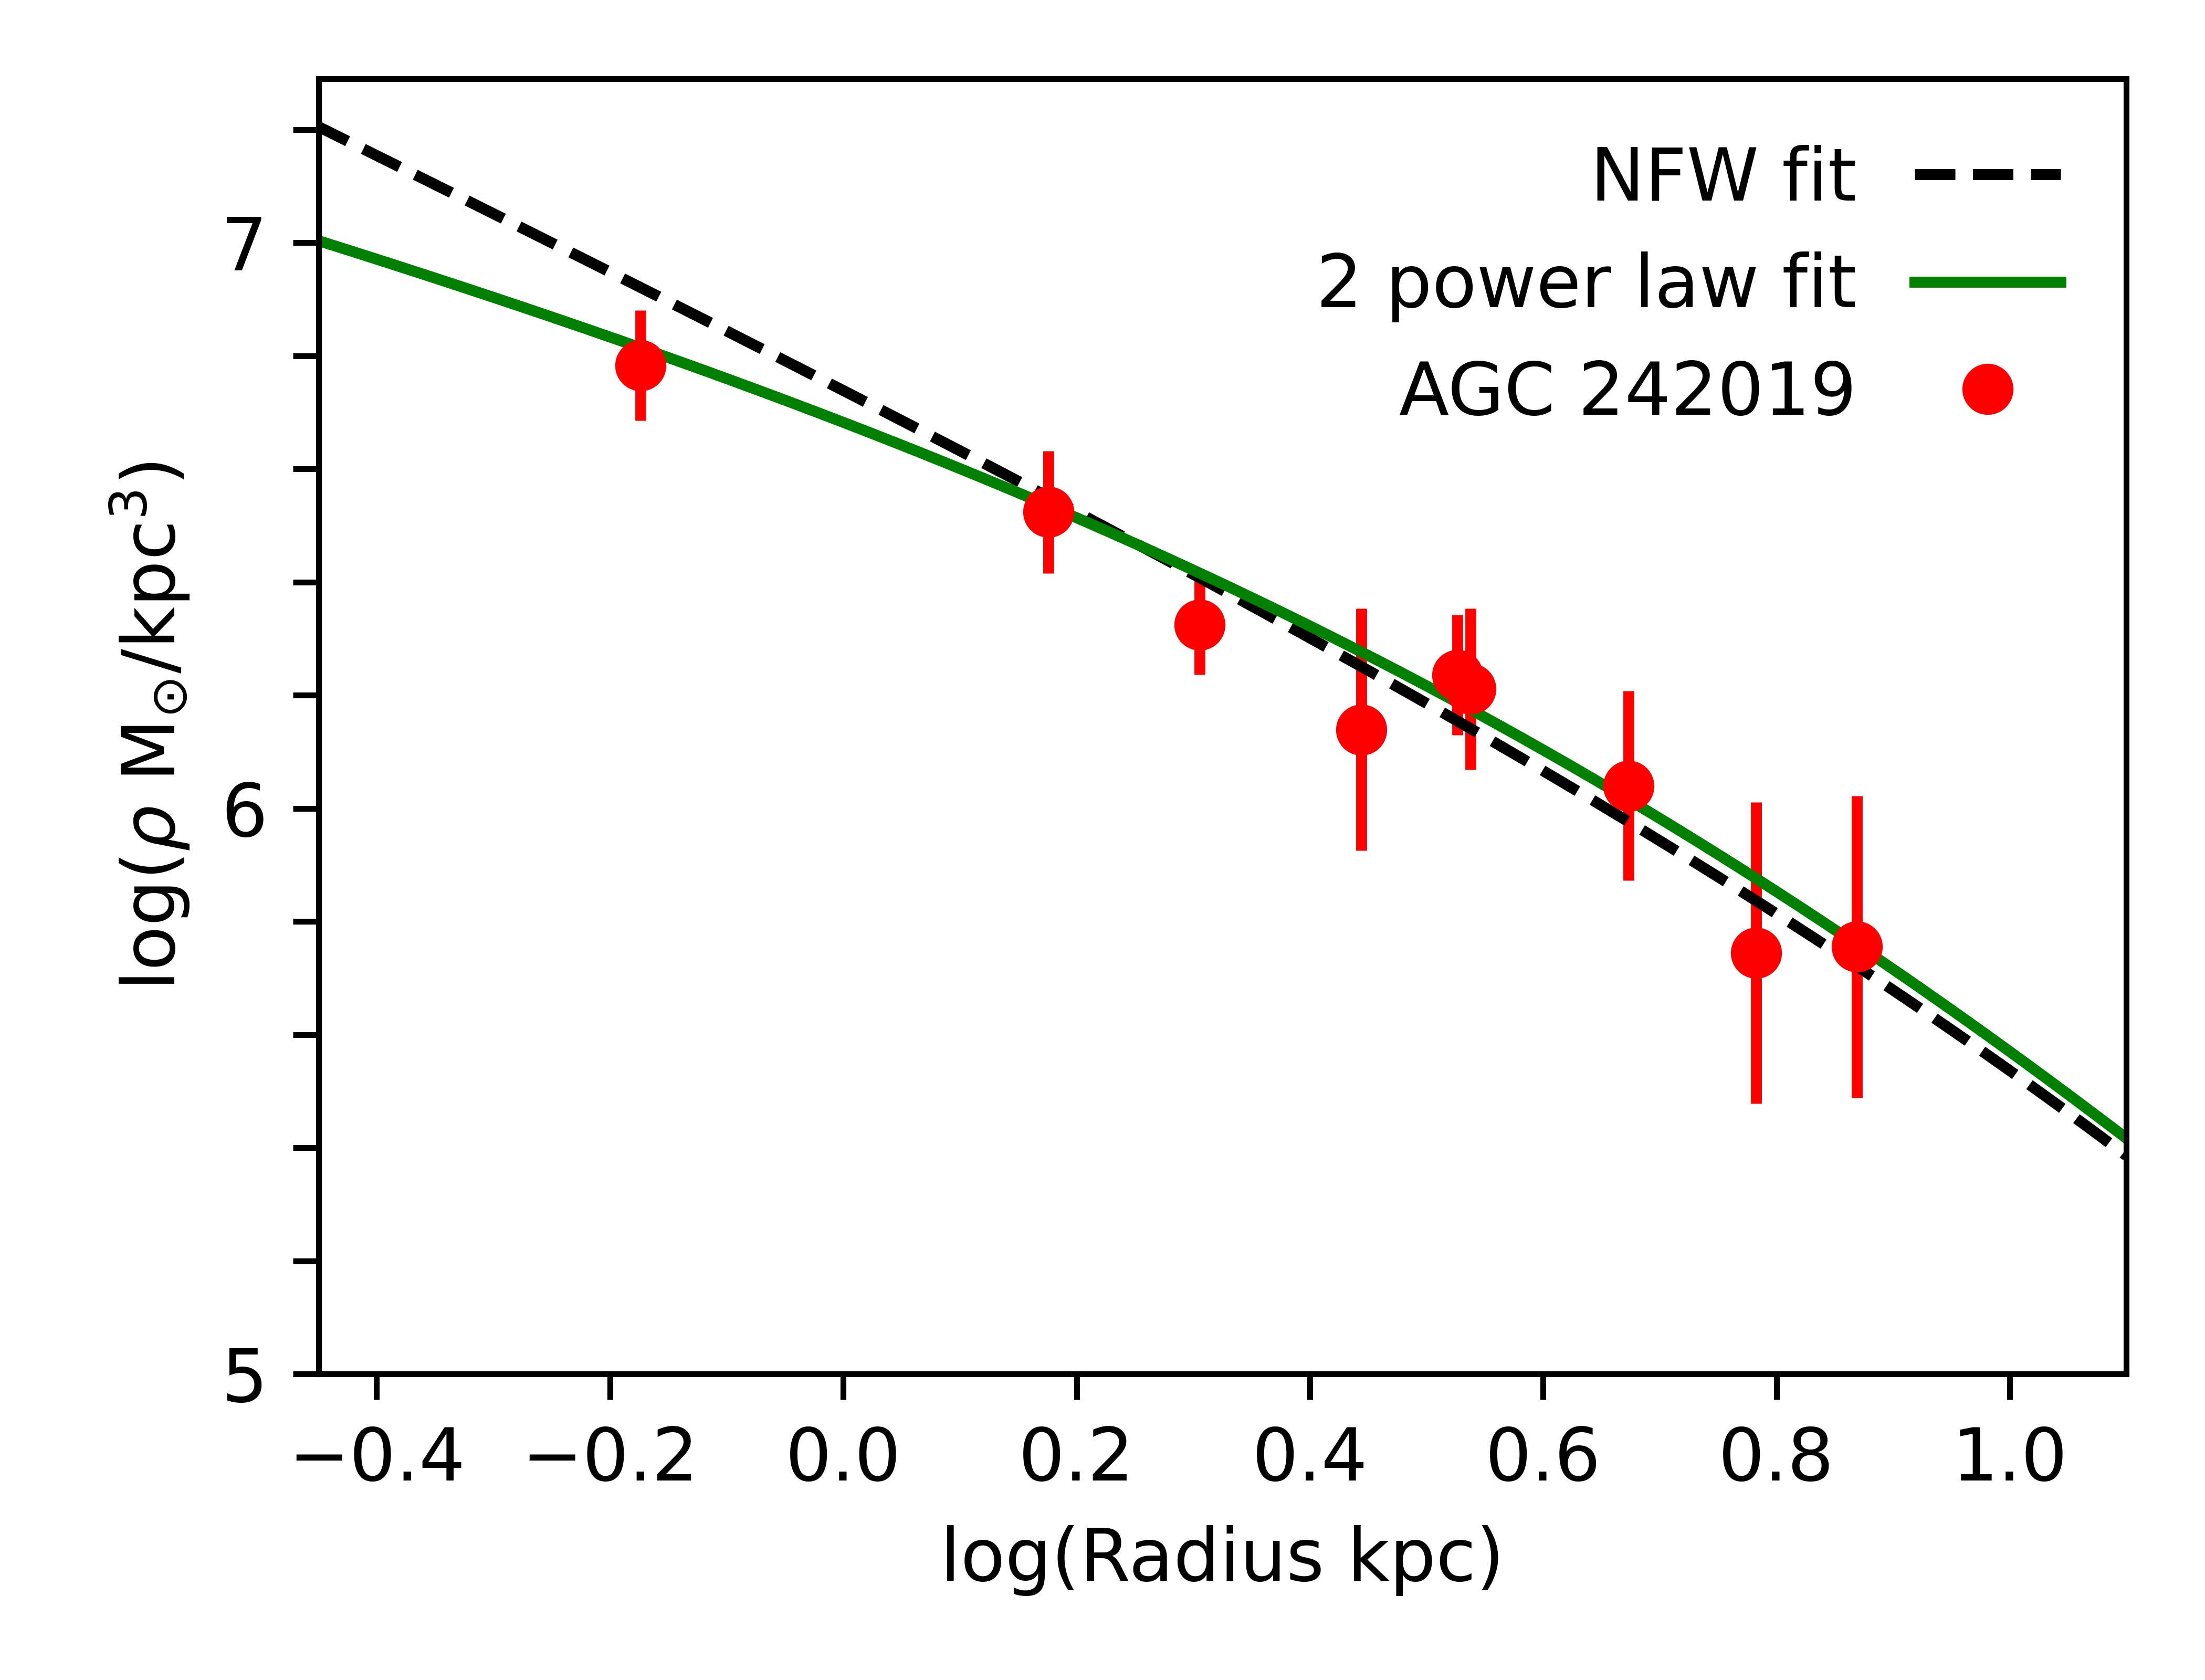
Figure 1 shows the DM density profile for AGC 242019 taken from Shi21, as red circles. Our two power law fit is shown as a solid green line. The fit has Mhalo=2.881010M⊙, scale radius = 6.4 kpc, concentration = 10.1, inner slope = 0.54, outer slope = 2.15 and transition parameter = 0.89. The NFW fit derived in Shi21 is shown as a dashed black line, which has Mhalo = 3.51010M⊙, = 33.3 kpc and = 2.0. The reduced for the power law and NFW fits were 0.2 and 0.5 respectively.
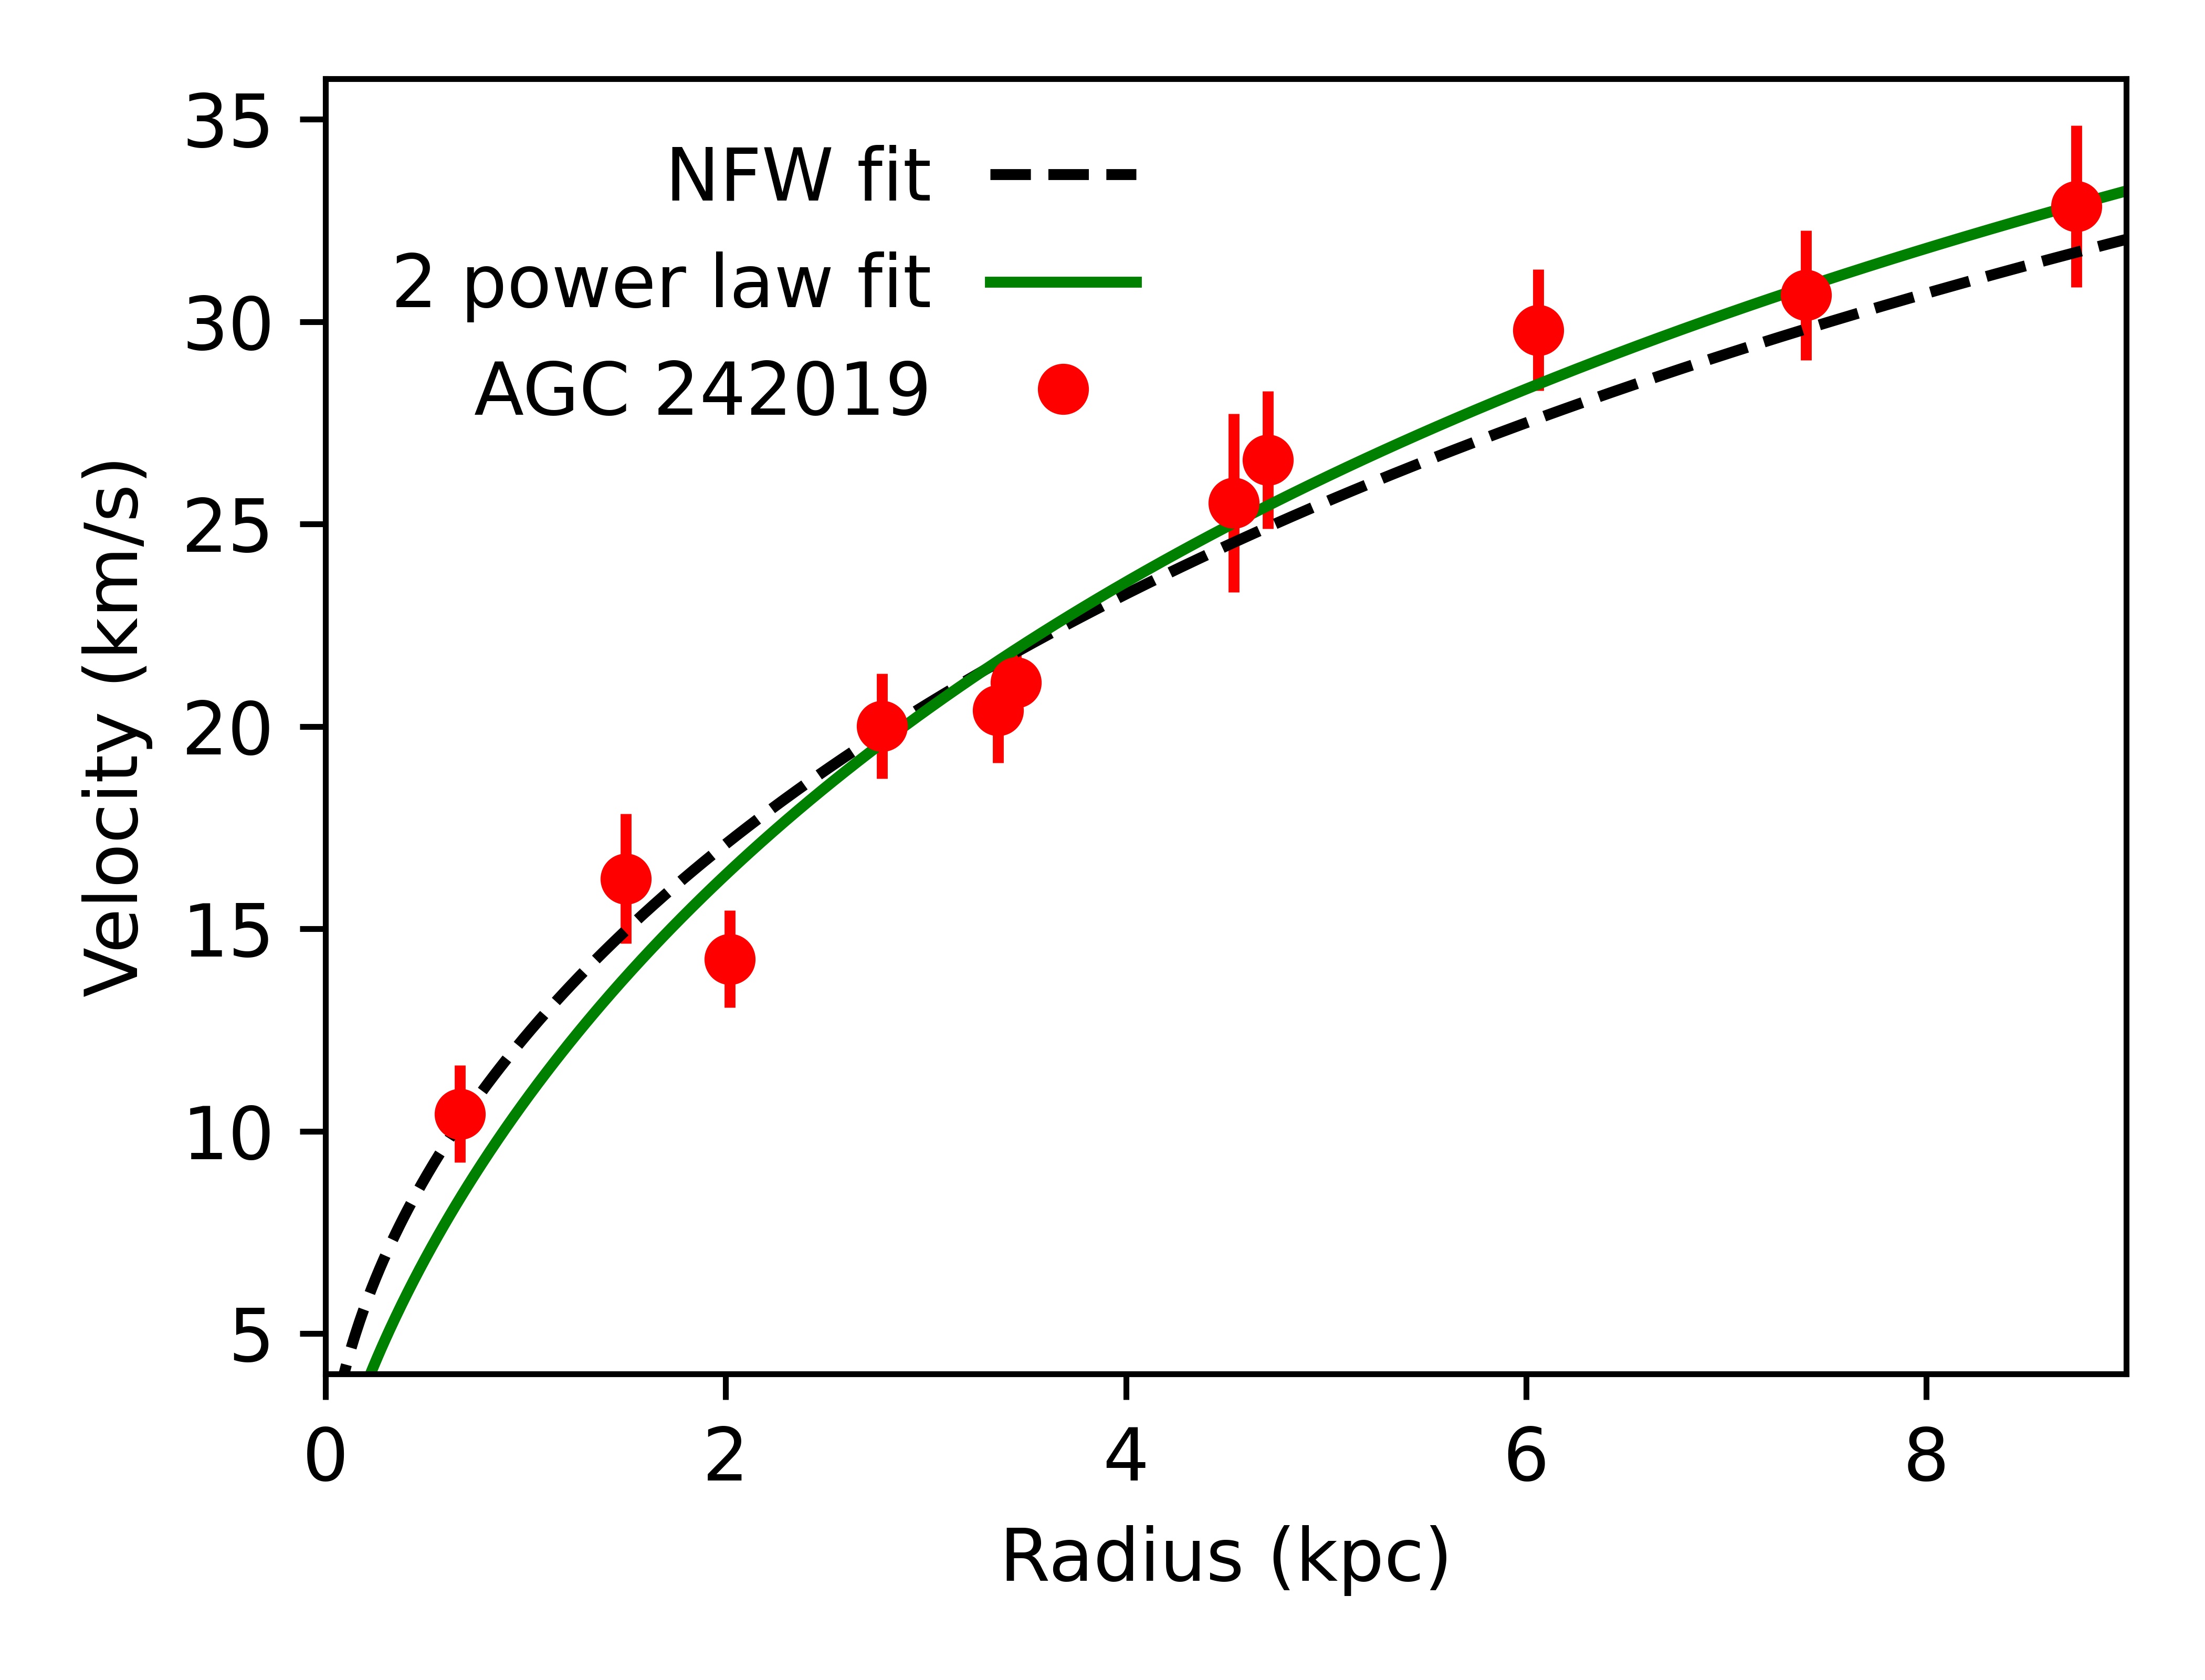
Figure 2 shows the dark matter contribution to the rotation curve for AGC 242019, also taken from Shi21, with the two power law fit from above shown as a solid green line and the NFW fit from Shi21, as the dashed black line. The reduced for the two power law and NFW fits were 1.5 and 1.6 respectively.
Of course, the two power law fit has more free parameters than the NFW profile, and so one can expect a better fit. Further, with five free parameters, the two power law fit is known to be degenerate (Klypin et al. 2001). We are not claiming here that our fit is unique. Indeed, by fixing =1 and leaving and free, another set of parameters also made an approximately equally good fit, with Mhalo of 2.51010M⊙, concentration = 8.3, =2.32, and an asymptotic inner slope =0.55. If one uses a double power law profile with and fixed to be 1 and 3 respectively (a profile sometimes as referred to as a generalised NFW profile) one can get another approximately equally good fit as for our fiducial two power law one, by using parameters Mhalo of 2.01010M⊙, concentration = 4.6 and asymptotic inner slope =0.57. A summary of the various best fit parameters is provided in Table 1.
One can clearly see a trend in these fitting parameters. As we reduce the number of free parameters and fix the outer and then inner slope to match halos that form in dark matter only simulations, the way the parameters compensate to arrive to an acceptable fit is to decrease the value of the concentration. Once parameters are fixed at their NFW values, i.e. , then the concentration needs to be very low, c=2, in order for the density profile and rotation curves to be reasonably fitted.
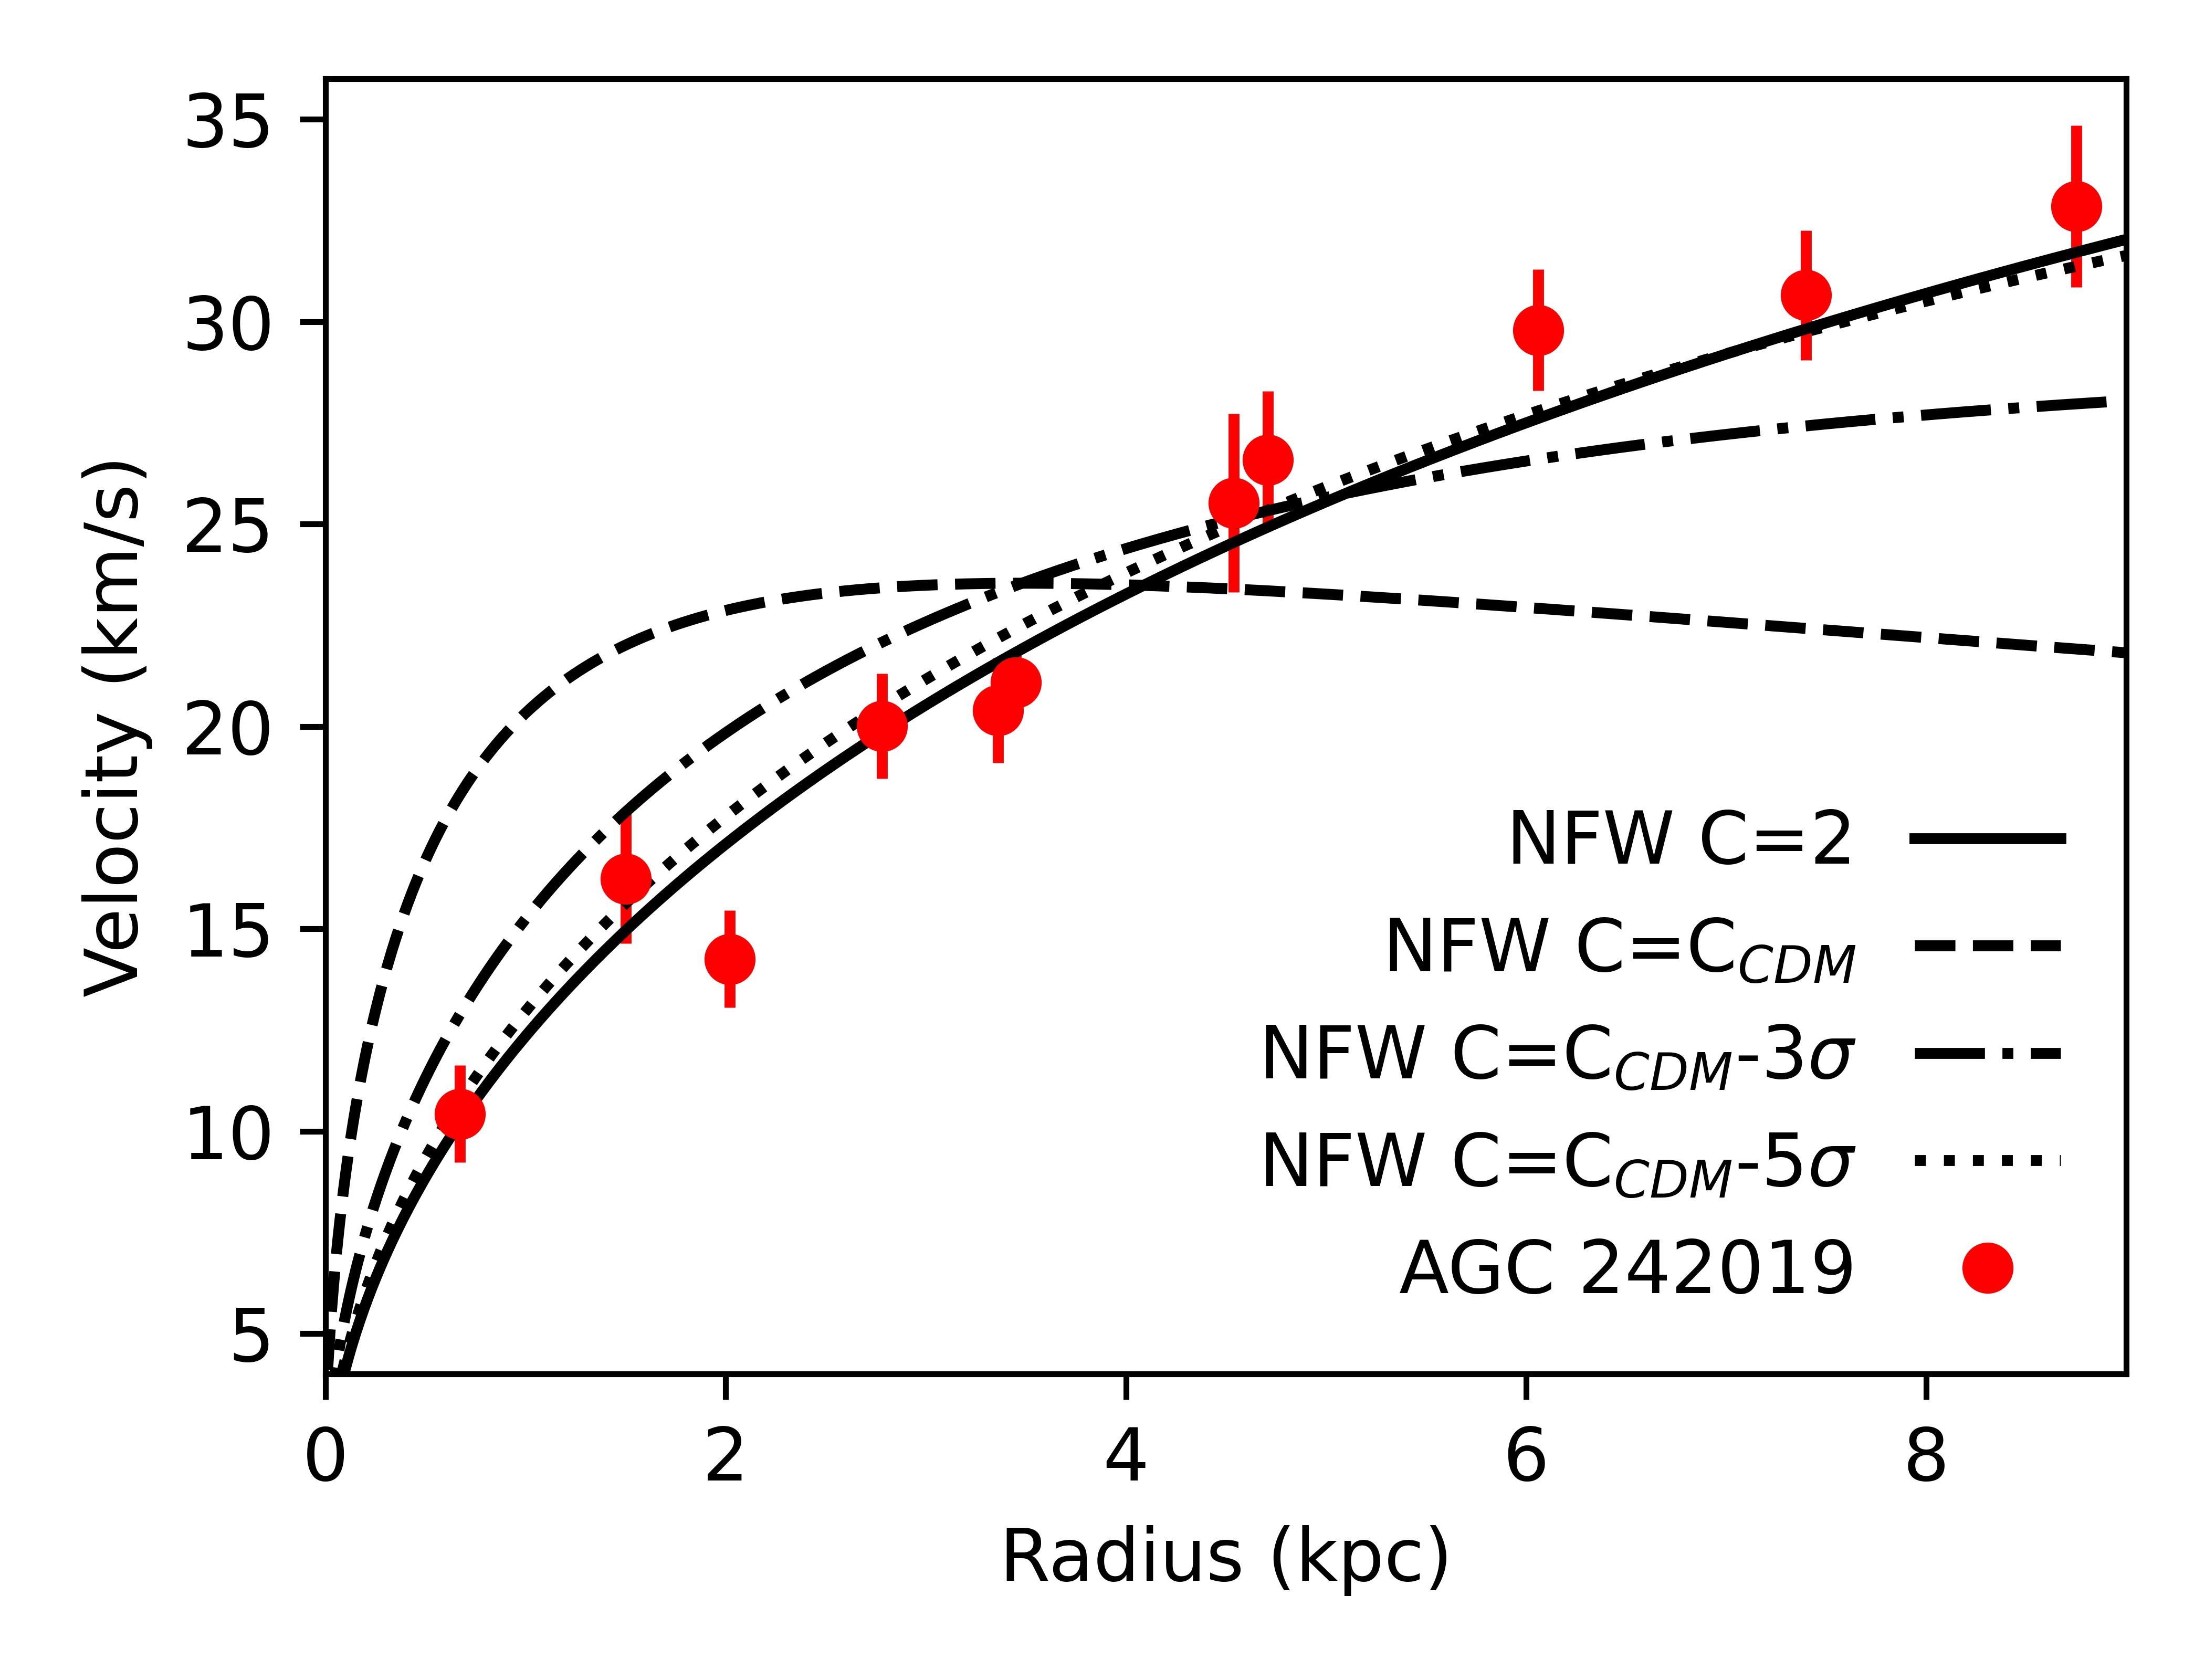
The dependence of profile shape on concentration is demonstrated in Figure 3, that again shows the dark matter contribution to the rotation curve of AGC 242019 as red circles, and then shows various NFW fits, firstly (dashed line) by fixing the concentration according to the mass-concentration relation from cosmological simulations (Dutton & Macciò 2014), then by fixing the concentration to be 3 lower than the expected relation (dot-dashed curve) and finally by being 5 below the expected relation (dotted curve).
| Fit type | Mhalo/M⊙ | c | ||
|---|---|---|---|---|
| 2.91010 | 10.1 | 0.54 | 0.2 | |
| 2.51010 | 8.3 | 0.55 | 0.2 | |
| 2.01010 | 4.6 | 0.57 | 0.2 | |
| 3.51010 | 2.0 | 1 | 0.5 |
These fits have concentrations of 15.7, 5.7 and 2.7 and halo masses of 1.8e10109, 6.4109, 2.31010 M⊙, respectively, for concentration set to be 0, 3 and 5 away from the expected relation. The NFW fit to the data of Shi21 has a concentration, 2.0, that is more than 5 below the expected concentration of halos of such mass, according to N-body only simulations. Lowering the concentration also moves the fitted halo to have a higher mass, which brings it into better agreement with abundance matching relations (e.g. Moster et al. 2013).
Summarizing, reproducing at the same time reasonable fits to rotation curves, along with theoretically expected values of concentration and halo mass, is a challenge for NFW models when applied to UDGs and LSBs, which show slowly rising rotation curves. Much better fits and c-Mhalovalues can be simultaneously obtained when allowing for a shallow inner profile (see Katz et al. 2017 for a full discussion of this issue).
In Figure 4 we explicitly plot the c-Mhalo relation, with our derived values for UDG AGC 242019 using the two power law fit (red triangle) and for the NFW fit (red square). The relation from N-body only simulations is shown as a solid blue line, with the 1 deviations shown as a blue dashed line (Dutton & Macciò 2014). FIRE-2 simulations are shown as open circles (Lazar et al. 2020). NIHAO simulations are shown as circles colored by formation redshift. The trend for later forming galaxies to have lower concentrations, first shown in Wechsler et al. 2002, is clear from the colors.
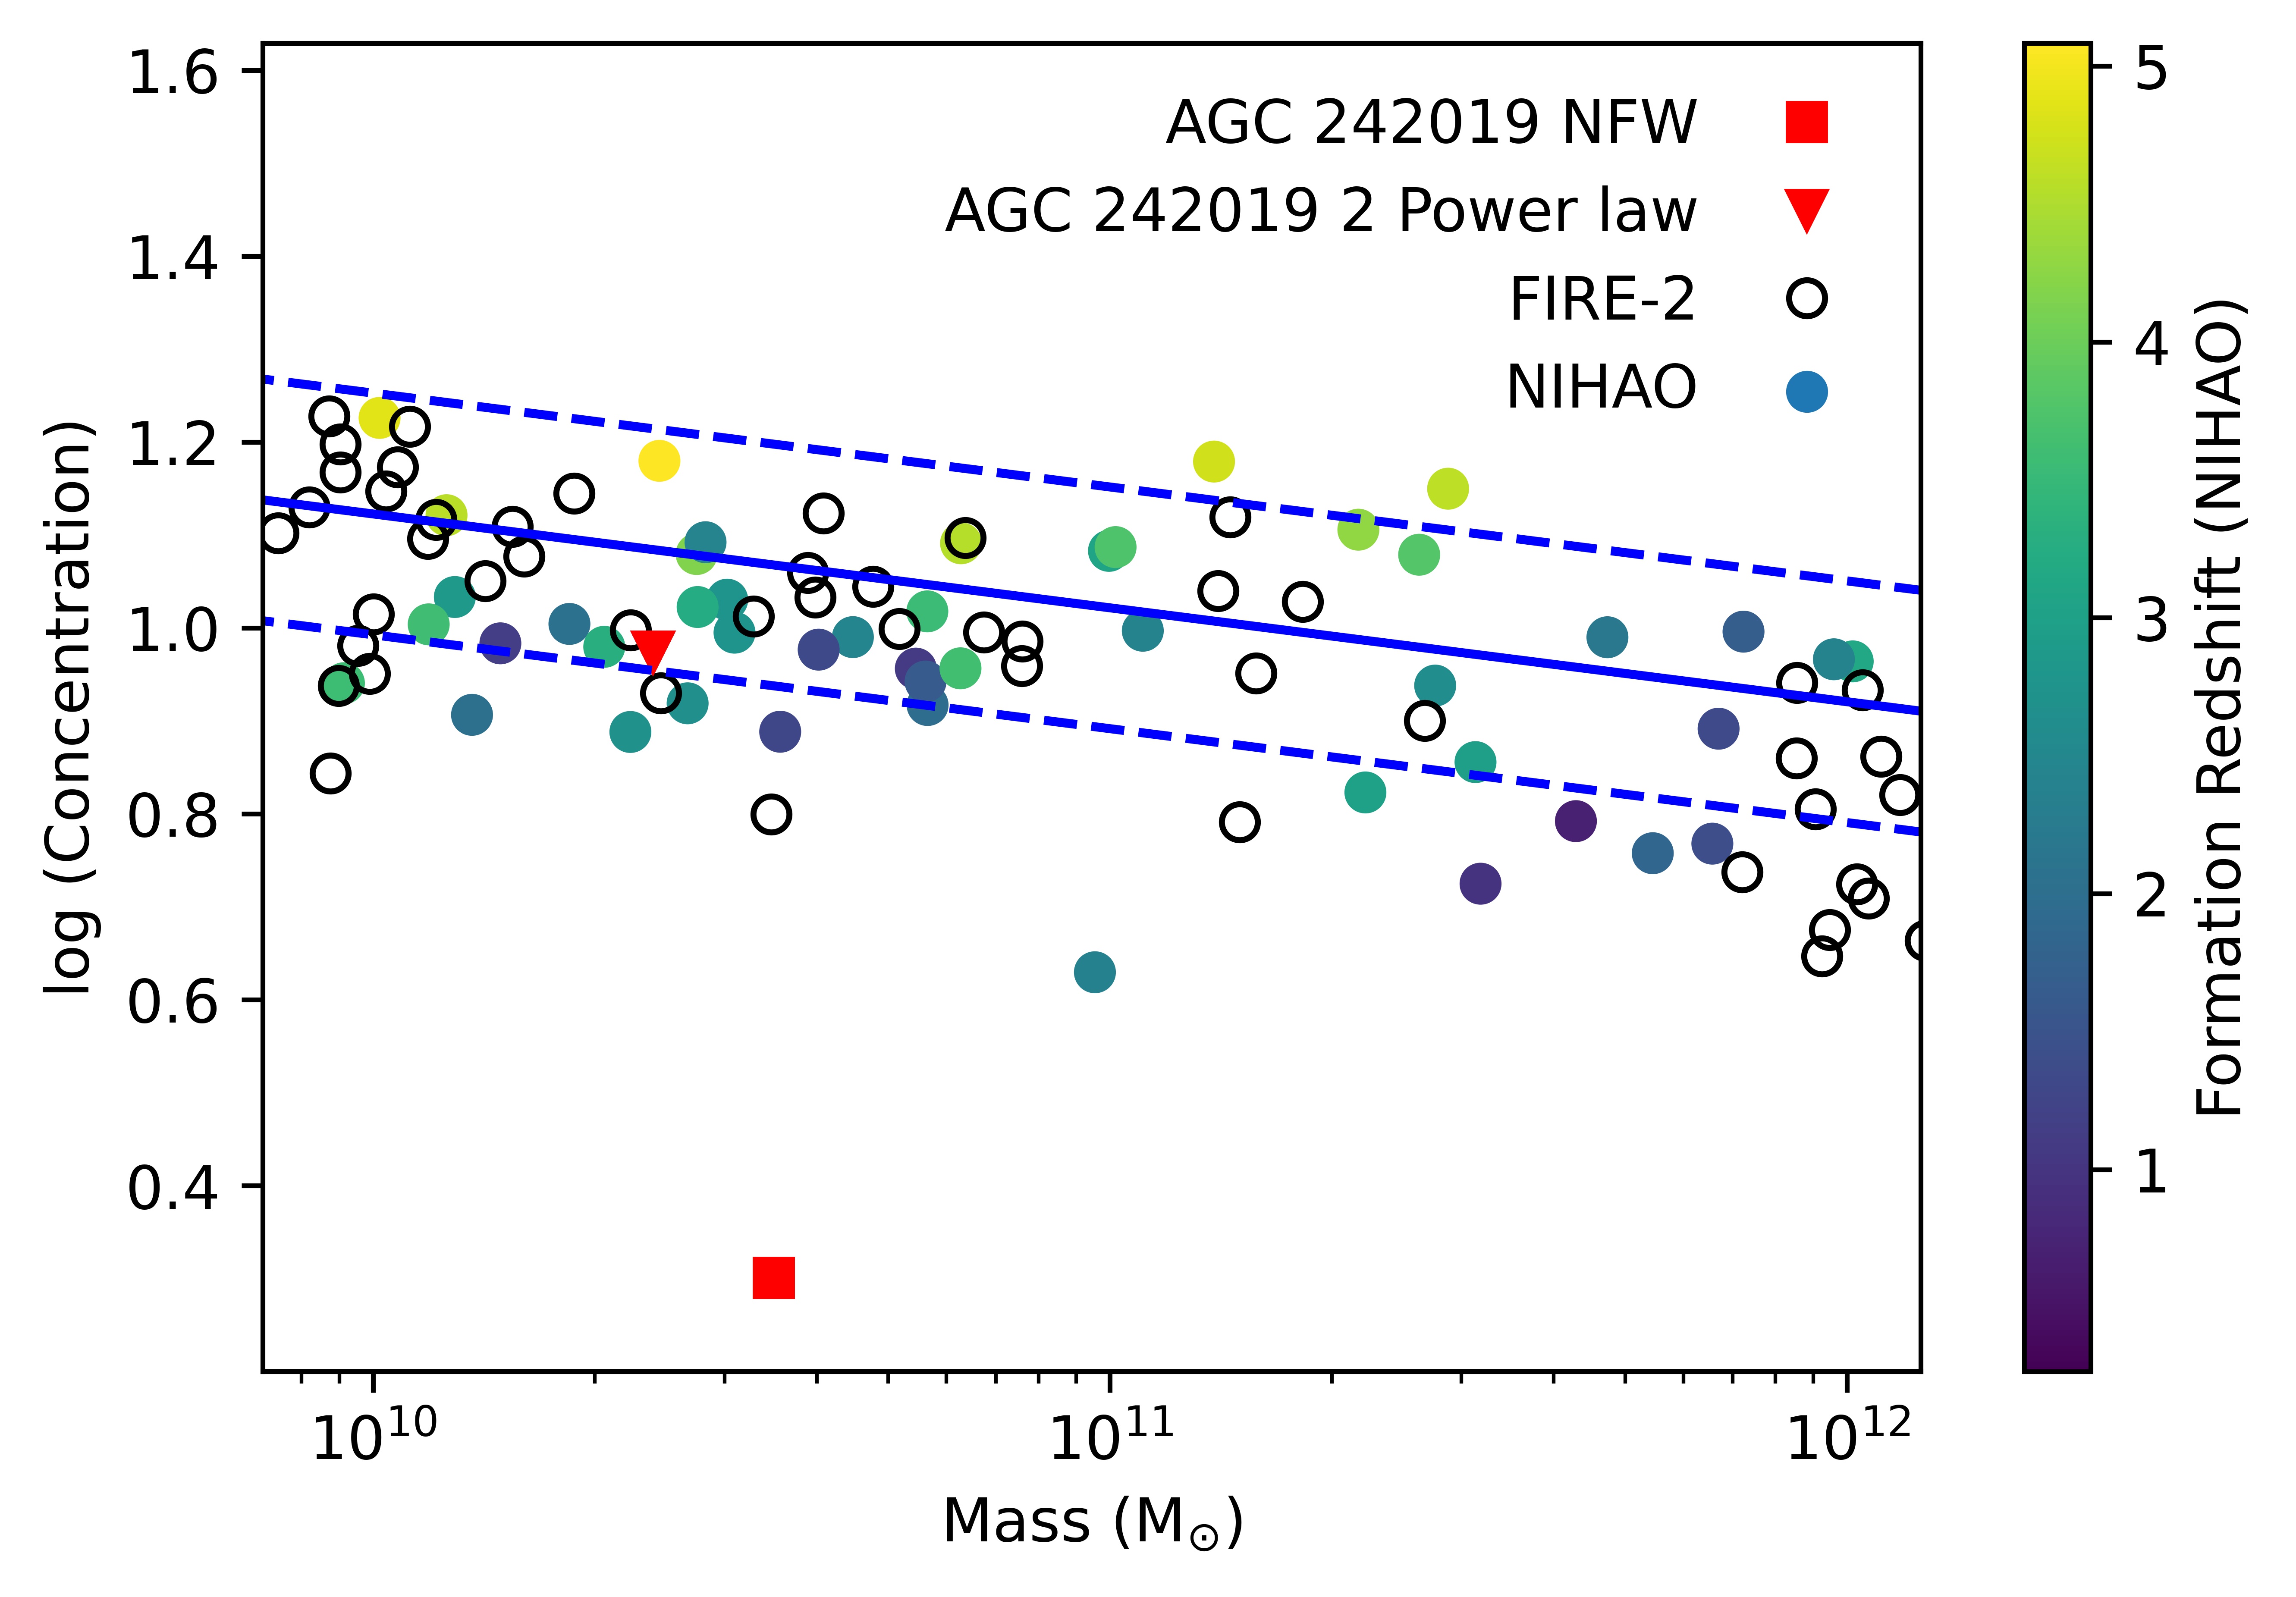
As expected from Figure 3, fitting AGC 242019 with an NFW profile results in a concentration that is a long way from what is expected from N-body simulations, as well as being a long way from what is found in hydrodynamical simulations that model galaxy formation within a cosmological context. A shallow inner density profile provides concentration values in line with expectations.
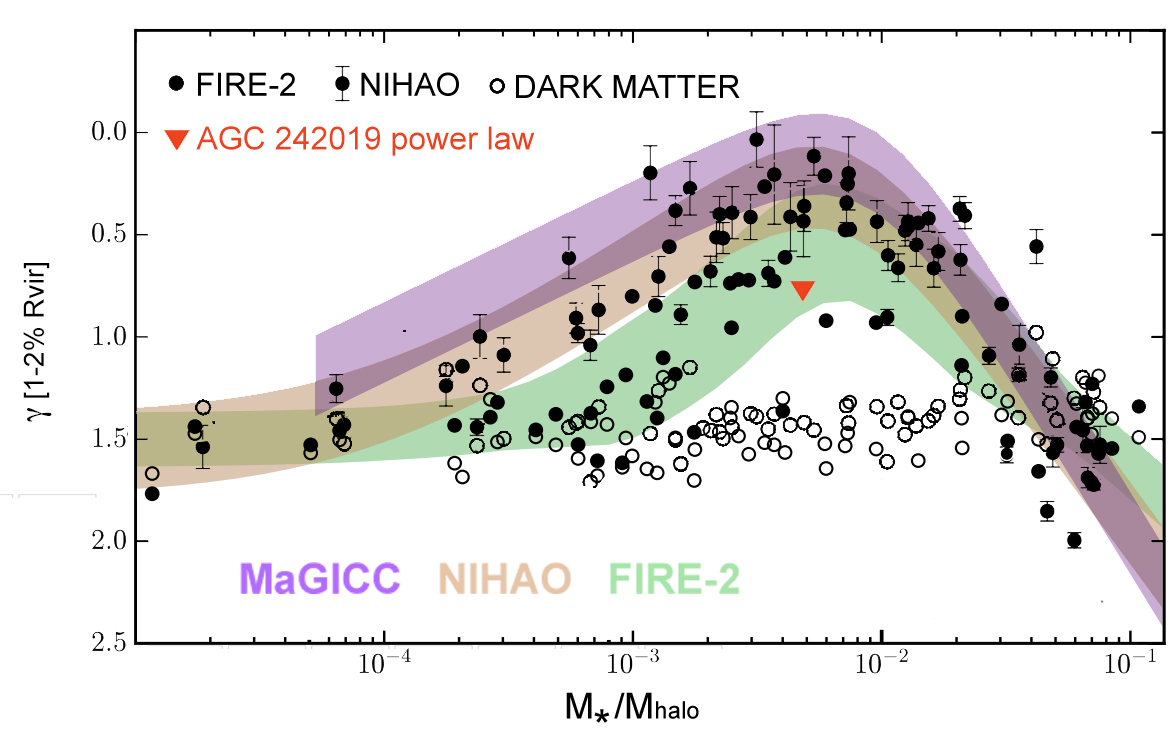
Figure 5 shows the relation between the inner slope of the density profile, measured between 1 and 2 of each galaxy virial radius (), and the ratio of stellar to halo mass, Mstar/Mhalo. Resuls from MaGICC (Di Cintio et al. 2014b), NIHAO (Tollet et al. 2016) and FIRE-2 (Lazar et al. 2020) simulations are shown as shaded regions, covering a range of =0.2 from each average relation. Black dots with error bars are NIHAO hydro-simulations, black dots without error bars are from FIRE-2, whilst open black circles are dark matter only simulations from NIHAO and FIRE-2. AGC 242019 is shown as an upside down triangle, derived from the double power law fit used in this study. The slope between 1 and 2 of the virial radius is larger than the asymptotic inner slope: in this case, an asymptotic inner slope of =0.54 translates into a =0.78, which is represented in Figure 5. By comparison, N-body only simulations, which asymptote to = 1, can be seen in the open circles to have values of 1.5. Our derived inner slope for AGC 242019 is around half as steep as expected for N-body simulations, regardless of the particular radial region adopted to compute , and in line with hydro simulations that predict an expanded profile at the mass range of this UDG.
4 Discussion and Conclusions
A central question regarding UDGs is whether they are a separate category of galaxy than LSBs. Determining their properties, including their mass profiles, is therefore an important aspect to address.
AGC 242019 is a field UDG, with a large HI gas content that has allowed detailed rotation curve to be created and mass modelling to be carried out. Shi et al. (2021) found that the density profile of this galaxy is best fit by an NFW profile with Mhalo=3.51010M⊙ and a concentration = 2.0, the latter being more than 5 away from theoretical expectations. In this letter we have instead shown that a better fit can be obtained employing a two-power law model, which allows the inner slope of the dark matter halo to be shallower than a cuspy profile.
In our fit, we found (where and are the inner and outer slopes, and regulates the transition between them), a halo mass of Mhalo=2.881010M⊙ and a concentration = 10.1, which is in line with expectations from c-M relations (Dutton & Macciò, 2014). We do not claim that our fit is unique. Indeed we suggested that by restricting the transition parameter to =1, or by restricting both =1 and the outer slope =3, we can find almost equally good fits, in terms of their reduced . However, as more restrictions towards an NFW profile are included, resulting concentrations are forced to become progressively lower, up to the point of the extremely low c (and higher ) reached in Shi21, which does not match c-M predictions.
Are UDGs structurally similar to LSB galaxies? Like LSB galaxies, AGC 242019 has a slowly rising rotation curve, compared to that expected in N-body only simulations. One explanation is to fit the slowly rising rotation curve of AGC 242019 with a NFW profile with an extremely (more than 5 outlier) low concentration (Shi21). In fact, Neto et al. (2007) found that the low concentration tail in N-body simulations is caused by unrelaxed systems. If such unrelaxed systems are excluded, the scatter in concentrations at a given mass becomes considerably smaller. Given that there is no evidence that AGC 242019 has undergone a recent merger, such a low concentration halo would be a considerably larger outlier from what is expected from N-body simulations, so far more than 5.
Although the possibility of an extremely low concentration halo as proposed by Shi21 cannot be totally ruled out, it should be recalled that many/most LSB galaxies have slowly rising rotation curves: they cannot all be explained as being extreme outliers from the c-M relation. The alternative is that the dark matter halo in these galaxies has a less steep inner density profile and a concentration in line with theoretical expectation (e.g. Di Cintio et al. 2019 and references therein). When placed in this context, AGC 242019 is very typical of the well studied LSB population (e.g. de Blok et al. 2008), and can be considered as just a natural extension of LSBs at low stellar mass.
Regarding formation theories for UDGs, a very late forming halo with extremely low concentration may fit with the theory of UDGs forming in high spin halos (Amorisco & Loeb 2016), while interpreting the galaxy as being a normal LSB with a relatively shallow inner density profile, would fit will with the theory of expanded stellar and dark matter populations (Di Cintio et al. 2017; Chan et al. 2018). We note, however, that the scenarios are not mutually exclusive.
Other suggested formation scenarios that could be at play in both the field and in groups/clusters have been advocated to be able to explain the number density and global properties of UDGs, such as their color, effective radii, large metallicities and number densities (Jiang et al., 2019; Carleton et al., 2019; Tremmel et al., 2020; Sales et al., 2020; Wright et al., 2021).
Formation mechanisms that are able to reproduce UDG global properties without the need of making a central shallow core, fail at reproducing the radial properties of UDGs’ rotation curve. Evidence is beginning to suggest that UDGs have slowly rising rotation curve, just like the more general category of LSBs. For example, UDGs AGC 122966, AGCs 219533 and AGC 334315, HI-rich objects from the ALFALFA survey, all show rotation curves and mass profiles compatible with having shallow central DM profiles (Leisman et al., 2017); UDG DF44 shows a stellar velocity dispersion which is well fit by a mass-dependent cored profile from Di Cintio et al. 2014a, which provides a mass of MhaloM⊙, isotropic orbits and a positive kurtosis, in qualitative agreement with measurements (van Dokkum et al., 2019). Furthermore, WLM is a Local Group galaxy that may be considered as a UDG: with a stellar mass of 1.1107M⊙, and a half light radius of 1.65 kpc, WLM has been found to have a slowly rising rotation curve and similarly shallow central dark matter profile as AGC 242019 (Leung et al. 2021).
In conclusion, AGC 242019 has a similar mass distribution as other well studied LSB galaxies. Determining the radial properties, in particular the mass profiles, of a larger sample of UDGs is an important aspect to address, in order to better understand UDGs and their formation, as well as their connection to LSBs. If the structural properties of UDGs and LSBs are alike as it appears, then explaining their mass distribution would require halo expansion by baryonic processes (e.g. Governato et al. 2010; Di Cintio et al. 2017; Chan et al. 2018), or more exotic forms of dark matter (e.g. Schive et al. 2014; Zavala et al. 2019) or gravity (e.g. Lelli et al. 2017).
References
- Amorisco & Loeb (2016) Amorisco, N. C., & Loeb, A. 2016, MNRAS, 459, L51
- Bothun et al. (1997) Bothun, G., Impey, C., & McGaugh, S. 1997, PASP, 109, 745
- Bothun et al. (1991) Bothun, G. D., Impey, C. D., & Malin, D. F. 1991, ApJ, 376, 404
- Brook et al. (2012) Brook, C. B., Stinson, G., Gibson, B. K., Wadsley, J., & Quinn, T. 2012, MNRAS, 424, 1275
- Bullock et al. (2001) Bullock, J. S., Dekel, A., Kolatt, T. S., et al. 2001, ApJ, 555, 240
- Burkert (1995) Burkert, A. 1995, ApJ, 447, L25
- Carleton et al. (2019) Carleton, T., Errani, R., Cooper, M., et al. 2019, MNRAS, 485, 382
- Chan et al. (2015) Chan, T. K., Kereš, D., Oñorbe, J., et al. 2015, MNRAS, 454, 2981
- Chan et al. (2018) Chan, T. K., Kereš, D., Wetzel, A., et al. 2018, MNRAS, 478, 906
- de Blok et al. (2001) de Blok, W. J. G., McGaugh, S. S., & Rubin, V. C. 2001, AJ, 122, 2396
- de Blok et al. (2008) de Blok, W. J. G., Walter, F., Brinks, E., et al. 2008, AJ, 136, 2648
- Di Cintio et al. (2017) Di Cintio, A., Brook, C. B., Dutton, A. A., et al. 2017, MNRAS, 466, L1
- Di Cintio et al. (2014a) —. 2014a, MNRAS, 441, 2986
- Di Cintio et al. (2019) Di Cintio, A., Brook, C. B., Macciò, A. V., Dutton, A. A., & Cardona-Barrero, S. 2019, MNRAS, 486, 2535
- Di Cintio et al. (2014b) Di Cintio, A., Brook, C. B., Macciò, A. V., et al. 2014b, MNRAS, 437, 415
- Di Teodoro & Fraternali (2015) Di Teodoro, E. M., & Fraternali, F. 2015, MNRAS, 451, 3021
- Dutton & Macciò (2014) Dutton, A. A., & Macciò, A. V. 2014, MNRAS, 441, 3359
- Forbes et al. (2021) Forbes, D. A., Gannon, J. S., Romanowsky, A. J., et al. 2021, MNRAS, 500, 1279
- Governato et al. (2010) Governato, F., Brook, C., Mayer, L., et al. 2010, Nature, 463, 203
- Hopkins et al. (2018) Hopkins, P. F., Wetzel, A., Kereš, D., et al. 2018, MNRAS, 480, 800
- Impey & Bothun (1997) Impey, C., & Bothun, G. 1997, ARA&A, 35, 267
- Jaffe (1983) Jaffe, W. 1983, MNRAS, 202, 995
- Jiang et al. (2019) Jiang, F., Dekel, A., Freundlich, J., et al. 2019, MNRAS, 487, 5272
- Katz et al. (2017) Katz, H., Lelli, F., McGaugh, S. S., et al. 2017, MNRAS, 466, 1648
- Klypin et al. (2001) Klypin, A., Kravtsov, A. V., Bullock, J. S., & Primack, J. R. 2001, ApJ, 554, 903
- Lazar et al. (2020) Lazar, A., Bullock, J. S., Boylan-Kolchin, M., et al. 2020, MNRAS, 497, 2393
- Leisman et al. (2017) Leisman, L., Haynes, M. P., Janowiecki, S., et al. 2017, ApJ, 842, 133
- Lelli et al. (2016) Lelli, F., McGaugh, S. S., & Schombert, J. M. 2016, AJ, 152, 157
- Lelli et al. (2017) Lelli, F., McGaugh, S. S., Schombert, J. M., & Pawlowski, M. S. 2017, ApJ, 836, 152
- Leung et al. (2021) Leung, G. Y. C., Leaman, R., Battaglia, G., et al. 2021, MNRAS, 500, 410
- Macciò et al. (2007) Macciò, A. V., Dutton, A. A., van den Bosch, F. C., et al. 2007, MNRAS, 378, 55
- Macciò et al. (2012) Macciò, A. V., Stinson, G., Brook, C. B., et al. 2012, ApJ, 744, L9
- Mancera Piña et al. (2020) Mancera Piña, P. E., Fraternali, F., Oman, K. A., et al. 2020, MNRAS, 495, 3636
- Martin et al. (2019) Martin, G., Kaviraj, S., Laigle, C., et al. 2019, MNRAS, 485, 796
- McGaugh (1996) McGaugh, S. S. 1996, MNRAS, 280, 337
- Merritt et al. (2006) Merritt, D., Graham, A. W., Moore, B., Diemand, J., & Terzić, B. 2006, AJ, 132, 2685
- Montes et al. (2020) Montes, M., Infante-Sainz, R., Madrigal-Aguado, A., et al. 2020, ApJ, 904, 114
- Moster et al. (2013) Moster, B. P., Naab, T., & White, S. D. M. 2013, MNRAS, 428, 3121
- Navarro et al. (1996a) Navarro, J. F., Eke, V. R., & Frenk, C. S. 1996a, MNRAS, 283, L72
- Navarro et al. (1996b) Navarro, J. F., Frenk, C. S., & White, S. D. M. 1996b, ApJ, 462, 563
- Neto et al. (2007) Neto, A. F., Gao, L., Bett, P., et al. 2007, MNRAS, 381, 1450
- Oh et al. (2011) Oh, S.-H., Brook, C., Governato, F., et al. 2011, AJ, 142, 24
- Pontzen & Governato (2012) Pontzen, A., & Governato, F. 2012, MNRAS, 421, 3464
- Read & Gilmore (2005) Read, J. I., & Gilmore, G. 2005, MNRAS, 356, 107
- Román & Trujillo (2017) Román, J., & Trujillo, I. 2017, MNRAS, 468, 703
- Ruiz-Lara et al. (2018) Ruiz-Lara, T., Beasley, M. A., Falcón-Barroso, J., et al. 2018, MNRAS, 478, 2034
- Sales et al. (2020) Sales, L. V., Navarro, J. F., Peñafiel, L., et al. 2020, MNRAS, 494, 1848
- Schive et al. (2014) Schive, H.-Y., Liao, M.-H., Woo, T.-P., et al. 2014, Phys. Rev. Lett., 113, 261302
- Shi et al. (2021) Shi, Y., Zhang, Z.-Y., Wang, J., et al. 2021, ApJ, 909, 20
- Teyssier et al. (2013) Teyssier, R., Pontzen, A., Dubois, Y., & Read, J. I. 2013, MNRAS, 429, 3068
- Tollet et al. (2016) Tollet, E., Macciò, A. V., Dutton, A. A., et al. 2016, MNRAS, 456, 3542
- Tremmel et al. (2020) Tremmel, M., Wright, A. C., Brooks, A. M., et al. 2020, MNRAS, 497, 2786
- Trujillo et al. (2019) Trujillo, I., Beasley, M. A., Borlaff, A., et al. 2019, MNRAS, 486, 1192
- van Dokkum et al. (2016) van Dokkum, P., Abraham, R., Brodie, J., et al. 2016, ApJ, 828, L6
- van Dokkum et al. (2018) van Dokkum, P., Danieli, S., Cohen, Y., et al. 2018, Nature, 555, 629
- van Dokkum et al. (2019) van Dokkum, P., Wasserman, A., Danieli, S., et al. 2019, ApJ, 880, 91
- van Dokkum et al. (2015) van Dokkum, P. G., Abraham, R., Merritt, A., et al. 2015, ApJ, 798, L45
- Wang et al. (2015) Wang, L., Dutton, A. A., Stinson, G. S., et al. 2015, MNRAS, 454, 83
- Wechsler et al. (2002) Wechsler, R. H., Bullock, J. S., Primack, J. R., Kravtsov, A. V., & Dekel, A. 2002, ApJ, 568, 52
- Wright et al. (2021) Wright, A. C., Tremmel, M., Brooks, A. M., et al. 2021, MNRAS, 502, 5370
- Zavala et al. (2019) Zavala, J., Lovell, M. R., Vogelsberger, M., & Burger, J. D. 2019, Phys. Rev. D, 100, 063007