]}
EUROPEAN ORGANIZATION FOR NUCLEAR RESEARCH (CERN)
![]() CERN-EP-2021-170
LHCb-PAPER-2021-024
CERN-EP-2021-170
LHCb-PAPER-2021-024
Measurement of the boson mass
LHCb collaboration†††Authors are listed at the end of this paper.
The boson mass is measured using proton-proton collision data at corresponding to an integrated luminosity of 1.7 recorded during 2016 by the LHCb experiment. With a simultaneous fit of the muon distribution of a sample of decays and the distribution of a sample of decays the boson mass is determined to be
where uncertainties correspond to contributions from statistical, experimental systematic, theoretical and parton distribution function sources. This is an average of results based on three recent global parton distribution function sets. The measurement agrees well with the prediction of the global electroweak fit and with previous measurements.
Published in JHEP 01 (2022) 036.
© 2024 CERN for the benefit of the LHCb collaboration. CC BY 4.0 licence.
1 Introduction
The boson mass () is directly related to electroweak (EW) symmetry breaking in the Standard Model (SM) [1, 2, 3]. At tree level, where is the weak-isospin coupling and is the vacuum expectation value of the Higgs field. Going beyond tree level the boson masses and couplings receive loop corrections. The value of is related to the precisely measured fine-structure constant (), the mass of the boson () and the Fermi constant (), as [4, 5]
| (1) |
where encapsulates the loop-level corrections. A global fit of EW observables, excluding direct measurements of , yields a prediction of [6].111Throughout this paper natural units with are used. This can be compared with direct measurements to test for possible beyond SM contributions to in Eq. 1. The 2020 PDG average of direct measurements is [7]. The sensitivity of the global EW fit to physics beyond the SM is primarily limited by the precision of the direct measurements of [6]. Furthermore, the uncertainty in the prediction is expected to reduce as the top-quark mass, which is the leading source of the parametric uncertainty, is determined more precisely in the future.
The value of was measured to a precision of 33 MeV at the Large Electron-Positron (LEP) collider [8] at CERN and to a precision of 16 MeV in an average [9] of measurements by the CDF [10] and D0 [11] experiments at the Fermilab Tevatron collider. The first measurement at the LHC was performed by the ATLAS collaboration and has an uncertainty of 19 MeV [12]. The hadron collider measurements are based on three observables in leptonic boson decays, namely the transverse mass, missing transverse momentum and charged lepton transverse momentum (). At hadron colliders, the lepton is measured with good resolution but it is strongly influenced by the boson transverse momentum distribution, the modelling of which is a potential source of a limiting systematic uncertainty. However, the resolution of the transverse mass is degraded by the pile-up of proton-proton interactions in the same bunch crossing. Therefore, the lepton was the most sensitive observable in the recent measurement performed by the ATLAS collaboration. Despite being based on a small subset of the data recorded to date, the ATLAS measurement of is already limited by uncertainties in modelling boson production, in particular the parton distribution functions (PDFs) of the proton.
The potential for a measurement based on the muon with the LHCb experiment is studied in Ref. [13] It was estimated that LHCb data collected in LHC Run 2, at a proton-proton () centre of mass energy , would allow a measurement with a statistical precision of around 10 MeV. Owing to the complementary pseudorapidity () coverage of the LHCb experiment with respect to the ATLAS and CMS experiments, it was demonstrated in Ref. [13] that the PDF uncertainty could partially cancel in an average of measurements by the LHC experiments.
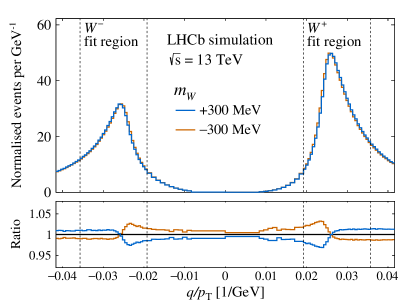
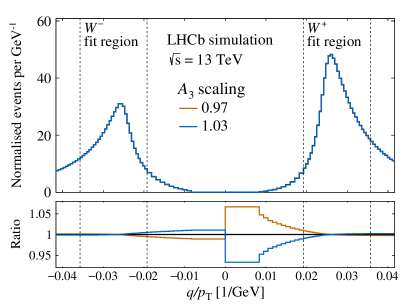
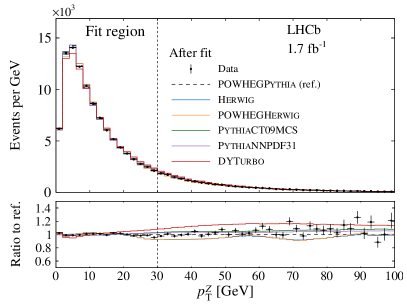
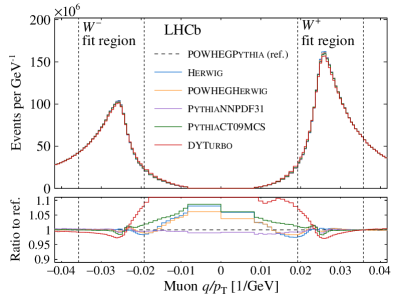
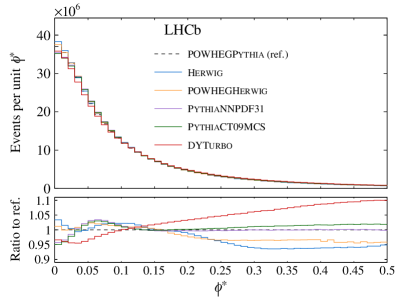
In this paper a first measurement of is presented using decays, including both boson and muon charges, collected at the LHCb experiment.222The inclusion of charge-conjugate processes is implied throughout unless otherwise specified. This measurement considers the muon distribution, where is the muon charge. Figure 1 (left) illustrates how the shape of the muon distribution in simulated boson decays is influenced by variations in of , which corresponds to roughly ten times the target precision of the present analysis. The variable allows all muons with to be visualised; those with are used to determine , while consistent control of the fit can be demonstrated in the region .
The of a muon produced by the decay of a boson has a strong dependence on the boson transverse momentum (). Direct measurements of the distribution have been reported by the ATLAS [14] and CMS [15] collaborations but the intervals are necessarily coarse due to the limited resolution. Measurements of the transverse momentum distribution for boson production () are therefore used to validate the predictions for the distribution.333For brevity denotes . The angular variable [16], defined in Eq. 4, is used in this analysis as a proxy for since its distribution can be measured more precisely than that of . Parton-shower programs such as Pythia [17] can be tuned (e.g. Ref. [18]) to describe the and data at the per cent level but it is challenging to reliably translate such tunes to boson production. However, a -boson-specific tuning of a parton-shower model can be performed simultaneously with a determination of [19].
If electroweak corrections are neglected then the production and leptonic decay of the boson factorise such that the differential cross-section can be written as
| (2) | ||||
where and are the lepton decay angles defined in a suitable frame (the Collins-Soper frame [20] is used in this analysis), and , and denote the transverse momentum, rapidity and mass of the final state lepton pair, respectively. An equivalent expression applies to production. The eight angular coefficients () are ratios of helicity cross-sections and depend on , and ; is usually referred to as the unpolarised cross-section. The coefficients are numerically small because they only arise at second order, or higher, in the strong coupling constant ().444Throughout this paper denotes the strong coupling at the scale of the boson mass. The coefficient is particularly influential on the muon distribution. Figure 1 (right) shows how the distribution in simulated boson events, after the selection requirements described in Sect. 3, changes when is scaled up and down by 3%.
In this paper, the simulated samples are weighted in the full five-dimensional phase space of vector boson production and decay, using different models for the unpolarised cross-section, angular coefficients, and QED final-state radiation. Several PDF sets are used in the analysis but none of the analysed data were included in the determination of these PDF sets.
This paper is organised as follows. Section 2 describes the data and simulated samples. Section 3 details the signal candidate selection requirements. Section 4 describes charge-dependent curvature corrections that are applied to the data and simulation. The determination of residual smearing corrections to the simulation with a simultaneous fit of and quarkonia decays is subsequently described. Section 5 details the measurement of muon selection efficiencies and subsequent weight-based corrections to the simulation. Section 6 describes the treatment of background arising from in-flight decays of light hadrons. Section 7 sets out the modelling of vector boson production and decay. Section 8 describes the simultaneous fit of the model to the muon distribution of boson candidates and the (defined in Eq. 4) distribution of boson candidates to determine . Section 9 explains how results based on three different PDF sets are averaged, and summarises the systematic uncertainties. Several cross-checks of the measurement are reported. The impact of analysis choices and systematic variations on is discussed throughout the paper. The conclusions of the analysis are presented in Sect. 10.
2 Data sets and event selection
The LHCb detector [21, 22] is a single-arm forward spectrometer covering the pseudorapidity range , designed for the study of particles containing or quarks. The detector includes a high-precision tracking system consisting of a silicon-strip vertex detector surrounding the proton-proton () interaction region [23], a large-area silicon-strip detector located upstream of a dipole magnet with a bending power of about , and three stations of silicon-strip detectors and straw drift tubes [24] placed downstream of the magnet. The tracking system provides a measurement of the momentum, , of charged particles with a relative uncertainty that varies from 0.5% at low momentum to 1.0% at 200 GeV. The minimum distance of a track to a primary collision vertex (PV), the impact parameter, is measured with a resolution of , where is the component of the momentum transverse to the beam, in GeV. Different types of charged hadrons are distinguished using information from two ring-imaging Cherenkov detectors [25]. Photons, electrons and hadrons are identified by a calorimeter system consisting of scintillating-pad and preshower detectors, an electromagnetic calorimeter and a hadronic calorimeter. Muons are identified by a system composed of alternating layers of iron and multiwire proportional chambers [26]. The online event selection is performed by a trigger [27], which consists of a hardware stage, based on information from the calorimeter and muon systems, followed by a software stage, which applies a full event reconstruction.
This analysis uses a data sample of collisions at TeV recorded during 2016, corresponding to an integrated luminosity of about . Roughly half of the data were recorded in each of the dipole magnet polarity configurations, resulting in a large degree of cancellation of charge-dependent curvature biases and their associated uncertainties. These data correspond to an average number of proton-proton interactions per bunch-crossing event of .
During Run 2 the LHCb detector was aligned and calibrated in real-time [28]. The alignment of the tracking system is based on a minimisation of the residuals of the clusters of tracker hits evaluated with a Kalman filter that takes into account multiple scattering and energy loss [29]. The alignment algorithm also permits mass and vertex constraints [30]. An optimised offline alignment, which includes events with a mass constraint that accounts for the natural width of the boson, is used to determine the track parameters. Since the real-time alignment is not optimised for the analysis of high- final states, this realignment improves the mass resolution by around 30%.
All signal and background processes are simulated using an LHCb specific tune [31] of Pythia version 8.186 [17]. The interaction of the generated particles with the detector, and its response, are implemented using the Geant4 toolkit [32, *Agostinelli:2002hh] as described in Ref. [34]. Events are simulated with both polarity configurations and weights are assigned to events in each polarity such that the polarity distribution matches the recorded data.
3 Selection of boson, boson and quarkonia signal candidates
Tracks are identified as muons if they are matched to hits in either three or all four of the most downstream muon stations depending on their momentum. They are then considered in this analysis if they are within the range , and have a momentum of less than . The tracks must have a good fit quality and a relative momentum uncertainty of less than 6%.
Candidate events are selected online by requiring that one identified muon satisfies the requirements of all stages of the trigger. At the hardware stage a of at least 6 GeV is required. The isolation of a muon is defined as the scalar sum of the transverse momenta of all charged and neutral particles, as selected by a particle-flow algorithm, described in Ref. [35], within around the muon, where and denote the separation in and azimuthal angle around the beam direction (), respectively. Hadronic background contributions are suppressed by requiring the muon to have an isolation of less than 4 GeV. For the selection the range is tightened to so that the area of the isolation cone is fully instrumented. The muon must satisfy where is defined by the difference in the vertex fit of the PV with and without including the muon. Background from boson events is suppressed by rejecting events that contain a second muon with and an opposite charge to that of the primary muon candidate. Roughly million candidates are selected in the range GeV.
Candidate events are reconstructed from combinations of two oppositely charged identified muons associated to the same PV with an invariant mass within GeV of the known boson mass [7]. At least one muon must be matched to a single muon selection at all stages of the trigger. Both muons must have GeV, an isolation value below 10 GeV, and an impact parameter significance of less than ten standard deviations. Roughly thousand candidates are selected.
Candidate and events, which are primarily used to calibrate the modelling of the momentum measurement, are required to have a pair of oppositely charged identified muons. Both muons must have a transverse momentum above 3 GeV and satisfy a tighter muon identification requirement. In order to specifically select candidates originating from -hadron decays the decay vertices must be displaced from the nearest PV with a significance of at least three standard deviations. These selections retain roughly million candidates and thousand candidates.
4 Momentum calibration and modelling
The momentum scale can be precisely determined from the mass measurements of various resonances, including those that decay to muon pairs. However, charge-dependent curvature biases that shift are challenging to estimate because their effect largely cancels in the mass of the resonances. They are also particularly important for the high momentum muons from and boson decays. In Ref. [36] it was proposed to determine corrections using the so-called pseudomass variable in events
| (3) |
where and are the momenta and transverse momenta of the , respectively. The opening angle between the two muons is denoted . Crucially, the value of is independent of the magnitude of the momentum of the and is therefore directly sensitive to curvature biases affecting the candidate. The pseudomass is an approximation of the dimuon mass under the assumption that the dimuon system has zero momentum transverse to the bisector of the two lepton transverse momenta. The observable is defined as [16]
| (4) |
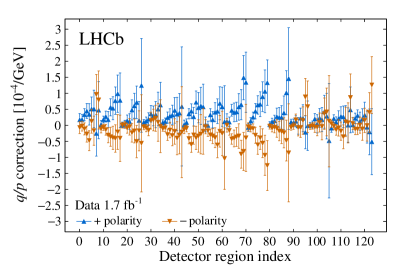
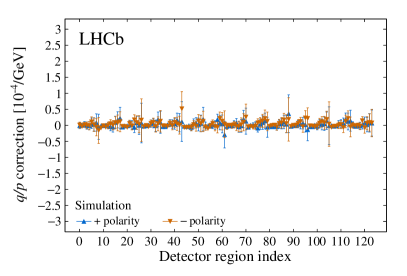
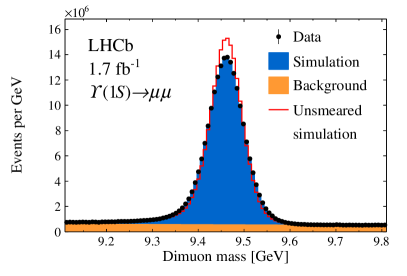
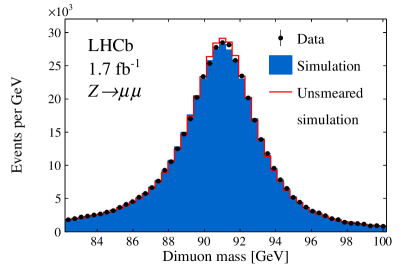
where is the azimuthal opening angle between the two leptons and is the difference between the pseudorapidities of the negatively and positively charged lepton. In events with small values of the pseudomass better approximates the dimuon mass. The pseudomass distributions for events with are studied in intervals of and of the candidate, with a further categorisation into candidates traversing the silicon strip or straw drift tube detectors downstream of the magnet. A maximum likelihood fit of the distributions is performed for each of these detector regions. The signal shapes are described by the sum of a resonant Crystal-Ball [37] component and a nonresonant component represented by an exponential function. The means of the Crystal-Ball functions are parameterised as , where and are freely varying asymmetry and mass parameters, respectively. The resulting corrections, which are given by where is the average muon momentum for a given interval in and , are presented for the data and simulation for both polarity configurations in Fig. 2.
After the curvature corrections are applied to the data and simulation, the momenta of the simulated muons are smeared to match those in the data, as described below, according to
| (5) |
where represents a random number sampled from a Gaussian distribution with mean and width . The and parameters correspond to the multiple scattering and curvature measurement contributions to the resolution, respectively. The smearing model includes six parameters in total. There are two momentum scale parameters corresponding to the region, which coincides with the selection of boson candidates, and the region. A single parameter, corresponding to a curvature bias, covers the region , while the value of is fixed to zero in the region . There are two parameters corresponding to the and regions, while a single parameter is found to adequately cover all values. The empirical dependence of the second term in Eq. 5 improves the modelling of the dependence in the mass distribution. As a further correction to Eq. 5, the value of is increased by a factor of 1.5 in the region since this improves the agreement between data and simulation in the dependence of the quarkonia mass distributions.
The six smearing parameters are determined in a simultaneous fit of , and candidates in data and simulation. A total of 36 dimuon invariant mass distributions are used in the fit. First, there are three regions covering , and , which result in six categories that depend on the regions of the two muons. The quarkonia mass distributions are only used in categories with both muons having . In the subset of the categories with both muons in , the data are split into three intervals of the asymmetry between the momenta of the two muons, which provides a first order sensitivity to the parameters. Finally, all categories are divided by magnet polarity.
As in previous studies of production with the LHCb experiment [38], the background under the peak is low enough to be neglected but the fit includes exponential functions for the background contributions under the quarkonia resonance peaks. The fractions and slopes of these exponential components vary freely in the fit.
The total from the fit is 1862 for 2082 degrees of freedom. Table 1 shows the fit values of the six parameters in the smearing model. The values are close to zero as expected given the curvature corrections that have already been applied. Figure 3 shows the dimuon mass distributions for the , and samples after combining all categories with both muons in the range.
| Parameter | Fit value |
|---|---|
| () | |
| () | |
| () | |
| () | |
The statistical uncertainties in the smearing parameters result in an uncertainty in of . The uncertainty in the world average of the mass [7] leads to an uncertainty of . The uncertainty in the mass is negligible compared to that in the mass. The and the masses have comparable relative uncertainties but the latter has a negligible effect given the limited size of the boson sample. The amount of material in the detector, which affects the modelling of energy losses, is varied by 10%, leading to an uncertainty of . A total uncertainty of is attributed to the shifts in corresponding to: an alternative form of the factor in Eq. 5; and a variation in the region over which is scaled. An uncertainty of is attributed to the modelling of the radiative tails in the and simulation, using the methods described in Ref. [39]. The total uncertainty attributed to the modelling of the momentum scale and resolution is .
5 Efficiency corrections
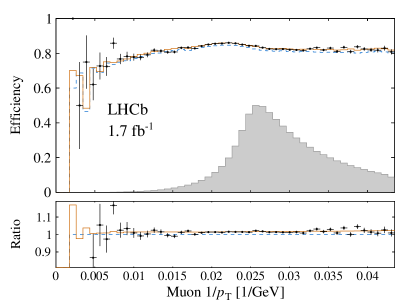
Corrections to the simulation are required for the muon trigger, identification, tracking and isolation efficiencies. The efficiencies are measured using a combination of and, in the case of the trigger efficiency, samples. Positively and negatively charged muons are analysed separately but the results are combined since any charge asymmetries are verified to have a negligible effect.
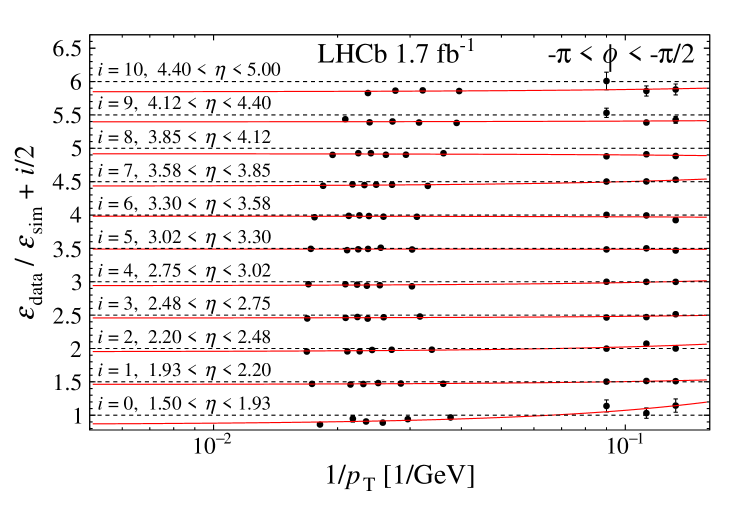
The trigger efficiency, which accounts for the hardware and software stages, is measured using a combination of and events in which one so-called tag muon is required to match a positive decision in the hardware trigger and the first stage of the software-level trigger such that the other muon can be regarded as an unbiased probe of the trigger efficiency. Events are categorised as either matched or unmatched depending on whether the probe muon is matched to a positive trigger decision in the event data record. The sample is verified to be sufficiently pure that the efficiencies can be measured by simply counting the matched and unmatched events with invariant masses within GeV of the known boson mass [7]. The efficiencies are determined in four uniform intervals and eight uniform intervals in the range . There are two additional intervals in the region and one in the region . The sample requires background subtraction by fitting the dimuon invariant mass distribution with a parametric model of the signal and background components.
Three intervals, in the range GeV, are used for the probe muons from decays while for the candidates an adaptive algorithm is employed to determine the intervals. The ratios of the trigger efficiencies in data relative to those in the simulation are shown as a function of of the muon in Fig. 4 for each of the intervals in and . These are overlaid with a linear function of , from which correction weights for the simulated events are evaluated. The weights for the boson model only rely on these functions but the weights for the boson model also require a parameterisation of the absolute efficiency in the simulation such that the efficiency can be correctly modelled for boson candidates with one or two muons matched to a trigger decision. The absolute efficiency is described by an error function that captures the threshold (roughly 6 GeV) of the hardware trigger [28].
The muon identification efficiency is treated in a similar manner to the trigger efficiencies, using events. The resulting event weights, which are applied to the simulated events, are within a few per cent from unity. The tracking efficiency is determined as in previous measurements of and boson production at LHCb [38] using candidates where the probe muons are reconstructed by combining hits from the muon stations and the large-area silicon-strip detector located upstream of the magnet [40]. As neither of these detectors are used in the primary track reconstruction algorithms, the probes can be used to measure the tracking efficiency. Correction factors are evaluated using a similar approach to those of the muon identification efficiency, except that the corrections are assumed to be independent of .
The statistical uncertainties in the muon trigger, tracking and identification efficiency corrections are evaluated by rerunning the relevant steps of the analysis, up to and including the determination, with random fluctuations in the underlying efficiency values. The RMS of the resulting variations in the value is regarded as an uncertainty. A systematic uncertainty is attributed to the dependence of the results on the scheme for and intervals. This includes restricting to a single interval in , reducing the number of intervals (within ) by a factor of two, varying the number of intervals between two and ten, and using the simulation rather than the data to control the adaptive algorithm. Further systematic uncertainties are attributed to variations in the isolation and requirements on the tag muons, the mass windows used to determine the signal yields, and the functions of the dependence of the efficiency ratios. As the probe muons for the tracking efficiency are reconstructed using minimal tracking information, they have a significantly lower momentum resolution and so a dedicated momentum smearing is applied by default. A variation in the size of this smearing is included in the systematic uncertainty evaluation. The total uncertainty associated to the muon trigger, identification and tracking uncertainties is .
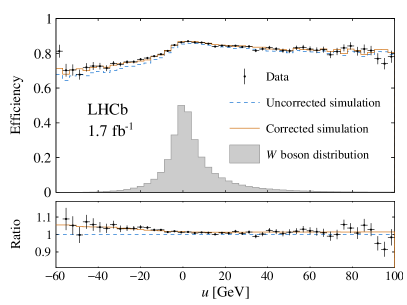
The efficiency of the isolation requirement is measured with events. The isolation variable receives contributions from pile-up, the underlying event and the recoil component of the hard process. The recoil projection for each muon is defined by
| (6) |
where and are the two-dimensional momentum vectors of the muon and the parent vector boson in the transverse plane. Figure 5 (left) shows the isolation requirement efficiency as a function of in the data and simulation. The efficiency is around 80% at positive values of where the underlying event contribution dominates. At negative values of , corresponding to large recoil, the efficiency drops to around 70%. The full reconstruction of the boson in events allows the determination of corrections as a function of defined at reconstruction level and consistently applied to and boson events as a function of defined at generator level, with this approach validated using the boson sample. A map of relative efficiencies between data and simulation is determined in intervals of and and is used to evaluate weights for the simulated events. Figure 5 (right) shows that the dependence of the isolation efficiency on in data is accurately described by the simulation after the corrections. The statistical uncertainties in the isolation efficiency corrections are treated as a source of systematic uncertainty. This is combined in quadrature with a systematic uncertainty that accounts for variations in the and intervals and in a smoothing procedure applied to enhance the effective statistical precision of the correction map. The total uncertainty attributed to the isolation efficiency modelling is .
The modelling of the impact parameter and track fit variables in simulation is improved in two stages, both of which make use of events. Initially, the values of the variables in the simulation are smeared and shifted to match the data. Subsequently, weights are applied to the simulated events to correct for small residual differences in the efficiencies of the selection requirements between data and simulation. In order for the impact parameter modelling to be reliably transported between and boson events, the PVs are refitted with all signal muons removed. The three-dimensional impact parameter is then decomposed into its individual components and these are smeared according to a normal distribution in six intervals in and seven intervals in . A similar procedure is used to improve the modelling of the track fit distribution. These corrections are followed by smaller corrections applied to account for the efficiencies of the impact parameter and track requirements. The efficiency weights are also determined with events and are typically within a few per mille from unity. Neither the statistical uncertainties nor reasonable variations in the and interval schemes are found to have significant impact on the value. Therefore, no systematic uncertainty is considered.
6 QCD background model
A small background from in-flight decays of pions and kaons into muons is present in the sample of boson candidates. This background cannot be modelled with high enough accuracy using full detector simulation. It is therefore modelled using a sample of high- tracks, selected by dedicated triggers without muon identification requirements. The boson selection requirements are applied to this sample but with the muon identification requirement inverted. The resulting sample is verified in simulation to be a pure sample of charged hadrons, composed of roughly 60% pions, 30% kaons and 10% protons, produced directly at the interaction vertex. In particular, the impact parameter requirements suppress the heavy flavour hadron content to a negligible level.
The probability of an unstable hadron of mass , lifetime , and momentum to decay within a detector of length is
| (7) |
Similar kinematic distributions are predicted for pions, kaons and protons in the simulation. Therefore, the in-flight decay background can be modelled by the data with weights of . The majority of the in-flight decays occur outside the magnetic field region and therefore have minimal influence on the measured momentum. The absolute normalisation is not needed because this background component is allowed to vary freely in the fit.
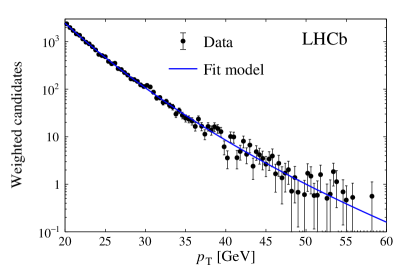
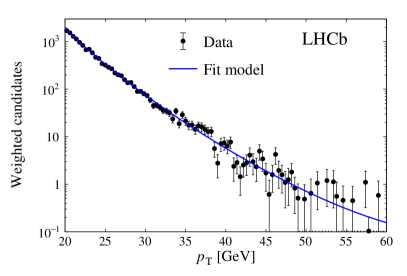
The weighted spectra for both charges are shown in Fig. 6 and are overlaid with best-fit functions of the form [41],
| (8) |
where and are empirical parameters that are determined in the fits. In addition to giving a good fit to the data, this functional form is verified to describe the pion and kaon spectra in simulation. The fit functions are sampled to generate background candidates for inclusion in the fit. A charge asymmetry of (10%), favouring positively charged hadrons due to the initial state, is observed and is included in the sampling.
The uncertainty in the hadronic background model is dominated by systematic sources. Three different systematic uncertainties, which are combined in quadrature, are assessed. The first accounts for assuming that the data sample can be treated as containing a single hadron species. The second accounts for a small bias from the inverted muon identification requirements. The third accounts for a small dependence on the range of values used in the fits to Eq. 8. The combined systematic uncertainty is .
7 Modelling and boson production
The emulation of different hypotheses is achieved by assigning event weights based on a relativistic Breit-Wigner function with a mass-dependent width. Further weight-based corrections are also applied to simulated and boson events to improve upon the limited formal accuracy of Pythia. A weighting to model QCD effects is applied in the basis of Eq. 2. A further weighting to model QED effects is applied as a function of the logarithm of the relative energy difference between the dimuon system before and after QED final-state radiation.
Higher order electroweak corrections are not included in the model. Instead, an uncertainty of 5 MeV is attributed to these missing corrections using samples of events generated using POWHEGBoxV2 [42, 43, 44] with and without electroweak corrections. These events are interfaced with Pythia and the uncertainty is evaluated using the data challenge methods described in Sect. 8.1.
7.1 Candidate QCD programs
Five software programs, or combinations of these, are evaluated as potential candidates for the weighting of the simulated and boson events.
-
1.
Pythia: Events are generated using Pythia version 8.235 [17] with several values of the intrinsic transverse momentum () of the initial state partons and , closely following the work of Ref. [19]. The NNPDF23_lo_as_0130_qed [45] PDFs are used in the event generation. The events are weighted using the methods described in Ref. [46] to the NNPDF31_lo_as_0118 [47] and CT09MCS [48] PDFs.
-
2.
POWHEGPythia: Events are generated using POWHEGBoxV2 [49] with the NNPDF31_nlo_as_0118 PDFs and are subsequently showered with Pythia version 8.244 [17]. The event generation with POWHEGBoxV2 is repeated with different values of . The default Monash [18] tune of Pythia is used but event samples are generated with different values of , and with the same value of as used in POWHEGBoxV2. This results in a grid of predictions with different and values.
-
3.
POWHEGHerwig: Events are generated equivalently to those from POWHEGPythia but substituting Pythia with Herwig [50] for the parton-shower stage.
-
4.
Herwig: These events are also equivalent to those of POWHEGPythia except that the hard process and the parton shower are both fully implemented in Herwig [50].
-
5.
DYTurbo: The cross-sections and angular coefficients are computed at accuracy using DYTurbo [51] with the NNPDF31_nnlo_as_0118 PDFs [47]. Predictions for the unpolarised cross-section include resummation to next-to-next-to-leading logarithms and are produced with several values of the parameter that controls nonperturbative effects.
Histograms of the unpolarised cross-section in Eq. 2 and the angular coefficients are produced for all combinations of programs and tuning parameters. These histograms, which are used to determine event weights, have intervals in the transverse momentum, rapidity and mass of the vector boson.
7.2 QCD weighting and transverse momentum model
The simulated samples described in Sect. 2 can be weighted in the full five-dimensional phase space of vector boson decays, according to Eq. 2, to provide predictions based on different models of QCD. For the unpolarised cross-section such weights are found by interpolating between the generated histograms described above.
A detailed measurement of the angular coefficients in at TeV was reported by ATLAS [52]. Predictions based on parton showers are generally found to be unreliable in predicting the angular coefficients. However, the ATLAS data are reasonably well described by predictions from DYNNLO [53], on which DYTurbo is based. An exception is the difference between and , for which is effectively only leading order, but the present measurement has a negligible sensitivity to this particular detail. Hereafter DYTurbo is used in the modelling of the angular coefficients.
Since the prediction of each angular coefficient relies on separate numerator and denominator calculations, there are four independent renormalisation and factorisation scales that are varied to assess the uncertainty associated with missing higher orders in . In Ref. [54] it is argued that fully correlating the scale variations between the numerator and denominator, which leads to a large degree of cancellation, may result in inadequate uncertainty coverage. The present analysis therefore follows the recommendation of Ref. [54], which is to vary the four scales independently by factors of and 2 with the constraint that all ratios that could be constructed from the four scales are between and . This results in an envelope of 31 values of that sets the associated uncertainty.
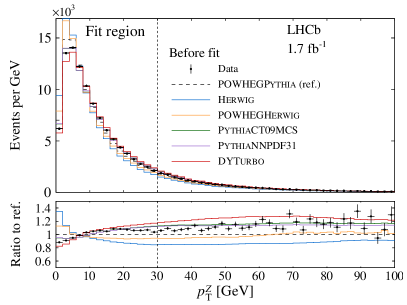
Figure 7 compares the distribution in the data with the Pythia simulation weighted to the different unpolarised cross-section predictions before and after tuning them to the data. Table 2 lists the and the preferred parameter values for the fits with each model. DYTurbo gives a reasonable prediction but overestimates the number of events with large even with tuning of the parameter. A reasonable initial description is provided by Pythia, which is to be expected since it has already been tuned to data. The POWHEGPythia, POWHEGHerwig and Herwig predictions poorly describe the shape of the distribution with their default values of . Their descriptions of the distribution are greatly improved when their and parameters are tuned. Of these programs, POWHEGPythia gives the most reliable description of the data, with a preferred value of around . Large values of are also favoured by other models and in other studies of the distribution [55].555The spread in values between the different models also means that this fit result should not be interpreted as a precise and accurate determination of the value of . Therefore, POWHEGPythia with freely varying and values is selected for the default fitting model. The systematic uncertainty in the description of the and shapes is evaluated with alternative predictions from: Pythia with the CT09MCS and leading-order NNPDF31 PDFs; Herwig and POWHEGHerwig with the next-to-leading-order NNPDF31 PDFs. The envelope of shifts in obtained from using these alternative descriptions is found to be , providing the dominant contribution to the systematic uncertainty associated with the modelling of the vector boson transverse momentum.
All of the event generator predictions can be weighted at leading-order to emulate event generation based on different PDFs. As discussed in Ref. [46] this weighting is not completely valid for events generated at next-to-leading order. Since POWHEGPythia allows in situ computation of next-to-leading order PDF weights, it is possible to directly estimate the inaccuracy of the leading-order approximation. With five NNPDF31_nlo_as_0118 replicas it is verified that the differences between the leading-order and next-to-leading-order weighting approaches are smaller than 1 MeV in the fit.
Since it is computationally expensive to determine fully the PDF uncertainty in the DYTurbo angular coefficients, the variations in the next-to-leading order PDFs used in the POWHEGPythia model of the unpolarised cross-section are coherently propagated to the angular coefficients. The DYTurbo angular coefficients are shifted by the differences in values predicted by POWHEGPythia in the default (NNPDF31_nlo_as_0118) PDF compared to the target PDF in the uncertainty assessment.
Separate measurements of based on the NNPDF3.1 [47], CT18 [56] and MSHT20 [57] PDF sets, each with their own PDF uncertainty estimate, are reported. However, since these three sets are based on almost the same data, the central result of this analysis is a simple arithmetic average of the three results, under the assumption that the three PDF uncertainties are fully correlated.
| Program | /ndf | ||
|---|---|---|---|
| DYTurbo | 208.1/13 | ||
| POWHEGPythia | 30.3/12 | ||
| POWHEGHerwig | 55.6/12 | ||
| Herwig | 41.8/12 | ||
| Pythia, CT09MCS | 69.0/12 | ||
| Pythia, NNPDF31 | 62.1/12 |
7.3 Angular scale factors
The uncertainties in the angular coefficients from DYTurbo would lead to an uncertainty of in , with the dominant contribution attributed to the coefficient. The importance of can be understood by inspection of Eq. 2: an increase in enhances the cross-section for events with large and . The contribution to the muon from the boson mass scales with while the contribution from the transverse momentum of the boson scales with for boson production. By allowing a single scaling factor, which is shared between the and processes, to vary freely in the fit the angular coefficient uncertainty is reduced by roughly a factor of three, to . Effectively the resulting model only depends on DYTurbo for the kinematic dependence of , while all other coefficients are fully modelled by DYTurbo.
7.4 Parametric correction at high transverse momentum
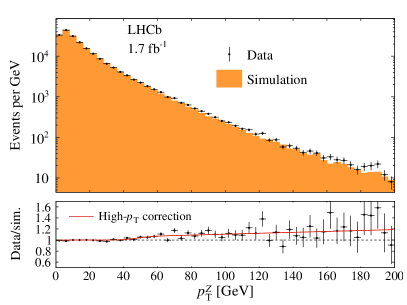
While POWHEGPythia is shown in Sect. 7 to describe the distribution in the region below 30 GeV, it systematically underestimates the cross-section at higher . This is expected due to the missing matrix elements for the production of a weak boson and more than one jet. Figure 8 compares the distribution in the data with the model prediction having set and to be close to the final fit values. For GeV the model starts to underestimate the cross-section, reaching the ten per cent level at GeV. In the lower panel of Fig. 8 the data to prediction ratio is overlaid with a function of the form
| (9) |
Since the universality of this correction between and boson processes is not well controlled, an uncertainty of 100% of this correction is included as an additional systematic uncertainty associated with the vector boson model. This contributes an uncertainty in the value smaller than .
7.5 QED weighting
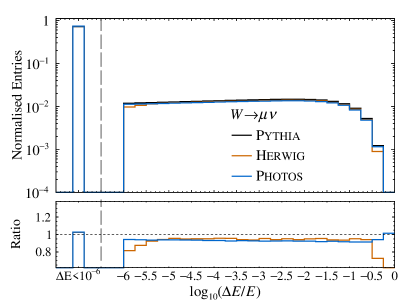
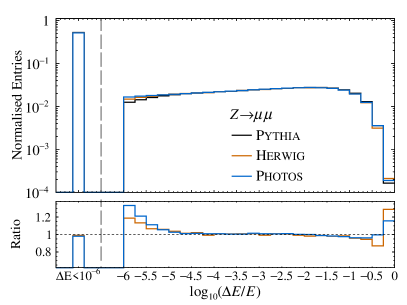
The effect of the QED final-state radiation is largely characterised by the energy difference between the final-state lepton system before and after radiation. The logarithm of this energy difference as described by Pythia, Herwig, and an alternative configuration of Pythia with the final-state radiation modelled by Photos [58] is shown in Fig. 9. Event-by-event weights are evaluated for the Herwig and Photos models relative to Pythia and applied to the simulated samples used in the analysis. The default model uses the arithmetic average of the Herwig, Photos and Pythia weights, where the Pythia weights are equal to unity. The systematic uncertainty, amounting to , is taken from the envelope of values corresponding to each of the three models taken individually.
8 boson mass fit
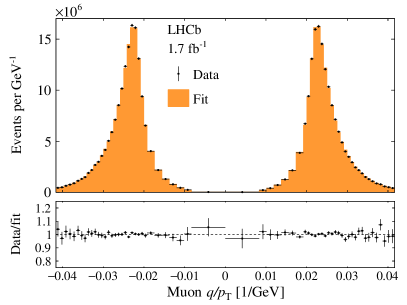
The value is determined through a simultaneous fit of the distribution of boson candidates and the distribution of boson candidates. The variable is preferred over because it is less susceptible to several of the modelling uncertainties, while still being sensitive to the parameters affecting the predicted and distributions. The distribution extends to while the distribution includes two fit regions covering GeV. Projections of the distribution cover a wider interval with GeV that includes regions outside the fit. The model of both distributions is based on simulated event samples with event-by-event weights. The fit minimises the sum of two negative log-likelihood terms, associated with the and distributions, that are computed using the Beeston-Barlow-Lite prescription [59], which accounts for the finite size of the simulated samples. The sum of these terms multiplied by a factor of two is denoted as the .
The distribution is modelled including background contributions from and top quarks. The model of the distribution includes the dominant signal component and several background sources. The largest background, with a fraction of around , is attributed to , which is simulated with true invariant masses above 20 GeV. The and hadronic background components each contribute at the level. A combination of rarer background sources including , top quarks, vector boson pairs, and heavy flavour hadrons gives a total contribution below .
The fractions of the and signal components and the hadronic background are allowed to vary freely. The component is constrained, using the known branching fraction [7], relative to the component. All other component fractions are fixed relative to the observed number of boson candidates in the distribution using the fiducial cross-sections for the corresponding processes relative to that of boson production. The fiducial selections for and boson processes are the same as used in measurements of the corresponding cross-sections [60]. For all other processes the fiducial regions correspond to the requirement of a single muon in the region GeV and . The measured cross-section for is used [38]. The cross-sections for the rare background processes are determined using Powheg with the next-to-leading-order NNPDF3.1 PDF sets.
The shapes of background components arising from the decay of electroweak bosons are determined from the same models used to describe the signal component. Systematic variations of the model used to describe boson production therefore also simultaneously provide systematic variations associated with the shapes of background contributions from the decay of electroweak bosons. The uncertainty in from varying the predicted cross-sections for the rarer background within their uncertainties is negligible.
The default physics model is based on the simulated samples set out in Sect. 2, fully weighted using a combination of POWHEGPythia and DYTurbo for the QCD description and a combination of Pythia, Photos and Herwig for the QED description. The fit is configured to determine the following parameters:
-
1.
the value of ,
-
2.
the fraction of signal,
-
3.
the fraction of signal,
-
4.
the fraction of QCD background,
-
5.
the value of for the boson processes (),
-
6.
an independent value that is shared for the and signals (),
-
7.
a shared value for all and boson processes,
-
8.
and an scale factor that is shared by the and signals.
8.1 Data challenge tests
In Sect. 7 it is concluded that POWHEGPythia describes the distribution, in the GeV region, better than the other candidate models. It is important to demonstrate that the fit can reliably determine if boson production is better described by one or more of the other models. Several pseudodata samples are prepared in which the underlying Pythia events, without detector simulation, are weighted to match the default DYTurbo and POWHEGPythia model but with the distribution modified to match an alternative model. The fit is configured with a simplified model, without background components, using a statistically independent sample of the same Pythia events without detector simulation. Figure 10 shows the resulting and distributions of these pseudodata samples. Variations of up to five per cent are seen in the shape of the distribution. Within the fit regions in variations of several per cent can be seen, while the variations exceed in the high- control region. However, the fit model is able to absorb these differences in the and nuisance parameters with variations in the preferred value of no more than 10 MeV. Table 3 lists the results of the fits to these pseudodata samples. The observed variation in is consistent with the uncertainty due to modelling the vector boson transverse momentum distribution in the fit to LHCb data, as discussed in Sect. 7.
| Data config. | [MeV] | scaling | ||||
|---|---|---|---|---|---|---|
| POWHEGPythia | – | |||||
| Herwig | ||||||
| POWHEGHerwig | ||||||
| Pythia, CT09MCS | ||||||
| Pythia, NNPDF31 | ||||||
| DYTurbo |
8.2 Fit results
The fit to the data, with the NNPDF31_nlo_as_0118 PDF set, returns a total of 105 for 102 degrees of freedom. Figure 11 compares the and distributions from the data with the fit model overlaid. The model is in good agreement with the data within the fit ranges but it underestimates the high- control region of the distribution by up to ten per cent. This underestimation is within the band of modelling uncertainty, which is dominated by the high- parametric correction in that region. The values of the eight parameters determined from the fit are listed in Table 4. The value for the boson events is roughly higher than for the boson events. If the fit is configured with a shared value for the and boson events the value of changes by but the is increased by more than 20 units, which strongly favours the configuration with independent values. Furthermore, similar variations between the values for and boson events are found in the data challenge tests, as shown in Table 3. The scaling factor is statistically consistent with unity, which suggests that the predictions from DYTurbo, with the central scale choices, are compatible with the data.
| Parameter | Value | |
|---|---|---|
| Fraction of | ||
| Fraction of | ||
| Fraction of hadron background | ||
| GeV | ||
| scaling | ||
| 80362 | 23 MeV |
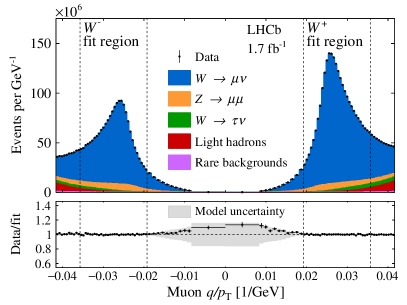
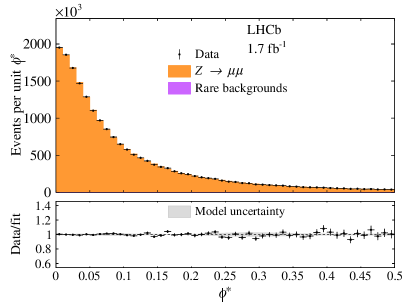
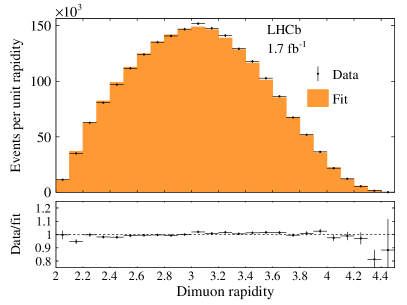
Figure 12 (left) shows the projection of the distribution in the boson sample, where the final state muon is only included if it satisfies the boson selection requirements. The model is in good agreement with the data. Figure 12 (right) shows that the boson rapidity distribution is well described by the model.
9 Systematic uncertainties and cross-checks
Table 5 lists the PDF uncertainties evaluated for fits based on the NNPDF3.1, CT18 and MSHT20 PDF sets. The values agree within an envelope of , which supports the choice to report an arithmetic average of the three. With respect to the central value obtained with the NNPDF31 PDFs, the values obtained with the CT18 and MSHT20 PDF sets differ by MeV and MeV, respectively. The uncertainties are evaluated according to the specific methods for the three groups. The NNPDF3.1 uncertainty is evaluated as the RMS of values according to 100 replicas, whereas the other two sets use fixed numbers of eigenvectors. The CT18 uncertainty is corrected from 90% confidence level (CL) to 68% CL to be consistent with all other uncertainties in this analysis. For each PDF set, the uncertainty from the replica variations is added in quadrature to the uncertainty from variations in the used in the PDF fits. Values of are considered, and the uncertainty in is taken as half of the absolute difference between the corresponding shifts in [61].666The variations in are larger than the variations recommended in Ref. [61] but this choice avoids further ad hoc scaling. The PDF uncertainty on the arithmetic average of the three results is taken as the arithmetic average of the three uncertainties, in accordance with the assumption that the uncertainties are fully correlated.
| Set | [ MeV ] | [ MeV ] | [ MeV ] |
|---|---|---|---|
| NNPDF3.1 | |||
| CT18 | |||
| MSHT20 |
Table 6 lists each contribution to the systematic uncertainty in the final result, after averaging results based on the three PDF sets. The systematic uncertainty is split into three orthogonal components that are combined in quadrature. The uncertainty due to the description of the parton distribution functions is MeV. The remaining theory uncertainty in the modelling of and boson production is MeV, as described in Sect. 7, with the largest contribution arising from variations of the transverse momentum model. The experimental uncertainty is MeV, with the different contributions discussed in Sects. 4, 5, and 6.
| Source | Size [ MeV ] |
|---|---|
| Parton distribution functions | |
| Theory (excl. PDFs) total | |
| Transverse momentum model | |
| Angular coefficients | |
| QED FSR model | |
| Additional electroweak corrections | |
| Experimental total | |
| Momentum scale and resolution modelling | |
| Muon ID, trigger and tracking efficiency | |
| Isolation efficiency | |
| QCD background | |
| Statistical | |
| Total |
Independently of the systematic uncertainty evaluation, several cross-checks of the measurement are performed.
-
•
Consistency of orthogonal subsets: The data and simulation are split into orthogonal subsets by magnet polarity, the product of the muon charge and polarity, and the and of the muon in the boson selection. These results are reported in Table 7. Considering the statistical uncertainties only, all differences are within, or just outside, two standard deviations, which was predefined as a criterion for this test.
-
•
Fit range: The minimum and maximum of the fit range in the distribution are varied around their default values of GeV and GeV, respectively. The results are reported in Table 8. Considering the variations in the statistical uncertainties in this test shows that the fit results are stable with respect to variations in the fit range.
-
•
Fit model freedom: The choice of parameters that are determined in the fit is varied and the results are reported in Table 9. The default fit determines one parameter for the processes and a second that is shared between and processes. With three parameters there is only a small change in and the fit quality. The default fit determines a single floating parameter that is shared among all three processes. Neither the value nor the are strongly affected by allowing two (with one shared between the and processes) or three parameters to vary freely. If the scaling factor is fixed to unity the value of shifts by 7 MeV and the increases by a few units. In summary the fit seems to be rather insensitive to all of these variations, except that the data strongly prefer independent POWHEGPythia tunes for the and boson production processes.
-
•
Use of NNLO PDF sets: The PDF set used for the analysis is varied from NNPDF31_nlo_as_0118 to NNPDF31_nnlo_as_0118. The shift in is .
-
•
Separate values for and bosons: an additional parameter is included in the fit, allowing for separate values of for and bosons. This mass difference is found to be consistent with zero within one standard deviation.
-
•
-like measurement of the boson mass: the same methods are applied to the boson sample alone, to perform a -like measurement of the boson mass. The values measured with positive and negatively charged muons agree within one standard deviation and their average is consistent with the PDG average [7] within one standard deviation.
| Subset | /ndf | [ MeV ] |
|---|---|---|
| Polarity | – | |
| Polarity | ||
| – | ||
| Polarity | – | |
| Polarity | ||
| – | ||
| – | ||
| Change to fit range | /ndf | [ MeV ] | [ MeV ] |
|---|---|---|---|
| GeV | |||
| GeV | |||
| GeV | |||
| GeV | |||
| GeV | |||
| GeV | |||
| GeV | |||
| GeV |
| Configuration change | /ndf | [ MeV ] | [ MeV ] |
|---|---|---|---|
| parameters | |||
| and parameters | |||
| parameters | |||
| parameters | |||
| No scaling | |||
| Varying QCD background asymmetry |
10 Summary and Conclusion
This paper reports the first measurement of with the LHCb experiment. A data sample of collisions at corresponding to an integrated luminosity of 1.7 fb-1 is analysed. The measurement is based on the shape of the distribution of muons from boson decays. A simultaneous fit of the distribution of boson decay candidates and of the distribution of boson decay candidates is verified to reliably determine . This method has reduced sensitivity to the uncertainties in modelling the boson transverse momentum distribution compared to previous determinations of at hadron colliders. The following results are obtained
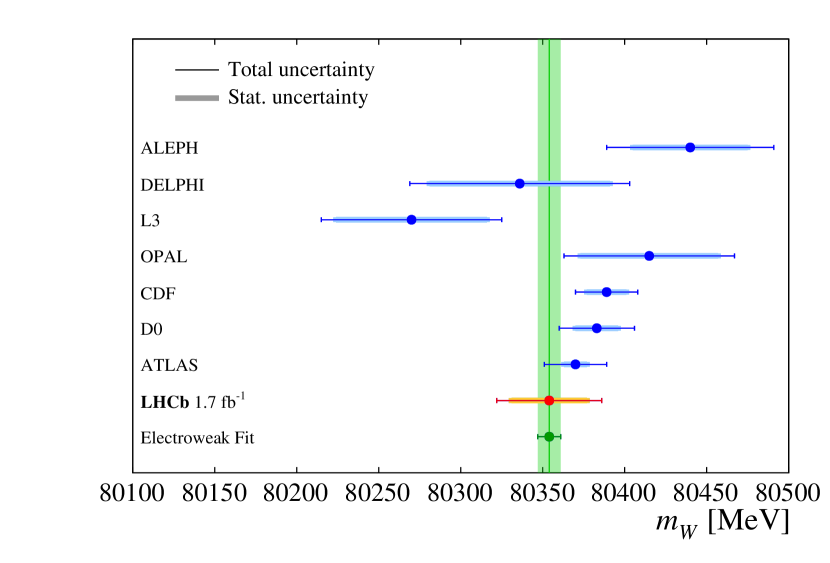
with the NNPDF3.1, CT18 and MSHT20 PDF sets, respectively. The first uncertainty is statistical, the second is due to experimental systematic uncertainties, and the third and fourth are due to uncertainties in the theoretical modelling and the description of the PDFs, respectively. Treating the three PDF sets equally results in the following arithmetic average
This result agrees with the current PDG average of direct measurements [7] and the indirect prediction from the global EW fit [6], and is compared to previous measurements in Fig. 13. This measurement also serves as a first proof-of-principle of a measurement of with the LHCb experiment. In Ref. [66] it was demonstrated that the PDF uncertainty in a measurement of by LHCb can be strongly reduced by using in situ constraints and by fitting the doubly differential distribution of and , similar to the measurement by the CMS Collaboration [67], instead of the singly differential distribution. An approximately three times larger data sample is already available for analysis but particular attention should be paid to reducing the dominant source of systematic uncertainty, which is the modelling of boson production.
Acknowledgements
We express our gratitude to our colleagues in the CERN accelerator departments for the excellent performance of the LHC. We thank the technical and administrative staff at the LHCb institutes. We acknowledge support from CERN and from the national agencies: CAPES, CNPq, FAPERJ and FINEP (Brazil); MOST and NSFC (China); CNRS/IN2P3 (France); BMBF, DFG and MPG (Germany); INFN (Italy); NWO (Netherlands); MNiSW and NCN (Poland); MEN/IFA (Romania); MSHE (Russia); MICINN (Spain); SNSF and SER (Switzerland); NASU (Ukraine); STFC (United Kingdom); DOE NP and NSF (USA). We acknowledge the computing resources that are provided by CERN, IN2P3 (France), KIT and DESY (Germany), INFN (Italy), SURF (Netherlands), PIC (Spain), GridPP (United Kingdom), RRCKI and Yandex LLC (Russia), CSCS (Switzerland), IFIN-HH (Romania), CBPF (Brazil), PL-GRID (Poland) and NERSC (USA). We are indebted to the communities behind the multiple open-source software packages on which we depend. Individual groups or members have received support from ARC and ARDC (Australia); AvH Foundation (Germany); EPLANET, Marie Skłodowska-Curie Actions and ERC (European Union); A*MIDEX, ANR, IPhU and Labex P2IO, and Région Auvergne-Rhône-Alpes (France); Key Research Program of Frontier Sciences of CAS, CAS PIFI, CAS CCEPP, Fundamental Research Funds for the Central Universities, and Sci. & Tech. Program of Guangzhou (China); RFBR, RSF and Yandex LLC (Russia); GVA, XuntaGal and GENCAT (Spain); the Leverhulme Trust, the Royal Society and UKRI (United Kingdom).
References
- [1] S. L. Glashow, Partial Symmetries of Weak Interactions, Nucl. Phys. 22 (1961) 579
- [2] S. Weinberg, A model of leptons, Phys. Rev. Lett. 19 (1967) 1264
- [3] A. Salam and J. C. Ward, Electromagnetic and weak interactions, Physics Letters 13 (1964) 168
- [4] M. Awramik, M. Czakon, A. Freitas, and G. Weiglein, Precise prediction for the W boson mass in the standard model, Phys. Rev. D69 (2004) 053006, arXiv:hep-ph/0311148
- [5] A. Sirlin, Radiative corrections in the theory: A simple renormalization framework, Phys. Rev. D22 (1980) 971
- [6] J. Haller et al., Update of the global electroweak fit and constraints on two-Higgs-doublet models, Eur. Phys. J. C78 (2018) 675, arXiv:1803.01853
- [7] Particle Data Group, P. A. Zyla et al., Review of particle physics, Prog. Theor. Exp. Phys. 2020 (2020) 083C01
- [8] ALEPH, DELPHI, L3, OPAL, LEP Electroweak collaboration, S. Schael et al., Electroweak Measurements in Electron-Positron Collisions at W-Boson-Pair Energies at LEP, Phys. Rept. 532 (2013) 119, arXiv:1302.3415
- [9] CDF, D0 collaboration, T. A. Aaltonen et al., Combination of CDF and D0 -boson mass measurements, Phys. Rev. D 88 (2013) 052018, arXiv:1307.7627
- [10] CDF collaboration, T. Aaltonen et al., Precise measurement of the -boson mass with the CDF II detector, Phys. Rev. Lett. 108 (2012) 151803, arXiv:1203.0275
- [11] D0 collaboration, V. M. Abazov et al., Measurement of the W Boson mass with the D0 Detector, Phys. Rev. Lett. 108 (2012) 151804, arXiv:1203.0293
- [12] ATLAS collaboration, M. Aaboud et al., Measurement of the -boson mass in pp collisions at TeV with the ATLAS detector, Eur. Phys. J. C78 (2018) 110, Erratum ibid. C78 (2018) 898, arXiv:1701.07240
- [13] G. Bozzi et al., Prospects for improving the LHC W boson mass measurement with forward muons, Eur. Phys. J. C75 (2015) 601, arXiv:1508.06954
- [14] G. Aad et al., Measurement of the transverse momentum distribution of W bosons in pp collisions sqrts=7 TeV with the ATLAS detector, Physical Review D85 (2012) , arXiv:1108.6308
- [15] CMS collaboration, V. Khachatryan et al., Measurement of the transverse momentum spectra of weak vector bosons produced in proton-proton collisions at TeV, JHEP 02 (2017) 096, arXiv:1606.05864
- [16] A. Banfi et al., Optimisation of variables for studying dilepton transverse momentum distributions at hadron colliders, Eur. Phys. J. C 71 (2011) 1600, arXiv:1009.1580
- [17] T. Sjöstrand et al., An introduction to PYTHIA 8.2, Comput. Phys. Commun. 191 (2015) 159, arXiv:1410.3012
- [18] P. Skands, S. Carrazza, and J. Rojo, Tuning PYTHIA 8.1: the Monash 2013 Tune, Eur. Phys. J. C74 (2014) 3024, arXiv:1404.5630
- [19] O. Lupton and M. Vesterinen, Simultaneously determining the boson mass and parton shower model parameters, arXiv:1907.09958
- [20] J. C. Collins and D. E. Soper, Angular distribution of dileptons in high-energy hadron collisions, Phys. Rev. D16 (1977) 2219
- [21] LHCb collaboration, A. A. Alves Jr. et al., The LHCb detector at the LHC, JINST 3 (2008) S08005
- [22] LHCb collaboration, R. Aaij et al., LHCb detector performance, Int. J. Mod. Phys. A30 (2015) 1530022, arXiv:1412.6352
- [23] R. Aaij et al., Performance of the LHCb Vertex Locator, JINST 9 (2014) P09007, arXiv:1405.7808
- [24] P. d’Argent et al., Improved performance of the LHCb Outer Tracker in LHC Run 2, JINST 12 (2017) P11016, arXiv:1708.00819
- [25] M. Adinolfi et al., Performance of the LHCb RICH detector at the LHC, Eur. Phys. J. C73 (2013) 2431, arXiv:1211.6759
- [26] A. A. Alves Jr. et al., Performance of the LHCb muon system, JINST 8 (2013) P02022, arXiv:1211.1346
- [27] R. Aaij et al., The LHCb trigger and its performance in 2011, JINST 8 (2013) P04022, arXiv:1211.3055
- [28] R. Aaij et al., Performance of the LHCb trigger and full real-time reconstruction in Run 2 of the LHC, JINST 14 (2019) P04013, arXiv:1812.10790
- [29] W. D. Hulsbergen, The global covariance matrix of tracks fitted with a Kalman filter and an application in detector alignment, Nucl. Instr. Meth. 600 (2009) 471–477, arXiv:0810.2241
- [30] J. Amoraal et al., Application of vertex and mass constraints in track-based alignment, Nucl. Instrum. Meth. 712 (2013) 48–55, arXiv:1207.4756
- [31] I. Belyaev et al., Handling of the generation of primary events in Gauss, the LHCb simulation framework, J. Phys. Conf. Ser. 331 (2011) 032047
- [32] Geant4 collaboration, J. Allison et al., Geant4 developments and applications, IEEE Trans. Nucl. Sci. 53 (2006) 270
- [33] Geant4 collaboration, S. Agostinelli et al., Geant4: A simulation toolkit, Nucl. Instrum. Meth. A506 (2003) 250
- [34] M. Clemencic et al., The LHCb simulation application, Gauss: Design, evolution and experience, J. Phys. Conf. Ser. 331 (2011) 032023
- [35] LHCb collaboration, R. Aaij et al., Study of forward +jet production in collisions at 7 TeV, JHEP 01 (2014) 033, arXiv:1310.8197
- [36] W. Barter, M. Pili, and M. Vesterinen, A simple method to determine charge-dependent curvature biases in track reconstruction in hadron collider experiments, Eur. Phys. J. C81 (2021) 251, arXiv:2101.05675
- [37] T. Skwarnicki, A study of the radiative cascade transitions between the Upsilon-prime and Upsilon resonances, PhD thesis, Institute of Nuclear Physics, Krakow, 1986, DESY-F31-86-02
- [38] LHCb collaboration, R. Aaij et al., Measurement of the forward boson production cross-section in collisions at 13 TeV, JHEP 09 (2016) 136, arXiv:1607.06495
- [39] LHCb collaboration, R. Aaij et al., Production of and mesons in collisions at 8 TeV, JHEP 06 (2013) 064, arXiv:1304.6977
- [40] LHCb collaboration, R. Aaij et al., Measurement of the track reconstruction efficiency at LHCb, JINST 10 (2015) P02007, arXiv:1408.1251
- [41] R. Hagedorn, Multiplicities, Distributions and the Expected Hadron Quark - Gluon Phase Transition, Riv. Nuovo Cim. 6N10 (1983) 1
- [42] L. Barze et al., Implementation of electroweak corrections in the POWHEG BOX: single W production, JHEP 04 (2012) 037, arXiv:1202.0465
- [43] L. Barze et al., Neutral current Drell-Yan with combined QCD and electroweak corrections in the POWHEG BOX, Eur. Phys. J. C73 (2013) 2474, arXiv:1302.4606
- [44] C. M. Carloni Calame et al., Precision Measurement of the W-Boson mass: Theoretical Contributions and Uncertainties, Phys. Rev. D96 (2017) 093005, arXiv:1612.02841
- [45] NNPDF collaboration, R. D. Ball et al., Parton distributions with QED corrections, Nucl. Phys. B877 (2013) 290, arXiv:1308.0598
- [46] A. Buckley et al., LHAPDF6: parton density access in the LHC precision era, Eur. Phys. J. C75 (2015) 132, arXiv:1412.7420
- [47] NNPDF collaboration, R. D. Ball et al., Parton distributions from high-precision collider data, Eur. Phys. J. C77 (2017) 663, arXiv:1706.00428
- [48] H.-L. Lai et al., Parton Distributions for Event Generators, JHEP 04 (2010) 035, arXiv:0910.4183
- [49] S. Alioli, P. Nason, C. Oleari, and E. Re, NLO vector-boson production matched with shower in POWHEG, JHEP 07 (2008) 060, arXiv:0805.4802
- [50] J. Bellm et al., Herwig 7.0/Herwig++ 3.0 release note, Eur. Phys. J. C76 (2016) 196, arXiv:1512.01178
- [51] S. Camarda et al., DYTurbo: fast predictions for Drell–Yan processes, Eur. Phys. J. C80 (2020) 251, Erratum ibid. C80 (2020) 440, arXiv:1910.07049
- [52] ATLAS collaboration, G. Aad et al., Measurement of the angular coefficients in -boson events using electron and muon pairs from data taken at TeV with the ATLAS detector, JHEP 08 (2016) 159, arXiv:1606.00689
- [53] S. Catani et al., Vector boson production at hadron colliders: a fully exclusive QCD calculation at NNLO, Phys. Rev. Lett. 103 (2009) 082001, arXiv:0903.2120
- [54] R. Gauld et al., Precise predictions for the angular coefficients in Z-boson production at the LHC, JHEP 11 (2017) 003, arXiv:1708.00008
- [55] NNPDF collaboration, R. D. Ball et al., Precision determination of the strong coupling constant within a global PDF analysis, Eur. Phys. J. C78 (2018) 408, arXiv:1802.03398
- [56] T.-J. Hou et al., New CTEQ global analysis of quantum chromodynamics with high-precision data from the LHC, Phys. Rev. D103 (2021) 014013, arXiv:1912.10053
- [57] S. Bailey et al., Parton distributions from LHC, HERA, Tevatron and fixed target data: MSHT20 PDFs, Eur. Phys. J. C81 (2021) 341, arXiv:2012.04684
- [58] N. Davidson, T. Przedzinski, and Z. Was, PHOTOS interface in C++: Technical and physics documentation, Comp. Phys. Comm. 199 (2016) 86, arXiv:1011.0937
- [59] R. J. Barlow and C. Beeston, Fitting using finite Monte Carlo samples, Comput. Phys. Commun. 77 (1993) 219
- [60] LHCb collaboration, R. Aaij et al., Measurement of forward and boson production in collisions at 8 TeV, JHEP 01 (2016) 155, arXiv:1511.08039
- [61] J. Butterworth et al., PDF4LHC recommendations for LHC Run II, J. Phys. G43 (2016) 023001, arXiv:1510.03865
- [62] ALEPH collaboration, S. Schael et al., Measurement of the boson mass and width in collisions at LEP, Eur. Phys. J. C 47 (2006) 309, arXiv:hep-ex/0605011
- [63] DELPHI collaboration, J. Abdallah et al., Measurement of the mass and width of the boson in collisions at = 161-GeV - 209-GeV, Eur. Phys. J. C 55 (2008) 1, arXiv:0803.2534
- [64] L3 collaboration, P. Achard et al., Measurement of the mass and the width of the boson at LEP, Eur. Phys. J. C 45 (2006) 569, arXiv:hep-ex/0511049
- [65] OPAL collaboration, G. Abbiendi et al., Measurement of the mass and width of the boson, Eur. Phys. J. C 45 (2006) 307, arXiv:hep-ex/0508060
- [66] S. Farry et al., Understanding and constraining the PDF uncertainties in a boson mass measurement with forward muons at the LHC, Eur. Phys. J. C79 (2019) 497, arXiv:1902.04323
- [67] CMS collaboration, A. M. Sirunyan et al., Measurements of the boson rapidity, helicity, double-differential cross sections, and charge asymmetry in collisions at = 13 TeV, Phys. Rev. D 102 (2020) 092012, arXiv:2008.04174
LHCb collaboration
R. Aaij32,
A.S.W. Abdelmotteleb56,
C. Abellán Beteta50,
T. Ackernley60,
B. Adeva46,
M. Adinolfi54,
H. Afsharnia9,
C. Agapopoulou13,
C.A. Aidala86,
S. Aiola25,
Z. Ajaltouni9,
S. Akar65,
J. Albrecht15,
F. Alessio48,
M. Alexander59,
A. Alfonso Albero45,
Z. Aliouche62,
G. Alkhazov38,
P. Alvarez Cartelle55,
S. Amato2,
J.L. Amey54,
Y. Amhis11,
L. An48,
L. Anderlini22,
A. Andreianov38,
M. Andreotti21,
F. Archilli17,
A. Artamonov44,
M. Artuso68,
K. Arzymatov42,
E. Aslanides10,
M. Atzeni50,
B. Audurier12,
S. Bachmann17,
M. Bachmayer49,
J.J. Back56,
P. Baladron Rodriguez46,
V. Balagura12,
W. Baldini21,
J. Baptista Leite1,
M. Barbetti22,
R.J. Barlow62,
S. Barsuk11,
W. Barter61,
M. Bartolini24,
F. Baryshnikov83,
J.M. Basels14,
S. Bashir34,
G. Bassi29,
B. Batsukh68,
A. Battig15,
A. Bay49,
A. Beck56,
M. Becker15,
F. Bedeschi29,
I. Bediaga1,
A. Beiter68,
V. Belavin42,
S. Belin27,
V. Bellee50,
K. Belous44,
I. Belov40,
I. Belyaev41,
G. Bencivenni23,
E. Ben-Haim13,
A. Berezhnoy40,
R. Bernet50,
D. Berninghoff17,
H.C. Bernstein68,
C. Bertella48,
A. Bertolin28,
C. Betancourt50,
F. Betti48,
Ia. Bezshyiko50,
S. Bhasin54,
J. Bhom35,
L. Bian73,
M.S. Bieker15,
S. Bifani53,
P. Billoir13,
M. Birch61,
F.C.R. Bishop55,
A. Bitadze62,
A. Bizzeti22,k,
M. Bjørn63,
M.P. Blago48,
T. Blake56,
F. Blanc49,
S. Blusk68,
D. Bobulska59,
J.A. Boelhauve15,
O. Boente Garcia46,
T. Boettcher65,
A. Boldyrev82,
A. Bondar43,
N. Bondar38,48,
S. Borghi62,
M. Borisyak42,
M. Borsato17,
J.T. Borsuk35,
S.A. Bouchiba49,
T.J.V. Bowcock60,
A. Boyer48,
C. Bozzi21,
M.J. Bradley61,
S. Braun66,
A. Brea Rodriguez46,
M. Brodski48,
J. Brodzicka35,
A. Brossa Gonzalo56,
D. Brundu27,
A. Buonaura50,
L. Buonincontri28,
A.T. Burke62,
C. Burr48,
A. Bursche72,
A. Butkevich39,
J.S. Butter32,
J. Buytaert48,
W. Byczynski48,
S. Cadeddu27,
H. Cai73,
R. Calabrese21,f,
L. Calefice15,13,
L. Calero Diaz23,
S. Cali23,
R. Calladine53,
M. Calvi26,j,
M. Calvo Gomez85,
P. Camargo Magalhaes54,
P. Campana23,
A.F. Campoverde Quezada6,
S. Capelli26,j,
L. Capriotti20,d,
A. Carbone20,d,
G. Carboni31,
R. Cardinale24,
A. Cardini27,
I. Carli4,
P. Carniti26,j,
L. Carus14,
K. Carvalho Akiba32,
A. Casais Vidal46,
G. Casse60,
M. Cattaneo48,
G. Cavallero48,
S. Celani49,
J. Cerasoli10,
D. Cervenkov63,
A.J. Chadwick60,
M.G. Chapman54,
M. Charles13,
Ph. Charpentier48,
G. Chatzikonstantinidis53,
C.A. Chavez Barajas60,
M. Chefdeville8,
C. Chen3,
S. Chen4,
A. Chernov35,
V. Chobanova46,
S. Cholak49,
M. Chrzaszcz35,
A. Chubykin38,
V. Chulikov38,
P. Ciambrone23,
M.F. Cicala56,
X. Cid Vidal46,
G. Ciezarek48,
P.E.L. Clarke58,
M. Clemencic48,
H.V. Cliff55,
J. Closier48,
J.L. Cobbledick62,
V. Coco48,
J.A.B. Coelho11,
J. Cogan10,
E. Cogneras9,
L. Cojocariu37,
P. Collins48,
T. Colombo48,
L. Congedo19,c,
A. Contu27,
N. Cooke53,
G. Coombs59,
I. Corredoira 46,
G. Corti48,
C.M. Costa Sobral56,
B. Couturier48,
D.C. Craik64,
J. Crkovská67,
M. Cruz Torres1,
R. Currie58,
C.L. Da Silva67,
S. Dadabaev83,
L. Dai71,
E. Dall’Occo15,
J. Dalseno46,
C. D’Ambrosio48,
A. Danilina41,
P. d’Argent48,
J.E. Davies62,
A. Davis62,
O. De Aguiar Francisco62,
K. De Bruyn79,
S. De Capua62,
M. De Cian49,
J.M. De Miranda1,
L. De Paula2,
M. De Serio19,c,
D. De Simone50,
P. De Simone23,
J.A. de Vries80,
C.T. Dean67,
D. Decamp8,
V. Dedu10,
L. Del Buono13,
B. Delaney55,
H.-P. Dembinski15,
A. Dendek34,
V. Denysenko50,
D. Derkach82,
O. Deschamps9,
F. Desse11,
F. Dettori27,e,
B. Dey77,
A. Di Cicco23,
P. Di Nezza23,
S. Didenko83,
L. Dieste Maronas46,
H. Dijkstra48,
V. Dobishuk52,
C. Dong3,
A.M. Donohoe18,
F. Dordei27,
A.C. dos Reis1,
L. Douglas59,
A. Dovbnya51,
A.G. Downes8,
M.W. Dudek35,
L. Dufour48,
V. Duk78,
P. Durante48,
J.M. Durham67,
D. Dutta62,
A. Dziurda35,
A. Dzyuba38,
S. Easo57,
U. Egede69,
V. Egorychev41,
S. Eidelman43,v,
S. Eisenhardt58,
S. Ek-In49,
L. Eklund59,w,
S. Ely68,
A. Ene37,
E. Epple67,
S. Escher14,
J. Eschle50,
S. Esen13,
T. Evans48,
A. Falabella20,
J. Fan3,
Y. Fan6,
B. Fang73,
S. Farry60,
D. Fazzini26,j,
M. Féo48,
A. Fernandez Prieto46,
J.M. Fernandez-tenllado Arribas45,
A.D. Fernez66,
F. Ferrari20,d,
L. Ferreira Lopes49,
F. Ferreira Rodrigues2,
S. Ferreres Sole32,
M. Ferrillo50,
M. Ferro-Luzzi48,
S. Filippov39,
R.A. Fini19,
M. Fiorini21,f,
M. Firlej34,
K.M. Fischer63,
D.S. Fitzgerald86,
C. Fitzpatrick62,
T. Fiutowski34,
A. Fkiaras48,
F. Fleuret12,
M. Fontana13,
F. Fontanelli24,h,
R. Forty48,
D. Foulds-Holt55,
V. Franco Lima60,
M. Franco Sevilla66,
M. Frank48,
E. Franzoso21,
G. Frau17,
C. Frei48,
D.A. Friday59,
J. Fu25,
Q. Fuehring15,
E. Gabriel32,
A. Gallas Torreira46,
D. Galli20,d,
S. Gambetta58,48,
Y. Gan3,
M. Gandelman2,
P. Gandini25,
Y. Gao5,
M. Garau27,
L.M. Garcia Martin56,
P. Garcia Moreno45,
J. García Pardiñas26,j,
B. Garcia Plana46,
F.A. Garcia Rosales12,
L. Garrido45,
C. Gaspar48,
R.E. Geertsema32,
D. Gerick17,
L.L. Gerken15,
E. Gersabeck62,
M. Gersabeck62,
T. Gershon56,
D. Gerstel10,
Ph. Ghez8,
L. Giambastiani28,
V. Gibson55,
H.K. Giemza36,
A.L. Gilman63,
M. Giovannetti23,p,
A. Gioventù46,
P. Gironella Gironell45,
L. Giubega37,
C. Giugliano21,f,48,
K. Gizdov58,
E.L. Gkougkousis48,
V.V. Gligorov13,
C. Göbel70,
E. Golobardes85,
D. Golubkov41,
A. Golutvin61,83,
A. Gomes1,a,
S. Gomez Fernandez45,
F. Goncalves Abrantes63,
M. Goncerz35,
G. Gong3,
P. Gorbounov41,
I.V. Gorelov40,
C. Gotti26,
E. Govorkova48,
J.P. Grabowski17,
T. Grammatico13,
L.A. Granado Cardoso48,
E. Graugés45,
E. Graverini49,
G. Graziani22,
A. Grecu37,
L.M. Greeven32,
N.A. Grieser4,
L. Grillo62,
S. Gromov83,
B.R. Gruberg Cazon63,
C. Gu3,
M. Guarise21,
M. Guittiere11,
P. A. Günther17,
E. Gushchin39,
A. Guth14,
Y. Guz44,
T. Gys48,
T. Hadavizadeh69,
G. Haefeli49,
C. Haen48,
J. Haimberger48,
T. Halewood-leagas60,
P.M. Hamilton66,
J.P. Hammerich60,
Q. Han7,
X. Han17,
T.H. Hancock63,
S. Hansmann-Menzemer17,
N. Harnew63,
T. Harrison60,
C. Hasse48,
M. Hatch48,
J. He6,b,
M. Hecker61,
K. Heijhoff32,
K. Heinicke15,
A.M. Hennequin48,
K. Hennessy60,
L. Henry48,
J. Heuel14,
A. Hicheur2,
D. Hill49,
M. Hilton62,
S.E. Hollitt15,
R. Hou7,
Y. Hou6,
J. Hu17,
J. Hu72,
W. Hu7,
X. Hu3,
W. Huang6,
X. Huang73,
W. Hulsbergen32,
R.J. Hunter56,
M. Hushchyn82,
D. Hutchcroft60,
D. Hynds32,
P. Ibis15,
M. Idzik34,
D. Ilin38,
P. Ilten65,
A. Inglessi38,
A. Ishteev83,
K. Ivshin38,
R. Jacobsson48,
H. Jage14,
S. Jakobsen48,
E. Jans32,
B.K. Jashal47,
A. Jawahery66,
V. Jevtic15,
M. Jezabek35,
F. Jiang3,
M. John63,
D. Johnson48,
C.R. Jones55,
T.P. Jones56,
B. Jost48,
N. Jurik48,
S.H. Kalavan Kadavath34,
S. Kandybei51,
Y. Kang3,
M. Karacson48,
M. Karpov82,
F. Keizer48,
D.M. Keller68,
M. Kenzie56,
T. Ketel33,
B. Khanji15,
A. Kharisova84,
S. Kholodenko44,
T. Kirn14,
V.S. Kirsebom49,
O. Kitouni64,
S. Klaver32,
N. Kleijne29,
K. Klimaszewski36,
M.R. Kmiec36,
S. Koliiev52,
A. Kondybayeva83,
A. Konoplyannikov41,
P. Kopciewicz34,
R. Kopecna17,
P. Koppenburg32,
M. Korolev40,
I. Kostiuk32,52,
O. Kot52,
S. Kotriakhova21,38,
P. Kravchenko38,
L. Kravchuk39,
R.D. Krawczyk48,
M. Kreps56,
F. Kress61,
S. Kretzschmar14,
P. Krokovny43,v,
W. Krupa34,
W. Krzemien36,
W. Kucewicz35,t,
M. Kucharczyk35,
V. Kudryavtsev43,v,
H.S. Kuindersma32,33,
G.J. Kunde67,
T. Kvaratskheliya41,
D. Lacarrere48,
G. Lafferty62,
A. Lai27,
A. Lampis27,
D. Lancierini50,
J.J. Lane62,
R. Lane54,
G. Lanfranchi23,
C. Langenbruch14,
J. Langer15,
O. Lantwin83,
T. Latham56,
F. Lazzari29,q,
R. Le Gac10,
S.H. Lee86,
R. Lefèvre9,
A. Leflat40,
S. Legotin83,
O. Leroy10,
T. Lesiak35,
B. Leverington17,
H. Li72,
P. Li17,
S. Li7,
Y. Li4,
Y. Li4,
Z. Li68,
X. Liang68,
T. Lin61,
R. Lindner48,
V. Lisovskyi15,
R. Litvinov27,
G. Liu72,
H. Liu6,
S. Liu4,
A. Lobo Salvia45,
A. Loi27,
J. Lomba Castro46,
I. Longstaff59,
J.H. Lopes2,
S. Lopez Solino46,
G.H. Lovell55,
Y. Lu4,
C. Lucarelli22,
D. Lucchesi28,l,
S. Luchuk39,
M. Lucio Martinez32,
V. Lukashenko32,
Y. Luo3,
A. Lupato62,
E. Luppi21,f,
O. Lupton56,
A. Lusiani29,m,
X. Lyu6,
L. Ma4,
R. Ma6,
S. Maccolini20,d,
F. Machefert11,
F. Maciuc37,
V. Macko49,
P. Mackowiak15,
S. Maddrell-Mander54,
O. Madejczykt,
L.R. Madhan Mohan54,
O. Maev38,
A. Maevskiy82,
D. Maisuzenko38,
M.W. Majewskit,
J.J. Malczewski35,
S. Malde63,
B. Malecki48,
A. Malinin81,
T. Maltsev43,v,
H. Malygina17,
G. Manca27,e,
G. Mancinelli10,
D. Manuzzi20,d,
D. Marangotto25,i,
J. Maratas9,s,
J.F. Marchand8,
U. Marconi20,
S. Mariani22,g,
C. Marin Benito48,
M. Marinangeli49,
J. Marks17,
A.M. Marshall54,
P.J. Marshall60,
G. Martelli78,
G. Martellotti30,
L. Martinazzoli48,j,
M. Martinelli26,j,
D. Martinez Santos46,
F. Martinez Vidal47,
A. Massafferri1,
M. Materok14,
R. Matev48,
A. Mathad50,
Z. Mathe48,
V. Matiunin41,
C. Matteuzzi26,
K.R. Mattioli86,
A. Mauri32,
E. Maurice12,
J. Mauricio45,
M. Mazurek48,
M. McCann61,
L. Mcconnell18,
T.H. Mcgrath62,
N.T. Mchugh59,
A. McNab62,
R. McNulty18,
J.V. Mead60,
B. Meadows65,
G. Meier15,
N. Meinert76,
D. Melnychuk36,
S. Meloni26,j,
M. Merk32,80,
A. Merli25,
L. Meyer Garcia2,
M. Mikhasenko48,
D.A. Milanes74,
E. Millard56,
M. Milovanovic48,
M.-N. Minard8,
A. Minotti26,j,
L. Minzoni21,f,
S.E. Mitchell58,
B. Mitreska62,
D.S. Mitzel48,
A. Mödden 15,
R.A. Mohammed63,
R.D. Moise61,
T. Mombächer46,
I.A. Monroy74,
S. Monteil9,
M. Morandin28,
G. Morello23,
M.J. Morello29,m,
J. Moron34,
A.B. Morris75,
A.G. Morris56,
R. Mountain68,
H. Mu3,
F. Muheim58,48,
M. Mulder48,
D. Müller48,
K. Müller50,
C.H. Murphy63,
D. Murray62,
P. Muzzetto27,48,
P. Naik54,
T. Nakada49,
R. Nandakumar57,
T. Nanut49,
I. Nasteva2,
M. Needham58,
I. Neri21,
N. Neri25,i,
S. Neubert75,
N. Neufeld48,
R. Newcombe61,
T.D. Nguyen49,
C. Nguyen-Mau49,x,
E.M. Niel11,
S. Nieswand14,
N. Nikitin40,
N.S. Nolte64,
C. Normand8,
C. Nunez86,
A. Oblakowska-Mucha34,
V. Obraztsov44,
T. Oeser14,
D.P. O’Hanlon54,
S. Okamura21,
R. Oldeman27,e,
F. Oliva58,
M.E. Olivares68,
C.J.G. Onderwater79,
R.H. O’neil58,
A. Ossowska35,
J.M. Otalora Goicochea2,
T. Ovsiannikova41,
P. Owen50,
A. Oyanguren47,
K.O. Padeken75,
B. Pagare56,
P.R. Pais48,
T. Pajero63,
A. Palano19,
M. Palutan23,
Y. Pan62,
G. Panshin84,
A. Papanestis57,
M. Pappagallo19,c,
L.L. Pappalardo21,f,
C. Pappenheimer65,
W. Parker66,
C. Parkes62,
B. Passalacqua21,
G. Passaleva22,
A. Pastore19,
M. Patel61,
C. Patrignani20,d,
C.J. Pawley80,
A. Pearce48,
A. Pellegrino32,
M. Pepe Altarelli48,
S. Perazzini20,
D. Pereima41,
A. Pereiro Castro46,
P. Perret9,
I. Petrenko52,
M. Petric59,48,
K. Petridis54,
A. Petrolini24,h,
A. Petrov81,
S. Petrucci58,
M. Petruzzo25,
T.T.H. Pham68,
L. Pica29,m,
M. Piccini78,
B. Pietrzyk8,
G. Pietrzyk49,
M. Pili63,
D. Pinci30,
F. Pisani48,
M. Pizzichemi48,
Resmi P.K10,
V. Placinta37,
J. Plews53,
M. Plo Casasus46,
F. Polci13,
M. Poli Lener23,
M. Poliakova68,
A. Poluektov10,
N. Polukhina83,u,
I. Polyakov68,
E. Polycarpo2,
S. Ponce48,
D. Popov6,48,
S. Popov42,
S. Poslavskii44,
K. Prasanth35,
L. Promberger48,
C. Prouve46,
V. Pugatch52,
V. Puill11,
H. Pullen63,
G. Punzi29,n,
H. Qi3,
W. Qian6,
J. Qin6,
N. Qin3,
R. Quagliani13,54,
B. Quintana8,
N.V. Raab18,
R.I. Rabadan Trejo6,
B. Rachwal34,
J.H. Rademacker54,
M. Rama29,
M. Ramos Pernas56,
M.S. Rangel2,
F. Ratnikov42,82,
G. Raven33,
M. Reboud8,
F. Redi49,
F. Reiss62,
C. Remon Alepuz47,
Z. Ren3,
V. Renaudin63,
R. Ribatti29,
S. Ricciardi57,
K. Rinnert60,
P. Robbe11,
G. Robertson58,
A.B. Rodrigues49,
E. Rodrigues60,
J.A. Rodriguez Lopez74,
E. Rodriguez Rodriguez46,
A. Rollings63,
P. Roloff48,
V. Romanovskiy44,
M. Romero Lamas46,
A. Romero Vidal46,
J.D. Roth86,
M. Rotondo23,
M.S. Rudolph68,
T. Ruf48,
R.A. Ruiz Fernandez46,
J. Ruiz Vidal47,
A. Ryzhikov82,
J. Ryzka34,
J.J. Saborido Silva46,
N. Sagidova38,
N. Sahoo56,
B. Saitta27,e,
M. Salomoni48,
D. Sanchez Gonzalo45,
C. Sanchez Gras32,
R. Santacesaria30,
C. Santamarina Rios46,
M. Santimaria23,
E. Santovetti31,p,
D. Saranin83,
G. Sarpis59,
M. Sarpis75,
A. Sarti30,
C. Satriano30,o,
A. Satta31,
M. Saur15,
D. Savrina41,40,
H. Sazak9,
L.G. Scantlebury Smead63,
A. Scarabotto13,
S. Schael14,
S. Scherl60,
M. Schiller59,
H. Schindler48,
M. Schmelling16,
B. Schmidt48,
S. Schmitt14,
O. Schneider49,
A. Schopper48,
M. Schubiger32,
S. Schulte49,
M.H. Schune11,
R. Schwemmer48,
B. Sciascia23,48,
S. Sellam46,
A. Semennikov41,
M. Senghi Soares33,
A. Sergi24,
N. Serra50,
L. Sestini28,
A. Seuthe15,
Y. Shang5,
D.M. Shangase86,
M. Shapkin44,
I. Shchemerov83,
L. Shchutska49,
T. Shears60,
L. Shekhtman43,v,
Z. Shen5,
V. Shevchenko81,
E.B. Shields26,j,
Y. Shimizu11,
E. Shmanin83,
J.D. Shupperd68,
B.G. Siddi21,
R. Silva Coutinho50,
G. Simi28,
S. Simone19,c,
N. Skidmore62,
T. Skwarnicki68,
M.W. Slater53,
I. Slazyk21,f,
J.C. Smallwood63,
J.G. Smeaton55,
A. Smetkina41,
E. Smith50,
M. Smith61,
A. Snoch32,
M. Soares20,
L. Soares Lavra9,
M.D. Sokoloff65,
F.J.P. Soler59,
A. Solovev38,
I. Solovyev38,
F.L. Souza De Almeida2,
B. Souza De Paula2,
B. Spaan15,
E. Spadaro Norella25,
P. Spradlin59,
F. Stagni48,
M. Stahl65,
S. Stahl48,
S. Stanislaus63,
O. Steinkamp50,83,
O. Stenyakin44,
H. Stevens15,
S. Stone68,
M. Straticiuc37,
D. Strekalina83,
F. Suljik63,
J. Sun27,
L. Sun73,
Y. Sun66,
P. Svihra62,
P.N. Swallow53,
K. Swientek34,
A. Szabelski36,
T. Szumlak34,
M. Szymanski48,
S. Taneja62,
A.R. Tanner54,
M.D. Tat63,
A. Terentev83,
F. Teubert48,
E. Thomas48,
D.J.D. Thompson53,
K.A. Thomson60,
V. Tisserand9,
S. T’Jampens8,
M. Tobin4,
L. Tomassetti21,f,
X. Tong5,
D. Torres Machado1,
D.Y. Tou13,
M.T. Tran49,
E. Trifonova83,
C. Trippl49,
G. Tuci29,n,
A. Tully49,
N. Tuning32,48,
A. Ukleja36,
D.J. Unverzagt17,
E. Ursov83,
A. Usachov32,
A. Ustyuzhanin42,82,
U. Uwer17,
A. Vagner84,
V. Vagnoni20,
A. Valassi48,
G. Valenti20,
N. Valls Canudas85,
M. van Beuzekom32,
M. Van Dijk49,
E. van Herwijnen83,
C.B. Van Hulse18,
M. van Veghel79,
R. Vazquez Gomez46,
P. Vazquez Regueiro46,
C. Vázquez Sierra48,
S. Vecchi21,
J.J. Velthuis54,
M. Veltri22,r,
A. Venkateswaran68,
M. Veronesi32,
M. Vesterinen56,
D. Vieira65,
M. Vieites Diaz49,
H. Viemann76,
X. Vilasis-Cardona85,
E. Vilella Figueras60,
A. Villa20,
P. Vincent13,
F.C. Volle11,
D. Vom Bruch10,
A. Vorobyev38,
V. Vorobyev43,v,
N. Voropaev38,
K. Vos80,
R. Waldi17,
J. Walsh29,
C. Wang17,
J. Wang5,
J. Wang4,
J. Wang3,
J. Wang73,
M. Wang3,
R. Wang54,
Y. Wang7,
Z. Wang50,
Z. Wang3,
Z. Wang6,
J.A. Ward56,
N.K. Watson53,
S.G. Weber13,
D. Websdale61,
C. Weisser64,
B.D.C. Westhenry54,
D.J. White62,
M. Whitehead54,
A.R. Wiederhold56,
D. Wiedner15,
G. Wilkinson63,
M. Wilkinson68,
I. Williams55,
M. Williams64,
M.R.J. Williams58,
F.F. Wilson57,
W. Wislicki36,
M. Witek35,
L. Witola17,
G. Wormser11,
S.A. Wotton55,
H. Wu68,
K. Wyllie48,
Z. Xiang6,
D. Xiao7,
Y. Xie7,
A. Xu5,
J. Xu6,
L. Xu3,
M. Xu7,
Q. Xu6,
Z. Xu5,
Z. Xu6,
D. Yang3,
S. Yang6,
Y. Yang6,
Z. Yang5,
Z. Yang66,
Y. Yao68,
L.E. Yeomans60,
H. Yin7,
J. Yu71,
X. Yuan68,
O. Yushchenko44,
E. Zaffaroni49,
M. Zavertyaev16,u,
M. Zdybal35,
O. Zenaiev48,
M. Zeng3,
D. Zhang7,
L. Zhang3,
S. Zhang71,
S. Zhang5,
Y. Zhang5,
Y. Zhang63,
A. Zharkova83,
A. Zhelezov17,
Y. Zheng6,
T. Zhou5,
X. Zhou6,
Y. Zhou6,
V. Zhovkovska11,
X. Zhu3,
X. Zhu7,
Z. Zhu6,
V. Zhukov14,40,
J.B. Zonneveld58,
Q. Zou4,
S. Zucchelli20,d,
D. Zuliani28,
G. Zunica62.
1Centro Brasileiro de Pesquisas Físicas (CBPF), Rio de Janeiro, Brazil
2Universidade Federal do Rio de Janeiro (UFRJ), Rio de Janeiro, Brazil
3Center for High Energy Physics, Tsinghua University, Beijing, China
4Institute Of High Energy Physics (IHEP), Beijing, China
5School of Physics State Key Laboratory of Nuclear Physics and Technology, Peking University, Beijing, China
6University of Chinese Academy of Sciences, Beijing, China
7Institute of Particle Physics, Central China Normal University, Wuhan, Hubei, China
8Univ. Savoie Mont Blanc, CNRS, IN2P3-LAPP, Annecy, France
9Université Clermont Auvergne, CNRS/IN2P3, LPC, Clermont-Ferrand, France
10Aix Marseille Univ, CNRS/IN2P3, CPPM, Marseille, France
11Université Paris-Saclay, CNRS/IN2P3, IJCLab, Orsay, France
12Laboratoire Leprince-Ringuet, CNRS/IN2P3, Ecole Polytechnique, Institut Polytechnique de Paris, Palaiseau, France
13LPNHE, Sorbonne Université, Paris Diderot Sorbonne Paris Cité, CNRS/IN2P3, Paris, France
14I. Physikalisches Institut, RWTH Aachen University, Aachen, Germany
15Fakultät Physik, Technische Universität Dortmund, Dortmund, Germany
16Max-Planck-Institut für Kernphysik (MPIK), Heidelberg, Germany
17Physikalisches Institut, Ruprecht-Karls-Universität Heidelberg, Heidelberg, Germany
18School of Physics, University College Dublin, Dublin, Ireland
19INFN Sezione di Bari, Bari, Italy
20INFN Sezione di Bologna, Bologna, Italy
21INFN Sezione di Ferrara, Ferrara, Italy
22INFN Sezione di Firenze, Firenze, Italy
23INFN Laboratori Nazionali di Frascati, Frascati, Italy
24INFN Sezione di Genova, Genova, Italy
25INFN Sezione di Milano, Milano, Italy
26INFN Sezione di Milano-Bicocca, Milano, Italy
27INFN Sezione di Cagliari, Monserrato, Italy
28Universita degli Studi di Padova, Universita e INFN, Padova, Padova, Italy
29INFN Sezione di Pisa, Pisa, Italy
30INFN Sezione di Roma La Sapienza, Roma, Italy
31INFN Sezione di Roma Tor Vergata, Roma, Italy
32Nikhef National Institute for Subatomic Physics, Amsterdam, Netherlands
33Nikhef National Institute for Subatomic Physics and VU University Amsterdam, Amsterdam, Netherlands
34AGH - University of Science and Technology, Faculty of Physics and Applied Computer Science, Kraków, Poland
35Henryk Niewodniczanski Institute of Nuclear Physics Polish Academy of Sciences, Kraków, Poland
36National Center for Nuclear Research (NCBJ), Warsaw, Poland
37Horia Hulubei National Institute of Physics and Nuclear Engineering, Bucharest-Magurele, Romania
38Petersburg Nuclear Physics Institute NRC Kurchatov Institute (PNPI NRC KI), Gatchina, Russia
39Institute for Nuclear Research of the Russian Academy of Sciences (INR RAS), Moscow, Russia
40Institute of Nuclear Physics, Moscow State University (SINP MSU), Moscow, Russia
41Institute of Theoretical and Experimental Physics NRC Kurchatov Institute (ITEP NRC KI), Moscow, Russia
42Yandex School of Data Analysis, Moscow, Russia
43Budker Institute of Nuclear Physics (SB RAS), Novosibirsk, Russia
44Institute for High Energy Physics NRC Kurchatov Institute (IHEP NRC KI), Protvino, Russia, Protvino, Russia
45ICCUB, Universitat de Barcelona, Barcelona, Spain
46Instituto Galego de Física de Altas Enerxías (IGFAE), Universidade de Santiago de Compostela, Santiago de Compostela, Spain
47Instituto de Fisica Corpuscular, Centro Mixto Universidad de Valencia - CSIC, Valencia, Spain
48European Organization for Nuclear Research (CERN), Geneva, Switzerland
49Institute of Physics, Ecole Polytechnique Fédérale de Lausanne (EPFL), Lausanne, Switzerland
50Physik-Institut, Universität Zürich, Zürich, Switzerland
51NSC Kharkiv Institute of Physics and Technology (NSC KIPT), Kharkiv, Ukraine
52Institute for Nuclear Research of the National Academy of Sciences (KINR), Kyiv, Ukraine
53University of Birmingham, Birmingham, United Kingdom
54H.H. Wills Physics Laboratory, University of Bristol, Bristol, United Kingdom
55Cavendish Laboratory, University of Cambridge, Cambridge, United Kingdom
56Department of Physics, University of Warwick, Coventry, United Kingdom
57STFC Rutherford Appleton Laboratory, Didcot, United Kingdom
58School of Physics and Astronomy, University of Edinburgh, Edinburgh, United Kingdom
59School of Physics and Astronomy, University of Glasgow, Glasgow, United Kingdom
60Oliver Lodge Laboratory, University of Liverpool, Liverpool, United Kingdom
61Imperial College London, London, United Kingdom
62Department of Physics and Astronomy, University of Manchester, Manchester, United Kingdom
63Department of Physics, University of Oxford, Oxford, United Kingdom
64Massachusetts Institute of Technology, Cambridge, MA, United States
65University of Cincinnati, Cincinnati, OH, United States
66University of Maryland, College Park, MD, United States
67Los Alamos National Laboratory (LANL), Los Alamos, United States
68Syracuse University, Syracuse, NY, United States
69School of Physics and Astronomy, Monash University, Melbourne, Australia, associated to 56
70Pontifícia Universidade Católica do Rio de Janeiro (PUC-Rio), Rio de Janeiro, Brazil, associated to 2
71Physics and Micro Electronic College, Hunan University, Changsha City, China, associated to 7
72Guangdong Provincial Key Laboratory of Nuclear Science, Guangdong-Hong Kong Joint Laboratory of Quantum Matter, Institute of Quantum Matter, South China Normal University, Guangzhou, China, associated to 3
73School of Physics and Technology, Wuhan University, Wuhan, China, associated to 3
74Departamento de Fisica , Universidad Nacional de Colombia, Bogota, Colombia, associated to 13
75Universität Bonn - Helmholtz-Institut für Strahlen und Kernphysik, Bonn, Germany, associated to 17
76Institut für Physik, Universität Rostock, Rostock, Germany, associated to 17
77Eotvos Lorand University, Budapest, Hungary, associated to 48
78INFN Sezione di Perugia, Perugia, Italy, associated to 21
79Van Swinderen Institute, University of Groningen, Groningen, Netherlands, associated to 32
80Universiteit Maastricht, Maastricht, Netherlands, associated to 32
81National Research Centre Kurchatov Institute, Moscow, Russia, associated to 41
82National Research University Higher School of Economics, Moscow, Russia, associated to 42
83National University of Science and Technology “MISIS”, Moscow, Russia, associated to 41
84National Research Tomsk Polytechnic University, Tomsk, Russia, associated to 41
85DS4DS, La Salle, Universitat Ramon Llull, Barcelona, Spain, associated to 45
86University of Michigan, Ann Arbor, United States, associated to 68
aUniversidade Federal do Triângulo Mineiro (UFTM), Uberaba-MG, Brazil
bHangzhou Institute for Advanced Study, UCAS, Hangzhou, China
cUniversità di Bari, Bari, Italy
dUniversità di Bologna, Bologna, Italy
eUniversità di Cagliari, Cagliari, Italy
fUniversità di Ferrara, Ferrara, Italy
gUniversità di Firenze, Firenze, Italy
hUniversità di Genova, Genova, Italy
iUniversità degli Studi di Milano, Milano, Italy
jUniversità di Milano Bicocca, Milano, Italy
kUniversità di Modena e Reggio Emilia, Modena, Italy
lUniversità di Padova, Padova, Italy
mScuola Normale Superiore, Pisa, Italy
nUniversità di Pisa, Pisa, Italy
oUniversità della Basilicata, Potenza, Italy
pUniversità di Roma Tor Vergata, Roma, Italy
qUniversità di Siena, Siena, Italy
rUniversità di Urbino, Urbino, Italy
sMSU - Iligan Institute of Technology (MSU-IIT), Iligan, Philippines
tAGH - University of Science and Technology, Faculty of Computer Science, Electronics and Telecommunications, Kraków, Poland
uP.N. Lebedev Physical Institute, Russian Academy of Science (LPI RAS), Moscow, Russia
vNovosibirsk State University, Novosibirsk, Russia
wDepartment of Physics and Astronomy, Uppsala University, Uppsala, Sweden
xHanoi University of Science, Hanoi, Vietnam