2021 outburst of RS Oph 29 August 2021
The 2021 outburst of RS Oph. A pictorial atlas of the spectroscopic evolution: the first 18 days
Ulisse Munari1 and Paolo Valisa2
1: INAF National Institute of Astrophysics, 36012 Asiago, Italy
2: ANS Collaboration, c/o Astronomical Observatory, 36012 Asiago, Italy
Abstract. A pictorial atlas of the spectroscopic evolution at optical wavelengths is presented for the first 18 days of the 2021 outburst of the recurrent nova RS Oph, prior to the emergence of high ionization emission lines. The spectra presented here have been obtained at daily cadence with the Asiago 1.22m + B&C (3200-7900 Ang, 2.3 Å/pix) and Varese 0.84m + Echelle telescopes (4250-8900 Å, resolving power 18,000). The spectra have been fully calibrated in IRAF, absolutely fluxed, and heliocentric corrected. The Echelle spectra have been also corrected for telluric absorptions.
INTRODUCTION
The recurrent nova and symbiotic binary RS Oph underwent a new outburst in August 2021, following previous ones recorded in 1898, 1933, 1958, 1967, 1985 and 2006. At each new event a better coverage of the eruption was obtained with observations progressively expanding to cover the whole electromagnetic spectrum. For the 2006 event, an impressive amount of data has been gathered, and the book RS Ophiuchi (2006) and the Recurrent Nova Phenomenon edited by Bode, O’Brien & Darnley (2008, ASPC 401) provides a detailed summary of the main results.
Yet, a comprehensive and detailed mapping of the spectral evolution at optical wavelengths seems missing, at leat at the level of completeness, detail and homogeneity of the present atlas. It aims to fill the gap, by providing a quick pictorial guide to the spectral evolution of RS Oph during the first 18 days of the 2021 outburst. To make the atlas promptly available, we just describe how the observations have been collected and how the reduced spectra have been incorporated in the atlas. This is of course no substitute for a proper analysis, to be carried out in due time. The latter will benefit from continued observations covering the rest of the evolution of RS Oph as well as comparison with the results of observations carried out at other wavelengths (and not yet published).
While presenting this first batch of spectra, our monitoring of RS Oph will continue at daily cadence for as long as possible, and updates to this atlas are planned for later epochs.
The current atlas covers the first 18 days of the eruption (August 8 to 26), those characterized by low ionization conditions. From day +19 (August 27), the evolution has progressed to the emergence of higher ionization lines (HeII, [FeVII]) as reported by Shore et al. (2021b,c).
The current outburst has triggered observations of RS Oph over the whole electromagnetic spectrum. Preliminar reports have been presented by Cheung et al. (2021a,b) and Wagner & HESS Collaboration (2021a,b) for -rays; Enoto et al. (2021a,b), Ferrigno et al. (2021), Luna et al. (2021), Page (2021), Page et al. (2021), Rout et al. (2021) and Shidatsu et al. (2021) for the X-rays; Mikolajewska et al. (2021), Munari U., Valisa P., (2021a,b), Shore et al. (2021a,b,c), and Taguchi et al. (2021a,b) for the optical; Woodward et al. (2021) for the infrared; and Sokolovsky et al. (2021) and Williams et al. (2021) for the radio. The results of the search for neutrino emission has been given by Pizzuto et al. (2021), and on the polarization of optical light by Nikolov & Luna (2021). A great summary of the main results obtained on the previous outburst of RS Oph in 2006 is the conference proceedings edited by Evans et al. (2008).
OBSERVATIONS
RS Oph has been observed each day for the first 18 days of its 2021 eruption with the Echelle slit-spectrograph mounted on the Varese 0.84m telescope. The spectra have been recorded over the range 4250-8900 Å, at a 18,000 resolving power. The data reduction has been performed in IRAF and has included all usual steps of correction for bias, dark and flat, sky subtraction, wavelength calibration (via Thorium lamp), and heliocentric correction. Spectrophotometric standards, located close on the sky to RS Oph, have been observed each night soon before and after the nova to achieve an optimal flux calibration, which was also essential to accurately merge the individual 30 Echelle orders into a single 1D fluxed spectrum not affected by dents at the points of jointure. Telluric dividers were observed each night similarly to the spectrophotometric standards, to properly remove from the spectra of RS Oph the presence of telluric absorption lines. A journal of the Echelle observations is provided in Table 1. The poor quality of the spectrum for Aug 12 is due to cloud cover persisting all night.
RS Oph was also observed on almost each day for the first 18 days of its 2021 eruption with the B&C spectrograph attached to the Asiago 1.22m telescope, allowing to cover the 3200-7900 Å range at 2.3 Å/pix dispersion. The B&C spectra have been equally and fully reduced in IRAF and flux calibrated against spectrophotometric standards observed each night at a similar height on the horizon as RS Oph. A journal of the B&C observations is presented in Table 2.
At both telescopes a great emphasis has been put on maintaining the highest homogeneity throughout the observing campaign on the instrument set-up, choice of standards, observation and data reduction procedures. Any difference between the spectra presented in this atlas is more intrinsic to RS Oph than due to any stage of the observing process.
THE ATLAS
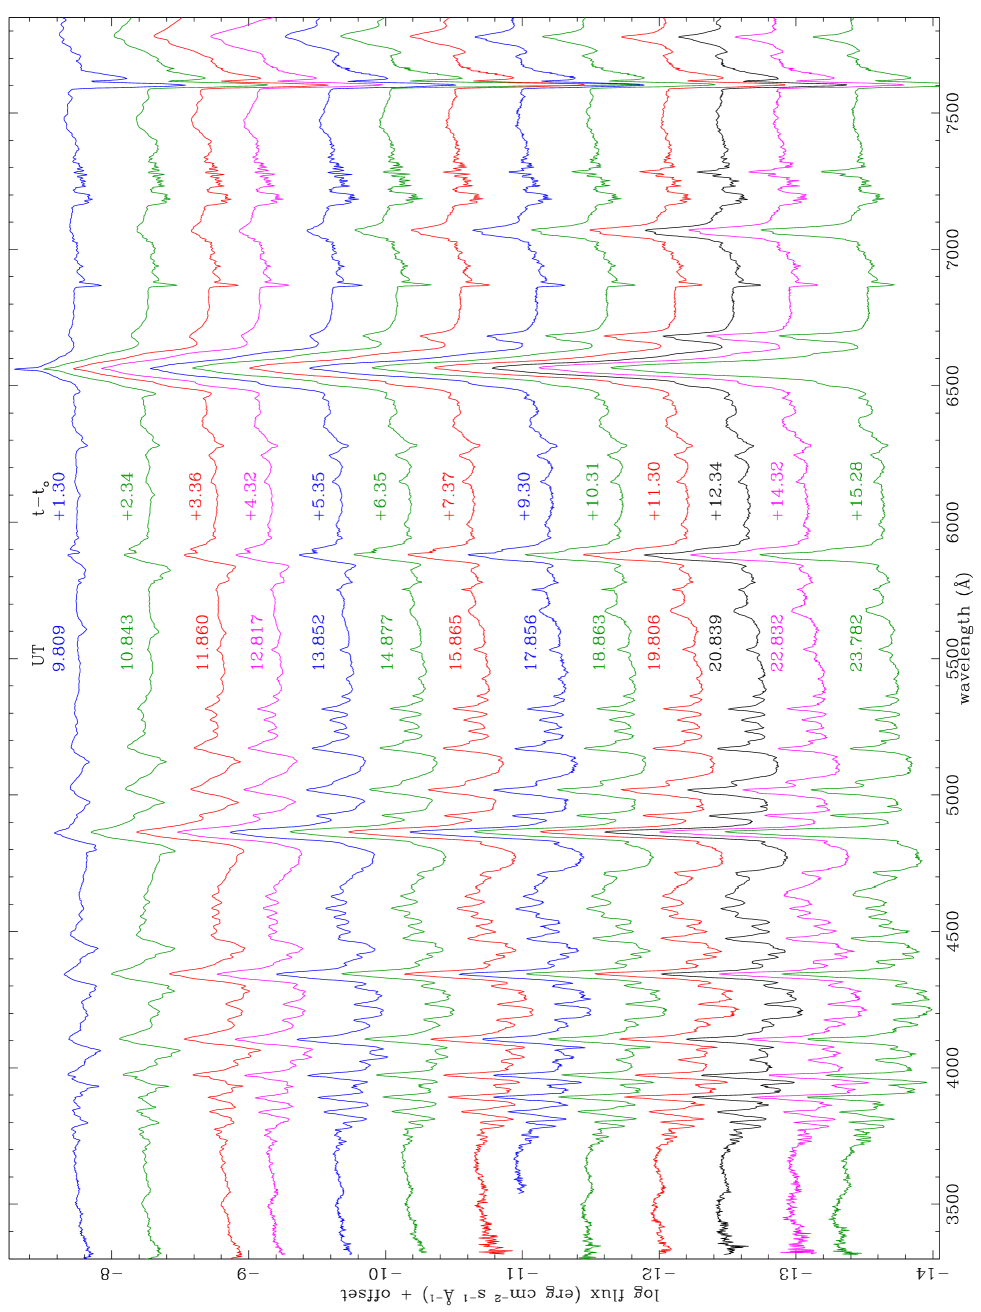
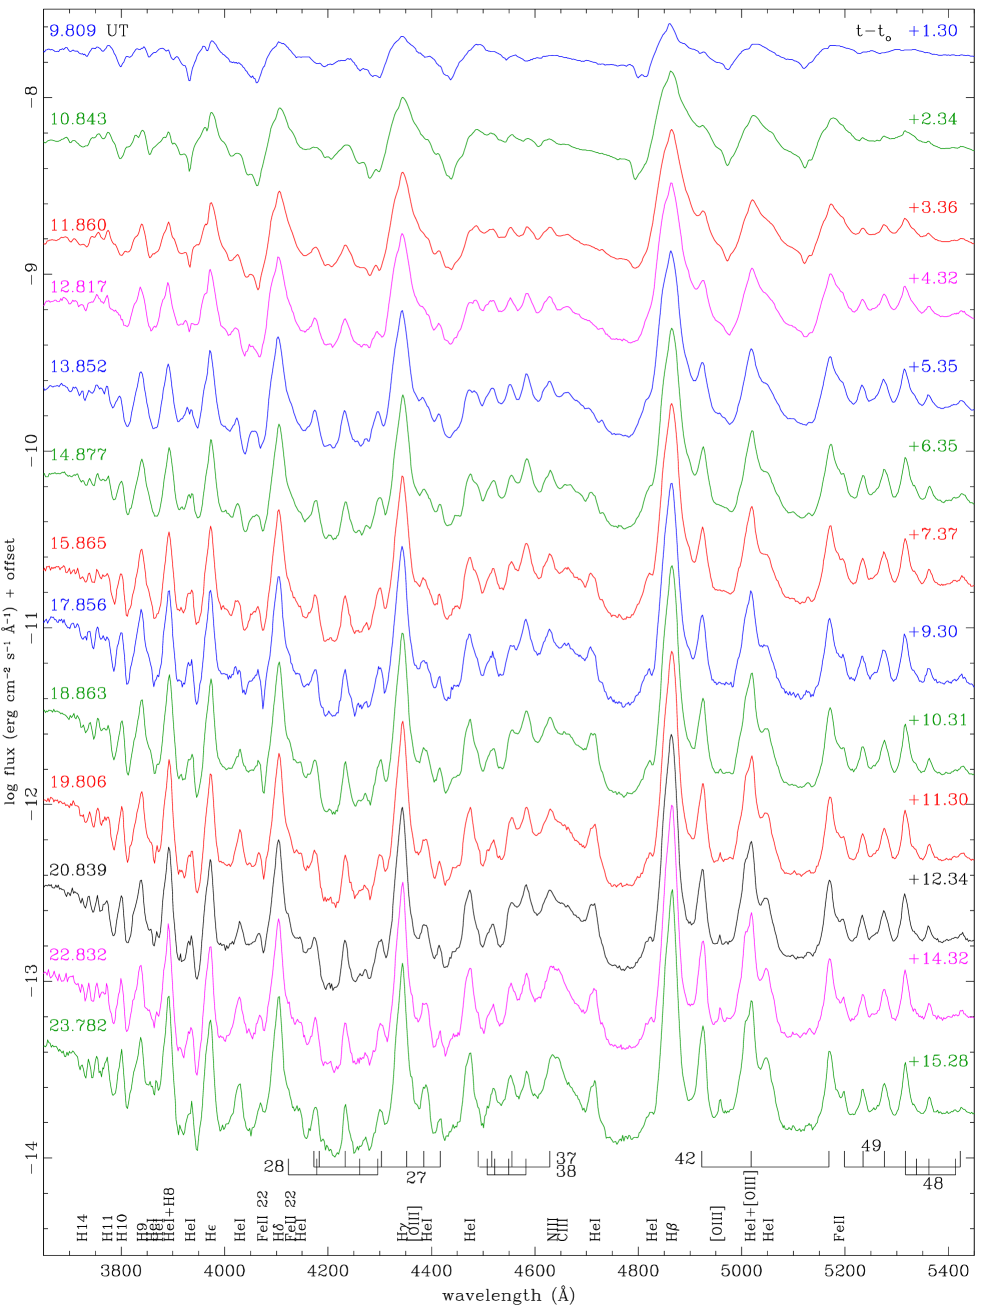
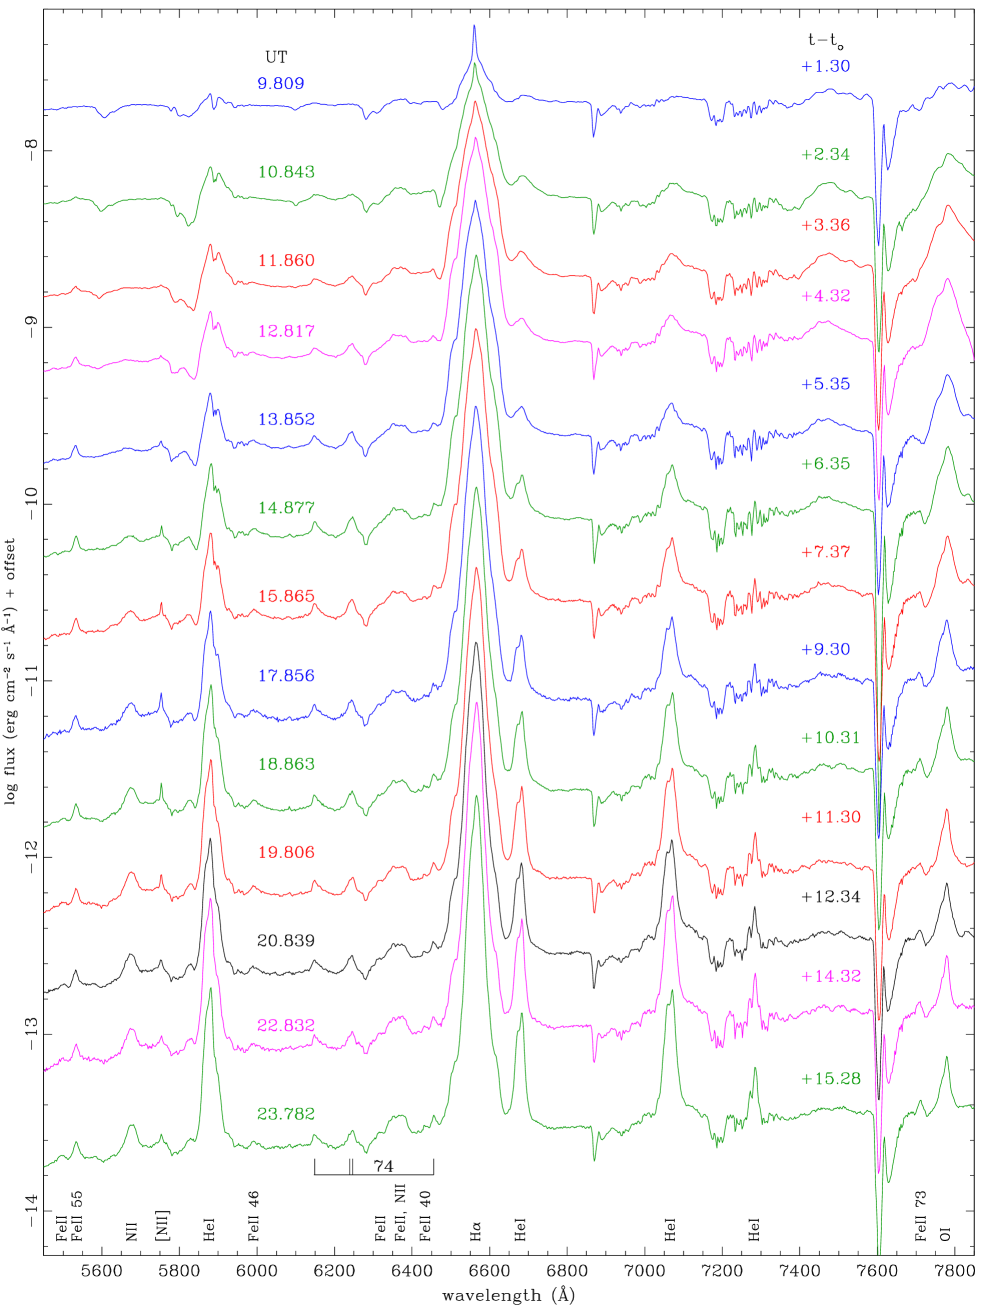
Given the huge intensity of the emission lines displayed by RS Oph and the necessity to compact many different spectra on the same picture, we adopt to plot the spectra on all figure as the logarithm of the flux (in erg cm-2 s-1 Å-1). Multi-epoch observations within the same night have been averaged into one single spectrum per night.
The sequence of B&C spectra is presented first, with Figure 1 covering the whole wavelength interval, and Figures 2 and 3 zooming on the blue and red portions respectively, with identification of the principal lines. A list of the emission lines identified in the spectrum for Aug 23 (=+15.28 days) is given in Table 3.
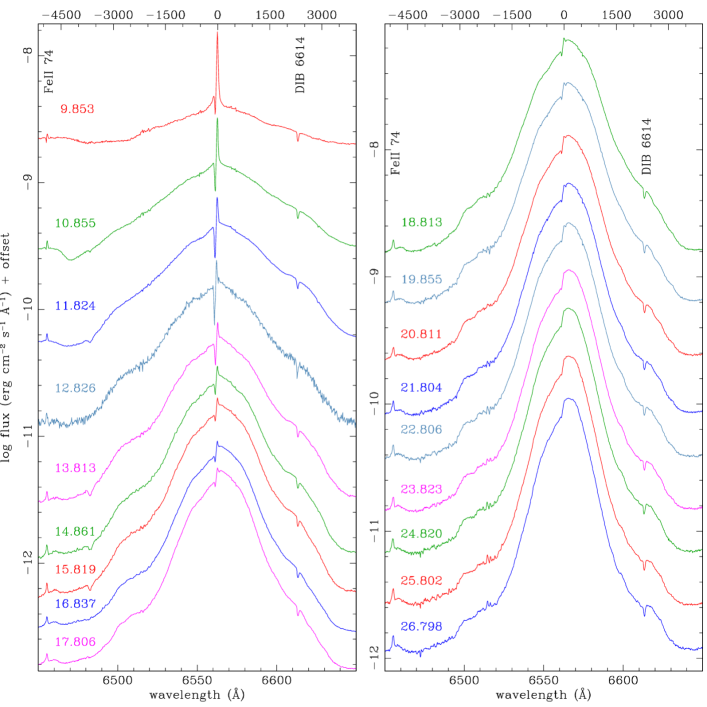
Selected portions of the Echelle spectra then follow. In Figure 4 we present the evolution of H, and that of HeI 5876 follows in Figure 5. Figures 6 and 7 are devoted to cover H and the nearby FeII multiplet 42 and HeI lines at 4921 and 5015 Å. Finally, Figure 8, zooms on the sharp components displayed by H, H, FeII #42 5018 and HeI 5015 on top of the much wider and stronger emission lines, and to the NaI 5890, 5896 Å doublet.
REFERENCE EPOCH
To identify the spectra through the various figures, we have labelled them according to the observing UT date as listed in Tables 1 and 2. In the same tables the time elapsed since the onset of the outburst () and since maximum brightness () in the -band are listed.
The very quick rise to maximum has been covered by L.P. Lou and B. Wang with observations obtained with a Sony DSLR camera and reported to AAVSO (observer code WPIA). Extrapolating back their linear rise to intercept the =11.1 mag quiescence brightness that RS Oph displayed on preceding days, set the time of eruption to:
| (1) |
The time of passage at maximum -band magnitude is less accurately determined. Again from the AAVSO light-curve, we estimate:
| (2) |
ACKNOWLEDGMENTS
We express our gratitude to P. Ochner (Univ. Padova) and A. Vagnozzi (ANS Collaboration) for their help with the acquisition of some of the spectra used in this paper.
REFERENCES
Cheung C. C., Ciprini S., Johnson T. J., 2021a, ATel, 14834
Cheung C. C., Johnson T. J., Mereu I., et al., 2021b, ATel, 14845
Enoto T., Maehara H., Orio M., et al., 2021a, ATel, 14850
Enoto T., Orio M., Fabian A., et al., 2021b, ATel, 14864
Evans A., Bode M. F., O’Brien T. J., Darnley M. J., eds., 2008, RS Ophiuchi (2006) and the Recurrent Nova
Phenomenon, ASPC, 401
Ferrigno C., Savchenko V., Bozzo E., et al., 2021, ATel, 14855
Luna G. J. M., Jimemez-Carrera R., Enoto T., et al., 2021, ATel, 14872
Mikolajewska J., Aydi E., Buckley D., et al., 2021, ATel, 14852
Munari U., Valisa P., 2021a, ATel, 14840
Munari U., Valisa P., 2021b, ATel, 14860
Nikolov Y., Luna G. J. M., 2021, ATel, 14863
Page, K. L. 2021, ATel, 14885
Page K. L., Osborne J. P., Aydi E., 2021, ATel, 14848
Pizzuto A., Vandenbroucke J., Santander M., IceCube Collaboration, 2021, ATel, 14851
Rout S. K., Srivastava M. K., Banerjee D. P. K., et al., 2021, ATel, 14882
Shidatsu M., Negoro H., Mihara T., et al., 2021, ATel, 14846
Shore S. N., Allen H., Bajer M., et al., 2021a, ATel, 14868
Shore S. N., Teyssier F., Thizy O., 2021b, ATel, 14881
Shore S. N., Teyssier F., Guarro J., et al., 2021c, ATel, 14883
Sokolovsky K., Aydi E., Chomiuk L., et al., 2021, ATel, 14886
Taguchi K., Ueta, T., Isogai, K., 2021a, ATel, 14838
Taguchi K., Maheara H., Isogai K., et al., 2021b, ATel, 14858
Williams D., O’Brien T., Woudt P., et al., 2021, ATel, 14849
Wagner, S. J., HESS Collaboration, 2021a, ATel, 14844
Wagner, S. J., HESS Collaboration, 2021b, ATel, 14857
Woodward C. E., Evans A., Banerjee D. P. K., et al., 2021, ATel, 14866
| date UT | expt | HJD | |||
|---|---|---|---|---|---|
| yyyy-mm-dd | hh:mm | (sec) | (-2459400) | (days) | (days) |
| 2021-08-09 | 19:30 | 900 | 36.316 | 1.32 | 0.14 |
| 2021-08-09 | 20:03 | 540 | 36.339 | 1.34 | 0.16 |
| 2021-08-09 | 20:55 | 540 | 36.375 | 1.38 | 0.20 |
| 2021-08-09 | 21:41 | 360 | 36.407 | 1.41 | 0.23 |
| 2021-08-10 | 19:41 | 720 | 37.324 | 2.32 | 1.14 |
| 2021-08-10 | 21:21 | 720 | 37.393 | 2.39 | 1.21 |
| 2021-08-11 | 19:23 | 720 | 38.311 | 3.31 | 2.13 |
| 2021-08-11 | 20:11 | 1200 | 38.344 | 3.34 | 2.16 |
| 2021-08-12 | 19:50 | 1200 | 39.330 | 4.33 | 3.15 |
| 2021-08-13 | 19:31 | 900 | 40.316 | 5.32 | 4.14 |
| 2021-08-14 | 20:40 | 1440 | 41.364 | 6.36 | 5.18 |
| 2021-08-15 | 19:40 | 1200 | 42.323 | 7.32 | 6.14 |
| 2021-08-16 | 20.05 | 1500 | 43.338 | 8.34 | 7.16 |
| 2021-08-17 | 19:20 | 900 | 44.309 | 9.31 | 8.13 |
| 2021-08-18 | 19:30 | 1500 | 45.315 | 10.32 | 9.14 |
| 2021-08-19 | 20:31 | 1500 | 46.358 | 11.36 | 10.18 |
| 2021-08-20 | 19:28 | 1500 | 47.314 | 12.31 | 11.13 |
| 2021-08-21 | 19:18 | 1500 | 48.307 | 13.31 | 12.13 |
| 2021-08-22 | 19:20 | 1500 | 49.308 | 14.31 | 13.13 |
| 2021-08-23 | 19:45 | 2400 | 50.325 | 15.33 | 14.15 |
| 2021-08-24 | 19:41 | 1800 | 51.323 | 16.32 | 15.14 |
| 2021-08-25 | 19:15 | 1800 | 52.304 | 17.30 | 16.12 |
| 2021-08-26 | 19:10 | 2400 | 53.301 | 18.30 | 17.12 |
| date UT | expt | HJD | |||
|---|---|---|---|---|---|
| yyyy-mm-dd | hh:mm | (sec) | (-2459400) | (days) | (days) |
| 2021-08-09 | 18:49 | 100 | 36.284 | 1.28 | 0.10 |
| 2021-08-09 | 19:56 | 150 | 36.331 | 1.33 | 0.15 |
| 2021-08-10 | 19:11 | 120 | 37.300 | 2.30 | 1.12 |
| 2021-08-10 | 21:11 | 150 | 37.383 | 2.38 | 1.20 |
| 2021-08-11 | 19:09 | 90 | 38.298 | 3.30 | 2.12 |
| 2021-08-11 | 22:03 | 130 | 38.419 | 3.42 | 2.24 |
| 2021-08-12 | 18:44 | 90 | 39.281 | 4.28 | 3.10 |
| 2021-08-12 | 19:05 | 170 | 39.295 | 4.30 | 3.12 |
| 2021-08-12 | 20:45 | 120 | 39.365 | 4.37 | 3.19 |
| 2021-08-13 | 19:39 | 120 | 40.319 | 5.32 | 4.14 |
| 2021-08-13 | 21:04 | 120 | 40.378 | 5.38 | 4.20 |
| 2021-08-14 | 20:24 | 100 | 41.351 | 6.35 | 5.17 |
| 2021-08-15 | 20:11 | 120 | 42.342 | 7.34 | 6.16 |
| 2021-08-15 | 21:16 | 90 | 42.386 | 7.39 | 6.21 |
| 2021-08-17 | 19:13 | 120 | 44.301 | 9.30 | 8.12 |
| 2021-08-18 | 19:24 | 120 | 45.309 | 10.31 | 9.13 |
| 2021-08-19 | 18:44 | 110 | 46.281 | 11.28 | 10.10 |
| 2021-08-19 | 19:54 | 90 | 46.330 | 11.33 | 10.15 |
| 2021-08-20 | 19:22 | 120 | 47.307 | 12.31 | 11.13 |
| 2021-08-20 | 20:51 | 90 | 47.369 | 12.37 | 11.19 |
| 2021-08-22 | 19:42 | 150 | 49.321 | 14.32 | 13.14 |
| 2021-08-23 | 18:41 | 150 | 50.279 | 15.28 | 14.10 |
| line | line | line | line | ||||
| 3721 | H14 | 4176 | FeII 27+28 | 4823 | HeI, FeII 42 | 5676 | NII |
| 3733 | H13 | 4233 | FeII 27 | 4949 | [OIII] | 5755 | [NII] |
| 3750 | H12 | 4273 | FeII 27 | 5007 | [OIII] | 5876 | HeI |
| 3770 | H11 | 4300 | FeII 27+28 | 5019 | HeI+FeII 42 | 5991 | FeII 46 |
| 3798 | H10 | 4340 | H | 5048 | HeI | 6148 | FeII 74 |
| 3837 | H9 | 4363 | [OIII] | 5169 | FeII 42 | 6248 | FeII 74 |
| 3856 | HeI | 4388 | HeI | 5185 | FeII | 6318 | FeII |
| 3868 | HeI | 4417 | FeII 27 | 5198 | FeII 49 | 6369 | blend |
| 3889 | H8+HeI | 4471 | HeI | 5234 | FeII 49 | 6433 | FeII 40 |
| 3927 | HeI | 4489 | FeII 37 | 5255 | FeII 49 | 6456 | FeII 74 |
| 3936 | HeI | 4520 | FeII 37+38 | 5265 | FeII 48 | 6563 | H |
| 3970 | H | 4555 | FeII 37+38 | 5276 | FeII 49 | 6678 | HeI |
| 4026 | HeI | 4584 | FeII 38 | 5316 | FeII 48+49 | 7065 | HeI |
| 4070 | FeII 22 | 4634 | NIII+FeII 37 | 5363 | FeII 48 | 7281 | HeI |
| 4101 | H | 4647 | CIII | 5426 | FeII 49 | 7711 | FeII 73 |
| 4124 | FeII 22 | 4713 | HeI | 5496 | FeII | 7774 | OI |
| 4144 | HeI | 4861 | H | 5535 | FeII 55 |