Host Galaxy Line Diagnostics for the Candidate Tidal Disruption Events XMMSL1 J111527.3180638 and PTF09axc
Abstract
We present results of our analysis of spectra of the host galaxies of the candidate Tidal Disruption Events (TDEs) XMMSL1 J111527.3180638 and PTF09axc to determine the nature of these transients. We subtract the starlight component from the host galaxy spectra to determine the origin of the nuclear emission lines. Using a Baldwin–Phillips–Terlevich (BPT) diagram we conclude that the host galaxy of XMMSL1 J111527.3180638 is classified as a Seyfert galaxy, suggesting this transient is likely to be caused by (extreme) variability in the active galactic nucleus. We find that the host of PTF09axc falls in the ’star-forming’ region of the BPT-diagram, implying that the transient is a strong TDE candidate. For both galaxies we find a WISE-colour difference of , which means there is no indication of a dusty torus and therefore an active galactic nucleus, seemingly contradicting our BPT finding for the host of XMMSL1 J111527.3180638. We discuss possible reasons for the discrepant results obtained through the two methods.
keywords:
transients: tidal disruption events – galaxies: individual: NGC 3599 – galaxies: active – galaxies: nuclei – black hole physics1 Introduction
Two-body relaxation processes in the nucleus of a galaxy make stars wander in energy and momentum space. This can bring the pericentre of a star’s orbit within its tidal radius (or Roche limit) given the supermassive black hole (SMBH) in the centre of the galaxy, causing the difference in gravitational pull between the part of the star nearest and furthest from the SMBH, also known as the tidal force, to overcome the self-gravity of the star. This results in the star being pulled apart in a tidal disruption event (TDE) (Hills, 1975; Rees, 1988; Phinney, 1989).
Part of the stellar material of the disrupted star will stay bound to the SMBH and accrete on to it, creating a luminous flare that is visible across the electromagnetic spectrum (Rees, 1988; Lodato & Rossi, 2011). Over the last two decades, dozens of TDEs have been classified from among transient nuclear flares detected in X-ray, optical or UV (see Van Velzen et al. 2020; Saxton et al. 2021 for a review). Optically detected TDEs often go undetected in X-rays (Gezari et al., 2012), and vice versa. Although, there are events that have been found to emit in optical and X-rays (e.g., ASASSN-14li, ASASSN-15oi, AT 2019dsg, AT 2018fyk; Holoien et al. 2016; Gezari et al. 2017; Cannizzaro et al. 2021; Wevers et al. 2019, respectively).
A list of properties need to be satisfied for both optical/UV and X-ray selected TDE candidates to be confirmed. This list is based on observational characteristics shared by the known population of TDEs, and it is refined over time (see Zabludoff et al. 2021 for a review). Key observables for optical/UV TDEs include broad He and/or H lines and blue continuum emission (see Van Velzen et al. 2020 for a review). A short rise to peak, steady decline and a soft X-ray spectrum are among the key observables for X-ray selected TDEs (see Saxton et al. 2021 for a review). There are multiple competing models explaining the optical-UV emission mechanism: outflows (photon-driven, Strubbe & Quataert 2009, line-driven, Miller 2015 or circularisation-driven, Metzger & Stone 2016), reprocessing of accretion disc emission by material in the debris stream at larger radii (Guillochon et al., 2014) or shocks in the self-intersecting debris stream (Piran et al., 2015; Bonnerot et al., 2017). The lack of agreement about the importance of, for instance, the self-intersection shock, the rate of circularisation of the stellar debris, and the accretion radiation efficiency makes that there is no single theoretical prediction that can serve as a guideline to classify an event as a TDE. While some of the observed properties can be explained by the theoretical models under consideration, there might be TDEs that do not fit in the sample of previously classified TDEs, for instance if they occupy a different part of the parameter space such as penetration factor (), SMBH mass or spin, or stellar mass. Therefore, we need to keep a critical but open mind about which transients we classify as TDEs.
TDEs are often detected in otherwise inactive galaxies. However, Kennedy et al. (2016) suggest the TDE rate in AGNs could be enhanced with a factor up to 10 due to the interaction of stars with the disc around the AGN. Detecting TDEs in galaxies hosting an active galactic nucleus (AGN) is difficult, due to the inherent difficulty in distinguishing them from regular AGN activity, although some TDEs have been discovered in low-luminosity AGNs (e.g., ASASSN-14li and AT2019qiz; Holoien et al. 2016; Nicholl et al. 2020, respectively) and even higher luminosity AGNs (e.g., PS16dtm and SDSS J015957.64003310.5; Blanchard et al. 2017; Merloni et al. 2015, respectively). When confronted with AGNs at the same redshift, TDEs are typically brighter (Auchettl et al., 2018), but more extreme AGN variability can be as luminous as a TDE flare (e.g., Cannizzaro et al., 2020). This emphasizes the difficulty in distinguishing between TDEs and AGN flares. Besides this, the interaction between the TDE debris stream and the AGN disc and the effect on the emitted luminosity are currently not well understood (although see Chan et al. 2019, 2020 for modelling). Current theoretical models of the interaction of the stream originating in the destruction of a star and a pre-existing AGN disc are uncertain as they sample a restricted section of the parameter space and do not run long enough to study the accretion of an important fraction of the TDE debris. Finding a TDE candidate in a quiescent galaxy means there is one less alternative explanation for the transient.
A galaxy is classified as an AGN/non-quiescent galaxy if one or more of the following properties is observed (Van Velzen et al., 2020): i) The luminosity from the nucleus of the galaxy varied significantly with time before the main flare/transient event e.g., in the optical or X-ray luminosity, ii) The WISE-colours indicate the presence of a dusty torus, (Stern et al., 2012), iii) The ratio between the equivalent widths (EWs) of specific emission lines in the optical – restframe – part of the nuclear host spectrum show that the source falls in the AGN region of the Baldwin–Phillips–Terlevich (BPT) diagram. The ratios of EWs of emission lines reflect the physical conditions under which these lines were formed. These conditions are different for the different options considered for their formations (e.g., AGN, star-forming regions, LINER-like shocks) (Baldwin et al., 1981; Cid Fernandes et al., 2010). The AGN-region in the BPT-diagram is the region where the ionization-mechanism is dominated by the – UV / X-ray – ionizing radiation from the AGN (Baldwin et al., 1981).
In this work we investigate the host galaxy of two TDE candidates; the X-ray discovered TDE candidate XMMSL1 J111527.3180638 in the galaxy NGC 3599 and the optically discovered candidate PTF09axc in the galaxy SDSS J145313.07221432.2. The nature of the observed flare – AGN activity or TDE – has been subject of discussion in the literature for both of these candidates (e.g., Saxton et al. 2015 for XMMSL1 J111527.3180638 and Arcavi et al. 2014; Jonker et al. 2020 for PTF09axc).
We aim to classify the host galaxies of two TDE candidates by determining the position of the nuclear emission region on BPT-diagrams. We also look at the WISE-colours of the host galaxies and we use the existing [O iii] correlation observed in AGNs (Heckman et al., 2005) to compare the observed [O iii] 5007 luminosity to what is predicted on the basis of the correlation. We finally compare the luminosity expressed in units of the Eddington luminosity of NGC 3599 with that of other low-luminosity AGN host galaxies of TDEs.
2 Data
2.1 XMMSL1 J111527.3+180638
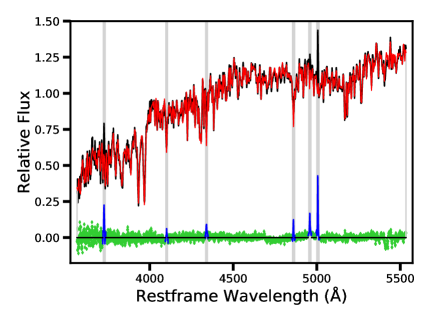
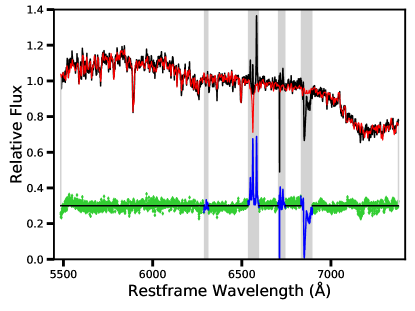
XMMSL1 J111527.3180638 – XMMJ1115 from now on – was first reported as a candidate TDE based on an X-ray flare seen in XMM-Newton slew data on 2003 November 22 (Esquej et al., 2007). Its associated host galaxy is NGC 3599, at redshift , Mpc taken from the Cosmicflows-3 Distance Catalogue (Tully et al., 2016). Flux calibrated optical spectra were obtained from Esquej et al. (2008), originally Caldwell et al. (2003). This data set consists of two spectra: a blue spectrum with wavelengths 3500–5500 Å taken on 1998 May 20 and a red spectrum with wavelengths 5500–7500 Å taken on 2000 February 5, both taken at the F.L. Whipple Observatory (Mount Hopkins near Amado, Arizona, USA) with the FAST (FAst Spectrograph for the Tillinghast Telescope) instrument located on the 1.5-m Tillinghast telescope. Both spectra were taken before the reported X-ray flare (see Caldwell et al. 2003 for full observational details and the data reduction procedure).
2.2 PTF09axc
PTF09axc was first reported by Arcavi et al. (2014) as part of their archival search of the Palomar Transient Factory (PTF) data for blue transients with . The discovery date is 2009 June 20 and the source is associated with the galaxy SDSS J145313.07221432.2 – hereafter SDSSJ1453 – at redshift (Arcavi et al., 2010).
We have taken two 1800 s low resolution optical spectra of the nucleus of the host galaxy after the transient had faded (Arcavi et al., 2014) on 2019 July 14 and 15 using the Auxiliary-port CAMera (ACAM) mounted at the Cassegrain focus of the William Herschel Telescope (WHT) located at the Roque de los Muchachos Observatory on La Palma, Spain under program W19AN009. Using the V400 grating, GG395A order blocking filter, and the AUXCAM CCD results in a wavelength coverage of – Å and resolution R for a 1 arcsec slit. We correct for instrumental broadening during the analysis of these data.
Data reduction is done using a program written in python that uses lacosmic (Van Dokkum, 2001) for cosmic ray cleansing, pyraf for bias and flatfield corrections and molly, developed by T. Marsh (Marsh, 2019)111http://deneb.astro.warwick.ac.uk/phsaap/software/molly/html/INDEX.html, for wavelength calibrations. We further use molly to flux calibrate and average our spectra.
3 Analysis and Results
To obtain an accurate nuclear source classification we start by subtracting the starlight component from the host galaxy spectrum using the Penalized PiXel-Fitting (ppxf) method (Cappellari, 2017), used with the MILES stellar library (Vazdekis et al., 2010). We use a degree four multiplicative Legendre polynomial – as opposed to an additive polynomial – to correct the continuum shape during the fit to prevent changes in the line strength of the absorption features in the templates, to minimize the influence on the strength of any emission line in the nuclear spectrum after subtraction. After subtraction the continuum emission is reduced to zero which means the equivalent width – flux in a line divided by the continuum – becomes undefined. Instead, we use the flux of the emission lines to determine the source position in a BPT-diagram. We use the python package lmfit to fit Gaussian curves to the stellar-host subtracted emission – or absorption – lines to obtain the flux of the following emission lines of interest for the BPT-diagram(s), where present: H 6563, H 4861, [O iii] , [O i] , [N ii] 6548, 6584, [S ii] 6617, 6631. To reduce the number of degrees of freedom during fitting we require the Full Width at Half Maximum (FWHM) of lines in doublets to be the same. We also fix the wavelength separation of doublets to their laboratory value and we fix the ratio in amplitudes for the lines in doublets when an amplitude ratio in known ([O iii] [O iii] and [N ii] [N ii] from Osterbrock & Ferland 2006).
3.1 XMMJ1115
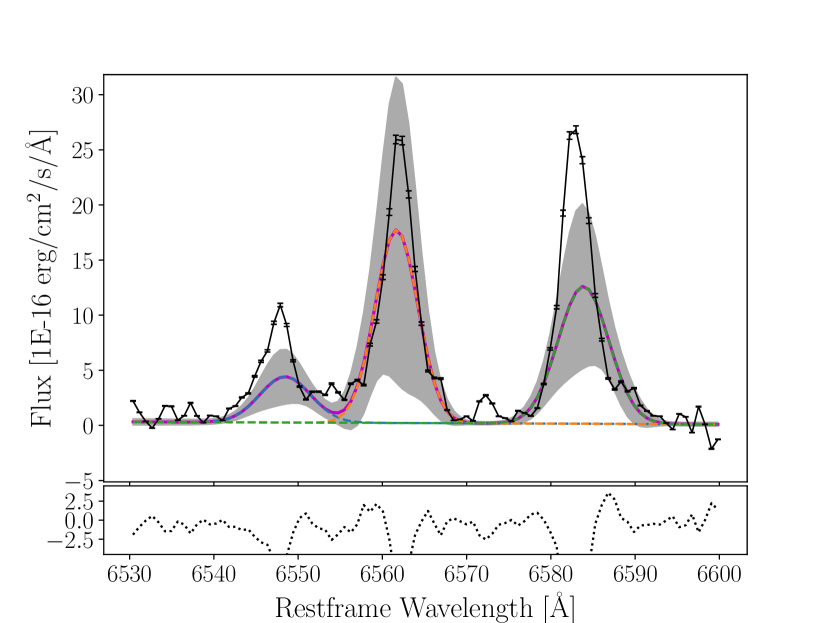
Fig. 1 shows the normalised – divided by the median value – galaxy spectrum in black, with the best fit from ppxf over-plotted in red, the grey bands represent areas masked during the fitting procedure. The red and blue parts, as described in Section 2.1, of the spectrum are fitted separately. The best fitting stellar population has a redshifted radial velocity of km s-1 (we average the radial velocity derived from the red and the blue parts of the spectrum). Taking into account the average rms uncertainty of 58 km s-1 on the wavelength calibration (from Caldwell et al. 2003) the redshift we derive is in agreement with previous measurements for this galaxy (e.g., km -1; Cappellari et al. 2011). Subtracting the starlight component leaves us with the nuclear emission line spectrum (blue/green in Fig. 1).
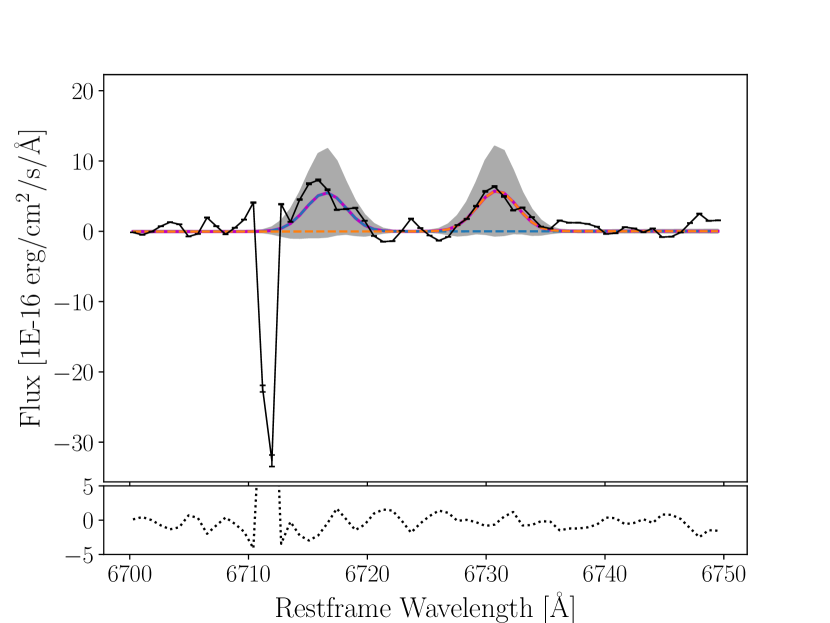
We detect emission lines of H , H and the [O iii], [N ii] and [S ii] doublets, but we do not detect a significant emission line for [O i] in this source. The detected emission lines are best fitted with one Gaussian component with an average FWHM of km s-1 (see Table 2 in the appendix). We provide figures showing the Gaussian fits to the detected emission lines in Fig. 7 in the appendix.
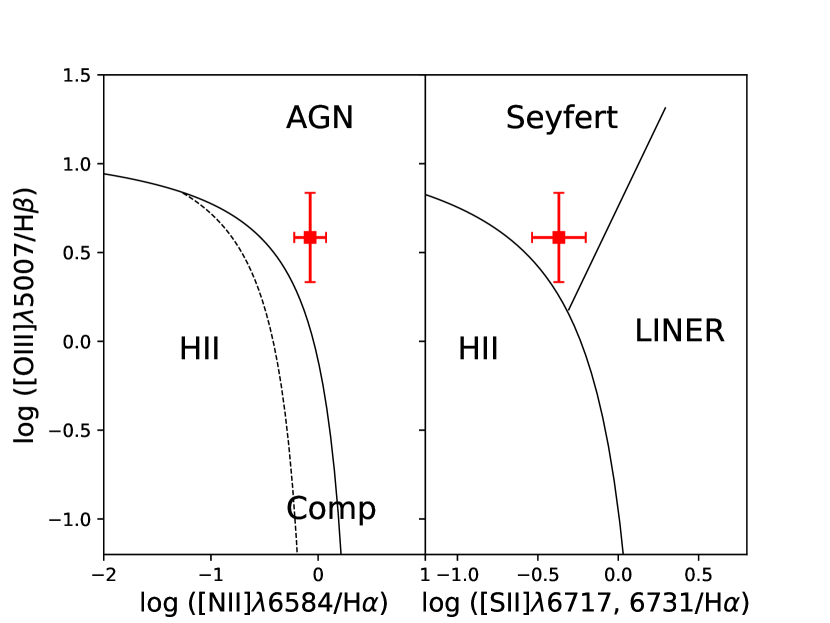
Using the flux of the emission lines we calculate the position of the source in a BPT-diagram. We use the demarcations from Kewley et al. (2001); Kauffmann et al. (2003); Kewley et al. (2006) to indicate different ionization-mechanism regions. The location of NGC3599 in the BPT-diagram is shown in Fig. 2 and it is consistent with an AGN/Seyfert classification for the spectrum of the nuclear region of the host of XMMJ1115.
3.2 PTF09axc
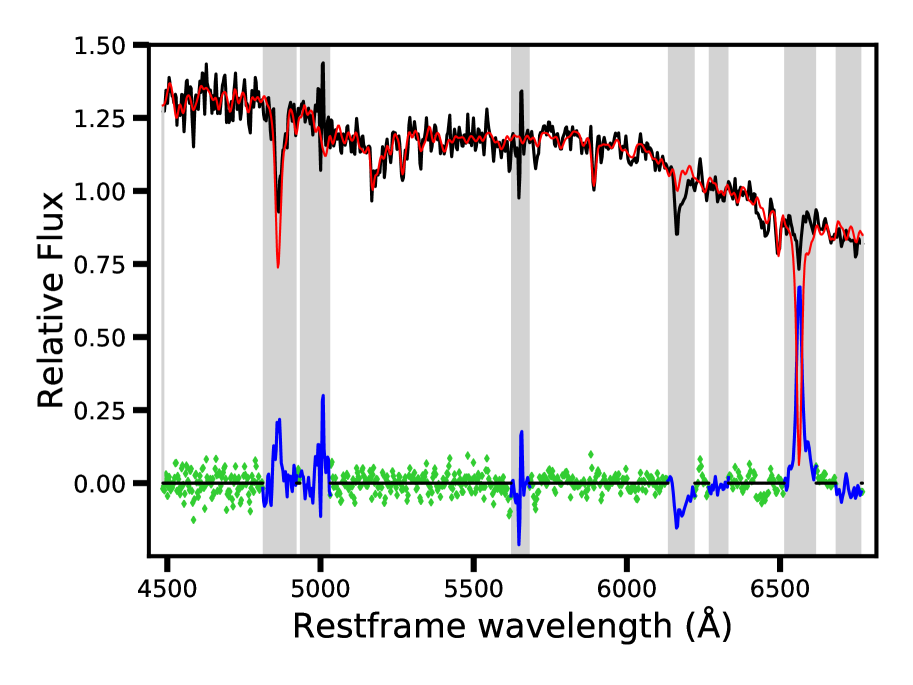
We repeat the exact same data analysis procedure we employed for NGC 3599 for the host of PTF09axc (SDSSJ1453), see Section 3.1. Blueshifting the spectrum with before using ppxf leaves a residual radial velocity of km s-1, which is consistent with no residual radial velocity. Therefore, the best-fitting stellar population has redshift of , corresponding to radial velocity km s-1. For an uncertainty in the last digit of the redshift given in Arcavi et al. (2010) (confirmed through private communication) as small as 1, our values are completely consistent with their redshift. This redshift corresponds to Mpc using , and H km s-1 Mpc-1
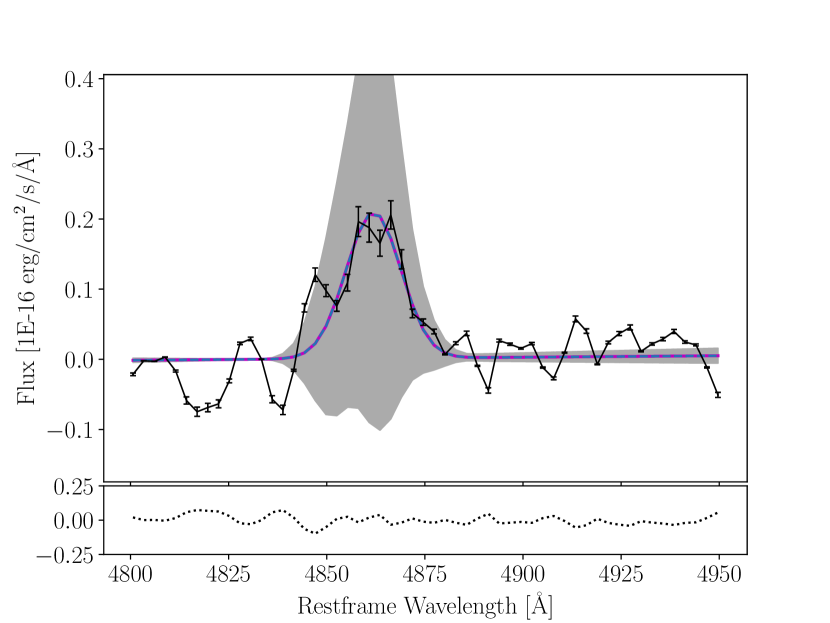
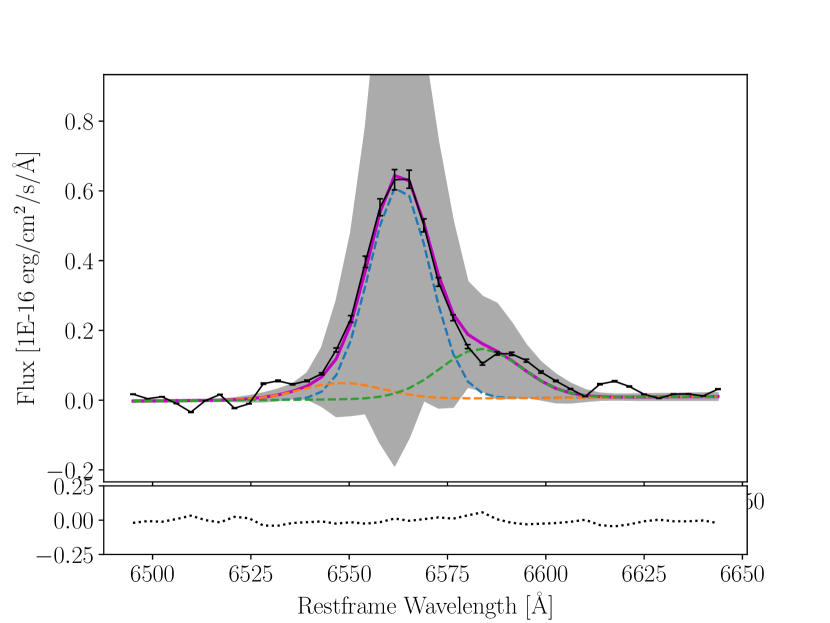
We do not detect emission lines for [O i] and the [S ii] doublet, but we do detect the [N ii] doublet and the H and H emission lines. To ensure the Gaussian functions fit to H and the [N ii] doublet have the correct centra wavelength, we have to fix the wavelength separation between the lines. We fit a single component with an (average) FWHM= km s-1 to the detected emission lines. We derive an upper limit to the flux for both lines in the [O iii] doublet.
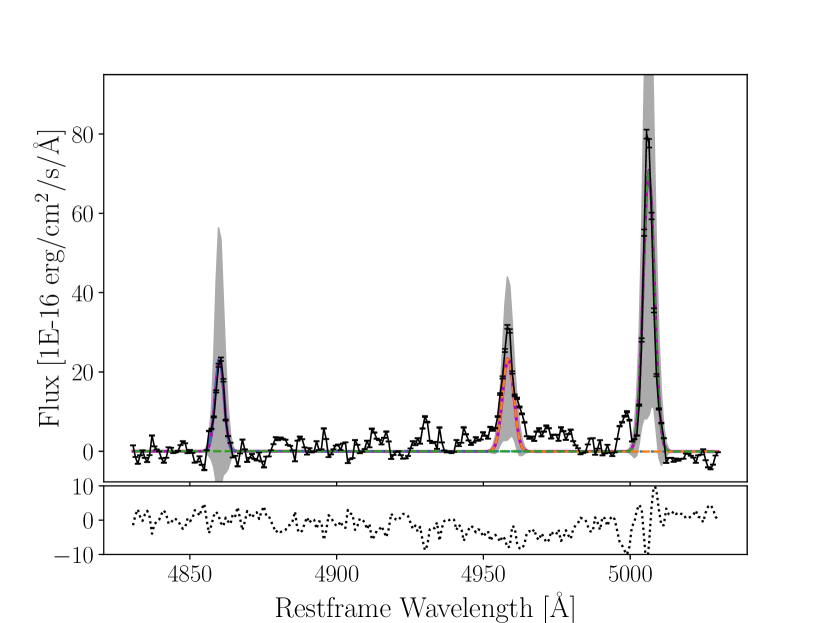
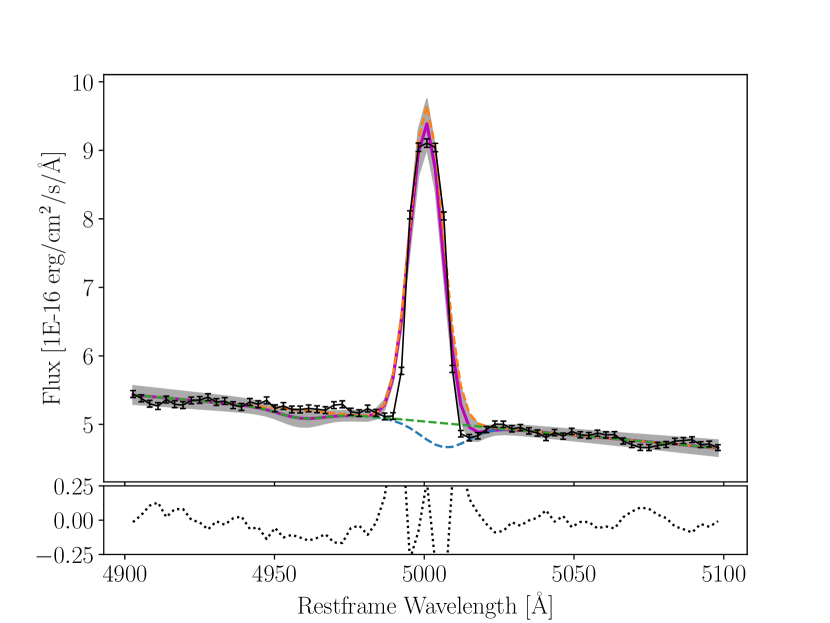
Due to the redshift of this source the [O iii] emission line is redshifted to Å which is close to the wavelength of the [O i] terrestrial sky emission line. In fact, these two lines fall within one ACAM resolution element of each other. In order to obtain as accurate as possible an upper limit on the presence of the [O iii] , we tried several data reduction optimisations tailored to allow as clean a subtraction of the terrestrial sky emission line as possible. To make sure the sky lines are perpendicular to the spectral trace we extracted a rectified version of the 2-D spectrum. This did not significantly improve the subtraction of the sky emission line. Next, we used the fit2d option during the iraf apall procedure to extract the spectrum, which uses a two dimensional function to smooth the profile to use with variance weighting or cleaning. However, this also did not significantly improve the subtraction of the sky emission line either. Therefore, we proceed with the spectrum obtained from the original data reduction process, with the one difference that for determining the upper limit to the [O iii] doublet emission line we do not subtract the sky emission lines.
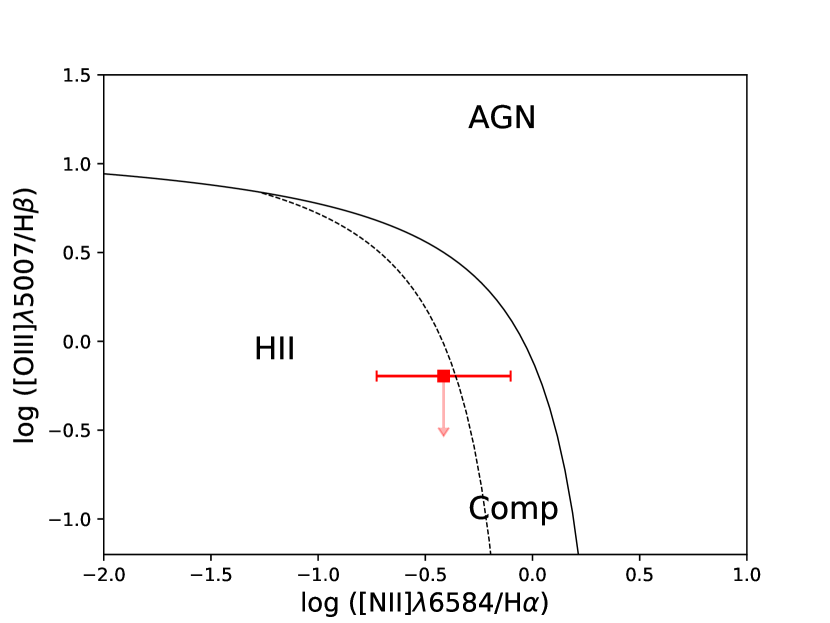
Instead, we derive an upper limit for the flux in the [O iii] line by fitting two Gaussians, one to the Å sky line and one to the [O iii] 5007 line. We shift the spectrum back to the rest frame wavelength of the host galaxy, this includes the Å sky line. We fix the central wavelength of the Gaussian function designed to describe this sky line to the expected value after blueshifting this line to the galaxy rest frame. In addition, we fix its FWHM to the spectral resolution of ACAM, leaving only the amplitude as a free parameter for this Gaussian during the fit. For the Gaussian designed to determine the upper limit to the [O iii] line, we fix the central wavelength to where we expect it to appear. We fix the FWHM of this emission line to the average value measured in the other lines. This leaves only the amplitude as a free parameter in the fit for this Gaussian. We fit the [O iii] 4959 line simultaneously, with the same FWHM as [O iii] 5007 and the wavelength separation between the lines of the doublet set to the laboratory value, leaving only the amplitude free during the fit. As the upper limit on the flux of the Gaussian-shaped emission line is determined from a one sided Gaussian probability distribution, the 2 upper limit corresponds to the 95 per cent confidence level. We use this upper limit to derive the position of the source in a BPT-diagram (see Fig. 4). The source falls in the region of the BPT-diagram associated with star-forming and H II galaxies.
4 Discussion
In this paper we investigate the nature of two candidate TDE events, XMMJ1115 and PTF09axc, by classifying the nuclear regions of their host galaxies, NGC 3599 and SDSSJ1453, respectively. We apply two methods: optical emission lines ratios to assess the ionization-mechanism and the infrared (IR) colours as determined by the WISE-satellite (Wright et al., 2010) to investigate if dust, as often found in a dusty torus in an AGN, is present. The dusty torus of an AGN will yield (Stern et al., 2012), where and indicate the WISE-bands at 3.4 and 4.6 m, respectively. For SDSSJ1453, we apply a third method using the empirical relation between (3–20 keV) and from Heckman et al. (2005) to assess if the observed X-ray luminosity is consistent with that from an AGN assuming the [O iii] emission is caused by the AGNs narrow line region.
The position of NGC 3599 on the BPT-diagram suggests it is a Seyfert galaxy, and there have been more papers suggesting the host galaxy is not a quiescent galaxy, see e.g., Saxton et al. (2015). Saxton et al. (2015) show that the galaxy was luminous in X-rays 18 months before the peak flux was measured, showing it to be bright on much longer timescales than shown by TDEs known at that point in time. They also argue that even if one of the two measurements was taken during rise-time and one during decay, the rise-time and the plateau phase together would still be significantly longer than seen in previous TDE candidates at that time. Since then, however, longer lived TDE-candidates have been observed (e.g., Lin et al. 2017) which means the measurements by Saxton et al. (2015) can no longer be considered unusual behaviour for a TDE. With our current understanding of X-ray TDE light curves we can therefore not make a definitive distinction between a TDE or AGN-activity for the flare XMMJ1115. However, our work does strengthen the evidence that the nucleus of NGC 3599 hosts a low-luminosity AGN.
We calculate , which means that, according to the WISE-colours, this source should not be classified as an AGN. This seemingly contradicts our findings that this source is a Seyfert galaxy given its position in the BPT-diagram. As WISE has a low spatial resolution (namely 6.1 arcsec, in band and 6.4 arcsec, in band ), the WISE-colour will be a combination of the starlight of the galaxy plus that of the central Seyfert region of the galaxy. Additionally, LaMassa et al. (2019) found that not all AGN are detected by WISE, explaining that a non-detection of a known AGN in WISE is a possible result of different dust properties, or absence of dust, compared to AGN that are detected by WISE, rather than absence of the AGN. We therefore deem our result that NGC 3599 hosts a low-luminosity AGN based on the optical emission line ratios not to be in contradiction of the WISE non-detection. Our conclusion that the nuclear region of NGC 3599 hosts an actively accreting Seyfert-like AGN increases the probability that the observed flare was related to the AGN, although this does not rule out that the XMMJ1115 event was caused by a TDE interacting with the AGN accretion disc (Blanchard et al., 2017; Chan et al., 2019, 2020).
| Transient | Host galaxy | (3–20 keV) | BH mass | log() | |
|---|---|---|---|---|---|
| name | name | (erg s-1) | (M⊙) | Reference | |
| XMMJ1115 | NGC 3599 | 2.251041 * | 2.34107 | a | |
| ASASSN-14li | PGC 043234 | 1.321041 | 1.70106 | b,c,d | |
| – | IC3599 | 6.731040 | 7106 | e, f, g | |
| AT2019qiz | 2MASX J044637901013349 | 5.61040 * | 1.15106 | h |
Note. For IC3599 no transient name is listed as this host galaxy has seen multiple flares classified as TDEs since the early 1990s. marked with * are calculated using the relation between (3–20 keV) and from Heckman et al. (2005), while the other given values are observed converted to the 3–20 keV band using W3PIMMS2. References: a Saxton et al. (2015), b Miller et al. (2015), c Van Velzen et al. (2016), d Wevers et al. (2017), e Campana et al. (2015), f Grupe et al. (2001), g Grupe et al. (2015), h Nicholl et al. (2020)
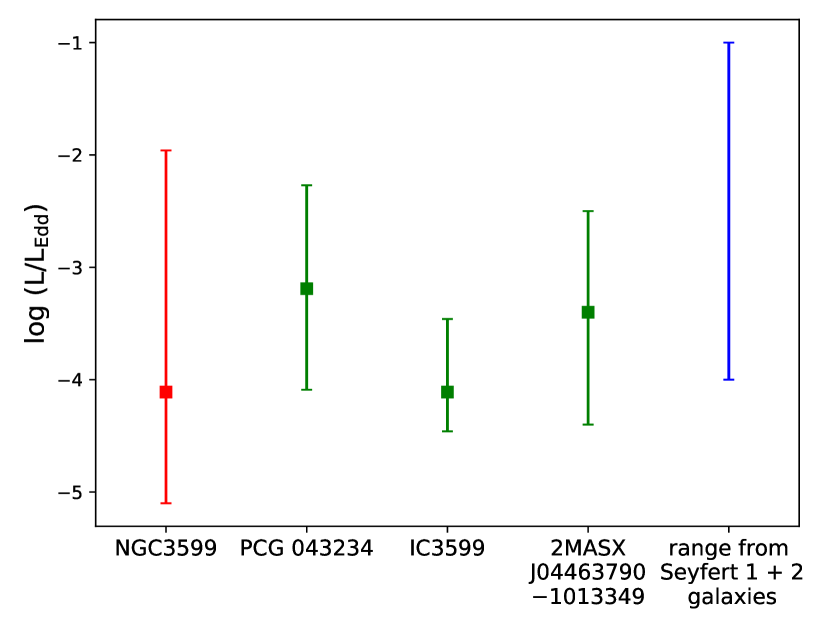
Assuming NGC 3599 is an AGN and using the empirical relation between (3–20 keV) and for AGNs from Heckman et al. (2005), including the 1 uncertainty in this relation and our 1 uncertainty on the flux measurement, we calculate that (3–20 keV) erg s-1 for NGC 3599. We use this to compute the Eddington ratio of this galaxy in quiescence and compare the value to the observed Eddington ratio of host galaxies of previously confirmed TDEs in low-luminosity AGNs, ASASSN-14li, IC3599 and AT2019qiz (Holoien et al. 2016; Campana et al. 2015; Nicholl et al. 2020, respectively). We list the observed (3–20 keV) values from the literature in Table 1, with the X-ray luminosities converted to the 3–20 keV energy band using W3PIMMS222https://heasarc.gsfc.nasa.gov/cgi-bin/Tools/w3pimms/w3pimms.pl, as well as our calculated value for NGC 3599. The Eddington ratio calculated for NGC 3599 in quiescence is consistent with Eddington ratios found in other Seyfert galaxies within 1 (see e.g., Singh et al. 2011). It is also consistent with the Eddington ratios of the host galaxies of known TDEs in low luminosity AGNs within 1, see Fig 5. There we plot the Eddington ratios for the different host galaxies as well as the range of Eddington ratios found by Singh et al. (2011). The uncertainty in the Eddington ratio for NGC 3599 is dominated by the uncertainty in our flux measurements, in the Heckman et al. (2005) relation and in the black hole mass estimate. Therefore, we favour the conclusion based on the position of the source in the BPT-diagram. We do however note that this comparison of the Eddington ratios also does not exclude a TDE nature of the flare XMMJ1115.
The ratio of the flux of the emission lines in the optical spectrum of the nuclear region of SDSSJ1453 falls in the H II/starforming region, with the 1 error bar extending into the composite galaxy region (see Fig. 4). The WISE-colour difference for SDSSJ1453 is , which does not indicate the presence of an AGN in this galaxy. As both the location of the source in a BPT-diagram as well as the WISE-colours indicate an inactive galaxy, we conclude that an AGN origin of the observed flare PTF09axc is unlikely, whereas a TDE nature of this transient is consistent with a quiescent galaxy.
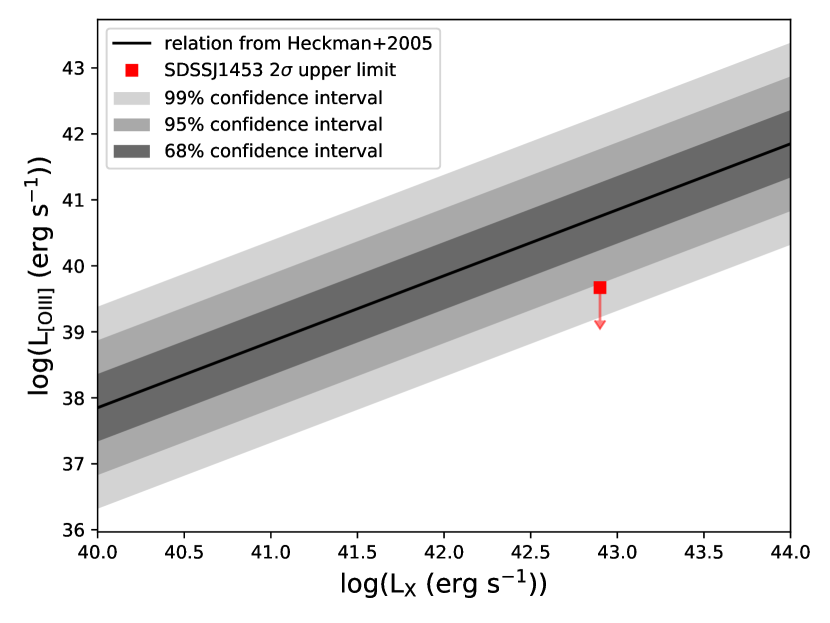
Using the empirical relation between (3–20 keV) and from Heckman et al. (2005) for AGNs (with a scatter of dex or a factor of ) and erg s-1 from Jonker et al. (2020), the predicted AGN luminosity from the [O iii] line would be erg s-1. Using our 2 upper limit for the flux in the emission line of erg cm-2 s-1 and d Mpc we calculate erg s-1, which is a factor 11.9 lower than expected for an AGN-powered emission line (see Figure 6 where we show the relation and our upper limit on ). While our observed upper limit for the is too low compared to the luminosity predicted by the correlation from Heckman et al. (2005), it is consistent if we take the uncertainty on this correlation into account within 3. This means we cannot exclude that the PTF09axc host SDSSJ1453 is an AGN, based on the [O iii] relation from Heckman et al. (2005). However, the combined evidence provided by the upper limit on , from the position of this source on the BPT-diagram, and the WISE-colour difference, we conclude that this galaxy is most likely quiescent and the transient PTF09axc is most likely a TDE.
It should be noted that in all low- to medium-resolution spectroscopic ground based observations the [O iii] emission line in SDSSJ1453 is redshifted to fall close to the [O i] terrestrial sky line, although in previous work (e.g., Arcavi et al. 2014) there is no mention of this. Their is consistent with our upper limit and not consistent with the empirical relation between (3–20 keV) and and therefore supports our conclusion about PTF09axc.
Acknowledgements
D.M.S. acknowledges support from the ERC under the European Union’s Horizon 2020 research and innovation programme (grant agreement No. 715051; Spiders). This work is part of the research programme Athena with project number 184.034.002, which is financed by the Dutch Research Council (NWO). We thank Tom Marsh for the use of molly. This work uses python packages numpy, lmfit, matplotlib, sys, astropy.
Data Availability
All data will be made available in a reproduction package uploaded to Zenodo.
References
- Arcavi et al. (2010) Arcavi I., et al., 2010, ApJ, 721, 777
- Arcavi et al. (2014) Arcavi I., et al., 2014, ApJ, 793, 38
- Auchettl et al. (2018) Auchettl K., Ramirez-Ruiz E., Guillochon J., 2018, ApJ, 852, 37
- Baldwin et al. (1981) Baldwin J. A., Phillips M. M., Terlevich R., 1981, PASP, 93, 5
- Blanchard et al. (2017) Blanchard P. K., et al., 2017, ApJ, 843, 106
- Bonnerot et al. (2017) Bonnerot C., Rossi E. M., Lodato G., 2017, MNRAS, 464, 2816
- Caldwell et al. (2003) Caldwell N., Rose J. A., Concannon K. D., 2003, AJ, 125, 2891
- Campana et al. (2015) Campana S., Mainetti D., Colpi M., Lodato G., D’Avanzo P., Evans P. A., Moretti A., 2015, A&A, 581, A17
- Cannizzaro et al. (2020) Cannizzaro G., et al., 2020, MNRAS, 493, 477
- Cannizzaro et al. (2021) Cannizzaro G., et al., 2021, MNRAS, 504, 792
- Cappellari (2017) Cappellari M., 2017, MNRAS, 466, 798
- Cappellari et al. (2011) Cappellari M., et al., 2011, MNRAS, 413, 813
- Chan et al. (2019) Chan C.-H., Piran T., Krolik J. H., Saban D., 2019, ApJ, 881, 113
- Chan et al. (2020) Chan C.-H., Piran T., Krolik J. H., 2020, ApJ, 903, 17
- Cid Fernandes et al. (2010) Cid Fernandes R., Stasińska G., Schlickmann M. S., Mateus A., Vale Asari N., Schoenell W., Sodré L., 2010, MNRAS, 403, 1036
- Van Dokkum (2001) Van Dokkum P. G., 2001, PASP, 113, 1420
- Esquej et al. (2007) Esquej P., Saxton R. D., Freyberg M. J., Read A. M., Altieri B., Sanchez-Portal M., Hasinger G., 2007, A&A, 462, L49
- Esquej et al. (2008) Esquej P., et al., 2008, A&A, 489, 543
- Gezari et al. (2012) Gezari S., et al., 2012, Nature, 485, 217
- Gezari et al. (2017) Gezari S., Cenko S. B., Arcavi I., 2017, ApJ, 851, L47
- Grupe et al. (2001) Grupe D., Thomas H. C., Beuermann K., 2001, A&A, 367, 470
- Grupe et al. (2015) Grupe D., Komossa S., Saxton R., 2015, ApJ, 803, L28
- Guillochon et al. (2014) Guillochon J., Manukian H., Ramirez-Ruiz E., 2014, ApJ, 783, 23
- Heckman et al. (2005) Heckman T. M., Ptak A., Hornschemeier A., Kauffmann G., 2005, ApJ, 634, 161
- Hills (1975) Hills J. G., 1975, Nature, 254, 295
- Holoien et al. (2016) Holoien T. W. S., et al., 2016, MNRAS, 455, 2918
- Jonker et al. (2020) Jonker P. G., Stone N. C., Generozov A., van Velzen S., Metzger B., 2020, ApJ, 889, 166
- Kauffmann et al. (2003) Kauffmann G., et al., 2003, MNRAS, 346, 1055
- Kennedy et al. (2016) Kennedy G. F., Meiron Y., Shukirgaliyev B., Panamarev T., Berczik P., Just A., Spurzem R., 2016, MNRAS, 460, 240
- Kewley et al. (2001) Kewley L. J., Dopita M. A., Sutherland R. S., Heisler C. A., Trevena J., 2001, ApJ, 556, 121
- Kewley et al. (2006) Kewley L. J., Groves B., Kauffmann G., Heckman T., 2006, MNRAS, 372, 961
- LaMassa et al. (2019) LaMassa S. M., Georgakakis A., Vivek M., Salvato M., Ananna T. T., Urry C. M., MacLeod C., Ross N., 2019, ApJ, 876, 50
- Lin et al. (2017) Lin D., et al., 2017, Nature Astronomy, 1, 0033
- Lodato & Rossi (2011) Lodato G., Rossi E. M., 2011, MNRAS, 410, 359
- Marsh (2019) Marsh T., 2019, molly: 1D astronomical spectra analyzer (ascl:1907.012)
- Merloni et al. (2015) Merloni A., et al., 2015, MNRAS, 452, 69
- Metzger & Stone (2016) Metzger B. D., Stone N. C., 2016, MNRAS, 461, 948
- Miller (2015) Miller M. C., 2015, ApJ, 805, 83
- Miller et al. (2015) Miller J. M., et al., 2015, Nature, 526, 542
- Nicholl et al. (2020) Nicholl M., et al., 2020, MNRAS, 499, 482
- Osterbrock & Ferland (2006) Osterbrock D. E., Ferland G. J., 2006, Astrophysics of gaseous nebulae and active galactic nuclei. Sausalito, CA: University Science Books
- Phinney (1989) Phinney E. S., 1989, in Morris M., ed., The Center of the Galaxy. Springer Netherlands, Dordrecht, pp 543–553
- Piran et al. (2015) Piran T., Svirski G., Krolik J., Cheng R. M., Shiokawa H., 2015, ApJ, 806, 164
- Rees (1988) Rees M. J., 1988, Nature, 333, 523
- Saxton et al. (2015) Saxton R. D., Motta S. E., Komossa S., Read A. M., 2015, MNRAS, 454, 2798
- Saxton et al. (2021) Saxton R., Komossa S., Auchettl K., Jonker P. G., 2021, Space Sci. Rev., 217, 18
- Singh et al. (2011) Singh V., Shastri P., Risaliti G., 2011, A&A, 533, A128
- Stern et al. (2012) Stern D., et al., 2012, ApJ, 753, 30
- Strubbe & Quataert (2009) Strubbe L. E., Quataert E., 2009, MNRAS, 400, 2070
- Tully et al. (2016) Tully R. B., Courtois H. M., Sorce J. G., 2016, AJ, 152, 50
- Vazdekis et al. (2010) Vazdekis A., Sánchez-Blázquez P., Falcón-Barroso J., Cenarro A. J., Beasley M. A., Cardiel N., Gorgas J., Peletier R. F., 2010, MNRAS, 404, 1639
- Van Velzen et al. (2016) Van Velzen S., et al., 2016, Science, 351, 62
- Van Velzen et al. (2020) Van Velzen S., Holoien T. W. S., Onori F., Hung T., Arcavi I., 2020, Space Sci. Rev., 216, 124
- Wevers et al. (2017) Wevers T., van Velzen S., Jonker P. G., Stone N. C., Hung T., Onori F., Gezari S., Blagorodnova N., 2017, MNRAS, 471, 1694
- Wevers et al. (2019) Wevers T., et al., 2019, MNRAS, 488, 4816
- Wright et al. (2010) Wright E. L., et al., 2010, AJ, 140, 1868
- Zabludoff et al. (2021) Zabludoff A., et al., 2021, arXiv e-prints, p. arXiv:2103.12150
Appendix A Additional Material
| [O iii] | [O iii] | |||||
| source | WL [Å] | FWHM [km s-1] | flux [1E-16 erg cm-2 s-1] | WL [Å] | FWHM [km s-1] | flux [1E-16 erg cm-2 s-1] |
| XMMJ1115 | 4958.40.3† | 270.027.8∗ | 112.4534.36 | 5006.30.3† | 267.527.5∗ | 337.35103.07 |
| PTF09axc | 4958.940.00† | 774.170.00∗ | 0.46 | 5006.840.0† | 766.770.0∗ | 1.39 |
| H | H | |||||
| source | WL [Å] | FWHM [km s-1] | flux [1E-16 erg cm-2 s-1] | WL [Å] | FWHM [km s-1] | flux [1E-16 erg cm-2 s-1] |
| XMMJ1115 | 4860.10.4 | 215.930.2 | 87.8043.17 | 6561.70.3 | 272.824.6 | 111.4830.31 |
| PTF09axc | 4861.92.1 | 605.3200.1 | 2.181.24 | 6562.81.9‡ | 569.9219.1 | 8.144.57 |
| [N ii] | [N ii] | |||||
| source | WL [Å] | FWHM [km s-1] | flux [1E-16 erg cm-2 s-1] | WL [Å] | FWHM [km s-1] | flux [1E-16 erg cm-2 s-1] |
| XMMJ1115 | 6547.50.3‡ | 324.025.1∗∗ | 31.326.49 | 6583.9 0.3‡ | 322.225.0∗∗ | 93.9519.48 |
| PTF09axc | 6548.10.0‡ | 950.2197.8∗∗ | 1.040.47 | 6583.51.9‡ | 945.1196.8∗∗ | 3.131.41 |
| [S ii] | [S ii] | |||||
| source | WL [Å] | FWHM [km s-1] | flux [1E-16 erg cm-2 s-1] | WL [Å] | FWHM [km s-1] | flux [1E-16 erg cm-2 s-1] |
| XMMJ1115 | 6716.50.3+ | 177.124.3- | 23.289.08 | 6730.90.3+ | 176.824.2- | 24.379.28 |
| PTF09axc | ||||||
Note. With we indicate that this line could not be fitted to the data. Different markers indicate quantities that were tied to the same value (FWHM) or a set separation
(WL) for each of the sources. Numbers in italics were forced to the mentioned value to obtain a 2 upper limit (UL) on the flux of that emission line. Flux measurements
without error are 2 upper limits.