A solar source of Alfvénic magnetic field switchbacks:
in situ remnants of magnetic funnels on supergranulation scales
Abstract
One of the striking observations from the Parker Solar Probe (PSP) spacecraft is the prevalence in the inner heliosphere of large amplitude, Alfvénic magnetic field reversals termed ’switchbacks’. These ) fluctuations occur on a range of timescales and in patches separated by intervals of quiet, radial magnetic field. We use measurements from PSP to demonstrate that patches of switchbacks are localized within the extensions of plasma structures originating at the base of the corona. These structures are characterized by an increase in alpha particle abundance, Mach number, plasma and pressure, and by depletions in the magnetic field magnitude and electron temperature. These intervals are in pressure-balance, implying stationary spatial structure, and the field depressions are consistent with overexpanded flux tubes. The structures are asymmetric in Carrington longitude with a steeper leading edge and a small (1∘) edge of hotter plasma and enhanced magnetic field fluctuations. Some structures contain suprathermal ions to 85 keV that we argue are the energetic tail of the solar wind alpha population. The structures are separated in longitude by angular scales associated with supergranulation. This suggests that these switchbacks originate near the leading edge of the diverging magnetic field funnels associated with the network magnetic field - the primary wind sources. We propose an origin of the magnetic field switchbacks, hot plasma and suprathermals, alpha particles in interchange reconnection events just above the solar transition region and our measurements represent the extended regions of a turbulent outflow exhaust.
1 Introduction
The NASA Parker Solar Probe (PSP) mission (Fox et al., 2016) was executed to make direct in situ measurements of the source regions of the solar wind and to understand the heating and acceleration mechanisms using those measurements. A foundational observation from PSP has been the prevalence of large Alfvénic field reversals that had earlier been termed ’switchbacks’ (hereafter ’SBs’), which are interspersed among intervals of ’quiet’ primarily radial magnetic field (Bale et al., 2019; Kasper et al., 2019; Horbury et al., 2020; Dudok de Wit et al., 2020). While the SBs had been identified previously using spacecraft measurements at 0.3 AU (Horbury et al., 2018), at 1 AU (Gosling et al., 2009, 2011) and at high solar latitudes (Balogh et al., 1999; Matteini et al., 2014), the PSP measurements are notable for the abundance of events and the apparent patterns of SBs and quiet wind. Several models of SB generation and evolution have been developed recently with sources in velocity shear in the corona (Landi et al., 2005; Ruffolo et al., 2020; Schwadron & McComas, 2021), magnetic reconnection (Fisk & Kasper, 2020; Drake et al., 2021; Zank et al., 2020), impulsive energy injection within magnetic funnels (Magyar et al., 2021a, b), and the nonlinear radial evolution of large amplitude Alfvénic fluctuations (Landi et al., 2006; Squire et al., 2020; Mallet et al., 2021; Shoda et al., 2021). A key question is whether the SBs are generated at the source of the solar wind, and serve as a fundamental diagnostic of the energization mechanism, or if rather they are a product of radial evolution.
Because of their ubiquity, and apparent nonlinearity, the possibility that switchbacks provide a direct, in situ diagnostic of solar wind heating or energization is tantalizing. A variety of heating mechanisms have been proposed: nanoflares, wave-dissipation, footpoint shearing, magnetic reconnection, and turbulence, to name a few. Most of these theories find some support in remote-sensing or in situ data and many of them rely in impulsive magnetic activity at the coronal base. There are many good review papers on the topic, recently by Cranmer & Winebarger (2019).
Here we use PSP measurements to demonstrate that an interval of periodically-modulated SBs observed below 25 solar radii () of PSP Encounter 06 is related directly to underlying photospheric magnetic field concentrations. While the bulk radial proton (’solar wind’) speed here ranges from 200-400 km/s, these measurements are akin to the ’microstream’ structures measured previously in the fast solar wind (Neugebauer et al., 1995). However these intervals are clearly pressure-balanced, hence spatially stable, and show enhanced alpha particle abundance, hot proton beams, energetic particles, and depressed electron temperature - all suggestive of fast wind-like sources. The alpha particles are heated to 8 and the temperature anisotropies of the alpha particles and beam protons suggest a common origin and/or evolution. The ballistically-mapped longitudinal source structure and the presence of suprathermal ions suggests a source at the edge of magnetic funnels associated with interchange reconnection. A narrow (1∘) leading edge shows enhanced proton parallel heating, similar to measurements from Helios at the leading edge of high speed streams (Marsch et al., 1982).
We present a schematic scenario of the source suggesting that PSP is transiting through the coronal extension of magnetic funnels (Kopp & Kuperus, 1968; Gabriel, 1976; Dowdy et al., 1986; Tu et al., 2005) and possibly plumes (Wilhelm et al., 2011; Poletto, 2015) associated with the photospheric network magnetic field, where the Alfvénic switchbacks are generated. The underlying magnetic configuration should be favorable to interchange magnetic reconnection between adjacent funnels and/or closed loop structure above the photosphere, as developed in the furnace solar wind model of Axford et al. (1999). Reconnection would also explain the energetic ions and the inherent intermittent nature of the switchbacks. Although we highlight the impact of processes and structure in the low solar atmosphere, some properties of SBs may develop or be further amplified by in situ evolution in the solar wind, which increases and can lead to abrupt rotations of B (e.g. Squire et al., 2020; Shoda et al., 2021; Mallet et al., 2021).
2 Parker Solar Probe Measurements and context
We use magnetic field and electron density measurements from the FIELDS instrument (Bale et al., 2016), plasma ion and electron measurements from the Solar Wind Electrons Alphas and Protons (SWEAP) instrument suite (Kasper et al., 2016), and energetic ion measurements from the Integrated Science Investigation of the Sun (ISOIS) suite (McComas et al., 2016) on the NASA Parker Solar Probe (PSP) spacecraft (Fox et al., 2016). Measurements are made near perihelion of PSP Encounter 06 from September 27-28, 2020 when the spacecraft was between 20.4-22.7 solar radii () from the Sun center and 232∘-270∘ heliographic (HG) longitude; the spacecraft trajectory dips south of the ecliptic near perihelion and was below -3∘ HG latitude during this interval and stayed below the heliospheric current sheet (HCS). Perihelion at 20.39 occurred at 09:16 UT on September 27, 2020. The spacecraft tangential (Keplerian) speed in HG coordinates ranges from 87 km/s at the start of the interval to 68 km/s at the end, passing through the maximum 89 km/s at perihelion. The spacecraft radial speed ranges from -11 km/s at the start of the interval to 39 km/s at the end, passing through the 0 km/s at perihelion. The measurements we analyze here are primarily in the outbound leg of the orbit.
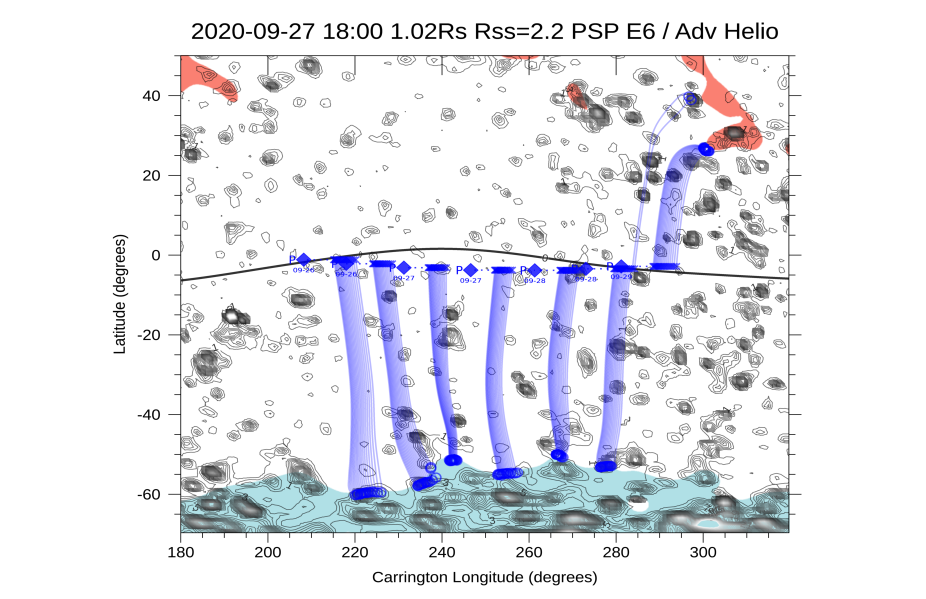
Figure 1 shows the magnetic connectivity of the PSP spacecraft footpoints from the source surface at = 2.2 mapped down the solar surface, near the low latitude boundary of a coronal hole (CH) feature at -60∘ HG latitude. The mapping uses a Potential Field Source Surface (PFSS) model (Schatten et al., 1969; Altschuler & Newkirk, 1969; Hoeksema, 1984) as implemented by Schrijver & De Rosa (2003). PFSS has proved to be remarkably robust during early PSP (solar minimum) orbits (Bale et al., 2019; Badman et al., 2020; Panasenco et al., 2020). As a lower boundary condition, the PFSS model incorporates magnetic field maps produced by an evolving surface-flux transport model based on magnetic fields observed by the Helioseismic and Magnetic Imager (HMI) (Scherrer et al., 2012; Schou et al., 2012) on the Solar Dynamics Observatory (SDO). The model evolves these fields in accordance with empirical prescriptions for differential rotation, meridional flows, and convective dispersal processes. PFSS models are parametrized by a radial distance at which all magnetic field lines become open and radial: the source surface (SS) height. This is typically set at = 2.5 , but is a free parameter of the model and we choose = 2.2 to be compatible with in situ magnetic field measurements by PSP and Solar Orbiter for this time interval (Telloni et al., 2021).
Black contours in Figure 1 indicate magnetic field pressure at 1.02 (14 Mm altitude above the photosphere) and reveal a network of stronger magnetic field concentrations, which can be inferred up to 1.04 , or 28-30 Mm and then quickly dissipate higher in the corona due to magnetic field line expansion. This low altitude, about 10 times the height of the chromosphere, is found to be critical in filament channel formation and dynamics (Panasenco & Velli, 2009) and is comparable to a typical supergranulation cell diameter. The boundary of the southern coronal hole along which PSP footpoints were moving has a sequence of these magnetic concentrations (nodes) with much weaker field between; we estimate from PFSS that PSP crossed 6-8 strong field concentrations during the Sep 26-29 interval studied here. Note that this PSP perihelion occurred behind the limb, so that there were no current magnetogram data available for the longitudes below the spacecraft. Hence there is no expectation of a one-to-one correspondence between individual network field concentrations seen in the PFSS, which evolve on timescales of several hours (Rieutord & Rincon, 2010), and our in situ measurements.
Proton beam and core parameters are obtained by fitting drifting bi-Maxwellians to the SWEAP/SPAN-Ion proton spectra. The proton beam is constrained to lie along the magnetic field direction relative to the core velocity. For the alpha parameters, 4 successive spectra were first summed together to obtain better statistics. The SPAN-Ion alpha channel contains a small () proton contamination. This is compensated for by taking the previously fitted proton parameters and scaling the total density to represent the spurious protons in the alpha channel. This scaled down function, as well as a single bi-Maxwellian to represent the alpha particles, are then fitted to the alpha channel counts spectra and the alpha core parameters obtained. The exact scaling factor from proton channel to alpha channel is a free parameter in the fit, and it was confirmed that there was no energy or angle dependence to the proton contamination, so that an overall simple scaling was sufficient. Distribution functions are fitted only when the solar wind distribution is within the SPANi field-of-view (e.g. Woodham et al., 2021). For a more detailed discussion of SPAN-Ion fitting procedures, see (Finley et al., 2021). SWEAP/SPAN-E measurements (Kasper et al., 2016; Whittlesey et al., 2020) are used to determine electron core and strahl parameters by a combination of fitting and partial moment calculations, as described in Halekas et al. (2020). The electron core component is fitted to a drifting bi-Maxwellian function and the halo component, where present at measurable levels, to an isotropic non-drifting Maxwellian function. Partial moments of the strahl are computed by integrating over the residual of the measured distribution with respect to the core (and halo, if present), for the portion of the distribution in the strahl direction, within 45∘ of the magnetic field, and for velocities greater than two thermal speeds.
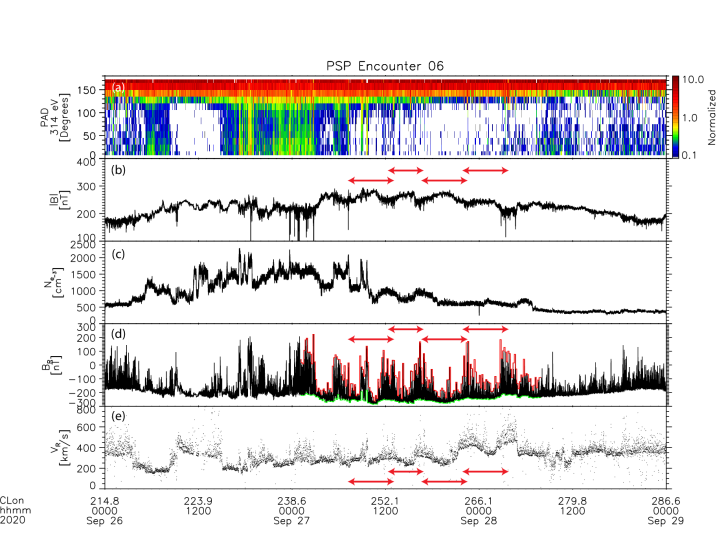
Magnetic field and plasma measurements from PSP Encounter 06 are shown in Figure 2. A normalized (to 90∘) pitch angle distribution (PAD) of 314 eV suprathermal (strahl) electrons after 01:00 on September 27, 2020 show primarily outward flux along indicating a unipolar magnetic field geometry below and consistent with the PSP trajectory being below the HCS as implied in Figure 1. Periodic modulations of the magnetic field magnitude (panel b) and radial proton core velocity (panel e) are emphasized using red arrows. Panel (d) shows the radial component of the magnetic field and the minimum (green) and maximum (red) value envelopes in 10 minute intervals. The dynamics are dominated by magnetic field ’switchbacks’ (Bale et al., 2019; Horbury et al., 2020) that here are clearly modulated in occurrence and amplitude by the structure in and . Small plasma density enhancements are also measured for some of these intervals (panel c). It has been reported previously that the Alfvenic magnetic field switchbacks are interspersed in regions of ’quiet radial flow’ (Bale et al., 2019; Horbury et al., 2020); here at 20 they are clearly modulated periodically and in correspondence with field amplitude and proton radial flow. Along the bottom of Figure 2 the spacecraft position in Carrington (HG) longitude is shown, as mapped ballistically using the measured proton speed (e.g. Nolte & Roelof, 1973; Badman et al., 2020). The time interval of the modulated features (red arrows) corresponds to Carrington longitudes of 250∘ - 270∘ in Figure 1. The modulations of switchbacks and plasma parameters occur on angular scales of a few degrees, similar to the network magnetic field and supergranulation scales on the Sun as in Figure 1.
Figure 3 highlights the interval of modulated switchbacks between 2020-09-27/01:00:00 and 2020-09-28/08:00. The top panel shows ion flux measurements from ISOIS in 3 energy channels from the EPI-Lo time-of-flight (TOF) system between 30-84 keV. An examination of the triple coincidence data shows that these TOF-only measurements are likely to be dominated by a mix of He and/or O ions and are field-aligned (anti-sunward). Note that these suprathermal ions appear most clearly within the last two modulations (in yellow bars), which also contain higher speed flow (panel (e)), suggesting that these ions may be the suprathermal tail of the modulated solar wind distribution. Panel (b) is the measured alpha particle abundance showing strong modulations to relatively large values () associated with the switchback patches and magnetic field amplitude modulations in panel (c). The dashed line in Panel (c) indicates the nominal heliospheric field of 2.5 nT AU2 (Badman et al., 2021) and the depressed intervals are colored blue. Light yellow vertical panels indicate intervals with enhanced and depressed . Alpha particle temperature (green) and proton core temperature (red) are enhanced within these intervals and electron core (lower blue) and strahl (upper blue) temperatures are depressed; note that as will be discussed below. Plasma radial velocities (panel e) are enhanced within the structures with the core proton speed (blue) approaching the Alfvén speed (black) on the edges and Alfvén Mach 2 within. The alpha (green) and proton beam (red) speeds are a large fraction of an Alfvén speed. The inverse correlation of electron temperature to wind speed is well known and observed quite universally during PSP solar encounters (e.g. Maksimovic et al., 2020).
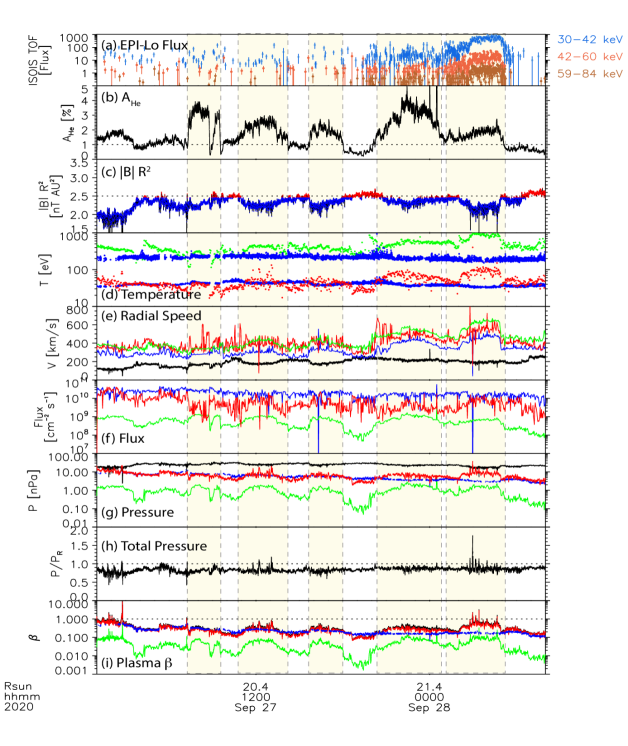
Panel (f) in Figure 3 show the number flux of core protons (blue), beam protons (red) and alpha particles (green). The core proton flux is relatively steady, while the proton beam and alpha particle flux are more modulated by the plasma structure; the proton beam abundance (not shown) is not so clearly modulated, rather the proton beam speed is enhanced within the high alpha abundance structures. Magnetic field pressure (black) and plasma pressure are shown on Panel (g), with proton (red), core electron (blue) and alpha (green) all showing anti-correlation with the magnetic field pressure. This is best seen in Panel (h) where the total pressure (magnetic plus plasma) is shown, normalized to a slowly varying factor to remove the large-scale radial trend - these structures are in local pressure balance. Pressure-balanced structure (PBS) is seen throughout the solar wind in the inner heliosphere (Thieme et al., 1990), at 1 AU (Borovsky, 2016), and on Ulysses (McComas et al., 1995, 1996) and Reisenfeld et al. (1999) reported an association between PBS and enhanced alpha particle abundance. Here we take this as evidence that these structures are spatial and stable over the spacecraft transit time, at least. The lower panel shows plasma for proton (red), alphas (green), and electrons (blue) demonstrating the ion is enhanced inside the structures. In addition to the measurements shown in Figure 3, these intervals show modulations of the proton core temperature anisotropy that often exceed the anisotropy-driven ion cyclotron instability threshold (e.g. Hellinger et al., 2006), relatively large proton beam speeds and alpha-proton drifts (comparable to ) and depressed and the interval is richly populated with ion cyclotron-frequency waves (Bowen et al., 2020; Verniero et al., 2020). Enhanced proton-alpha drifts within PBSs have been reported previously by Yamauchi et al. (2004). The kinetic features measured here are also associated with enhanced electrostatic plasma waves and will be investigated more fully in a future study.
In summary, Figure 3 demonstrates that PSP is transiting over spatial plasma structures that are a few degrees of HG longitude across mapped to the Sun. The structures contain hotter and faster ions (protons and alpha particles), a markedly enhanced alpha particle abundance , suprathermal ions, depressed magnetic field and electron temperature and a clear increase in the amplitude and occurrence of magnetic field switchbacks. Since the alpha abundance, and arguably the electron temperature, are frozen-in from the solar wind source in the transition region, we argue that the suprathermal ions have an origin at these altitudes and that the physics of these solar wind sources organizes the spatial and temporal distribution of the switchbacks.
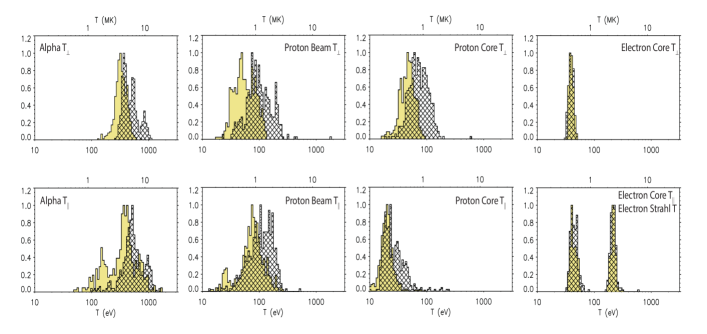
Histograms of ion and electron temperatures are shown in Figure 4, normalized to unity maximum and characteristic values are collected in Table 1. The cross-hatched histograms are accumulated within the high-alpha structures and the beige histograms are from outside the structures. The proton and alpha populations are generally hotter within the magnetic structures while both core and strahl electrons are slightly cooler, reminiscent of fast solar wind. Variations from structure-to-structure mask some of the trends in the unnormalized temperature that become more apparent in the dimensionless ratios in Figure 5.
| Species | T | T | T⟂) | T | T | T∥) |
|---|---|---|---|---|---|---|
| He++ | 501/335 | 360/305 | 171/79 | 570/400 | 464/340 | 247/241 |
| Beam H+ | 114/60 | 75/47 | 96/25 | 117/81 | 105/74 | 54/40 |
| Core H+ | 78/47 | 58/40 | 37/13 | 30/21 | 17/21 | 23/8 |
| Core e- | 39/40 | 36/39 | 6.2/6.3 | 45/43 | 39/41 | 6.7/6.6 |
| Strahl e- | n/a | n/a | n/a | 217/215 | 216/220 | 15/15 |
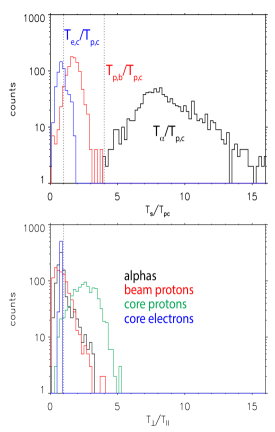
Stansby et al. (2019b) compared Helios measurements of alpha and proton temperatures down to 0.3 AU to expectations from double-adiabatic theory (Chew et al., 1956) (or CGL). They found that decreases faster with radial distance than predicted by CGL, while decreases more slowly, consistent with isotropization associated with temperature anisotropy instabilities (Hellinger et al., 2006; Bale et al., 2009; Maruca et al., 2012). Our average values within the funnel intervals at 20 ( 0.1 AU) of 570 eV (6.6 MK), 501 eV (5.8 MK), 30 eV (0.35 MK), and 78 eV (0.9 MK) are consistent with the trends in Figure 1 of Stansby et al. (2019b) and seems to trend with their CGL curve. In Figure 5 we show the distribution of relative (to proton core) temperatures (top panel) and the temperature anisotropy for each population, over the interval. Notably, the alpha particles are heated substantially relative to the core protons with peaking near 8 , well above, even twice, the mass-proportional heating 4 rate. More-than-mass proportional heating has been measured in the inner heliosphere previously (Marsch et al., 1982; Gershman et al., 2012), and at 1 au (Kasper et al., 2017) and here we identify it with discrete solar wind sources and report, we believe, one of the largest ever heating fractions 10 for thermal alpha particles in the solar wind. Notably, there is no thermalized population . Indeed, Maruca et al. (2013) used measurements of at 1 AU and a model of collisional evolution to infer large temperature ratios in the inner heliosphere; their model removed the 1 AU isotropic population and the distribution was predicted to peak at 5.4 at 0.1 AU ( 21 ). If robust and general, our results imply source of isotropization in addition to collisions, presumably wave-particle effects (e.g. Klein et al., 2018). Note that alpha-to-proton temperature ratios of 10 were predicted at 15 by Chandran (2010) based on stochastic ion heating by low frequency MHD/KAW turbulence.
The proton beam population is heated to , while the core electrons are cooler than the core protons as observed for faster solar wind sources (Marsch et al., 1989; David et al., 1998; Maksimovic et al., 2020). The lower panel of Figure 5 shows the temperature anisotropy of the core electron (blue), core proton (green), beam proton (red) and alpha particle (black) populations. The core proton population is notably more anistropic; the proton beam and alpha particle populations show similar distributions of temperature anisotropy. This may be a result of a common heating or energization mechanism, or rather may indicate similar physics during radial evolution. Since the beam protons and alpha particle stream ahead of the core protons, these populations will interact differently with Alfvénic fluctuations propagating in the wave frame with respect to the bulk (core proton) solar wind.
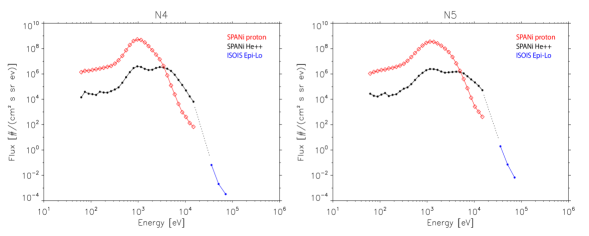
Figure 6 shows energy spectra of protons and alpha particles measured by SPANi compared with the ISOIS EPI-Lo spectrum; these spectra are in units of differential number flux and averaged over the intervals 2020-09-27/21:28:00 - 2020-09-28/00:10:00 (left) and 2020-09-28/02:44:30 - 2020-09-28/04:55:30 (right), corresponding to the final two yellow boxes in Figure 3 and labeled N4 and N5 in Figure 7. The ISOIS suprathermal spectrum is shown assuming a spectrum of He++ (as described above); if the ISOIS spectrum is oxygen the fluxes will be a factor of 4 higher. While suprathermal He++ is observed routinely in the ecliptic, slow solar wind (e.g. Collier et al., 1996) most usually associated with shocks or CIRS (or pickup ions), Ulysses measurements show a negligible ambient suprathermal He++ population in the fast solar wind (Gloeckler & Geiss, 1998). Our measurements here, with the striking correlation in Figure 3 and the plausible continuity of the spectrum in Figure 6, suggest that the EPI-Lo ion measurements are the tail of a very steep alpha particle spectrum out to 85 keV. A dotted line in Figure 6 connects the SPANi and EPI-Lo spectra and has a spectral slope . There is no notable radio emission nor flaring activity at this time.
To infer the spatial structure at the origin, we project the PSP spacecraft location in HG longitude down to the solar surface using a ballistic mapping (Nolte & Roelof, 1973; Badman et al., 2020) in Figure 7. The -plane magnetic field (upper panel) and proton velocity (lower panel) vectors are computed as 10-minute statistical mode values, in an attempt to remove the dominant and rapidly varying switchback fields. A time series plot (not shown) suggests that this is largely successful and the vectors shown here represent larger scale deviations of the underlying field and flow. Where no vector is apparent, the flow/field is primarily radial. The vectors are centered on the spacecraft coordinates - note that the spacecraft latitude is not corrected for ballistics or footpoint location and as shown in Figure 1 the local magnetic field footpoint ultimately maps to southern HG latitudes of around -60∘. The time series measurements of the plasma and magnetic field are overplotted in their ballistically-propagated HG longitude coordinates (and in arbitrary units here). The result of the ballistic backprojection shows that the sources are highly-structured and steepened at the leading edge; the smooth profile at PSP altitudes is a result of time-of-flight. The intervals with enhanced are colored yellow and labels N1-N5. The switchback intervals (red bars and ) cluster near the leading edge or just within. Magnetic field intensity and electron temperature are just inside this boundary; we will suggest below that this minimum in magnetic field and electron temperature correspond to the central region of an asymmetric magnetic structure.
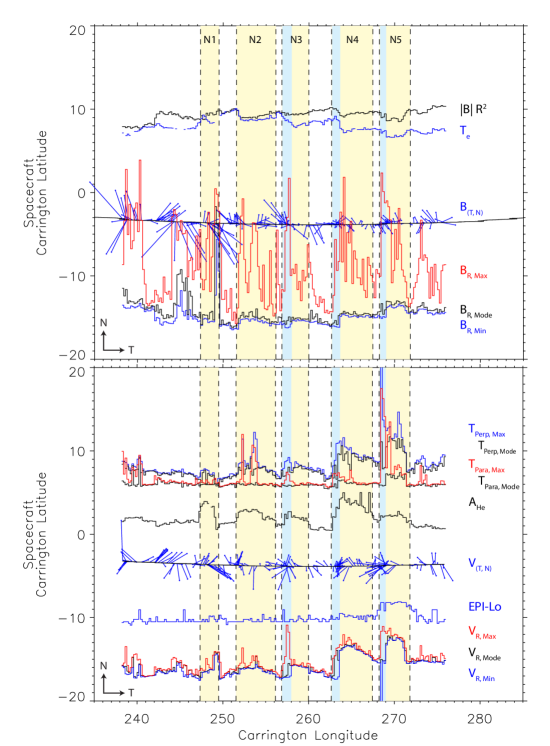
It is interesting to note that for the last 3 events here (N3-N5), there appears to be a small ( 1∘) leading edge (in the spacecraft frame) interval for which the maximum radial field and speed ( and ) leads the step in the minimum values and . These intervals (colored light blue in Figure 7) also correspond to decreasing trends in and and enhanced proton core temperatures and . Similar structure was measured at stream interface boundaries with instruments on the Helios spacecraft in the inner heliosphere (Marsch et al., 1982).
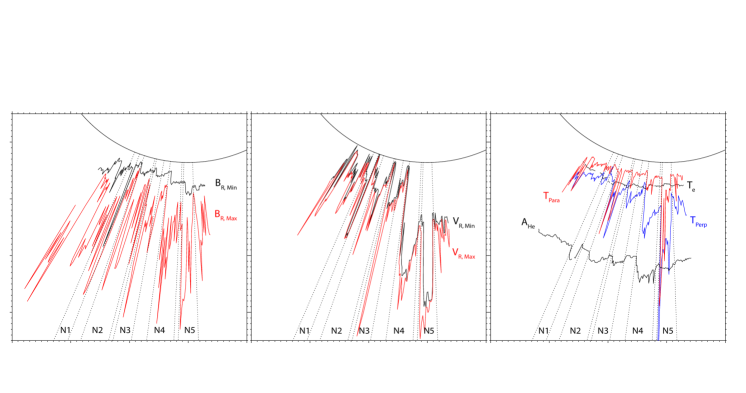
Figure 8 shows some data from Figure 7 represented in polar coordinates (i.e. in the plane of the heliographic ecliptic). While the information here is equivalent to Figure 7, the polar representation emphasizes the angular extent of these structures on the Sun and the potential relationship to the underlying photospheric structure.
3 Interpretation and Discussion
To summarize the observations in the previous section, our measurements show the following:
-
(i)
PSP passed through a 34 hour interval of modulated magnetic field switchbacks and ion and electron flux. This interval corresponds to 25∘ of heliographic longitude at the Sun during which PSP was magnetically connected to a coronal hole boundary near -60∘ heliographic latitude. The spacecraft was below 25 .
-
(ii)
The modulations correspond to angular scales of 3∘-5∘ in heliographic longitude at the Sun - similar to the supergranulation and network magnetic field structure. PFSS-mapped footpoints show magnetic field concentrations on similar angular scales.
-
(iii)
The modulated intervals are in total pressure-balance implying that the structures are spatial on the spacecraft transit timescale (6 hours).
-
(iv)
The thermal alpha particle abundance is enhanced to typical fast-wind values and the core and strahl electron temperatures are depressed within the modulations, implying solar wind sources on open field lines at the base of the corona similar to fast coronal hole wind.
-
(v)
Proton and alpha particle radial speeds and temperatures and ion plasma are enhanced within the structures. Alpha particles and beam protons are streaming ahead of the core protons and their number flux is strongly modulated by the structures. The alpha particles are 5-15 hotter than the core protons. The alpha particles are fairly isotropic , while the core protons have and are often unstable to an anisotropy-driven ion cyclotron instability.
-
(vi)
Suprathermal ions with energies up to 85 keV are measured within a subset of the structures with higher bulk velocities, suggesting a suprathermal tail. There is no notable radio emission nor time-of-flight dispersion that suggests a classical flare origin of the suprathermal ions. We suggest that PSP is transiting field lines populated by these ions.
-
(vii)
When mapped ballistically to the solar surface, the structures have a steep leading edge at lower Carrington/HG longitude. This may be a signature of a some small differential rotation between the photosphere and the corona (photosphere moving faster) or maybe be some inherent asymmetry of the source fields at the coronal hole boundary. The switchbacks cluster near the steep edge of the structures.
-
(viii)
A narrow 1∘ region is found at the (spacecraft-frame) leading edge of the steepest structures that has enhanced proton and alpha temperatures , , large differences between maximum and minimum radial field and flow, and a transition of and .
An enhanced relative abundance of alpha particles is known to be associated with fast solar wind, especially during solar minimum conditions (e.g. Kasper et al., 2012). Since the alpha abundance is determined in the chromosphere or transition region our measurements suggest a direct mapping to discrete solar wind sources. The modulation of wind speed and alpha abundance on the angular scales of solar supergranulation strongly implies that these ’microstreams’ originate within the network magnetic field that is known to cluster at the boundaries of the supergranules (viz. Rieutord & Rincon, 2010; Wiegelmann et al., 2014). Theoretically this was suggested as the source of the fast solar wind in the “furnace” model of Axford et al. (1999). Open field lines containing hot plasma pass through the solar transition region and overexpand rapidly, as the high-order magnetic field falls off radially much more rapidly that the plasma pressure. The resulting magnetic ’funnel’ structures (Gabriel, 1976, 1977; Dowdy et al., 1986; Axford et al., 1999; Hassler et al., 1999; Tu et al., 2005) then expand into pressure-balance to generate solar wind. Our measurement of magnetic field intensity depressions within the structures is consistent with the overexpansion of magnetic funnels, as the axial field should decay as while with the flux tube area, so that magnetic field at the center of the funnel (the axial, more radial component) will be weaker after expansion. The magnetic funnels expand rapidly at low altitudes and reconnection of impinging small dipoles and emerging flux are the source of energy generating the solar wind within the larger coronal hole structure, whose speed is determined by the overall expansion at higher altitude, found to be anti-correlated with the asymptotic solar wind speed Wang & Sheeley (1990); a two-step expansion process has been explored by Suess et al. (1998) and others.
The association of large amplitude, nonlinear Alfvenic fluctuations (i.e. the switchbacks), enhanced bulk flow, and more than mass-proportional ion heating with the edge of the funnel structure suggests an asymmetry in the source region that is associated with the heating. Figure 9 is a schematic of the magnetic field structure at the source. The field vectors here are a 2D potential model of a magnetic funnel (Hackenberg et al., 1999) as a set of unipolar flux concentrations and a dipole field with a shear in the - direction; color intensity in Figure 9 is magnetic field magnitude.
The enhancement of SBs in wind emanating from funnel boundaries clearly demonstrates the impact of structure and processes near the Sun on the spatial distribution of SBs in the solar wind. In particular, the enhanced values of in these regions is strong evidence of preferential Poynting-flux injection near funnel boundaries in the low solar atmosphere, which could be the result of magnetic reconnection. It is possible that the Poynting flux injection is not only stronger but also more intermittent near funnel boundaries, since reconnection is often impulsive. However, as noted previously, large-amplitude magnetic fluctuations in the solar wind naturally develop discontinuities as a consequence of spherical polarization (e.g. Vasquez & Hollweg, 1996; Squire et al., 2020; Shoda et al., 2021), and thus the abrupt magnetic-field rotations observed by PSP may also originate through in situ dynamics.
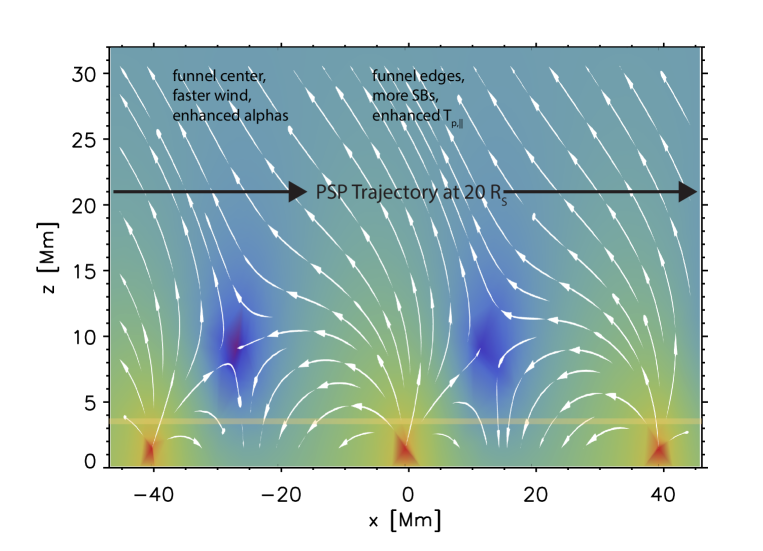
The cores of the funnels are separated by 40 Mm (3.3∘) here and already at 30 Mm altitude the field direction becomes relatively uniform, but is modulated in intensity as described above due to the superradial expansion below. The low altitude ’cusp’ regions (shaded dark blue in Figure 9) where adjacent funnels interactions result in an x point (in 2D) with a spine-fan intersection and a dome of confined flux, where magnetic reconnection could leak heated and confined plasma outward. This asymmetry is seen in the hotter, faster leading edge of the measurements in Figure 7. Indeed, simulations of reconnection between funnels and emerging flux show this asymmetry (Jiang et al., 2012; Takasao et al., 2013) and the resulting outflows depend on the altitude of the reconnection region. Here the cusp regions move to lower altitude with increasing (applied) magnetic shear ( component); magnetic shear could be due to differential rotation between the photosphere and corona or a property of the structure of the coronal hole boundary.
Magnetic reconnection may also naturally explain the energization of alpha particles (or oxygen) to 85 keV and the altitude of a reconnection site may be related to alpha particle abundance, if gravitational settling plays a role. If the full magnetic energy of a reconnection outflow is available to energize alpha particles (e.g. Phan et al., 2013), we can infer the Alfvén speed at the source 85 keV, which gives 2020 km/s, not inconsistent with expections at low altitudes (e.g. Axford et al., 1999; Warmuth & Mann, 2005). Drake et al. (2009) describe simulations of a ion pickup process in reconnection outflow regions that effectively energizes alpha particles to .
The observation that the lower- funnels are replete with switchbacks is consistent with the theory that switchbacks grow as a consequence of Alfvénic fluctuations reaching large amplitudes through solar-wind expansion (Squire et al., 2020; Mallet et al., 2021). Specifically, funnel regions have presumably undergone more super-radial expansion than neighbouring regions, so even minor variations in relative fluctuation amplitudes at the source surface could lead to large differences at the location of PSP (Hollweg, 1974). Fluctuations that grow to then form switchbacks or potentially fluxropes associated with turbulent reconnection (e.g. Drake et al., 2021). The relation of this to other solar-wind properties (wind speed, proton temperature, and alpha fraction) remains an open problem: the funnels described here lead to solar wind streams dubbed Alfvénic slow streams (Stansby et al., 2019a; D’Amicis et al., 2021), rather than the fast wind typically associated with polar coronal hole outflows. The reason is that the speed of the solar wind is controlled not by the local expansion discussed here occurring within 20 Mm from the photosphere, but the overall coronal hole expansion. PSP, always skirting the current sheet in the ecliptic plane as the Sun’s activity picks up out of the latest minimum, has been mostly observing wind coming from rapidly expanding open field lines. For this type of wind, the heating and acceleration is similar to fast solar wind (Chandran, 2021), including plasma properties, but the global coronal geometry determines the slower acceleration profile (Wang & Sheeley, 1990; Panasenco et al., 2019).
The stream structure and fluctuations shown here must evolve to become the familiar solar wind at and beyond. Horbury et al. (2021) have used measurements by Solar Orbiter of the same solar wind stream at as presented here: while the alpha particle modulation was preserved, the longitudinal speed variations were smoothed out by that distance, leading to density variations on the same longitudinal scale. The clear variation in fluctuation power due to switchback modulation that was present at was replaced by a large scale magnetic field variation on the same scale, suggesting that the photospheric structure affecting the wind at PSP still retains a signature in the wind much farther from the Sun.
Coronal magnetic activity is naturally multi-scale. Large-scale activity (e.g., flares and CMEs) correlate well with the sunspot solar cycle, while smaller-scale activity (e.g., bright-points, plumes, and jets) is more ubiquitous regardless of the solar cycle phase. Space and ground-based observations in the 1970s provided the first evidence for the highly dynamic nature of the coronal base (Demastus et al., 1973; Bohlin et al., 1975; Withbroe et al., 1976; Brueckner, 1980). Yohkoh/SXT observations showed most energetic coronal jets (e.g., Shibata et al., 1992; Strong et al., 1992; Shimojo et al., 1996, 1998, 2001). These discoveries led to speculations on the role these transients play in the heating and acceleration of the solar wind plasma (Brueckner & Bartoe, 1983).
Our in situ measurements imply a connection between impulsive Alfvénic activity within discrete wind sources and solar wind heating and acceleration mechanisms. While our measurements appear to be consistent with interchange reconnection, either through direct heating from the reconnection site itself or through enhanced Poynting fluxes (e.g., waves) that dissipate at higher altitudes, there are other viable mechanisms to consider. Axford et al. (1999) describe a wave-heating process occurring within magnetic funnels: high frequency Alfvén waves propagating outward enter resonance with ions and heat perpendicular to the local magnetic field and the resulting mirror force produces accelerated flow (Czechowski et al., 1998); resonant ion cyclotron heating is observed at 1 au (Kasper et al., 2013). Martinez-Sykora et al. (2017) suggest that ambipolar diffusion transports kinked field lines near network field concentrations into the chromosphere and the stored magnetic tension is released impulsively to form type II spicules and Alfvénic jets.
Finally, it is interesting to speculate about a connection to coronal plumes - persistant filamentary structures that disappear into the general solar wind outflow several tens of solar radii above the Sun’s surface (Wilhelm et al., 2011; Poletto, 2015; Raouafi et al., 2016; DeForest et al., 1997; Teriaca et al., 2003; Wang & Muglach, 2008; Yu et al., 2014). Plumes are also known to emerge from network field concentrations with enhanced heating at the base and are characterized by higher density (Wang, 1994) and lower electron temperatures (DeForest et al., 1997) than the surrounding corona. Raouafi et al. (2008) show that coronal plumes display myriads of small, short-lived jets at their footpoints (Raouafi & Stenborg, 2014), most probably resulting from magnetic reconnection due to small emerging bipolar features (see e.g., Panesar et al., 2018, 2019). Plumes exhibit oscillations and sub-structures (Uritsky et al., 2021) and should expand in pressure balance into the solar wind (Velli et al., 2011), but their potential relationship to the structures observed by PSP and reported here remains to be explored.
References
- Altschuler & Newkirk (1969) Altschuler, M. D., & Newkirk, G. 1969, Solar Phys., 9, 131, doi: 10.1007/BF00145734
- Axford et al. (1999) Axford, W. I., McKenzie, J. F., Sukhorukova, G. V., et al. 1999, Space Sci. Rev., 87, 25, doi: 10.1023/A:1005197529250
- Badman et al. (2020) Badman, S. T., Bale, S. D., Martínez Oliveros, J. C., et al. 2020, Astrophys. J. Suppl., 246, 23, doi: 10.3847/1538-4365/ab4da7
- Badman et al. (2021) Badman, S. T., Bale, S. D., Rouillard, A. P., et al. 2021, Astron. Astrophys., 650, A18, doi: 10.1051/0004-6361/202039407
- Bale et al. (2009) Bale, S. D., Kasper, J. C., Howes, G. G., et al. 2009, Physical Review Letters, 103, 211101, doi: 10.1103/physrevlett.103.211101
- Bale et al. (2016) Bale, S. D., Goetz, K., Harvey, P. R., et al. 2016, Space Science Rev., 204, 49, doi: 10.1007/s11214-016-0244-5
- Bale et al. (2019) Bale, S. D., Badman, S. T., Bonnell, J. W., et al. 2019, Nature, 576, 237, doi: 10.1038/s41586-019-1818-7
- Balogh et al. (1999) Balogh, A., Forsyth, R. J., Lucek, E. A., Horbury, T. S., & Smith, E. J. 1999, Geophys. Res. Lett., 26, 631, doi: 10.1029/1999GL900061
- Bohlin et al. (1975) Bohlin, J. D., Vogel, S. N., Purcell, J. D., et al. 1975, ApJ, 197, L133, doi: 10.1086/181794
- Borovsky (2016) Borovsky, J. E. 2016, Journal of Geophysical Research (Space Physics), 121, 5055, doi: 10.1002/2016JA022686
- Bowen et al. (2020) Bowen, T. A., Mallet, A., Huang, J., et al. 2020, ApJS, 246, 66, doi: 10.3847/1538-4365/ab6c65
- Brueckner (1980) Brueckner, G. E. 1980, Appl. Opt., 19, 3994, doi: 10.1364/AO.19.003994
- Brueckner & Bartoe (1983) Brueckner, G. E., & Bartoe, J. D. F. 1983, ApJ, 272, 329, doi: 10.1086/161297
- Chandran (2010) Chandran, B. D. G. 2010, The Astrophysical Journal, 720, 548, doi: 10.1088/0004-637x/720/1/548
- Chandran (2021) Chandran, B. D. G. 2021, 87, 905870304, doi: 10.1017/S0022377821000052
- Chew et al. (1956) Chew, G. F., Goldberger, M. L., & Low, F. E. 1956, Proceedings of the Royal Society of London. Series A. Mathematical and Physical Sciences, 236, 112, doi: 10.1098/rspa.1956.0116
- Collier et al. (1996) Collier, M. R., Hamilton, D. C., Gloeckler, G., Bochsler, P., & Sheldon, R. B. 1996, Geophysical Research Letters, 23, 1191, doi: 10.1029/96gl00621
- Cranmer & Winebarger (2019) Cranmer, S. R., & Winebarger, A. R. 2019, Annual Review of Astronomy and Astrophysics, 57, 157, doi: 10.1146/annurev-astro-091918-104416
- Czechowski et al. (1998) Czechowski, A., Ratkiewicz, R., McKenzie, J. F., & Axford, W. I. 1998, A&A, 335, 303
- D’Amicis et al. (2021) D’Amicis, R., Perrone, D., Bruno, R., & Velli, M. 2021, Journal of Geophysical Research (Space Physics), 126, e28996, doi: 10.1029/2020JA028996
- David et al. (1998) David, C., Gabriel, A. H., Bely-Dubau, F., et al. 1998, A&A, 336, L90
- DeForest et al. (1997) DeForest, C. E., Hoeksema, J. T., Gurman, J. B., et al. 1997, Solar Physics, 175, 393, doi: 10.1023/a:1004955223306
- Demastus et al. (1973) Demastus, H. L., Wagner, W. J., & Robinson, R. D. 1973, Sol. Phys., 31, 449, doi: 10.1007/BF00152820
- Dowdy et al. (1986) Dowdy, J. F., J., Rabin, D., & Moore, R. L. 1986, Sol. Phys., 105, 35, doi: 10.1007/BF00156374
- Drake et al. (2009) Drake, J. F., Cassak, P. A., Shay, M. A., Swisdak, M., & Quataert, E. 2009, ApJ, 700, L16, doi: 10.1088/0004-637X/700/1/L16
- Drake et al. (2021) Drake, J. F., Agapitov, O., Swisdak, M., et al. 2021, A&A, 650, A2, doi: 10.1051/0004-6361/202039432
- Dudok de Wit et al. (2020) Dudok de Wit, T., Krasnoselskikh, V. V., Bale, S. D., et al. 2020, Astrophys. J. Suppl., 246, 39, doi: 10.3847/1538-4365/ab5853
- Finley et al. (2021) Finley, A. J., McManus, M. D., Matt, S. P., et al. 2021, Astron. Astrophys., 650, A17, doi: 10.1051/0004-6361/202039288
- Fisk & Kasper (2020) Fisk, L. A., & Kasper, J. C. 2020, ApJ, 894, L4, doi: 10.3847/2041-8213/ab8acd
- Fox et al. (2016) Fox, N. J., Velli, M. C., Bale, S. D., et al. 2016, Space Science Rev., 204, 7, doi: 10.1007/s11214-015-0211-6
- Gabriel (1976) Gabriel, A. H. 1976, Philosophical Transactions of the Royal Society of London Series A, 281, 339, doi: 10.1098/rsta.1976.0031
- Gabriel (1977) Gabriel, A. H. 1977, in IAU Colloq. 36: The Energy Balance and Hydrodynamics of the Solar Chromosphere and Corona, 375–399
- Gershman et al. (2012) Gershman, D. J., Zurbuchen, T. H., Fisk, L. A., et al. 2012, Journal of Geophysical Research (Space Physics), 117, A00M02, doi: 10.1029/2012JA017829
- Gloeckler & Geiss (1998) Gloeckler, G., & Geiss, J. 1998, Space Science Reviews, 86, 127, doi: 10.1023/a:1005019628054
- Gosling et al. (2009) Gosling, J. T., McComas, D. J., Roberts, D. A., & Skoug, R. M. 2009, ApJ, 695, L213, doi: 10.1088/0004-637X/695/2/L213
- Gosling et al. (2011) Gosling, J. T., Tian, H., & Phan, T. D. 2011, ApJ, 737, L35, doi: 10.1088/2041-8205/737/2/L35
- Hackenberg et al. (1999) Hackenberg, P., Mann, G., & Marsch, E. 1999, Space Sci. Rev., 87, 207, doi: 10.1023/A:1005192216471
- Halekas et al. (2020) Halekas, J. S., Whittlesey, P., Larson, D. E., et al. 2020, Astrophys. J. Suppl., 246, 22, doi: 10.3847/1538-4365/ab4cec
- Hassler et al. (1999) Hassler, D. M., Dammasch, I. E., Lemaire, P., et al. 1999, Science, 283, 810, doi: 10.1126/science.283.5403.810
- Hellinger et al. (2006) Hellinger, P., Travnicek, P., Kasper, J. C., & Lazarus, A. J. 2006, Geophys. Res. Lett., 33, L09101, doi: 10.1029/2006GL025925
- Hellinger et al. (2006) Hellinger, P., Travnicek, P., Kasper, J. C., & Lazarus, A. J. 2006, Geophysical Research Letters, 33, doi: 10.1029/2006gl025925
- Hoeksema (1984) Hoeksema, J. T. 1984, PhD thesis, Stanford Univ., CA.
- Hollweg (1974) Hollweg, J. V. 1974, 79, 1539, doi: 10.1029/JA079i010p01539
- Horbury et al. (2018) Horbury, T. S., Matteini, L., & Stansby, D. 2018, MNRAS, 478, 1980, doi: 10.1093/mnras/sty953
- Horbury et al. (2020) Horbury, T. S., Woolley, T., Laker, R., et al. 2020, Astrophys. J. Suppl., 246, 45, doi: 10.3847/1538-4365/ab5b15
- Horbury et al. (2021) Horbury, T. S., Bale, S. D., Laker, R., et al. 2021, in preparation
- Jiang et al. (2012) Jiang, R.-L., Fang, C., & Chen, P.-F. 2012, The Astrophysical Journal, 751, 152, doi: 10.1088/0004-637x/751/2/152
- Kasper et al. (2013) Kasper, J. C., Maruca, B. A., Stevens, M. L., & Zaslavsky, A. 2013, Phys. Rev. Lett., 110, 091102, doi: 10.1103/PhysRevLett.110.091102
- Kasper et al. (2012) Kasper, J. C., Stevens, M. L., Korreck, K. E., et al. 2012, ApJ, 745, 162, doi: 10.1088/0004-637X/745/2/162
- Kasper et al. (2016) Kasper, J. C., Abiad, R., Austin, G., et al. 2016, Space Science Rev., 204, 131, doi: 10.1007/s11214-015-0206-3
- Kasper et al. (2017) Kasper, J. C., Klein, K. G., Weber, T., et al. 2017, The Astrophysical Journal, 849, 126, doi: 10.3847/1538-4357/aa84b1
- Kasper et al. (2019) Kasper, J. C., Bale, S. D., Belcher, J. W., et al. 2019, Nature, 576, 228, doi: 10.1038/s41586-019-1813-z
- Klein et al. (2018) Klein, K. G., Alterman, B. L., Stevens, M. L., Vech, D., & Kasper, J. C. 2018, Phys. Rev. Lett., 120, 205102, doi: 10.1103/PhysRevLett.120.205102
- Kopp & Kuperus (1968) Kopp, R. A., & Kuperus, M. 1968, Solar Physics, 4, 212, doi: 10.1007/bf00148082
- Landi et al. (2005) Landi, S., Hellinger, P., & Velli, M. 2005, in ESA Special Publication, Vol. 592, Solar Wind 11/SOHO 16, Connecting Sun and Heliosphere, ed. B. Fleck, T. H. Zurbuchen, & H. Lacoste, 785
- Landi et al. (2006) Landi, S., Hellinger, P., & Velli, M. 2006, Geophys. Res. Lett., 33, L14101, doi: 10.1029/2006GL026308
- Magyar et al. (2021a) Magyar, N., Utz, D., Erdélyi, R., & Nakariakov, V. M. 2021a, ApJ, 911, 75, doi: 10.3847/1538-4357/abec49
- Magyar et al. (2021b) —. 2021b, ApJ, 914, 8, doi: 10.3847/1538-4357/abfa98
- Maksimovic et al. (2020) Maksimovic, M., Bale, S. D., Berčič, L., et al. 2020, ApJS, 246, 62, doi: 10.3847/1538-4365/ab61fc
- Mallet et al. (2021) Mallet, A., Squire, J., Chandran, B. D. G., Bowen, T., & Bale, S. D. 2021, arXiv e-prints, arXiv:2104.08321. https://arxiv.org/abs/2104.08321
- Marsch et al. (1989) Marsch, E., Pilipp, W. G., Thieme, K. M., & Rosenbauer, H. 1989, J. Geophys. Res., 94, 6893, doi: 10.1029/JA094iA06p06893
- Marsch et al. (1982) Marsch, E., Rosenbauer, H., Schwenn, R., Muehlhaeuser, K. H., & Neubauer, F. M. 1982, J. Geophys. Res., 87, 35, doi: 10.1029/JA087iA01p00035
- Martinez-Sykora et al. (2017) Martinez-Sykora, J., Pontieu, B. D., Hansteen, V. H., et al. 2017, Science, 356, 1269, doi: 10.1126/science.aah5412
- Maruca et al. (2013) Maruca, B. A., Bale, S. D., Sorriso-Valvo, L., Kasper, J. C., & Stevens, M. L. 2013, Phys. Rev. Lett., 111, 241101, doi: 10.1103/PhysRevLett.111.241101
- Maruca et al. (2012) Maruca, B. A., Kasper, J. C., & Gary, S. P. 2012, The Astrophysical Journal, 748, 137, doi: 10.1088/0004-637x/748/2/137
- Matteini et al. (2014) Matteini, L., Horbury, T. S., Neugebauer, M., & Goldstein, B. E. 2014, Geophys. Res. Lett., 41, 259, doi: 10.1002/2013GL058482
- McComas et al. (1995) McComas, D. J., Barraclough, B. L., Gosling, J. T., et al. 1995, J. Geophys. Res., 100, 19893, doi: 10.1029/95JA01634
- McComas et al. (1996) McComas, D. J., Hoogeveen, G. W., Gosling, J. T., et al. 1996, A&A, 316, 368
- McComas et al. (2016) McComas, D. J., Alexander, N., Angold, N., et al. 2016, Space Science Rev., 204, 187, doi: 10.1007/s11214-014-0059-1
- Neugebauer et al. (1995) Neugebauer, M., Goldstein, B. E., McComas, D. J., Suess, S. T., & Balogh, A. 1995, J. Geophys. Res., 100, 23389, doi: 10.1029/95JA02723
- Nolte & Roelof (1973) Nolte, J. T., & Roelof, E. C. 1973, Sol. Phys., 33, 241, doi: 10.1007/BF00152395
- Panasenco & Velli (2009) Panasenco, O., & Velli, M. 2009, in Astronomical Society of the Pacific Conference Series, Vol. 415, The Second Hinode Science Meeting: Beyond Discovery-Toward Understanding, ed. B. Lites, M. Cheung, T. Magara, J. Mariska, & K. Reeves, 196
- Panasenco et al. (2019) Panasenco, O., Velli, M., & Panasenco, A. 2019, ApJ, 873, 25, doi: 10.3847/1538-4357/ab017c
- Panasenco et al. (2020) Panasenco, O., Velli, M., D’Amicis, R., et al. 2020, Astrophys. J. Suppl., 246, 54, doi: 10.3847/1538-4365/ab61f4
- Panesar et al. (2018) Panesar, N. K., Sterling, A. C., Moore, R. L., et al. 2018, ApJ, 868, L27, doi: 10.3847/2041-8213/aaef37
- Panesar et al. (2019) —. 2019, ApJ, 887, L8, doi: 10.3847/2041-8213/ab594a
- Phan et al. (2013) Phan, T. D., Shay, M. A., Gosling, J. T., et al. 2013, Geophysical Research Letters, 40, 4475, doi: 10.1002/grl.50917
- Poletto (2015) Poletto, G. 2015, Living Reviews in Solar Physics, 12, 7, doi: 10.1007/lrsp-2015-7
- Raouafi et al. (2008) Raouafi, N. E., Petrie, G. J. D., Norton, A. A., Henney, C. J., & Solanki, S. K. 2008, ApJ, 682, L137, doi: 10.1086/591125
- Raouafi & Stenborg (2014) Raouafi, N. E., & Stenborg, G. 2014, ApJ, 787, 118, doi: 10.1088/0004-637X/787/2/118
- Raouafi et al. (2016) Raouafi, N. E., Patsourakos, S., Pariat, E., et al. 2016, Space Sci. Rev., 201, 1, doi: 10.1007/s11214-016-0260-5
- Reisenfeld et al. (1999) Reisenfeld, D. B., McComas, D. J., & Steinberg, J. T. 1999, Geophys. Res. Lett., 26, 1805, doi: 10.1029/1999GL900368
- Rieutord & Rincon (2010) Rieutord, M., & Rincon, F. 2010, Living Reviews in Solar Physics, 7, 2, doi: 10.12942/lrsp-2010-2
- Ruffolo et al. (2020) Ruffolo, D., Matthaeus, W. H., Chhiber, R., et al. 2020, ApJ, 902, 94, doi: 10.3847/1538-4357/abb594
- Schatten et al. (1969) Schatten, K. H., Wilcox, J. M., & Ness, N. F. 1969, Solar Phys., 6, 442, doi: 10.1007/BF00146478
- Scherrer et al. (2012) Scherrer, P. H., Schou, J., Bush, R. I., et al. 2012, Solar Phys., 275, 207, doi: 10.1007/s11207-011-9834-2
- Schou et al. (2012) Schou, J., Scherrer, P. H., Bush, R. I., et al. 2012, Solar Phys., 275, 229, doi: 10.1007/s11207-011-9842-2
- Schrijver & De Rosa (2003) Schrijver, C. J., & De Rosa, M. L. 2003, Solar Phys., 212, 165, doi: 10.1023/A:1022908504100
- Schwadron & McComas (2021) Schwadron, N. A., & McComas, D. J. 2021, ApJ, 909, 95, doi: 10.3847/1538-4357/abd4e6
- Shibata et al. (1992) Shibata, K., Ishido, Y., Acton, L. W., et al. 1992, PASJ, 44, L173
- Shimojo et al. (1996) Shimojo, M., Hashimoto, S., Shibata, K., et al. 1996, PASJ, 48, 123, doi: 10.1093/pasj/48.1.123
- Shimojo et al. (1998) Shimojo, M., Shibata, K., & Harvey, K. L. 1998, Sol. Phys., 178, 379, doi: 10.1023/A:1005091905214
- Shimojo et al. (2001) Shimojo, M., Shibata, K., Yokoyama, T., & Hori, K. 2001, ApJ, 550, 1051, doi: 10.1086/319788
- Shoda et al. (2021) Shoda, M., Chandran, B. D. G., & Cranmer, S. R. 2021, arXiv e-prints, arXiv:2101.09529. https://arxiv.org/abs/2101.09529
- Squire et al. (2020) Squire, J., Chandran, B. D. G., & Meyrand, R. 2020, Astrophys. J. Lett., 891, L2, doi: 10.3847/2041-8213/ab74e1
- Stansby et al. (2019a) Stansby, D., Matteini, L., Horbury, T. S., et al. 2019a, Monthly Notices of the Royal Astronomical Society, 492, 39, doi: 10.1093/mnras/stz3422
- Stansby et al. (2019b) Stansby, D., Perrone, D., Matteini, L., Horbury, T. S., & Salem, C. S. 2019b, Astronomy & Astrophysics, 623, L2, doi: 10.1051/0004-6361/201834900
- Strong et al. (1992) Strong, K. T., Harvey, K., Hirayama, T., et al. 1992, PASJ, 44, L161
- Suess et al. (1998) Suess, S. T., Poletto, G., Wang, A. H., Wu, S. T., & Cuseri, I. 1998, Sol. Phys., 180, 231, doi: 10.1023/A:1005001618698
- Takasao et al. (2013) Takasao, S., Isobe, H., & Shibata, K. 2013, Publications of the Astronomical Society of Japan, 65, 62, doi: 10.1093/pasj/65.3.62
- Telloni et al. (2021) Telloni, D., Sorriso-Valvo, L., Woodham, L. D., et al. 2021, Astrophys. J. Lett., 912, L21, doi: 10.3847/2041-8213/abf7d1
- Teriaca et al. (2003) Teriaca, L., Poletto, G., Romoli, M., & Biesecker, D. A. 2003, ApJ, 588, 566, doi: 10.1086/368409
- Thieme et al. (1990) Thieme, K. M., Marsch, E., & Schwenn, R. 1990, Annales Geophysicae, 8, 713
- Tu et al. (2005) Tu, C.-Y., Zhou, C., Marsch, E., et al. 2005, Science, 308, 519, doi: 10.1126/science.1109447
- Uritsky et al. (2021) Uritsky, V. M., DeForest, C. E., Karpen, J. T., et al. 2021, ApJ, 907, 1, doi: 10.3847/1538-4357/abd186
- Vasquez & Hollweg (1996) Vasquez, B. J., & Hollweg, J. V. 1996, Journal of Geophysical Research: Space Physics, 101, 13527, doi: 10.1029/96ja00612
- Velli et al. (2011) Velli, M., Lionello, R., Linker, J. A., & Mikić, Z. 2011, ApJ, 736, 32, doi: 10.1088/0004-637X/736/1/32
- Verniero et al. (2020) Verniero, J. L., Larson, D. E., Livi, R., et al. 2020, ApJS, 248, 5, doi: 10.3847/1538-4365/ab86af
- Wang (1994) Wang, Y. M. 1994, The Astrophysical Journal, 435, L153, doi: 10.1086/187617
- Wang & Muglach (2008) Wang, Y.-M., & Muglach, K. 2008, Solar Physics, 249, 17, doi: 10.1007/s11207-008-9171-2
- Wang & Sheeley (1990) Wang, Y. M., & Sheeley, N. R., J. 1990, 355, 726, doi: 10.1086/168805
- Warmuth & Mann (2005) Warmuth, A., & Mann, G. 2005, Astronomy & Astrophysics, 435, 1123, doi: 10.1051/0004-6361:20042169
- Whittlesey et al. (2020) Whittlesey, P. L., Larson, D. E., Kasper, J. C., et al. 2020, Astrophys. J. Suppl., 246, 74, doi: 10.3847/1538-4365/ab7370
- Wiegelmann et al. (2014) Wiegelmann, T., Thalmann, J. K., & Solanki, S. K. 2014, The Astronomy and Astrophysics Review, 22, 78, doi: 10.1007/s00159-014-0078-7
- Wilhelm et al. (2011) Wilhelm, K., Abbo, L., AuchÚre, F., et al. 2011, The Astronomy and Astrophysics Review, 19, 35, doi: 10.1007/s00159-011-0035-7
- Wilhelm et al. (2011) Wilhelm, K., Abbo, L., Auchère, F., et al. 2011, A&A Rev., 19, 35, doi: 10.1007/s00159-011-0035-7
- Withbroe et al. (1976) Withbroe, G. L., Jaffe, D. T., Foukal, P. V., et al. 1976, ApJ, 203, 528, doi: 10.1086/154108
- Woodham et al. (2021) Woodham, L. D., Horbury, T. S., Matteini, L., et al. 2021, A&A, 650, L1, doi: 10.1051/0004-6361/202039415
- Yamauchi et al. (2004) Yamauchi, Y., Suess, S. T., Steinberg, J. T., & Sakurai, T. 2004, Journal of Geophysical Research (Space Physics), 109, A03104, doi: 10.1029/2003JA010274
- Yu et al. (2014) Yu, H. S., Jackson, B. V., Buffington, A., et al. 2014, ApJ, 784, 166, doi: 10.1088/0004-637X/784/2/166
- Zank et al. (2020) Zank, G. P., Nakanotani, M., Zhao, L. L., Adhikari, L., & Kasper, J. 2020, ApJ, 903, 1, doi: 10.3847/1538-4357/abb828