Optical study on electronic structure of the locally non-centrosymmetric CeRh2As2
Abstract
The electronic structures of the heavy-fermion superconductor CeRh2As2 with the local inversion symmetry breaking and the reference material LaRh2As2 have been investigated by using experimental optical conductivity () spectra and first-principal DFT calculations. In the low-temperature spectra of CeRh2As2, a –conduction electron hybridization and heavy quasiparticles are clearly indicated by a mid-infrared peak and a narrow Drude peak. In LaRh2As2, these features are absent in the spectrum, however, it can nicely be reproduced by DFT calculations. For both compounds, the combination between a local inversion symmetry breaking and a large spin-orbit (SO) interaction plays an important role for the electronic structure, however, the SO splitting bands could not be resolved in the spectra due to the small SO splitting size.
I Introduction
Materials with non-centrosymmetric crystal structure and crystal surfaces with inversion symmetry breaking have recently attracted attention for novel physical properties combined with spin-orbit interaction (SOI) [1]. By using the SOI and the electric field gradient generated by the spatial symmetry breaking, a spin-polarized current originating from spin-polarized bands is generated and is regarded to be useful for spintronics applications. A breaking of local inversion symmetry also generates a toroidal current owing to the Dzyaloshinsky-Moriya interaction [2] and a Cooper pair with a helical spin structure, which produces a superconducting state with a high critical field [3]. Actually, an extremely high upper critical field as high as has been observed in the heavy-fermion superconductor CePt3Si ( ) having a globally non-centrosymmetric crystal structure [4].
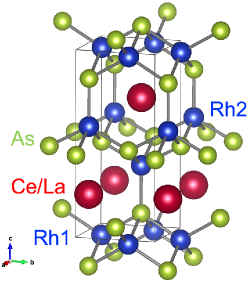
CeRh2As2 has recently been discovered as a novel heavy-fermion superconductor ( = ) [6]. It crystallizes in the CaBe2Ge2-type structure (), which lacks a local inversion symmetry of the Ce and one of the Rh and As sites while maintaining a global inversion center (see Fig. 1). Noteworthy, the majority of ( = rare earth, = transition metal, = Si, Ge) compounds including the first heavy-fermion superconductor CeCu2Si2 [7] have a tetragonal ThCr2Si2-type crystal structure with inversion symmetry ().
The fundamental physical properties of CeRh2As2 including superconductivity have recently been reported [6]. The Kondo temperature () and the electronic specific heat coefficient () have been evaluated as K and J/mol K2 [6], respectively, which are similar to those of CeCu2Si2 [8, 9]. The origin of the superconducting property of locally non-centrosymmetric heavy fermions including CeRh2As2 has been investigated theoretically [10, 11, 12, 13, 14, 15, 16] and experimentally [17]. However, the electronic structure of the material, which is the most basic information for the discussion of the physical properties, has not been investigated experimentally so far, although the electronic structure using DFT calculations has been reported [13, 14, 15].
A locally non-centrosymmetric crystal structure can produce a local electric field to the electron orbitals. With a large SOI, the local electric field induces the band splitting such as the Rashba effect [18, 19], which can be directly observed by an angle-resolved photoelectron spectroscopy (ARPES) [20] and (magneto-optical) infrared spectroscopies [21, 22, 23]. ARPES studies on non-centrosymmetric heavy fermions have been performed on CeIrSi3 [24] and UIr [25]. However, so far, no studies of optical conductivity were reported for this type of materials.
We investigated the fundamental electronic structure of the locally non-centrosymmetric heavy-fermion material CeRh2As2 by measuring the optical conductivity () spectra and comparing them with first-principal DFT calculations. As a reference material without electrons, we also investigated LaRh2As2 in order to discuss the electronic structure without the effect of the hybridization between conduction and electrons (- hybridization). Firstly, the obtained spectrum of LaRh2As2 is compared with the DFT calculations for the fundamental electronic structure without electrons. Next, the spectrum of CeRh2As2 is compared with the corresponding calculation results. Finally, the temperature-dependent spectra of CeRh2As2 is compared with other heavy fermion materials to discuss the evolution of the - hybridization.
II Experiment and calculation methods
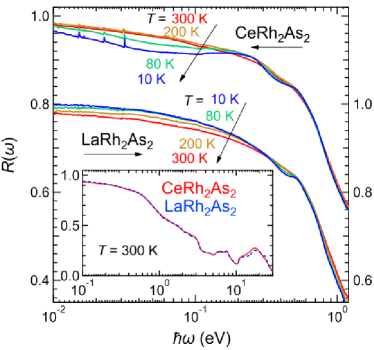
Single-crystalline CeRh2As2 and LaRh2As2 samples were synthesized by the Bi-flux method [6]. The optical reflectivity measurements have been performed using the as-grown (001) plane. Near-normal-incident spectra were acquired in a wide photon-energy range of 8 meV – 30 eV to ensure accurate Kramers-Kronig analysis (KKA) [26]. Infrared (IR) and terahertz (THz) measurements at the photon energy regions of 8 meV–1.5 eV have been performed using conventional near-normal reflectivity measurement setups to obtain absolute at an accuracy of % with a feed-back positioning system in the temperature range of 10–300 K [27]. To obtain the absolute values, the in-situ gold evaporation method was adopted. Obtained spectra of CeRh2As2 and LaRh2As2 are shown in Fig. 2. In the photon energy range of 1.5–30 eV, the spectrum was measured only at 300 K by using the synchrotron radiation setup at the beamline 3B of UVSOR-III Synchrotron [28], and connected to the spectra for eV for KKA. In order to obtain via KKA of , the spectra were extrapolated below 8 meV with a Hagen-Rubens function [] due to the metallic spectra, and above 30 eV with a free-electron approximation [29]. Here, the values of the direct current conductivity () were adopted from the experimental values [6]. The extrapolations were confirmed not to severely affect to the spectra at around 100 meV, which are the main part in this paper.
| Sample | CeRh2As2 | LaRh2As2 | ||||
|---|---|---|---|---|---|---|
| Crystal structure | CaBe2Ge2-type | |||||
| Space group | (No. 129) | |||||
| Lattice constant | ||||||
| a (Å), b (Å), c (Å) | 4.283(1), | 4.283(1), | 9.865(2) | 4.3137(2), | 4.3137(2), | 9.8803(4) |
| Position | X | Y | Z | X | Y | Z |
| Ce, La | 0.25 | 0.25 | 0.254686(3) | 0.25 | 0.25 | 0.2543(2) |
| Rh 1 | 0.75 | 0.25 | 0 | 0.75 | 0.25 | 0 |
| Rh 2 | 0.25 | 0.25 | 0.617418(4) | 0.25 | 0.25 | 0.6159(2) |
| As 1 | 0.75 | 0.25 | 0.5 | 0.75 | 0.25 | 0.5 |
| As 2 | 0.25 | 0.25 | 0.864075(7) | 0.25 | 0.25 | 0.871(9) |
First-principal DFT calculations have been performed by using the Wien2k code including SOI [30] to explain the experimentally obtained spectra. Lattice parameters obtained from room-temperature x-ray diffraction measurements shown in Table I were adopted to the calculations. The obtained band structure of CeRh2As2 was consistent with the recent report [13, 15]. spectra of the interband transitions have also been calculated by using the Wien2k code. For the discussion of LaRh2As2, we also performed DFT calculations on the basis of a hyphothetical ThCr2Si2-type crystal structure, assuming the same lattice constants as for the original CaBe2Ge2-type structure.
III Results and Discussion
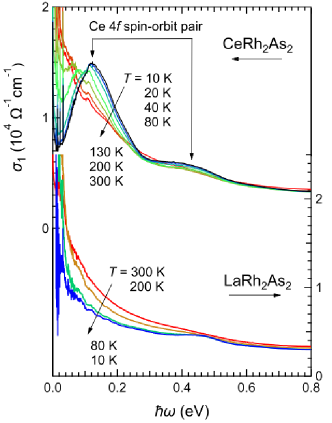
The measured spectra of CeRh2As2 and LaRh2As2, shown in Fig. 2, at various temperatures, were used for KKA in order to obtain their spectra as shown in Fig. 3. At 300 K, of both materials monotonically increase with decreasing suggesting a typical metallic character. The spectrum of CeRh2As2 at 300 K is very similar to that of LaRh2As2, as demonstrated by almost identical spectra in the inset of Fig. 2. This suggests fully localized Ce states at 300 K. With decreasing temperature, the spectra strongly change and new features emerge: A double-peak structure (“mid-IR peak”) appears at 0.12 and 0.4 eV in CeRh2As2, whereas in LaRh2As2, a weak single peak becomes visible at 0.45 eV. The mid-IR peak is usually observed in many Ce compounds and suggests the emergence of the - hybridization [31]. The peak appearing in LaRh2As2 does not obviously originate from the - hybridization, but can be explained by the electronic structure of LaRh2As2.
III.1 Electronic structure of LaRh2As2
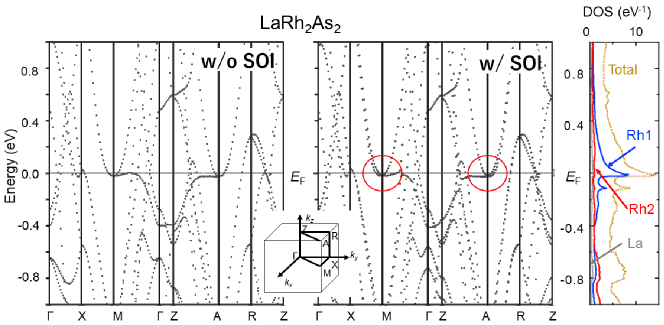
Figure 4 shows the band calculation results of LaRh2As2 near the Fermi energy () with and without SOI. The main effect of including the SOI appears as a spin-orbit (SO) splitting near along the and lines (see the red encircled regions in Fig. 4). The bands mainly originate from the states of Rh 1 as shown in the partial density of states depicted in Fig. 4. The SO splitting is much smaller than that of LaPt3Si [32] and BiTeI [23]. The different SO splitting size probably originate from the different orbital moments ( for Rh, for Pt, and for Bi), locally/globally non-centrosymmetric crystal structure, and/or the different dimensionality, three-dimensional LaRh2As2 and LaPt3Si, and two-dimensional BiTeBr.
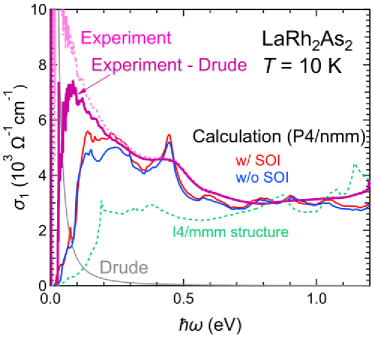
Figure 5 shows the experimental spectrum of LaRh2As2 at = 10 K together with spectra obtained from the DFT calculation results (Fig. 4) either with SOI (red solid line) or without SOI (blue solid line). The free charge carrier response (Drude peak, grey solid line) evaluated from of LaRh2As2 is also shown. The experimental spectrum (denoted by “Experiment” in Fig. 5) is much larger than the expected Drude curve suggesting the existence of other components due to interband transitions overlapping on the Drude curve. These interband transitions are indicated by the thick solid line (denoted by “Experiment - Drude” in Fig. 5), which was derived by subtraction of the Drude curve from the spectrum. The interband transition spectrum has a broad peak at around eV and a sharp peak at eV.
Both calculated spectra with and without SOI are almost identical suggesting a weak effect of the SOI on . This is consistent with the small SOI intensity of LaRh2As2. The two significant peaks at eV and eV can be attributed to the experimentally observed peaks at eV and eV. They both originate from the bands near the and lines in the Brillouin zone (see Fig. 4). The background intensity of the calculated spectra is consistent with that of the experimental spectrum. Therefore, the experimental spectrum can be explained well by the DFT calculations.
In order to investigate the effect of the crystal structure, Fig. 5 also shows a spectrum calculated by using the centrosymmetric ThCr2Si2-type crystal structure () while keeping the lattice parameters as in the CaBe2Ge2-type structure. The large peak at eV does not appear and the background spectral intensity is much lower than that of the experimental spectrum. This suggests that both the 0.5 eV peak and the high background intensity are characteristic properties of LaRh2As2 and the locally non-centrosymmetric CaBe2Ge2-type crystal structure.
III.2 Electronic structure of CeRh2As2
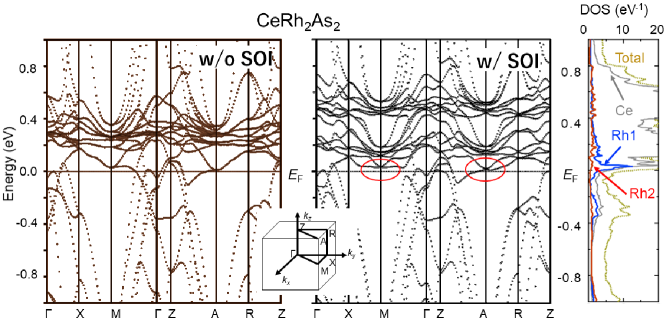
Figure 6 shows the calculated band structures of CeRh2As2 with and without SOI. An important effect of the SOI is a splitting of the Ce bands from almost flat bands at eV into two parts, namely bands at eV and bands at eV. The splitting energy is roughly eV, which is a characteristic value for various Ce-based compounds as observed in spectra [31, 33] and photoelectron spectra [8, 34].
As in LaRh2As2, the SO split bands appear near along the and lines. The size of SO splitting is larger than that of LaRh2As2. Since the bands originate from the hybridization between the Rh 1 and Ce bands (see the partial densities of states of Ce and Rh 1 in the right figure of Fig. 6), the state is considered to be relevant for the SO splitting. Moreover, as flat bands are claimed to be important for the superconductivity [13], the SO splitting may play an important role for the exotic superconductivity in CeRh2As2.
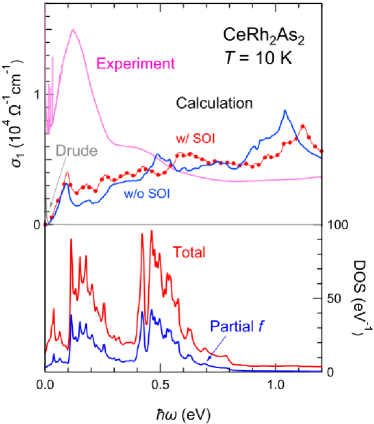
Figure 7 shows the experimentally obtained spectrum at 10 K together with the calculated spectra with and without SOI. In comparison with the spectra of LaRh2As2, the calculated spectra cannot reproduce the experimental spectrum well. The main reason is that the mid-IR peak below eV does not appear in the calculation. The experimental mid-IR peak can be attributed to the SO splitting of the Ce states [35], which appears in the unoccupied density of states above as shown in the lower frame of Fig. 7. However, the corresponding mid-IR peak structure does not clearly appear in the calculation shown in the upper frame of Fig. 7. The inconsistency suggests that the calculated - hybridization intensity in the DFT calculations is much smaller than the experimental value because the Kondo interaction between conduction and localized electrons is not included in the calculation.
According to the band calculation in Fig. 6, the signature of the SO splitting along the line may appear at eV. In this energy region, there are three phonon peaks at = 15.2, 22.8, and 31.7 meV (see Fig. 2), but no other significant structures except for the Drude peak. Therefore, we conclude that, in the spectra, there are no visible signatures for a SO splitting expected in the band structure.
III.3 - hybridization of CeRh2As2
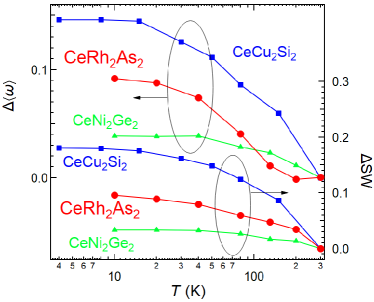
The - hybridization in CeRh2As2 can be characterized by using the temperature dependence of the mid-IR peak. Figure 8 shows the temperature dependencies of the center of gravity [ ], where , and the spectral weight transfer [ ] of the mid-IR peak of CeRh2As2 relative to those at 300 K. The integration range was set as , where the spectral change in the lower energy region is almost recovered. In the figure, the evaluated and of two heavy-fermion compounds CeCu2Si2 ( K) [36] and CeNi2Ge2 ( several K) [33] are also plotted for comparison. The temperature dependencies of and correspond to the evolution of the - hybridization with temperature [31], i.e., an increasing itinerancy corresponds to increasing values of and whereas constant values suggest a localization of the state.
In CeRh2As2, is constant near 300 K and increases toward low temperatures below K, suggesting a rapid development of the - hybridization below the temperature. This is consistent with the - hybridization intensity being almost negligible at 300 K, which is demonstrated by almost identical spectra of CeRh2As2 and LaRh2As2 at 300 K (see inset of Fig. 2).
The values monotonically increase with decreasing temperature below 300 K. As was shown previously [31], an increase from 300 K to K originates from electron-phonon interactions, and the - hybridization effect appears below the temperature of K. In CeRh2As2, the increases at low temperatures, which is consistent with . The values of and of CeRh2As2 at the lowest accessible temperature are located in between those of CeCu2Si2 and CeNi2Ge2 suggesting an intermediate - hybridization intensity, which is included in the Kondo temperature expression
| (1) |
where is the density of states of the conduction band at [37]. Hence, compared to CeCu2Si2, the higher K and smaller of CeRh2As2 should be related to a larger . Indeed, such conclusion is consistent with the spectral intensity of LaRh2As2 for eV, which reflects the density of states near the . In this region, is enhanced compared to the calculated one using the ThCr2Si2-type structure as shown in Fig. 5, which is also due to a flat Rh band near the as shown in Fig. 4. Therefore, the locally non-centrosymmetric CaBe2Ge2-type crystal structure of CeRh2As2 supports a higher than the ThCr2Si2-type structure of CeCu2Si2.
IV Conclusion
To summarize, optical conductivity spectra of a locally non-centrosymmetric heavy fermion superconductor CeRh2As2 and LaRh2As2 as a reference material without electrons were measured and compared with the corresponding DFT calculations. The experimentally obtained spectrum of LaRh2As2 can be explained well by the DFT calculations. Besides, the experimental spectrum of CeRh2As2 at low temperatures has a stronger - hybridization intensity than the DFT calculation because the Kondo interaction is effective at low temperatures, which is also seen in the temperature dependence of the spectrum. The evidence of the SO splitting due to the locally non-centrosymmetric crystal structure, unfortunately, could not be observed in the spectra because of the SO splitting being too small for resolvable spectral features.
Acknowledgments
We would like to thank Profs. Noriaki Kimura, Takahiro Ito, Hiroshi Watanabe, and Yoshiyuki Ohtsubo for their fruitful discussion and UVSOR Synchrotron staff members for their support during synchrotron radiation experiments. Part of this work was performed under the Use-of-UVSOR Synchrotron Facility Program (Proposals No. 20-735) of the Institute for Molecular Science, National Institutes of Natural Sciences. This work was partly supported by JSPS KAKENHI (Grant No. 20H04453).
References
- Feng et al. [2017] Y. P. Feng, L. Shen, M. Yang, A. Wang, M. Zeng, Q. Wu, S. Chintalapati, and C.-R. Chang, Wiley Interdiscip. Rev. Comput. Mol. Sci. 7, e1313 (2017).
- Crabtree and Soncini [2018] J. M. Crabtree and A. Soncini, Phys. Rev. B 98, 094417 (2018).
- Frigeri et al. [2004] P. A. Frigeri, D. F. Agterberg, A. Koga, and M. Sigrist, Phys. Rev. Lett. 92, 097001 (2004), arXiv:0311354 [cond-mat] .
- Bauer et al. [2004] E. Bauer, G. Hilscher, H. Michor, C. Paul, E. W. Scheidt, A. Gribanov, Y. Seropegin, H. Noël, M. Sigrist, and P. Rogl, Phys. Rev. Lett. 92, 027003 (2004).
- Momma and Izumi [2011] K. Momma and F. Izumi, J. Appl. Crystallogr. 44, 1272 (2011).
- Khim et al. [2021] S. Khim, J. F. Landaeta, J. Banda, N. Bannor, M. Brando, P. M. R. Brydon, D. Hafner, R. Küchler, R. Cardoso-Gil, U. Stockert, A. P. Mackenzie, D. F. Agterberg, C. Geibel, and E. Hassinger, Science (80-. ). 373, 1012 (2021), arXiv:2101.09522 .
- Steglich et al. [1979] F. Steglich, J. Aarts, C. D. Bredl, W. Lieke, D. Meschede, W. Franz, and H. Schäfer, Phys. Rev. Lett. 43, 1892 (1979).
- Reinert et al. [2001] F. Reinert, D. Ehm, S. Schmidt, G. Nicolay, S. Hüfner, J. Kroha, O. Trovarelli, and C. Geibel, Phys. Rev. Lett. 87, 106401 (2001).
- Kittaka et al. [2014] S. Kittaka, Y. Aoki, Y. Shimura, T. Sakakibara, S. Seiro, C. Geibel, F. Steglich, H. Ikeda, and K. Machida, Phys. Rev. Lett. 112, 067002 (2014), arXiv:1307.3499 .
- Yoshida et al. [2015] T. Yoshida, M. Sigrist, and Y. Yanase, Phys. Rev. Lett. 115, 027001 (2015), arXiv:1507.06388 .
- Schertenleib et al. [2021] E. G. Schertenleib, M. H. Fischer, and M. Sigrist, Phys. Rev. Res. 3, 023179 (2021), arXiv:2101.08821 .
- Skurativska et al. [2021] A. Skurativska, M. Sigrist, and M. H. Fischer, Phys. Rev. Res. 3, 033133 (2021), arXiv:2103.06282 .
- Nogaki et al. [2021] K. Nogaki, A. Daido, J. Ishizuka, and Y. Yanase, (2021), arXiv:2103.08088 .
- Ptok et al. [2021] A. Ptok, K. J. Kapcia, P. T. Jochym, J. Łażewski, A. M. Oleś, and P. Piekarz, Phys. Rev. B 104, L041109 (2021), arXiv:2102.02735 .
- Cavanagh et al. [2021] D. C. Cavanagh, T. Shishidou, M. Weinert, P. M. R. Brydon, and D. F. Agterberg, , 1 (2021), arXiv:2106.02698 .
- Möckli and Ramires [2021] D. Möckli and A. Ramires, Phys. Rev. Res. 3, 023204 (2021), arXiv:2102.09425 .
- Hafner et al. [2021] D. Hafner, P. Khanenko, E. O. Eljaouhari, R. Küchler, J. Banda, N. Bannor, T. Lühmann, J. F. Landaeta, S. Mishra, I. Sheikin, E. Hassinger, S. Khim, C. Geibel, G. Zwicknagl, and M. Brando, (2021), arXiv:2108.06267 .
- Rashba and Sheka [1959] E. I. Rashba and V. I. Sheka, Dtsch. Phys. Gesellschaft 2, 162 (1959).
- Bihlmayer et al. [2015] G. Bihlmayer, O. Rader, and R. Winkler, New J. Phys. 17, 050202 (2015).
- Ishizaka et al. [2011] K. Ishizaka, M. S. Bahramy, H. Murakawa, M. Sakano, T. Shimojima, T. Sonobe, K. Koizumi, S. Shin, H. Miyahara, A. Kimura, K. Miyamoto, T. Okuda, H. Namatame, M. Taniguchi, R. Arita, N. Nagaosa, K. Kobayashi, Y. Murakami, R. Kumai, Y. Kaneko, Y. Onose, and Y. Tokura, Nat. Mater. 10, 521 (2011).
- Demkó et al. [2012] L. Demkó, G. A. H. Schober, V. Kocsis, M. S. Bahramy, H. Murakawa, J. S. Lee, I. Kézsmárki, R. Arita, N. Nagaosa, and Y. Tokura, Phys. Rev. Lett. 109, 167401 (2012).
- Martin et al. [2013] C. Martin, E. D. Mun, H. Berger, V. S. Zapf, and D. B. Tanner, Phys. Rev. B 87, 041104 (2013).
- Martin et al. [2016] C. Martin, A. V. Suslov, S. Buvaev, A. F. Hebard, P. Bugnon, H. Berger, A. Magrez, and D. B. Tanner, EPL (Europhysics Lett. 116, 57003 (2016).
- Ohkochi et al. [2009] T. Ohkochi, T. Toshimitsu, H. Yamagami, S.-i. Fujimori, A. Yasui, Y. Takeda, T. Okane, Y. Saitoh, A. Fujimori, Y. Miyauchi, Y. Okuda, R. Settai, and Y. Ånuki, J. Phys. Soc. Japan 78, 084802 (2009).
- Yamagami et al. [2010] H. Yamagami, T. Ohkochi, S. I. Fujimori, T. Toshimitsu, A. Yasui, T. Okane, Y. Saitoh, A. Fujimori, Y. Haga, E. Yamamoto, S. Ikeda, and Y. Onuki, J. Phys. Conf. Ser. 200, 8 (2010).
- Kimura and Okamura [2013] S.-i. Kimura and H. Okamura, J. Phys. Soc. Japan 82, 021004 (2013), arXiv:1210.5310 .
- Kimura [2008] S.-i. Kimura, Jasco Rep. 50, 6 (2008).
- Fukui et al. [2014] K. Fukui, R.-i. Ikematsu, Y. Imoto, M. Kitaura, K. Nakagawa, T. Ejima, E. Nakamura, M. Sakai, M. Hasumoto, and S.-i. Kimura, J. Synchrotron Radiat. 21, 452 (2014).
- Dressel and Grüner [2002] M. Dressel and G. Grüner, Electrodyn. Solids (Cambridge University Press, 2002).
- Blaha et al. [1990] P. Blaha, K. Schwarz, P. Sorantin, and S. Trickey, Comput. Phys. Commun. 59, 399 (1990).
- Kimura et al. [2021] S.-i. Kimura, Y. S. Kwon, C. Krellner, and J. Sichelschmidt, Electron. Struct. 3, 024007 (2021), arXiv:2101.09696 .
- Uzunok et al. [2017] H. Uzunok, H. Tütüncü, G. Srivastava, and A. BaÅoǧlu, Intermetallics 86, 1 (2017).
- Kimura et al. [2016] S.-i. Kimura, Y. S. Kwon, Y. Matsumoto, H. Aoki, and O. Sakai, J. Phys. Soc. Japan 85, 083702 (2016), arXiv:1605.04981 .
- Im et al. [2006] H. Im, T. Ito, S. Kimura, J. Hong, and Y. Kwon, Phys. B Condens. Matter 378-380, 825 (2006).
- Kimura et al. [2009] S.-i. Kimura, T. Iizuka, and Y.-s. Kwon, J. Phys. Soc. Japan 78, 013710 (2009), arXiv:0811.2869 .
- Sichelschmidt et al. [2013] J. Sichelschmidt, A. Herzog, H. S. Jeevan, C. Geibel, F. Steglich, T. Iizuka, and S. Kimura, J. Phys. Condens. Matter 25, 1 (2013), arXiv:1301.2896 .
- Hewson [1993] A. C. Hewson, The Kondo Problem to Heavy Fermions (Cambridge University Press, Cambridge, 1993).