Quasi-harmonic thermoelasticity of palladium, platinum, copper, and gold from first principles
Abstract
We calculate the temperature-dependent elastic constants of palladium, platinum, copper and gold within the quasi-harmonic approximation using a first-principles approach and evaluating numerically the second derivatives of the Helmholtz free-energy with respect to strain at the minimum of the free-energy itself. We find an overall good agreement with the experimental data although the anomalies of palladium and platinum reported at room temperature are not reproduced. The contribution of electronic excitations is also investigated: we find that it is non-negligible for the elastic constants of palladium and platinum while it is irrelevant in the other cases. Its effect is not sufficient to explain the details of the anomalies found by experiments, not even when, in the case of platinum, we take into account the electron-phonon interaction. Lastly, the effect of the exchange and correlation functional is addressed and it is found that it is important at K, while all functionals give similar temperature dependencies.
1 Introduction
The vibrational and thermodynamic properties of transition and noble metals and of their alloys are key ingredients to understand many industrial and technological processes. [1, 2, 3] Moreover, the comprehension of these properties for elemental metals is a fundamental prerequisite for the rational design of materials. In addition to the extensive experimental investigations [4], the prediction of thermodynamic properties via density functional theory (DFT) [5, 6] has been among the primary goals of first-principles studies for many years (see for instance Refs. [7, 8] and references therein).
In this context, the thermo_pw [9] code has been designed to compute efficiently, among other things, the thermodynamic properties of solids. Previous applications include the phonon dispersions, the thermal expansions, and the heat capacities of the hexagonal close packed (hcp) metals rhenium, technetium, [10] ruthenium, and osmium [11] and the anharmonic contributions to the mean square atomic displacements within the quasi-harmonic approximation (QHA) of silicon, ruthenium, magnesium, and cadmium [12].
Elastic constants (ECs) are other crucial quantities for crystal thermodynamics: they determine the crystal stability, thermal stresses, and sound velocities. For several decades DFT has provided ECs of solids, often within from the experiment. However calculations have been usually limited to K since the introduction of quantum and temperature effects requires a significant computational effort. As a result, there are now numerous theoretical ECs data at K [13, 14, 15], but much less at finite temperatures. Some calculations do exist, but many of them are limited to the quasi-static approximation (QSA) where the temperature dependent elastic constants (TDECs) are calculated as second derivatives of the total energy with respect to strain (as at K) at the minimum of the Helmholtz free-energy so accounting only for the effect of thermal expansion on the ECs. Only in a few papers the complete QHA method was applied (see, for example, Refs. [16, 17]). Other calculations make use of the - molecular dynamics method that, however, focus mainly on the high temperature behavior where quantum effects can be neglected [18].
The thermo_pw code can compute the ECs at K (see for instance [19] and references therein) and, recently, the implementation was extended to the calculation of the quasi-harmonic TDECs as second derivatives of the Helmholtz free-energy with respect to strain [20]. So far, applications include the TDECs of silicon, aluminum, silver, [20] and boron arsenide [21].
In this work, we apply this approach to other four paradigmatic face-centered cubic (fcc) transition and noble metals: palladium, platinum, copper, and gold. The first two elements, palladium and platinum, present anomalies in the experimental TDECs that are not well understood, while the latter two are more regular. Already after the early measurements on palladium and platinum some models were put forward to explain the anomalous temperature dependence of their elastic constants [22, 23, 24, 25] and recently a computational DFT study has supported this interpretation [26]. These studies pointed out that the TDECs of palladium and platinum are anomalous due to the partially filled bands whose electrons contribute substantially to the free-energy. This theoretical study focused on the electronic contribution to the TDECs while the phonon contribution was accounted for within the QSA. Another theoretical study within the QSA, instead, finds a conventional temperature dependence for all the ECs of palladium, even considering the electronic thermal excitations [27].
Here we extend the previous QHA implementation in order to include the effects of the electronic excitations on the TDECs and compare the electronic and vibrational contributions. We find that the electronic contribution, although smaller than the vibrational one, is relevant for the temperature dependence of the ECs of palladium and platinum, where it improves the comparison with experiment, but it is not sufficient to reproduce in detail the anomalies. On the contrary, in copper and gold, whose shells are completely filled, the electronic contribution to the TDECs is negligible.
Focusing on platinum we investigate also another possible source of anomalous behavior. Actually electronic excitations might change the phonon frequencies especially at high temperatures, so we calculate the effect of this change on the TDECs. We find no substantial contribution, not even at the highest studied temperature of K.
Finally, since so far the effect of the exchange and correlation functionals on the TDECs has not been addressed in detail, we do also a systematic comparison between the local density approximation (LDA) and the generalized gradient approximation (GGA), taking the available experimental data as a reference. We find that all functionals give similar softenings of the ECs with temperature, hence the functional that matches better the experimental ECs at K turns out to be also the one that matches better the TDECs.
2 Theory
The QHA approach to the TDECs is detailed in the recent works [20, 21]: in this Section we limit ourselves to a summary of the most important formulas in order to make the paper self-contained and discuss how we have introduced the electronic excitations in the calculation.
The isothermal elastic constants are obtained from the derivatives of the Helmholtz free-energy with respect to strain :
| (1) |
where is the unit cell volume.
From the previous Equation the free-energy contains a term quadratic in the strains:
| (2) |
In cubic solids there are three independent ECs, , and which, for symmetry reasons [28] are usually written in Voigt’s notation as , and , respectively. We compute them using the deformations:
| (3) | ||||
The strain does not change the shape of the cubic cell, while transforms it into a tetragonal cell and into a rhombohedral cell. None of them conserves the volume of the cell.
As we are interested in the ECs obtained from the stress-strain relationship ( without ), when the system is under a pressure , we correct the [29]:
| (4) |
The Helmholtz free-energy of Eq. 2 is obtained as the sum of the DFT total energy , the vibrational and the electronic free energies . The vibrational free-energy is given by:
| (5) | |||||
where is the number of cells in the crystal, is the phonon angular frequency of the mode with wave-vector computed in the system with a strain . The are computed by density functional perturbation theory (DFPT) [30] on a coarse -point mesh and Fourier interpolated on a thicker mesh to perform the Brillouin zone summation.
In order to account for the thermal electronic excitations [31], one could use the Mermin’s finite temperature extension to DFT [32]. In this method, one minimizes the free-energy where both and the electronic entropy are calculated using the Fermi-Dirac occupations at a given fixed temperature . The method is accurate but needs a self-consistent calculation for each temperature. In order to evaluate the electronic free-energy for many temperatures we compute the total energy with a Methfessel-Paxton smearing [33] and a broadening sufficiently small to get the zero broadening value of and then use the K DFT energy bands to calculate the contribution of electronic thermal excitations to the free-energy: . We take where is the electronic excitations energy:
| (6) |
while is the electronic excitations entropy:
| (7) |
In Eqs. 6 and 7 are the Fermi-Dirac occupations (depending on , the temperature , and the chemical potential ), is the electronic density of states and is the Fermi energy. The is calculated at each temperature imposing that the number of electrons per unit cell is determined by .
The QHA calculation of the ECs, Eq. 1, is performed on a grid of reference geometries by varying the lattice constant . Phonon dispersions and electronic bands are computed on the same grid in order to evaluate the total Helmholtz free-energy as a function of the volume. Then, at each temperature , the ECs are interpolated and evaluated at the which minimizes the free-energy. The calculation requires phonon dispersions and electronic band structures in all the strained configurations for all the reference geometries.
In order to compare our results with ultrasonic experimental data we compute also the adiabatic ECs given by:
| (8) |
where are the thermal stresses:
| (9) |
and is the thermal expansion tensor. is the isochoric heat capacity defined, for example, in Ref. [21] and is the unit cell volume at the temperature .
The DFPT phonon calculation can be also performed at finite temperature by using Fermi-Dirac occupations [34] with a broadening corresponding to the given temperature. Hence, the angular frequency of Eq. 5 are replaced with the temperature dependent , giving a correction to the Helmholtz free-energy. In this case the electronic excitations contribution is already included in the DFT total energy , via the Mermin’s functional, and it is not necessary to add it separately. We use this approach in platinum at enough large temperatures in order to clearly identify the effect, in particular at the temperatures K and K and compare with the former method.
| Palladium | |||||
|---|---|---|---|---|---|
| LDA | 3.85 | 2696 | 2071 | 788 | 2279 |
| PBEsol | 3.88 | 2445 | 1861 | 740 | 2056 |
| PBE | 3.95 | 2010 | 1532 | 606 | 1690 |
| LDAa | 3.90 | 2743 | 1463 | 716 | 1890 |
| GGAb | 3.94 | 2548 | 1358 | 587 | 1755 |
| Expt.c | 3.8896(2) | 2341(27) | 1761(27) | 712(3) | 1954 |
| Platinum | |||||
| LDA | 3.90 | 3800 | 2759 | 802 | 3106 |
| PBEsol | 3.92 | 3553 | 2581 | 764 | 2905 |
| PBE | 3.98 | 3039 | 2234 | 615 | 2502 |
| LDAd | 3.91 | 3645 | 2665 | 736 | 2992 |
| PBEsole | 3.91 | 3595 | 2456 | 858 | 2836 |
| GGAd | 3.99 | 3063 | 2133 | 730 | 2443 |
| Expt.f | 3.92268(4) | 3487(130) | 2458(130) | 734(20) | 2801(9) |
| Copper | |||||
| LDA | 3.52 | 2349 | 1666 | 998 | 1894 |
| PBEsol | 3.56 | 2100 | 1480 | 938 | 1687 |
| PBE | 3.63 | 1775 | 1238 | 793 | 1417 |
| LDAg | 3.64 | 1678 | 1135 | 745 | 1316 |
| GGAh | 3.63 | 1745 | 1253 | 752 | 1417 |
| GGAi | 3.63 | 1800 | 1200 | 840 | 1400 |
| Expt.l | 3.596 | 1762.0 | 1249.4 | 817.7 | 1420.3 |
| Gold | |||||
| LDA | 4.05 | 2120 | 1873 | 373 | 1955 |
| PBEsol | 4.10 | 1926 | 1651 | 366 | 2614 |
| PBE | 4.16 | 1544 | 1327 | 268 | 1389 |
| GGAg | 4.07 | 2021 | 1742 | 379 | 1835 |
| PBEm | 4.19 | 1478 | 1435 | 387 | 1449 |
| Expt.n | 4.062 | 2016.3 | 1696.7 | 454.4 | 1803.2 |
a Ref. [27], b Ref. [35]
c Ref. [22] (room temperature , K extrapolation of ECs),
d Ref. [36], e Ref. [15] (all electrons),
f Reference [37] (room temperature results, most recent work)
g Reference [13], h Reference [38], i Reference [39]
l Ref. [40] for and Ref. [41] for the ECs (K extrapolation),
m Ref. [42], n Ref. [40] for and Ref. [43] for the ECs (K extrapolation)
3 Computational parameters
The calculations presented in this work were carried out using DFT as implemented in the Quantum ESPRESSO package [44] [45]. For the calculations of ECs at K and for all materials, the exchange and correlation functional was approximated by the local density approximation (LDA) [46], the generalized gradient approximation (GGA) of Perdew, Burke and Ernzerhof (PBE) [47] and its modification for densely packed solids (GGA-PBEsol) [48]. For the TDECs we use LDA and GGA-PBEsol for all metals and for copper we also use the GGA-PBE functional (which, in this case, gives the best agreement with the experimental T=0 K ECs). We employ the projector augmented wave (PAW) method and a plane waves basis set with pseudopotentials [49] from pslibrary [50]. The pseudopotentials are reported in the note 111For palladium we used Pd.pz-n-kjpaw_psl.1.0.0.UPF and Pd.pbesol-n-kjpaw_psl.1.0.0.UPF. For platinum Pt.pz-n-kjpaw_psl.1.0.0.UPF and Pt.pbesol-n-kjpaw_psl.1.0.0.UPF. For copper Cu.pz-dn-kjpaw_psl.1.0.0.UPF, Cu.pbe-dn-kjpaw_psl.1.0.0.UPF and Cu.pbesol-dn-kjpaw_psl.1.0.0.UPF. For gold we used Au.pz-dn-kjpaw_psl.0.3.0.UPF and Au.pbesol-dn-kjpaw_psl.0.3.0.UPF.. The cutoff for the wave functions (charge density) was Ry ( Ry) for palladium, Ry ( Ry) for platinum, Ry ( Ry) for copper and Ry ( Ry) for gold. The presence of the Fermi surface has been dealt with by a smearing approach [33] with a smearing parameter Ry for palladium and platinum and Ry for copper and gold. The k-point mesh was (except for PBEsol gold, for which a mesh has been used). Density functional perturbation theory (DFPT) [30] [51] was used to calculate the dynamical matrices on a q-point mesh for palladium and platinum (corresponding to 29 special q-points for configurations strained with , 59 q-points for and 65 for , see Ref. [20] for the definitions of the strains) and q-point mesh for copper and gold (corresponding to 8 q-points for configurations strained with and 13 q-points for those strained with and ). For palladium and platinum a thicker q-points mesh was necessary due to the presence of Kohn anomalies [8]. For all materials the dynamical matrices have been Fourier interpolated on a q-point mesh to evaluate the vibrational free-energy. The calculation of the TDECs is done by thermo_pw as described in Ref. [20]. The grid of reference geometries was centered at the minimum of the total energy as reported in Table 1 except for the LDA study of platinum that was centered at Å. We used reference geometries separated by a.u. for all metals except for platinum where we used a.u. for LDA and a.u. for PBEsol due to the presence of unstable strained configurations with imaginary phonon frequencies at too large lattice constants. We used 6 strained configurations for each type of strain with a strain interval . In total we computed the phonon dispersions on geometries for each material and functional in addition to those computed on the reference configurations required to compute and the thermal expansion. For the electronic calculation we computed the bands in all the reference configurations (to include the effect on ) and in all the strained ones (to include it in the TDECs). The k-point mesh for the electronic DOS calculations was . We use a Gaussian smearing with a smearing parameter of Ry. The inclusion of the electronic finite temperature effect in the thermodynamic quantities and in the TDECs is documented in the thermo_pw user’s guide. In order to fit the free-energy as a function of the strain we used a polynomial of degree two because, although the use of a fourth-degree polynomial could introduce some differences, it requires higher cutoffs to converge the K ECs. To interpolate the ECs computed at the different reference configurations and calculate them at the temperature dependent geometry we use a fourth-degree polynomial. More informations about the convergence tests are reported in the supplementary material.
The DFPT finite-temperature approach was applied to evaluate the ECs of platinum at the temperatures K (with a Fermi-Dirac smearing Ry) and K ( Ry). For this purpose the TDECs calculation was set in a single reference geometry with the lattice constant at the considered temperature: 7.429 a.u. for K and 7.446 a.u. for K.
4 Applications
In Table 1, we report the zero temperature lattice constants, elastic constants, and bulk moduli of the four metals calculated with different exchange and correlation functionals. We compare them with experiments and previous theoretical works. As usually found, PBE and PBEsol give slightly larger lattice parameters than LDA and smaller K ECs. PBEsol reproduces the experimental ECs of palladium and platinum better than LDA and PBE with errors smaller than for all the ECs, compared to LDA errors in the range in palladium and from ( and ) to () in platinum. PBE has differences till to for both materials.
On the other hand, the experimental ECs of copper are well reproduced by PBE with errors equal or smaller than , compared with errors larger than for the other functionals. The LDA and PBEsol have almost the same accuracy in reproducing the K and of gold (with errors of and , respectively), while for PBEsol has an error of and LDA an error of , PBE has errors of in and and in .
The differences found for the LDA ECs of palladium with respect to those of Ref. [27] are for , for and for . For platinum, comparing our LDA ECs with the calculations of Ref. [36] we found differences of for , for and for ; while the comparison of our PBEsol ECs with the corrisponding PBEsol all-electrons calculation of Ref. [15] gives differences of for , for and . The differences found for the LDA-ECs of copper with respect to those of Ref. [13] are for all ECs, while the differences between our PBE ECs with the other GGA ECs of Refs. [38, 39] are smaller than for and and for . Our PBEsol ECs of gold are close to the GGA estimates of Ref. [13] with differences of for and and for . For reference, in palladium, platinum, and gold we report GGA ECs found in literature. As expected, they are smaller than our LDA and PBEsol ECs. They shows some differences with our PBE estimates, which are, however, very close to the PBE ECs reported in the Materials Project database and computed with the PAW method.
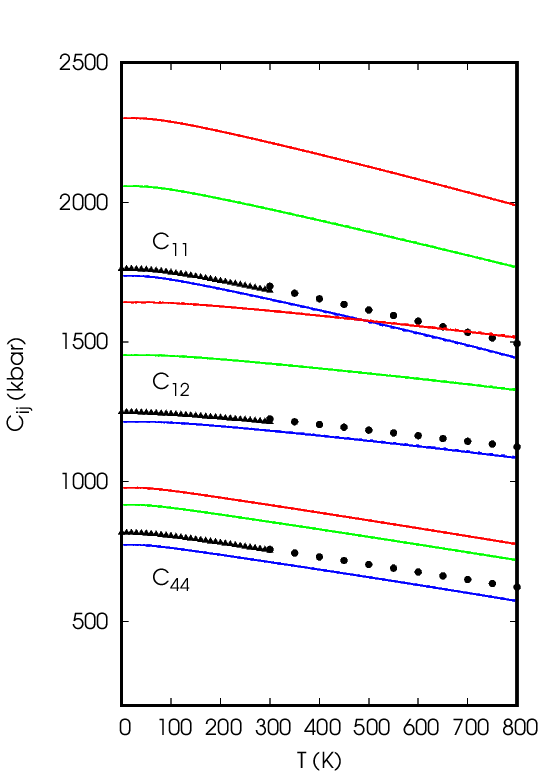
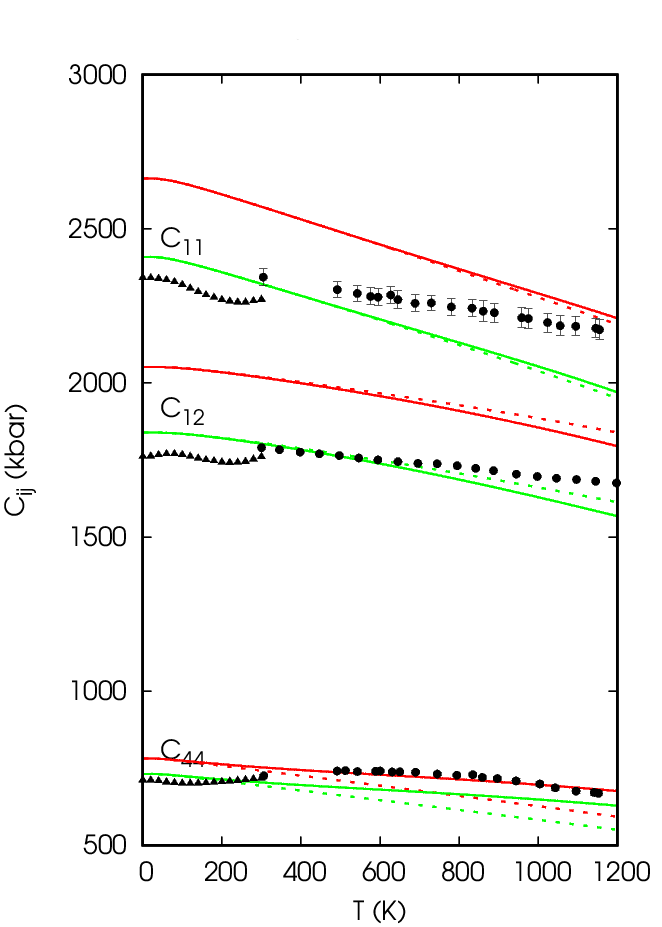
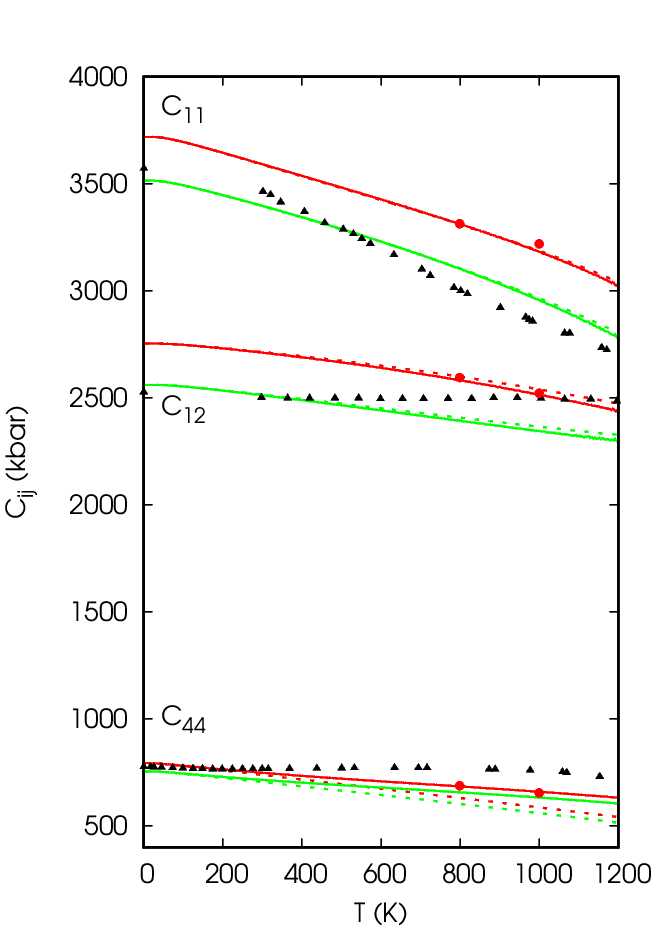
In Figs. 1, 2, 3, 4 we report the TDECs of the four metals. For each plot we follow the same color-line convention: Red indicates LDA estimates, green PBEsol and blue, present only in copper, PBE. The continuous lines are computed by considering all contributions in the Helmholtz free-energy, while the dashed lines have been obtained neglecting the contribution of the electron thermal excitations. Black points are the experimental data.
The TDECs of palladium are shown in Fig. 1. Two experimental data-set are reported. The variation of the experimental ECs of Ref. [22] in the range K is for , about for and for with respect to the K ECs. The corresponding LDA (PBEsol) variations in the same range of temperature are () for , () for and () for . In the range K the variations in the data of Ref. [24] are for , for and for , while the corresponding theoretical softenings are for , for , for for both functionals. Hence, both functionals give a similar temperature dependence. At room temperature the details of the experimental anomalies are not reproduced and above room temperature the theoretical softening is larger than the experimental one. The electronic effect is very small in and but leads to appreciable modifications of which becomes closer to the experiment. As expected, the electronic contribution increases with temperature and influences the softening of that without the electronic effect would be in the range K.
The TDECs of platinum are reported in Fig. 2. From K to K the experimental ECs decrease of about for , about for and about for . The corresponding theoretical softening for LDA (PBEsol) are () for , () for and () for . Hence, the variation of is well reproduced while the other two ECs’ softenings are overestimated. As found for palladium, the electronic contribution is important and improves the comparison with the experiment only for the EC: without the electronic effect the softening would be . However, it can not describe the anomalies. In order to further investigate the trend of the ECs of platinum we also considered the effect of the electronic excitation on the phonon frequencies for the temperatures K and K with the method explained in the previous section (results are reported in red circles in the plot, only for the LDA case). The red points are exactly over our curves (apart for a slight deviation in the at K). This fact points out that the electron-phonon interactions that modify the phonon frequencies has negligible consequences on the TDECs. We observe that our estimate of the electronic contribution is smaller than the one of Ref. [26] even for the . In our calculation the largest contribution is the vibrational one which always decreases the ECs as the temperature increases. In Ref. [26] the vibrational contribution is described within a quasi-static framework which leads to an underestimation of the ECs’ softening. Our results are qualitatively closer to those of Ref. [27] that finds a conventional temperature dependence for the .
The results of copper are shown in Fig. 3. Since the two different experimental set of data are smoothly connected we report the whole softening in the range of temperature K: for , for and for . The corresponding theoretical softening for LDA (PBEsol, PBE) are (, ) for , (, ) for and (, ) for . The temperature dependence is almost the same for LDA and PBEsol, slightly larger for PBE. The estimated softenings agree very well with the experiment. PBE results are the closest to the experiment, reflecting the trend of the K ECs shown in Table 1. The electronic thermal excitations do not give any observable contribution in the whole range of temperature.
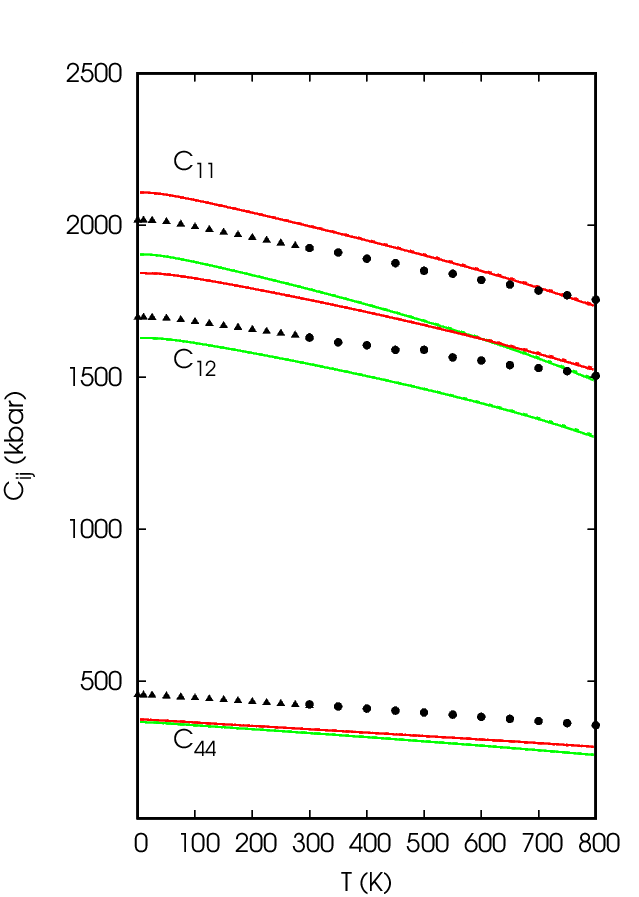
The TDECs of gold are shown in Fig. 4. As for copper we consider the two experiments together: In the range of temperature from K to K the softenings are for , for and for . The corresponding softening for LDA (PBEsol) are () for , () for and () for . The PBEsol softening is slightly larger than the LDA one and both functionals overestimate the experimental softening in particular for and with differences that increase from room temperature onward. As in copper, the electronic thermal excitations do not give any observable contribution.
5 Conclusions
In this paper we investigated the TDECs of palladium, platinum, copper, and gold by means of the QHA. LDA and GGA give almost the same softenings but differ in the zero temperature values. This work shows that PBEsol is the best choice for palladium, platinum, and gold. PBE is the best for copper. Moreover, we addressed the role of the thermal electronic excitations and found a negligible effect on the TDECs of copper and gold, and an improvement in the agreement with the experimental of palladium and platinum. Even though the computed softenings of all ECs is in reasonable agreement with the experimental ones, we could not reproduce the precise behavior of the anomalies in platinum and palladium. In platinum, we further investigated the effects of the change of the phonon frequencies induced by the finite temperature thermal electronic excitations, finding that it is small, even at the highest studied temperature K. At the current stage the discrepancy between theory and experiment in palladium and platinum is not solved and might require either a more sophisticated functional than LDA or GGA or a method that includes the anharmonic effects beyond the QHA approximation [53]. Since the experimental data are quite old, also a novel measurement of the TDECs could be useful.
References
References
- [1] N. Saunders A.P. Miodownik. CALPHAD. Pergamon, 1998.
- [2] H. L. Lukas, S. G. Fries, and B. Sundman. Computational thermodynamics. Cambridge University Press, 2007.
- [3] S. Curtarolo, W. Setyawan, G.L.W. Hart, M. Jahnatek, R. V. Chepulskii, R. H. Taylor, S. Wang, J. Xue, K. Yang, O. Levy, M. J. Mehl, H. T. Stokes, D. O. Demchenko, and D. Morgan. Computational Materials Science, 58:218–226, 2012.
- [4] Y. S. Touloukian, R. K. Kirby, R. E. Taylor, and P. D. Desai. Thermal expansion: Metallic elements and alloys. IFI/Plenum, 1975.
- [5] P. Hohenberg and W. Kohn. Phys. Rev., 136:B864–B871, 1964.
- [6] W. Kohn and L. J. Sham. Phys. Rev., 140:A1133–A1138, 1965.
- [7] B. Grabowski, T. Hickel, and J. Neugebauer. Phys. Rev. B, 76:024309, Jul 2007.
- [8] A. Dal Corso. J. Phys.: Condens. Matter, 25(14):145401, mar 2013.
- [9] A. Dal Corso. https://dalcoroso.github.io/thermo_pw, 2014.
- [10] M. Palumbo and A. Dal Corso. Phys. Status Solidi B, 254:1700101, 2017.
- [11] M. Palumbo and A. Dal Corso. J. Phys.: Condens. Matter, 29:395401, 2017.
- [12] C. Malica and A. Dal Corso. Acta Cryst. Section A, 75(4):624–632, Jul 2019.
- [13] H. Wang and M. Li. Phys. Rev. B, 79:224102, Jun 2009.
- [14] R. Golesorkhtabar, P. Pavone, J. Spitaler, P. Puschnig, and C. Draxl. Comput. Phys. Commun., 184(8):1861 – 1873, 2013.
- [15] M. Jamal, S. Jalali Asadabadi, Iftikhar Ahmad, and H.A. Rahnamaye Aliabad. Computational Materials Science, 95:592–599, 2014.
- [16] B. B. Karki, R. M. Wentzcovitch, S. de Gironcoli, and S. Baroni. Science, 286(5445):1705–1707, 1999.
- [17] D. Dragoni, D. Ceresoli, and N. Marzari. Phys. Rev. B, 91:104105, Mar 2015.
- [18] P. Steneteg, O. Hellman, O. Y. Vekilova, N. Shulumba, F. Tasnádi, and I. A. Abrikosov. Phys. Rev. B, 87:094114, 2013.
- [19] A. Dal Corso. Journal of Physics: Condensed Matter, 28(7):075401, jan 2016.
- [20] C. Malica and A. Dal Corso. J. Phys. Condens. Matter, 32:315902, 2020.
- [21] C. Malica and A. Dal Corso. J. Appl. Phys., 127:245103, 2020.
- [22] J. A. Rayne. Phys. Rev., 118:1545, 1960.
- [23] C. Weinmann and S. Steinemann. Solid State Comm., 15:281, 1974.
- [24] M. Yoshihara, R.B. McLellan, and F.R. Brotzen. Acta Metallurgica, 35(3):775–780, 1987.
- [25] S. M. Collard and R. B. McLellan. Acta metall. mater., 40:699, 1992.
- [26] P. Keuter, D. Music, V. Schnabel, M. Stuer, and J. M Schneider. J. Phys.: Condens. Matter, 31:225402, 2019.
- [27] Z-L. Liu, J-H. Yang, L-C. Cai, F-Q. Jing, and D. Alfè. Phys. Rev. B, 83:144113, 2011.
- [28] J. F. Nye. Physical properties of crystals. Oxford science publications New York, 1985.
- [29] T. H. K. Barron and M. L. Klein. Proc. Phys. Soc., 85:523, 1965.
- [30] S. Baroni, S. de Gironcoli, A. Dal Corso, and P. Giannozzi. Rev. Mod. Phys., 73:515, 2001.
- [31] X. Zhang, B. Grabowski, F. Körmann, C. Freysoldt, and J. Neugebauer. Phys. Rev. B, 95:165126, 2017.
- [32] N. David Mermin. Phys. Rev., 137:A1441–A1443, 1965.
- [33] M. Methfessel and A. T. Paxton. Phys. Rev. B, 40:3616–3621, 1989.
- [34] S. de Gironcoli. Lattice dynamics of metals from density-functional perturbation theory. Phys. Rev. B, 51:6773–6776, 1995.
- [35] T. Gao and J. R. Kitchin. Catalysis Today, 312:132–140, 2018.
- [36] V.I. Razumovskiy, E.I. Isaev, A.V. Ruban, and P.A. Korzhavyi. Intermetallics, 16(8):982–986, 2008.
- [37] S. Kamada, H. Fukui, A. Yoneda, H. Gomi, F. Maeda, S. Tsutsui, H. Uchiyama, N. Hirao, D. Ishikawa, and A. Q.R.Baron. C. R. Geoscience, 351:236, 2019.
- [38] L. Yue-Lin, G. Li-Jiang, and Jin S. 21(9):096102, 2012.
- [39] M. Jahnátek, J. Hafner, and M. Krajčí. Phys. Rev. B, 79:224103, 2009.
- [40] P. Haas, F. Tran, and P. Blaha. Phys. Rev. B, 79:085104, 2009.
- [41] W. C. Overton and John Gaffney. Phys. Rev., 98:969, 1955.
- [42] G-X. Kong, X-J M., Q-J. Liu, Y. Li, and Z-T. L. Physica B: Condensed Matter, 533:58–62.
- [43] J. R. Neighbours and G. A. Alers. Phys. Rev., 111:707–712, Aug 1958.
- [44] P. Giannozzi, S. Baroni, N. Bonini, M. Calandra, R. Car, C. Cavazzoni, D. Ceresoli, G. L. Chiarotti, M. Cococcioni, I. Dabo, et al. J. Phys.: Condens. Matter, 21:395502, 2009.
- [45] P. Giannozzi, O. Andreussi, T. Brumme, O. Bunau, M. Buongiorno Nardelli, M. Calandra, R. Car, C. Cavazzoni, D. Ceresoli, M. Cococcioni, et al. J. Phys.: Condens. Matter, 29:465901, 2017.
- [46] J. P. Perdew and A. Zunger. Phys. Rev. B, 23:5048–5079, 1981.
- [47] J. P. Perdew, K. Burke, and M. Ernzerhof. Phys. Rev. Lett., 77:3865–3868, 1996.
- [48] J. P. Perdew, A. Ruzsinszky, G. I. Csonka, O. A. Vydrov, G. E. Scuseria, L. A. Constantin, X. Zhou, and K. Burke. Phys. Rev. Lett., 100:136406, Apr 2008.
- [49] P. E. Blöchl. Phys. Rev. B, 50:17953, 1994.
- [50] A. Dal Corso. https://github.com/dalcorso/pslibrary, 2010.
- [51] A. Dal Corso. Phys. Rev. B, 81:075123, 2010.
- [52] Y. A. Chang and L. Himmel. J. Appl. Phys., 37(9):3567–3572, 1966.
- [53] N. Shulumba, O. Hellman, L. Rogström, Z. Raza, F. Tasnádi, I. A. Abrikosov, and M. Odén. Applied Physics Letters, 107(23):231901, 2015.