Perceptually Optimized Deep High-Dynamic-Range Image Tone Mapping
Abstract
We describe a deep high-dynamic-range (HDR) image tone mapping operator that is computationally efficient and perceptually optimized. We first decompose an HDR image into a normalized Laplacian pyramid, and use two deep neural networks (DNNs) to estimate the Laplacian pyramid of the desired tone-mapped image from the normalized representation. We then end-to-end optimize the entire method over a database of HDR images by minimizing the normalized Laplacian pyramid distance (NLPD), a recently proposed perceptual metric. Qualitative and quantitative experiments demonstrate that our method produces images with better visual quality, and runs the fastest among existing local tone mapping algorithms.
Index Terms:
High-dynamic-range imaging, tone mapping, image rendering.I Introduction
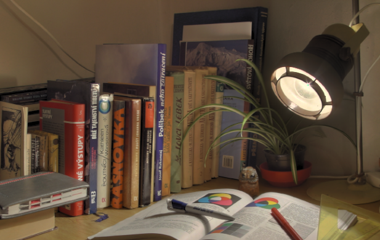
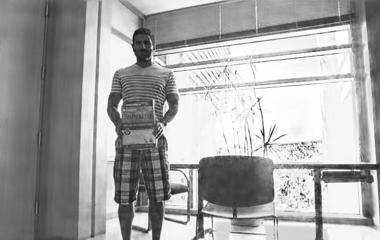
Existing monitors, projectors, and print-outs have a significantly limited dynamic range, which is inadequate to reproduce the full spectrum of luminance values presented in natural scenes and captured by current sensors [1]. When rendering high-dynamic-range (HDR) images on low-dynamic-range (LDR) display devices, tone mapping operators (TMOs) are necessary for dynamic range compression, preserving salient visual features of the original scenes. A naïve TMO is to linearly rescale the luminance values to the displayable range. However, this method is sensitive to the maximum luminance of a scene, and often creates a dark appearance (see Fig. 1 (a)). In the past decade, a large number of non-linear TMOs [2, 3, 4, 5, 6] have been proposed, aiming for faithful tone reproduction and detail preservation. These can be broadly classified into two categories: global and local operators. Global TMOs [7, 8, 9, 10, 11, 12] are a set of parametric functions, including homography, gamma mapping, logarithmic function [10], and sigmoid non-linearity [11]. Global methods preserve global contrast well, but may lose local details.
Recent studies mainly focus on local TMOs [3, 6, 13, 14, 15, 16]. A common theme is to decompose an HDR image into a base layer and a detail layer. Tone mapping is applied to the base layer, while detail enhancement is done in the detail layer. Along this path, many methods [6, 15, 16] have been proposed, differing mainly in how to perform the two-layer image decomposition in a “more effective” way. Local methods usually produce images with satisfactory local contrast with improved visual quality. However, this often comes at the cost of increasing computational complexity [13]. In addition, global contrast may be reduced, and localized artifacts such as halo-like glowing may emerge in the tone-mapped images.

Perceptual optimization of HDR image tone mapping was investigated by Yeganeh and Wang [17]. They searched over the space of all feasible tone-mapped images for the closest one with respect to the original scene, measured by a structural fidelity index [18]. This method was later improved in [19] by incorporating a statistical naturalness measure. Laparra et al. [20] formulated HDR image tone mapping as a more general image rendering problem, taking into account various display constraints. Nevertheless, the above methods require gradient-based iterative optimizers operating in the high-dimensional spaces, which are computationally expensive, preventing their wide adoption in real-world applications.
This paper aims to develop a TMO for rendering HDR images with two desired design principles. First, it should be computationally efficient. We first decompose the input HDR image into a normalized Laplacian pyramid [21, 20]. Instead of iteratively optimizing over the space of all feasible tone-mapped images, we train two feed-forward deep neural networks (DNNs): one accepts all bandpass channels and the highpass channel, and the other processes the lowpass channel of the normalized representation. Together, they predict the Laplacian pyramid of the desired tone-mapped image. The two networks are designed to be highly light-weight, enabling our method to run the fastest among existing local TMOs. Second, it should be perceptually optimized. Unlike most TMOs, we end-to-end train our networks by optimizing a recently proposed perceptual metric - the normalized Laplacian pyramid distance (NLPD) [20] between the predicted LDR images and the corresponding HDR scenes. Experiments on a test set of HDR images show that the optimized method performs consistently better than existing TMOs both qualitatively and quantitatively (measured by an independent perceptual metric - TMQI [18]).
II The NLPD Metric
In this section, we provide a brief review of the NLPD metric [20], which will be adopted as the learning objective of the proposed DNN-based TMO.
NLPD is motivated by the physiology of the early visual system. Given a calibrated HDR image , the luminance values (in the unit of candela per square meter, cd/m2) are firstly preprocessed by an exponential function, approximating the transformation of light to the response of retinal photoreceptors [20]
| (1) |
Luminance subtraction and contrast normalization are then applied recursively to partition into frequency subbands, mimicking the center-surround receptive fields found in the retina and the lateral geniculate nucleus [20]
| (2) | |||
| (3) | |||
| (4) |
where and represent linear down-/up-sampling by a factor of two, respectively. The lowpass filter is inherited from the Laplacian pyramid [21]. represents the number of pyramid levels. We obtain the normalized Laplacian pyramid by dividing each coefficient by a weighted sum of neighbouring coefficients within each subband
| (5) |
where denotes the Hadamard division and is a convolution filter optimized to reduce statistical dependencies [20]. is a small positive constant to avoid potential division by zero. Based on the normalized Laplacian pyramid representations
| (6) |
where denotes the -th level of the normalized Laplacian pyramid of the tone-mapped image . The final NLPD metric is computed by
| (7) |
where is the number of coefficients in the -th channel. The two exponents and are optimized to match the human perception of image quality using subject-rated image quality databases. NLPD is continuous and differentiable [20], which permits gradient-based optimization.
III Proposed Method
In this section, we describe the proposed TMO. After preprocessing, we decompose the input HDR image into a normalized Laplacian pyramid and feed it to two DNNs for Laplacian pyramid estimation, which is further collapsed to obtain the final LDR image. Fig. 2 shows the general framework.
III-A Preprocessing
It is important for TMOs to work with calibrated HDR images, i.e., images with true luminance values for all pixels. Calibration allows TMOs to differentiate between bright and dim scenes. Otherwise, a night HDR image in arbitrary units may be tone-mapped to a day-lit scene with amplified sensor noise. However in practice, many HDR images are acquired without calibration, meaning that the recorded measurements are linearly proportional to the actual luminances by an unknown scaling factor. To apply the proposed TMO to an uncalibrated HDR image, we need to make some educated guesses of the minimum and maximum luminance values in the original scene [20], denoted by and , respectively. For example, a typical photographic scene in full sunlight has a luminance about cd/m2, while a frosted incandescent light bulb is roughly cd/m2. After that, we linearly rescale the measurements to the estimated luminance values
| (8) | |||
| (9) |
As the final step of preprocessing, we decompose the “calibrated” into the normalized Laplacian pyramid according to Eqs. (2) to (5).
| Layer | 1 | 2 | 3 | 4 |
| Convolution | 3 | 3 | 3 | 3 |
| Dilation | 1 | 2 | 4 | 1 |
| Width | 32 | 32 | 32 | 1 |
| Bias | ✗ | ✗ | ✗ | ✗ |
| Adaptive Normalization | ✓ | ✓ | ✓ | ✗ |
| LReLU Non-linearity | ✓ | ✓ | ✓ | ✗ |
III-B Network Architecture
At the core of our method are two DNNs that predict the Laplacian pyramid of the LDR image using the normalized representation of the corresponding HDR image as input. We choose the context aggregation network (CAN) [22] as our default architecture due to its effectiveness in aggregating global context information without spatial resolution reduction. Table I shows the detailed specifications, which are manually optimized to be highly light-weight while balancing the visual quality of the output images. The CAN shared by all bandpass channels and the highpass channel has four convolution layers. Similar in [23], we use adaptive normalization, a combination of the identity mapping and the batch normalization, right after the first three convolutions:
| (10) |
where and are two learnable parameters. The weight sharing across bandpass and highpass channels enables accepting a normalized Laplacian pyramid of arbitrary levels. The leaky rectified linear unit (LReLU) is employed as the nonlinear activation function:
| (11) |
where is a fixed parameter during training. We use another CAN with the same architecture to compress the dynamic range of the lowpass luminance channel. Together the two CANs output the Laplacian pyramid of the desired tone-mapped image, which is constrained to have a luminance range of cd/m2.
A noticeable difference compared to the original CAN [23] is that we remove all the bias terms, including those used in adaptive normalization. As shown in [24], a bias-free neural network with LReLU non-linearly is locally scale-invariant: rescaling the input by a constant value simply rescales the output by the same amount [24]
| (12) |
Scale-invariance renders CAN more robust to various luminance levels provided that natural scenes with different dynamic ranges are present in the training set.
III-C Model Training and Testing
We decompose the HDR image into a five-level normalized Laplacian pyramid. For the objective function NLPD [20], we follow the original paper, and set the front-end non-linearity to , the local weight function to a spatially separable five-tap filter and the additive constant to for bandpass channels, to and to for the lowpass channel, the two exponents for the metric to and to , respectively. The slope in the LReLU is set to .
During training, we use the Adam optimizer [25] with a mini-batch size of . The initial learning rate is set to with a decay factor of for every epochs, and we train our method for epochs. We calibrate HDR images by randomly sampling the maximum luminance values from to cd/m2. In addition, we augment the training data by random cropping and horizontal flipping. During testing, we resize each HDR image such that the short side has a size of , and make an empirical guess of the maximum luminance in the original scene.
IV Experiments
In this section, we conduct experiments to demonstrate the promise of the proposed TMO. We first collect a database of HDR scenes, and use images for training and the rest for testing.
We select nine TMOs for comparison, including Drago03 [10], Reinhard02 [2], Kim08 [12], WLS [6], LLF [13], Bruce14 [14], GR [15], NLPD-Opt [20], and Liang18 [16]. Among these methods, Drago03, Reinhard02, and Kim08 are global operators, while WLS, LLF, Bruce14, GR, NLPD-Opt, and Liang18 are local operators. It is noteworthy that NLPD-Opt directly minimizes the NLPD metric in the image space. Therefore, given sufficient iterations, it can be regarded as the lower bound for all TMOs in terms of NLPD [20]. The implementations for all algorithms are obtained from the respective authors and tested with the default settings.
IV-A Qualitative Comparison
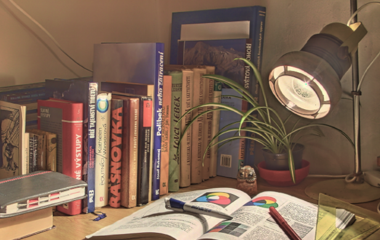
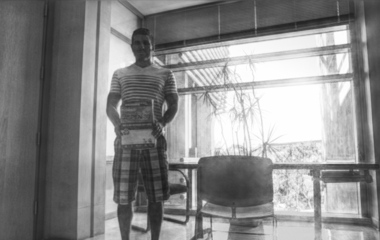
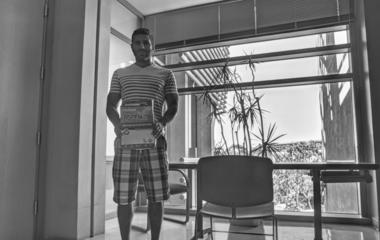
Fig. 1 shows the tone mapping results of the “Lamp” HDR scene. The naïve linear scaling creates a dark background with loss of details. The local contrast of the image by Drago03 [10] is significantly reduced (e.g., texts in the book). WLS [6] successfully preserves the structures in dark areas, but suffers from the over-exposure problem in bright regions. In contrast, our method produces a more natural appearance with rich details.
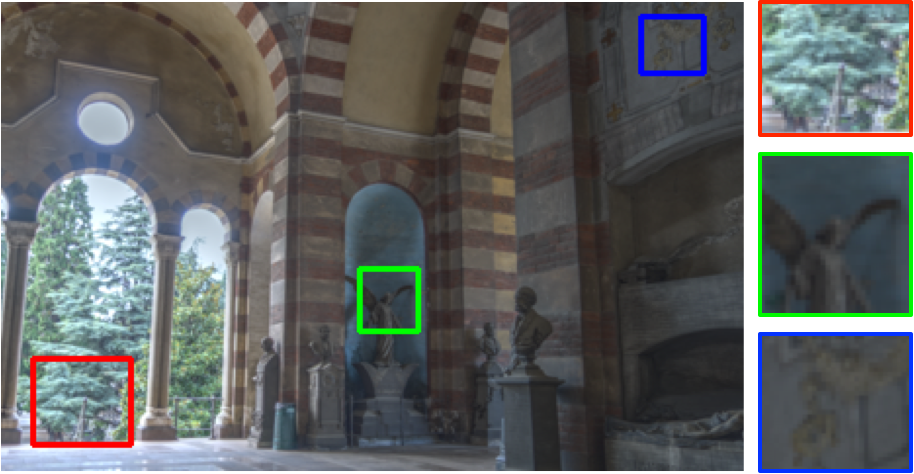
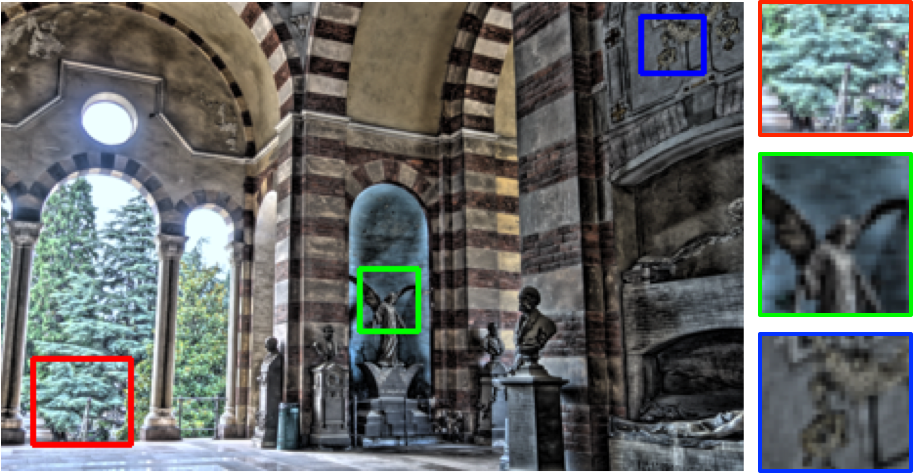
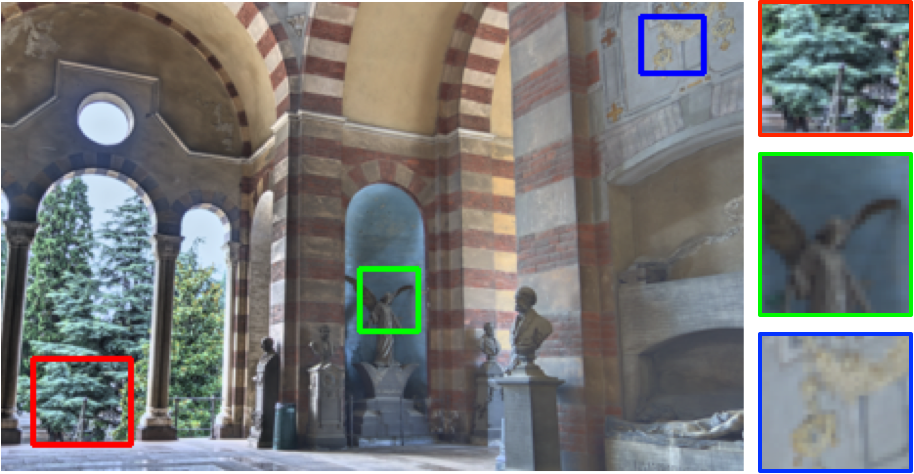
Fig. 3 shows the tone mapping results of the “Architecture” HDR image. The bright regions of the image by Dargo03 [11] is a little over-exposed. GR [15] tends to overshoot local details, making the image artificial. The proposed method generates a warmer appearance than that of LLF. Nevertheless, they produce close visual results with little artifact.
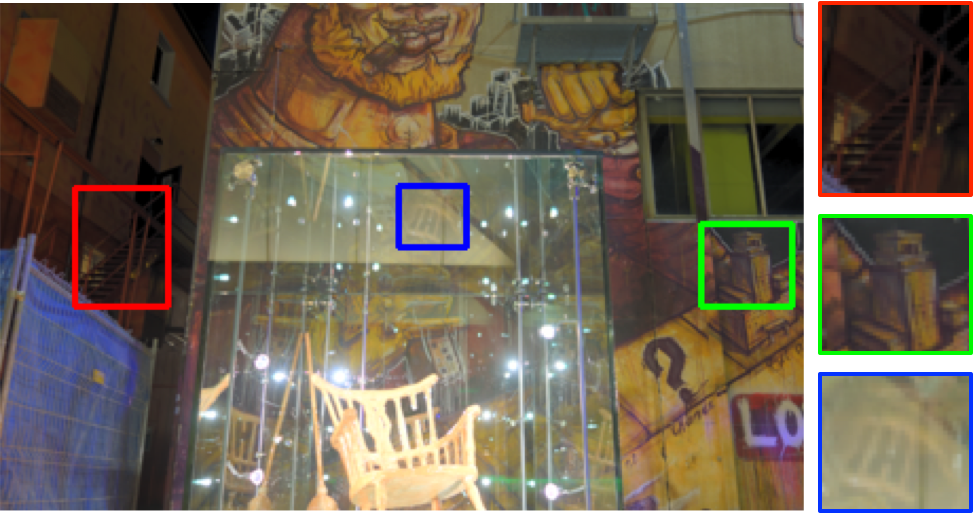
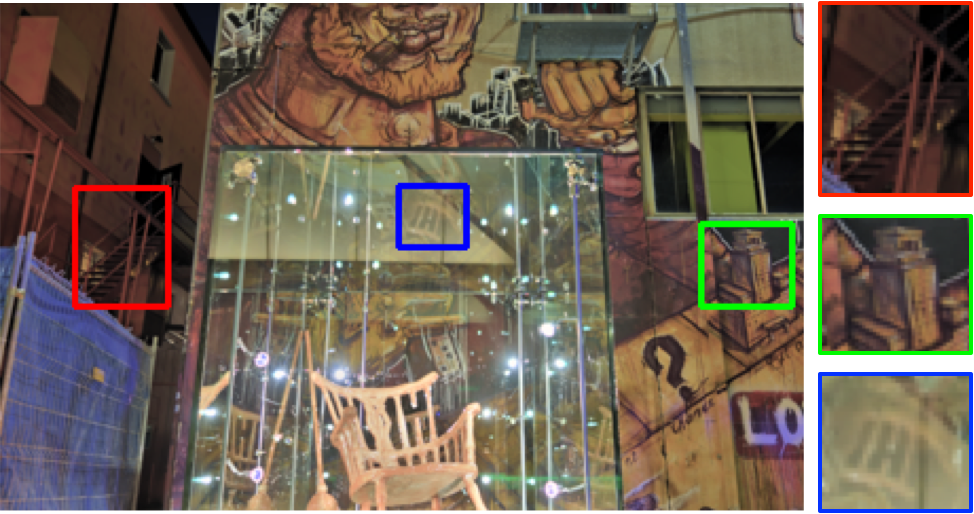
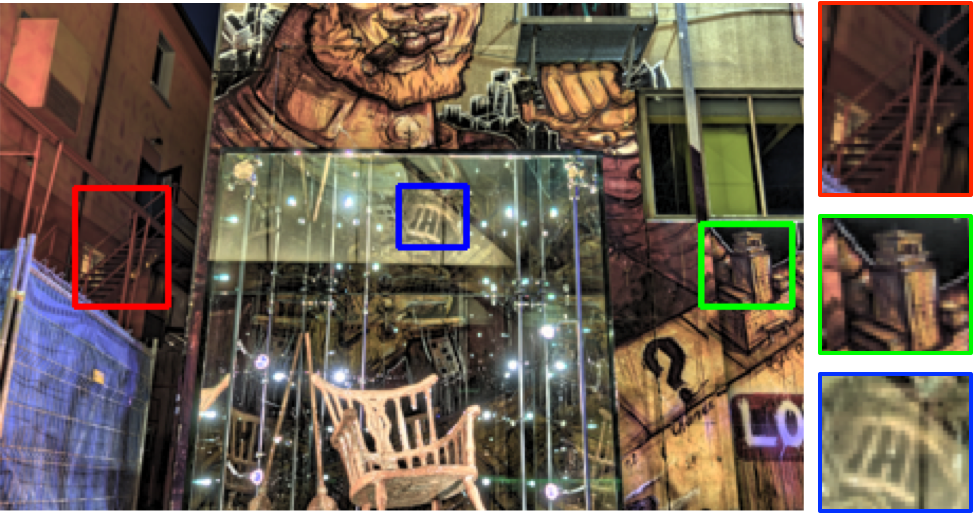
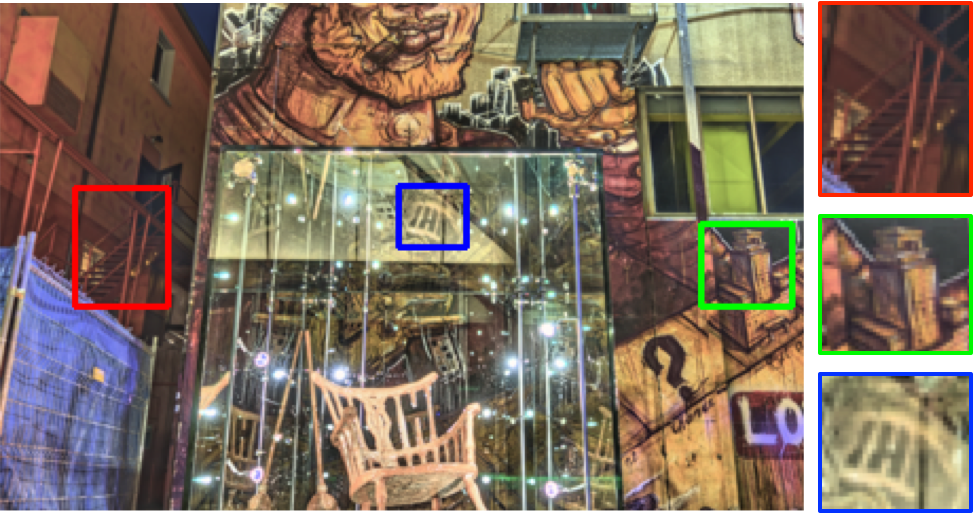
Fig. 4 shows the tone mapping results of the “Night Building” HDR image. The image by Kim18 [12] exhibits reduced global contrast due to the extreme dynamic range of the scene. Liang18 [16] succeeds in improving the details of the vitrine and the background, whose contrast is further improved by our method. With a substantially lower computational cost, our result closely matches that of NLPD-Opt [20].
| TMO | TMQI | NLPD | Time | ||
|---|---|---|---|---|---|
| Drago03 | 0.887 | 0.903 | 0.467 | 0.240 | 0.21 |
| Reinhard02 | 0.875 | 0.888 | 0.420 | 0.230 | 0.24 |
| Kim08 | 0.893 | 0.912 | 0.488 | 0.219 | 0.62 |
| WLS | 0.906 | 0.898 | 0.613 | 0.212 | 3.25 |
| LLF | 0.913 | 0.918 | 0.622 | 0.197 | 356.81 |
| Bruce14 | 0.852 | 0.831 | 0.384 | 0.320 | 9.14 |
| GR | 0.866 | 0.876 | 0.393 | 0.231 | 12.56 |
| NLPD-Opt | 0.908 | 0.911 | 0.558 | 0.168 | 160.40 |
| Liang18 | 0.910 | 0.892 | 0.611 | 0.219 | 1.61 |
| Ours | 0.925 | 0.906 | 0.667 | 0.175 | 1.44 |


IV-B Quantitative Comparison
We adopt two objective metrics for quantitative performance evaluation: TMQI [18] and NLPD [20]. TMQI is a variant of the SSIM index [26] for comparing images of different dynamic ranges. It combines structural fidelity (denoted by ) and statistical naturalness (denoted by ) measurements to evaluate the visual quality of a tone-mapped image using the corresponding HDR image as reference. A larger TMQI or a smaller NLPD value indicates better perceptual quality. Table II shows the results, from which we find that local operators generally outperform global operators in terms of TMQI. This is not surprising because TMQI is biased towards comparing local structure similarity, which is the design focus of local TMOs. This result is less obvious in terms of NLPD. As expected, NLPD-Opt achieves the best NLPD performance, followed by the proposed TMO and LLF. It is interesting to see that although our method is guided by NLPD, it achieves the best performance measured by TMQI. This provides strong justifications for our architectural design.
We test the running time of our method with existing TMOs on a computer with a 4.4GHz CPU and 64G RAM. The proposed TMO is implemented using PyTorch, while all competing methods are based on MATLAB111https://github.com/banterle/HDR_Toolbox implemented by Banterle et al. [27]. From Table II, we observe that our method is the fastest local TMO, which is attributed to the manually optimized network architecture with only parameters. Furthermore, when an NVIDIA GTX 2080Ti GPU is enabled, our method runs the fastest among all methods ( seconds).
IV-C Ablation Analysis
We conduct ablation experiments to single out the contribution of the normalized Laplace decomposition and the perceptual optimization of the proposed TMO. We first analyze the effect of the input pyramid level on final visual quality. Note that one level corresponds to directly feeding the raw HDR image into a single network for tone mapping. As shown in Fig. 5, more levels lead to improved detail reproduction at the cost of increased computational complexity. The default five-level pyramid keeps a good balance between visual quality and computational speed. We then switch NLPD [20] to three other objective functions: mean absolute error (MAE), SSIM [26], and TMQI [18], while fixing the network architecture. Fig. 6 shows the optimization results, which are optimal under their respective objectives. As can be seen, NLPD-optimized network achieves the best visual result.
V Conclusion
We have introduced a perceptually optimized TMO based on light-weight DNNs. We find that the optimized method matches or exceeds the state-of-the-art across a variety of HDR natural scenes, which is verified by another perceptual quality metric, TMQI.
As with all biologically-inspired TMOs, our method requires specifying the maximum luminance value during training and testing. Note that directly optimizing NLPD would lead to the trivial solution of , creating a completely black appearance. A statistical naturalness measure (e.g., implemented using a no-reference image quality model) may be added to help the optimization get rid of such bad local minima.
In our experiments, we assume a fixed display constraint with a minimum luminance of cd/m2 and a maximum luminance of cd/m2. In the future, we will take steps to incorporate various display constraints into the proposed perceptual optimization framework.
References
- [1] E. Reinhard, W. Heidrich, P. Debevec, S. Pattanaik, G. Ward, and K. Myszkowski, High Dynamic Range Imaging: Acquisition, Display, and Image-Based Lighting. Morgan Kaufmann, 2010.
- [2] E. Reinhard, M. Stark, P. Shirley, and J. Ferwerda, “Photographic tone reproduction for digital images,” ACM Transaction on Graphics, vol. 21, no. 3, pp. 267–276, 2002.
- [3] F. Durand and J. Dorsey, “Fast bilateral filtering for the display of high-dynamic-range images,” ACM SIGGRAPH Computer Graphics, vol. 21, no. 3, pp. 257–266, 2002.
- [4] Y. Li, L. Sharan, and E. H. Adelson, “Compressing and companding high dynamic range images with subband architectures,” ACM Transaction on Graphics, vol. 24, no. 3, pp. 836–844, 2005.
- [5] L. Meylan and S. Susstrunk, “High dynamic range image rendering with a retinex-based adaptive filter,” IEEE Transactions on Image Processing, vol. 15, no. 9, pp. 2820–2830, 2006.
- [6] Z. Farbman, R. Fattal, D. Lischinski, and R. Szeliski, “Edge-preserving decompositions for multi-scale tone and detail manipulation,” ACM Transaction on Graphics, vol. 27, no. 3, pp. 67:1–67:10, 2008.
- [7] G. J. Ward, “The RADIANCE lighting simulation and rendering system,” in Computer Graphics and Interactive Techniques, 1994, pp. 459–472.
- [8] G. W. Larson, H. Rushmeier, and C. Piatko, “A visibility matching tone reproduction operator for high dynamic range scenes,” IEEE Transactions on Visualization and Computer Graphics, vol. 3, no. 4, pp. 291–306, 1997.
- [9] J. Tumblin and H. Rushmeier, “Tone reproduction for realistic images,” IEEE Computer Graphics and Applications, vol. 13, no. 6, pp. 42–48, 1993.
- [10] F. Drago, K. Myszkowski, T. Annen, and N. Chiba, “Adaptive logarithmic mapping for displaying high contrast scenes,” Computer Graphics Forum, vol. 22, no. 3, pp. 419–426, 2003.
- [11] E. Reinhard and K. Devlin, “Dynamic range reduction inspired by photoreceptor physiology,” IEEE Transactions on Visualization and Computer Graphics, vol. 11, no. 1, pp. 13–24, 2005.
- [12] M. H. Kim and J. Kautz, “Consistent tone reproduction,” in International Conference on Computer Graphics and Imaging, 2008, pp. 152–159.
- [13] S. Paris, S. W. Hasinoff, and J. Kautz, “Local Laplacian filters: Edge-aware image processing with a Laplacian pyramid.” ACM Transaction on Graphics, vol. 30, no. 4, pp. 68:1–68:12, 2011.
- [14] N. D. Bruce, “ExpoBlend: Information preserving exposure blending based on normalized log-domain entropy,” Computers & Graphics, vol. 39, pp. 12–23, 2014.
- [15] T. Shibata, M. Tanaka, and M. Okutomi, “Gradient-domain image reconstruction framework with intensity-range and base-structure constraints,” in IEEE Conference on Computer Vison and Pattern Recognition, 2016, pp. 2745–2753.
- [16] Z. Liang, J. Xu, D. Zhang, Z. Cao, and L. Zhang, “A hybrid - layer decomposition model for tone mapping,” in IEEE Conference on Computer Vison and Pattern Recognition, 2018, pp. 4758–4766.
- [17] H. Yeganeh and Z. Wang, “High dynamic range image tone mapping by maximizing a structural fidelity measure,” in IEEE International Conference on Acoustics, Speech, and Signal Processing, 2013, pp. 1879–1883.
- [18] ——, “Objective quality assessment of tone-mapped images,” IEEE Transactions on Image Processing, vol. 22, no. 2, pp. 657–667, 2012.
- [19] K. Ma, H. Yeganeh, K. Zeng, and Z. Wang, “High dynamic range image compression by optimizing tone mapped image quality index,” IEEE Transactions on Image Processing, vol. 24, no. 10, pp. 3086–3097, 2015.
- [20] V. Laparra, A. Berardino, J. Ballé, and E. P. Simoncelli, “Perceptually optimized image rendering,” Journal of the Optical Society of America A, vol. 34, no. 9, pp. 1511–1525, 2017.
- [21] P. Burt and E. Adelson, “The Laplacian pyramid as a compact image code,” IEEE Transactions on Communications, vol. 31, no. 4, pp. 532–540, 1983.
- [22] F. Yu and V. Koltun, “Multi-scale context aggregation by dilated convolutions,” in International Conference on Learning Representations, 2016, pp. 1–13.
- [23] Q. Chen, J. Xu, and V. Koltun, “Fast image processing with fully-convolutional networks,” in IEEE International Conference on Computer Vision, 2017, pp. 2497–2506.
- [24] S. Mohan, Z. Kadkhodaie, E. P. Simoncelli, and C. Fernandez-Granda, “Robust and interpretable blind image denoising via bias-free convolutional neural networks,” in International Conference on Learning Representations, 2020, pp. 1–10.
- [25] D. P. Kingma and J. Ba, “Adam: A method for stochastic optimization,” CoRR, vol. abs/1412.6980, 2014.
- [26] Z. Wang, A. C. Bovik, H. R. Sheikh, and E. P. Simoncelli, “Image quality assessment: From error visibility to structural similarity,” IEEE Transactions on Image Processing, vol. 13, no. 4, pp. 600–612, 2004.
- [27] F. Banterle, A. Artusi, K. Debattista, and A. Chalmers, Advanced High Dynamic Range Imaging (2nd Edition). Natick, MA, USA: AK Peters (CRC Press), 2017.
