Scintillation light increase of carbontetrafluoride gas at low temperature
Abstract
Scintillation detector is widely used for the particle detection in the field of particle physics. Particle detectors containing fluorine-19 () are known to have advantages for Weakly Interacting Massive Particles (WIMPs) dark matter search, especially for spin-dependent interactions with WIMPs due to its spin structure. In this study, the scintillation properties of carbontetrafluoride () gas at low temperature was evaluated because its temperature dependence of light yield has not been measured. We evaluated the light yield by cooling the gas from room temperature (300 K) to 263 K. As a result, the light yield of was found to increase by and the energy resolution was also found to improve at low temperature.
1 Introduction
Scintillation detectors have been one of the most widely-used instruments for particle detection. Since large detectors can be built at a relatively low cost, they have been used in a wide range of applications for rare-event-search experiments, such as dark matter searches [1, 2, 3], neutrinoless double beta decay searches [4, 5], and studies of neutrino interactions [6, 7]. A high light yield is one of the most important properties of these scintillation detectors to realize a low threshold and good energy resolution. The light yield of the scintillators is known to be temperature dependent in addition to their inherent light production. Three main mechanisms, (A) the population of occupied excited levels of electrons, (B) temperature quenching, and (C) capture of excited electrons in traps, are known to cause the temperature dependence. (A) is known to provide a light yield maximum at some temperatures. (B) gives a monotonic light yield increase with the temperature decrease, while (C) gives monotonic light yield decrease with the temperature decrease. As a result, there is no comprehensive knowledge of how to anticipate the precise temperature dependency of each scintillator, and each one must be evaluated separately.
Particle detectors containing fluorine-19 () are known to have advantages for Weakly Interacting Massive Particles (WIMPs) dark matter search [8] as well as for (solar and supernova) neutrino detection [9, 10]. In particular, the spin structure of the nucleus enhances the signal from spin-dependent (SD) interactions with dark matter. The PICO-60 experiment reported the world-best limit of for WIMPs with a superheated droplet detector (SDD) filled with [11]. While leading experiments can potentially discover WIMPs at any time, it should be noted that SDD is a threshold-type detector, which means the energy spectrum cannot be obtained from one measurement. Since the energy spectrum is thought to be one of the most important pieces of information for the discovery and further studies of WIMPs, it is well-justified to develop spectroscopy detectors that contain . This type of “ spectroscopy detector” can be realized in the forms of gas time projection chambers (TPC) [12, 13], crystal scintillators [14, 15], and bolometers [16, 17]. Among these possibilities, we focused on the carbontetrafluoride () gaseous scintillator mainly because of the purification feasibility. Large mass detectors can be realized once is confirmed to be used as a practical scintillator in the liquid-state in terms of the intrinsic light yield and the self-absorption, which is a future important work of ours. The properties of gas scintillation light, such as emission spectra [18, 19, 20, 21, 22, 23, 24], and decay time [25, 26], have been investigated for several decades. The temperature dependence of its scintillation light yield has not been investigated yet, since TPC detectors with gas are ordinarily operated at the room temperature. For this purpose, we evaluated the scintillation properties of gas at a low temperature and the results are reported in this paper.
This paper consists of four sections, including the Introduction. In Sec. 2, we describe the experimental setup to evaluate the temperature dependence of scintillation light from gas and briefly explain the analysis method. In Sec. 3, we present the experimental results and discussion. The study is concluded in Sec. 4.
2 Measurements
2.1 Setup
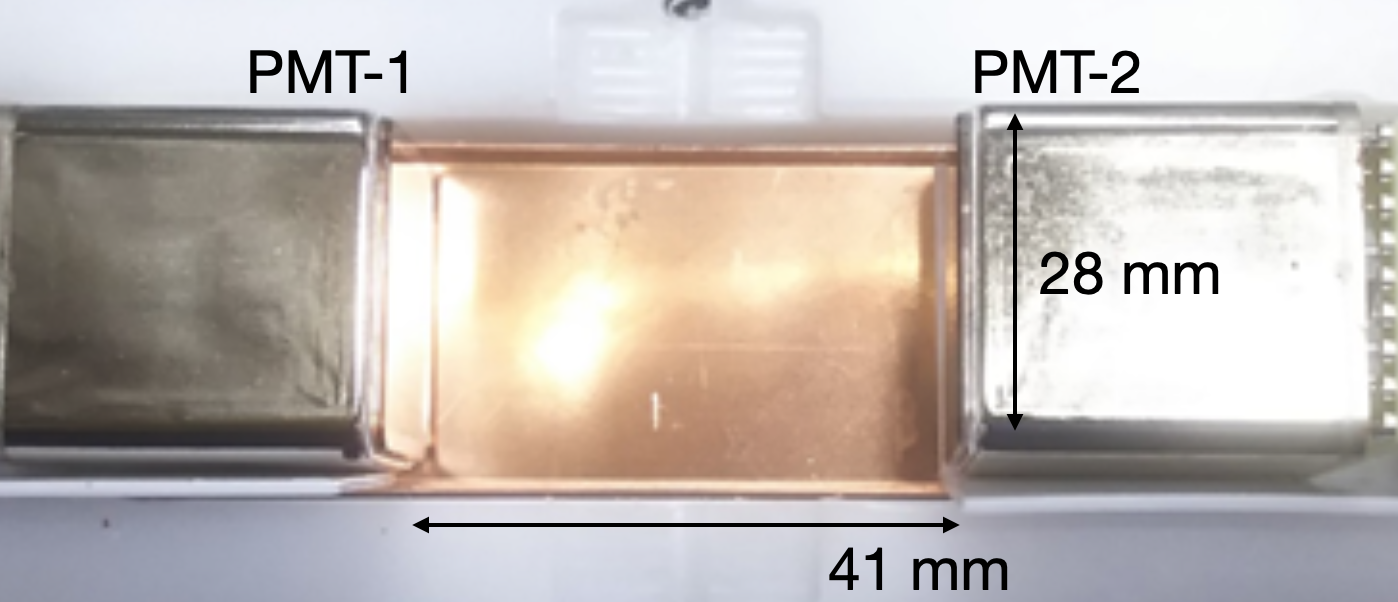
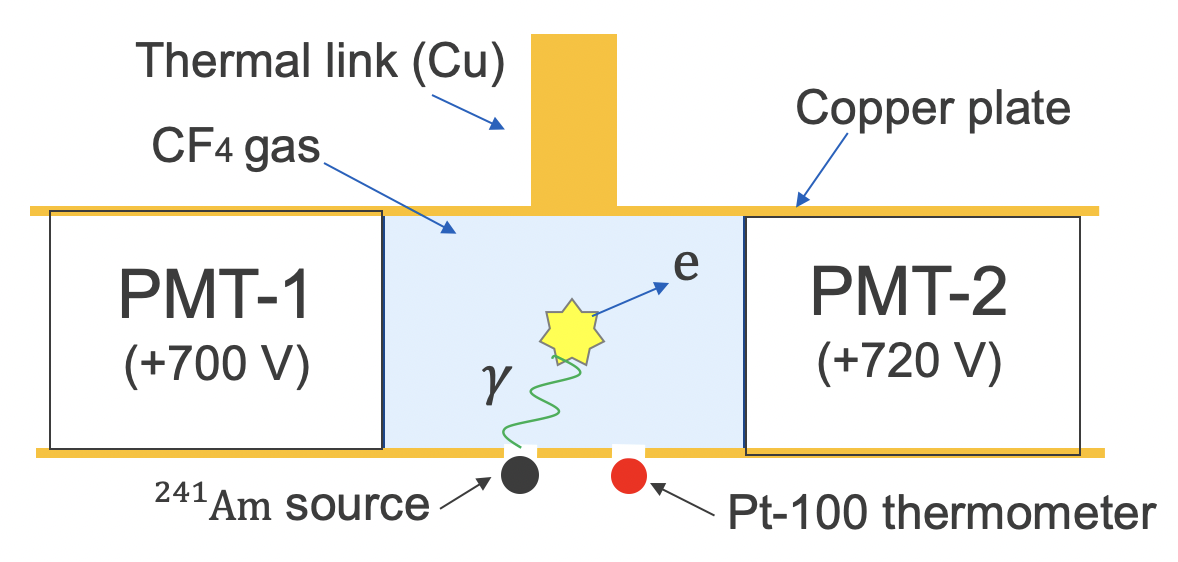
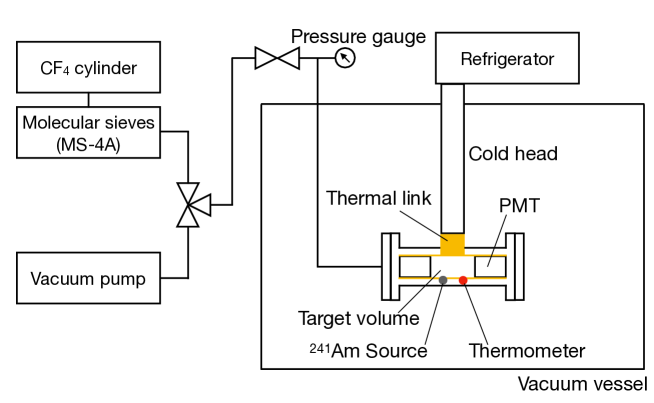
The detector used for this work was constructed at Kobe University. A photograph and a conceptional image are shown in Figure 1. The target volume of is viewed by two photomultiplier tubes (PMTs; PMT-1 and PMT-2) from two sides. The other four faces are surrounded by copper plates of mm thickness. To preserve the thermal contact between the target gas and the copper plates as high as possible, no extra material to improve reflection is put inside the copper. An source ( Bq) is placed on the external side of one of the copper plates, which has a small hole to let -rays ( keV) enter into the target volume. The temperature and pressure of the gas were measured by a Pt–100 thermometer (P0K1.232.6W.B.007, IST INNOVATIVE SENSOR TECHNOLOGY) and a pressure gauge (MPS–R33RC–NGAT, Myotoku), respectively. PMT R8520-406 produced by Hamamatsu K.K. was selected because it was demonstrated to work at a cold temperature of [27]. The PMT-1 and PMT-2 were biased at V and V, respectively, to function at comparable gains. The waveforms of PMTs’ signals were inverted with a signal transformer and recorded by a DRS4 Evaluation board [28]. The DRS4 Evaluation board recorded the waveforms with a 14-bit precision at 1 GHz sampling for a range from mV to mV. The board has a 50 termination. The trigger was issued by a coincidence of the two PMTs with a threshold of mV. Figure 2 shows the whole experimental equipment. The detector was set in a stainless cylindrical container with an inner diameter of 60 mm. The stainless container had ICF 144 flanges on both ends and was filled with CF4 gas for the measurement. It was set in a vacuum vessel for thermal insulation. The target volume was filled with gas (purity grade 5N, ) filtered with 4A-type molecular sieves (MS-4A). A refrigerator, PDC08 supplied by Ulvac Cryogenics Inc. ( W capacity), was connected to the copper plate via a copper thermal link.
2.2 Measurement
The measurement was carried out as one heat cycle starting at the room temperature, cooling down to a low temperature, and then warming-up to the room temperature. The scintillation signal was continuously measured throughout the heat cycle at various temperatures. First, the target volume was evacuated down to Pa and then filled with gas at room temperature. Soon after the gas pressure reached Pa, the detector valve was closed and the bias voltages were applied to the PMTs. The data acquisition was started at this timing, which is defined as the origin of the experimental time ().
| Period | Hours since t0 | Description |
|---|---|---|
| A | – | Room temperature (stable) |
| B | – | Cooling |
| C | – | Cold (stable) |
| D | – | Warming |
| E | – | Room temperature (stable) |
The detector temperature and pressure during the measurement are shown in the middle and bottom plots of Figure 3.
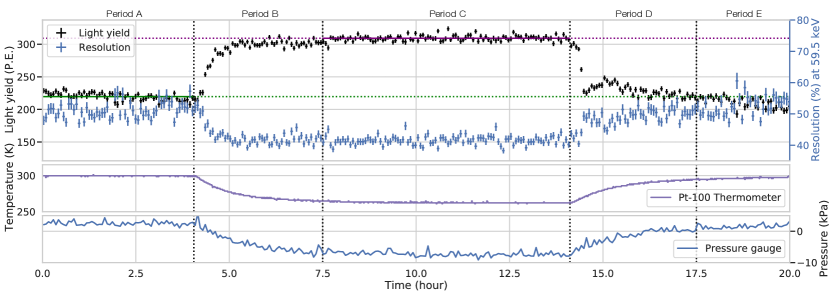
Five “Periods” are defined during the measurement to describe the different conditions as summarized in Table 1. The data was collected at room temperature for four hours as a reference and to evaluate the stability of the measurement (Period A). We then switched on the refrigerator to start cooling the gas, and data was collected throughout this time (Period B). Data was collected at a cold temperature of K when the instruments attained a steady temperature and gas pressure at which period the thermal uniformity of the gas in the target volume can be enough assumed (Period C). After about seven hours of data taking at the cold temperature, the refrigerator was turned off. A heat leak increased the temperature of the gas (Period D). At the end, the detector returned to the room temperature and the data was taken for another two hours (Period E).
The stability of the PMT gains was monitored throughout the measurement by observing single photoelectron (SPE) dark signals. Figure 4 shows a typical pulse recorded in Period A. A fast (20 ns of full width) pulse of scintillation light which represents the ’s short decay time is observed. This figure shows an average pulse after excluding saturating pulses which were particles from the source. In this experiment, the rate of the cosmic muon is 1/100 of the signal, and the typical deposit energy is as small as 20 keV, which is negligible. SPE pulses from accidental dark signals were searched for before the triggered pulse timing with a software threshold of mV. A typical SPE pulse is shown in the inset of Figure 4. The charge for each pulse was calculated by integrating the pulse for ns around the pulse peak. Figure 5 shows the charge distribution of SPE pulses.
The peaks are fitted with Gaussian functions and the mean values are used to calculate the charges of the SPE pulses, taking account of the termination resistor (50 ). Calculated SPE charges are defined as and [C] for PMT-1 and PMT-2, respectively. Figure 6 shows the time dependence of gains calculated as , where is the elementary charge.
It demonstrates the stability of the PMT gains throughout the measurement. The fluctuations in PMT gains were found to be less than . The non-linearity of PMTs and electronics were evaluated individually with LED calibration. It was confirmed that the dynamic range was much larger than the light increase. The effect of non-linearity is negligible to the considered gain fluctuations.
3 Results
3.1 Temperature dependence of light output
The number of photoelectrons for the observed event is calculated from the waveforms of two PMTs. The baseline calculated from the initial ns of the waveform were subtracted from the waveform and the charge was calculated by integrating the waveform taking account of the termination resistor. Obtained charges from PMT-1 and PMT-2 are referred to as [C] and [C], respectively. The total numbers of observed photoelectrons were obtained as, . Figure 7 shows a typical spectrum of by the 59.5 keV -rays in stable Periods (A and C).
The shift of the peak position at different temperatures is clearly observed. It demonstrates the high light yield at the cold temperature. The peaks are fitted with Gaussian function and the means of the functions for Periods A and C functions are 211.9 P.E. and 305.0 P.E., respectively.
Top plot of Figure 3 clearly shows the increase of light yield of CF4 at cold temperatures.
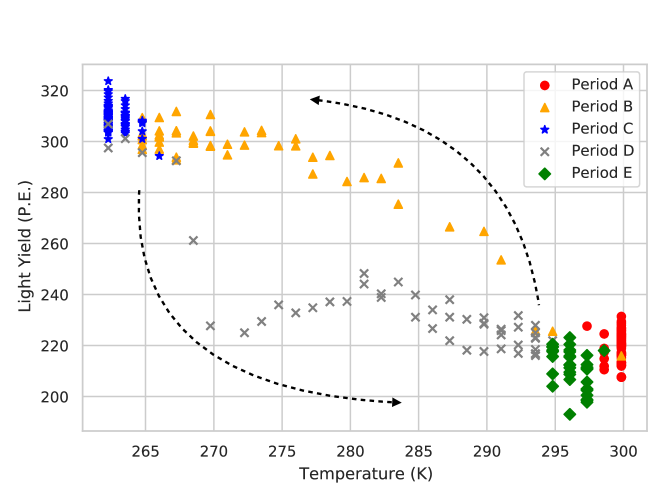
Table 2 summarizes the light yields, resolutions for keV -ray, and gas temperatures during Periods A, C, and E.
| Period | Light yield [P.E.] | Relative ratio to Period A | Resolution [%()] | Gas temperature [K] |
|---|---|---|---|---|
| A | 51.1 | |||
| C | 41.6 | |||
| E | 52.4 |
In Period A, the light yield for keV -ray is measured to be with an energy resolution of (). The uncertainty is calculated by quadratically summing the statistical uncertainty and the systematic uncertainty described in Section 3.2. In Period C, the observed light yield increased to The ratio and difference between these two results are and , respectively. The energy resolution improved from to . In Period E, the light yield was measured to be The ratio and difference between Period A and E are and , respectively. The light yield in Period E is consistent with the one in Period A within uncertainties. Hence, this reproducibility of light yield demonstrates that the experimental data were properly obtained.
Figure 8 shows light yield as a function of the detector temperature. A hysteresis was observed between Periods B and D. This behavior indicates a delay in the thermal conduction of the gas from the copper plate. There is another possibility that the light yield may have decreased due to a small amount of out-gas around the melting point even after water removal by molecular sieves. For these reasons, we focus on the stable Periods, A, C, and E, for the discussion of the light yield.
3.2 Systematic uncertainties
The observed number of photoelectrons is represented as
| (3.1) |
where is the number of originally generated photons, is the effective solid angle of the PMTs considering reflections, is the PMT gain, and is the quantum efficiency of the PMT. Table 3 summarizes the systematic uncertainties for the .
| Item | Systematic uncertainty [] |
|---|---|
| PMT gain | |
| PMT Q.E. | |
| Reproducibility | |
| Total |
In this study, the is invariant during the measurement while the other three parameters affect . The uncertainty of the PMT gain, , is evaluated as of the standard deviation of the distribution of the PMT gain shown in Figure 6. The uncertainty of was reported in the previous study to be at maximum [29]. The reproducibility is estimated at from the difference between the light yields in two room temperature Periods, A and E.
These uncertainties can be judged to be independent from each other, thus the total systematic uncertainty is evaluated to be . This systematic uncertainty and measured statistical uncertainty are both small relative to the observed increases in , and we conclude that a significant increase in , or the light yield, has been observed at cold temperatures.
4 Conclusion and future prospects
A temperature dependence of a gaseous scintillator, CF4, was studied at K and K. The light yield of CF4 was found to increase by and the energy resolution enhanced when the gas is cooled to K. As for the future prospects, this high light yield at cold temperatures enables detectors using gas to improve their energy resolution and to lower their threshold.
Acknowledgment
This work was supported by KAKENHI Grant-in-Aids (18K18768, 21K18628, 26104005, 19H05806, 19J20418, 18H05536, and 21K13942). This work is also partially supported by the joint research program of the Institute for Cosmic Ray Research (ICRR), the University of Tokyo.
References
- [1] XENON collaboration, E. Aprile et al., Dark Matter Search Results from a One Ton-Year Exposure of XENON1T, Phys. Rev. Lett. 121 (2018) 111302, [1805.12562].
- [2] XMASS collaboration, K. Abe et al., A direct dark matter search in XMASS-I, Phys. Lett. B 789 (2019) 45–53, [1804.02180].
- [3] DEAP collaboration, R. Ajaj et al., Search for dark matter with a 231-day exposure of liquid argon using DEAP-3600 at SNOLAB, Phys. Rev. D 100 (2019) 022004, [1902.04048].
- [4] KamLAND-Zen collaboration, A. Gando et al., Search for Majorana Neutrinos near the Inverted Mass Hierarchy Region with KamLAND-Zen, Phys. Rev. Lett. 117 (2016) 082503, [1605.02889].
- [5] CANDLES collaboration, S. Ajimura et al., Low background measurement in CANDLES-III for studying the neutrino-less double beta decay of 48Ca, Phys. Rev. D 103 (2021) 092008, [2008.09288].
- [6] BOREXINO collaboration, M. Agostini et al., Experimental evidence of neutrinos produced in the CNO fusion cycle in the Sun, Nature 587 (2020) 577–582, [2006.15115].
- [7] JUNO collaboration, F. An et al., Neutrino Physics with JUNO, J. Phys. G 43 (2016) 030401, [1507.05613].
- [8] J. R. Ellis and R. A. Flores, Elastic supersymmetric relic - nucleus scattering revisited, Phys. Lett. B 263 (1991) 259–266.
- [9] I. R. Barabanov, V. I. Cherehovsky, G. V. Domogatsky, V. I. Gurentsov, A. B. Gurski, A. V. Kopylov et al., Fluorine scintillator neutrino detector, Nucl. Phys. B Proc. Suppl. 35 (1994) 461–463.
- [10] MUNU collaboration, C. Amsler et al., The MUNU experiment, general description, Nucl. Instrum. Meth. A 396 (1997) 115–129.
- [11] PICO collaboration, C. Amole et al., Dark Matter Search Results from the Complete Exposure of the PICO-60 C3F8 Bubble Chamber, Phys. Rev. D 100 (2019) 022001, [1902.04031].
- [12] T. Tanimori, H. Kubo, K. Miuchi, T. Nagayoshi, R. Orito, A. Takada et al., Detecting the wimp-wind via spin-dependent interactions, Phys. Lett. B 578 (2004) 241–246, [astro-ph/0310638].
- [13] DRIFT collaboration, J. B. R. Battat et al., First background-free limit from a directional dark matter experiment: results from a fully fiducialised DRIFT detector, Phys. Dark Univ. 9-10 (2015) 1–7, [1410.7821].
- [14] Y. Shimizu, M. Minowa, W. Suganuma and Y. Inoue, Dark matter search experiment with CaF2(Eu) scintillator at Kamioka observatory, Phys. Lett. B 633 (2006) 195–200, [astro-ph/0510390].
- [15] I. Ogawa et al., Search for neutrino-less double beta decay of 48Ca by CaF2 scintillator, Nucl. Phys. A 730 (2004) 215–223.
- [16] K. Miuchi, M. Minowa, A. Takeda, H. Sekiya, Y. Shimizu, Y. Inoue et al., First results from dark matter search experiment with LiF bolometer at Kamioka underground laboratory, Astropart. Phys. 19 (2003) 135–144, [astro-ph/0204411].
- [17] A. Takeda, M. Minowa, K. Miuchi, H. Sekiya, Y. Shimizu, Y. Inoue et al., Limits on the WIMP - nucleon coupling coefficients from dark matter search experiment with NaF bolometer, Phys. Lett. B 572 (2003) 145–151, [astro-ph/0306365].
- [18] H. van Sprang, H. Brongersma and F. de Heer, Electron impact induced light emission from CF4, CF3H, CF3Cl, CF2Cl2 and CFCl3, Chem. Phys. 35 (1978) 51–61.
- [19] A. Pansky, A. Breskin, A. Buzulutskov, R. Chechik, V. Elkind and J. Va’vra, The Scintillation of CF4 and its relevance to detection science, Nucl. Instrum. Meth. A 354 (1995) 262–269.
- [20] C. Broggini, Detection of the scintillation light induced by particles in pure CF4, Nucl. Instrum. Meth. A 361 (1995) 543–547.
- [21] L. C. Lee, X. Wang and M. Suto, Fluorescence from extreme ultraviolet photoexcitation of CF4, J. Chem. Phys. 85 (1986) 6294–6300.
- [22] L. G. Christophorou and J. K. Olthoff, Electron Interactions With Plasma Processing Gases: An Update for CF4, CHF3, C2F6, and C3F8, J. Phys. Chem. Ref. Data 28 (1999) 967–982.
- [23] W. R. Harshbarger and E. N. Lassettre, On the electron impact spectra of CH4 and CF4, J. Chem. Phys. 58 (1973) 1505–1513.
- [24] A. Morozov, L. M. S. Margato, M. M. F. R. Fraga, L. Pereira and F. A. F. Fraga, Secondary scintillation in CF4: emission spectra and photon yields for MSGC and GEM, JINST 7 (2012) P02008.
- [25] L. M. S. Margato, A. Morozov, M. M. F. R. Fraga, L. Pereira and F. A. F. Fraga, Effective decay time of CF4 secondary scintillation, JINST 8 (2013) P07008.
- [26] D. M. Smith, R. P. Tuckett, K. R. Yoxall, K. Codling, P. A. Hatherly, J. F. M. Aarts et al., Use of threshold electron and fluorescence coincidence techniques to probe the decay dynamics of the valence states of CF, SiF, SiCl, and GeCl, J. Chem. Phys. 101 (1994) 10559–10575.
- [27] H. P. K.K. R8520-406 Datasheet, 2021.
- [28] S. Ritt, R. Dinapoli and U. Hartmann, Application of the DRS chip for fast waveform digitizing, Nucl. Instrum. Meth. A 623 (2010) 486–488.
- [29] E. Aprile et al., Measurement of the Quantum Efficiency of Hamamatsu R8520 Photomultipliers at Liquid Xenon Temperature, JINST 7 (2012) P10005, [1207.5432].