In-body Bionanosensor Localization for Anomaly Detection via Inertial Positioning and THz Backscattering Communication
Abstract
Nanotechnology is enabling the development of a new generation of devices which are able to sense, process and communicate, while being in the scale of tens to hundreds of cubic nanometers. Such small, imperceptible devices enhance not only current applications but enable entirely new paradigms especially for in-body environments. This paper introduces a localization and tracking concept for bionanosensors floating in the human bloodstream to detect anomalies in the body. Besides the nanoscale sensors, the proposed system also comprises macroscale anchor nodes attached to the skin of the monitored person. To realize autonomous localization and resource-efficient wireless communication between sensors and anchors, we propose to exploit inertial positioning and sub-terahertz backscattering. The proposed system is a first step towards early disease detection as it aims at localizing body regions which show anomalies. Simulations are conducted to enable a systematical evaluation on the feasibility of the approach.
I Introduction
Novel nanomaterials such as graphene and its derivatives have made it possible to fabricate tiny sensors, i.e., bionanosensors (BNSs), which are capable of detecting the smallest changes in physical variables, such as pressure, vibrations, temperature and concentrations in chemical and biological molecules [1]. BNSs enable to detect and sense molecules which are too small to be detected otherwise. One reason for late diagnosis of diseases such as cancer, is that current sensing technology can only detect biomarker molecules once they are manifested in the organs and have a sufficiently high molecule concentration. BNSs are however capable of detecting much lower concentrations and thus enable to detect diseases at a much earlier development stage [2, 3]. As an example, glucose molecules and cancer cells have sizes in the range of a few nano- to micrometers. The only possibility to detect such small molecules is to have sensors with extraordinary high sensitivity while being in the size of the biomolecules themselves. BNSs are already in the development and will revolutionize in-body applications in the near future [4, 5].
To be able to detect diseased cells in the human body, hundreds of BNSs are foreseen to float through the cardiovascular system in order to check for anomalies. Whenever an anomaly occurs, the sensors should detect and report it to the outside world. A major concern in this field is thus to localize the body regions at which anomalies have been detected. Realizing such a localization system is very challenging due to the highly dynamic environment, the extremely constrained resources of the sensors and the difficulty of wireless communication through human tissue.
In this paper, we propose a system architecture to localize anomalies in the body detected by BNS measurements. Such a system is intended to be used for in-body health monitoring applications. Figure 1 depicts an overview of the foreseen system which comprises anchor nodes and BNSs. Anchor nodes are of macroscale size and are attached to the skin of the monitored person while the sensors are of nanoscale size and float through the bloodstream. Due to the high mobility and limited communication range of the sensors, it is infeasible for the anchors to continuously locate and update the sensors. Hence, we require the sensors to track their location themselves and inform the anchors about the location of detected anomalies. To do so, we propose to equip the BNSs with Inertial Measurement Units (IMUs) composed of nanoscale accelerometers and gyroscopes. Having access to IMU readings, sensors are able to exploit inertial positioning and can thus add location information to their actual sensor readings (i.e., temperature, vibration, molecule concentration).
Furthermore, BNSs need to communicate their findings to the anchors in order to make them accessible to the operator, i.e., the physician. Graphene-based nano-antennas have been shown to efficiently operate in the sub-terahertz band (0.1-10 THz) [6, 7], which in turn enables short distance communication through human tissue [8]. To ensure resource-efficiency, we propose to rely on THz backscattering communication between sensors and anchors. The main advantage of this technology is, that the passive communication partners (i.e., the BNSs) do not need to actively generate radio-frequency (RF) signals but harvest energy from the signals of the active communication partners (i.e., the anchors) instead.
Up until now, there has been very little research on the localization of in-body BNSs. The main contributions of this paper are a novel, realistic system model for localization and tracking of in-body BNSs and a systematical evaluation of the proposed approach. As the localization performance relies on the placement of the anchors and on the THz backscattering communication, we provide two kinds of evaluation results: i) channel model, path loss and capacity of the THz backscattering communication channel in human tissue and ii) accuracy of the IMU based localization in the cardiovascular system.
The remainder of the paper is organized as follows. Section II introduces the related work in in-body localization, in THz backscattering localization and in localization based on inertial positioning. The building blocks of our proposed system including the BNSs, the anchor nodes and the wireless communication technology are explained in Section III. Section IV introduces our localization concept and Section V discusses the feasibility of the concept via evaluations. We conclude the paper and outline future work in Section VI.
II Related work
The problem of autonomously localizing wireless sensor nodes or mobile robots has been well studied in the past decades, resulting in a large variety of localization algorithms for various types of networks [9, 10]. Sensor network localization approaches often exploit signal strength measurements or hop counts of messages while mobile robot localization often relies on inertial positioning. In the related work, we specifically focus on the current state-of-the-art in in-body sensor localization and THz backscattering localization. Furthermore, we briefly discuss inertial positioning methods in mobile networks.
II-A In-body Localization
To the best of our knowledge, as well as according to [11], there are only very few attempts towards the localization of in-body BNSs operating in the THz band. Furthermore, all of them focus on localizing the sensors themselves rather than detected anomalies, which is realistically difficult to achieve due to their high mobility.
One approach was introduced by Tran-Dang et al. [12], who proposed two hop-counting based localization algorithms. The first technique exploits flooding in order to estimate distances between nanonodes from the number of message hops. To reduce the huge message overhead, the second technique proposed to establish clusters first. Only cluster heads communicate with each other to localize certain nodes. The simulation model assumed a square area with uniformly distributed nodes and communication ranges of providing thus very limited evaluation results for the in-body scenario.
Another method proposed a pulse-based distance accumulation (PBDA) localization algorithm for nanosensor networks which is used to estimate the distance between anchors and clustered nodes [13]. The simulated system model considered a 2D square area with randomly deployed nodes. First, nodes run a classification algorithm based on flooding which classifies all nodes into corner, border or center nodes. Afterwards, a clustering algorithm establishes clusters and identifies cluster heads. Finally, flooding packets are forwarded through cluster heads in order to calculate the distance between corner nodes based on hops. The algorithm adopted femtosecond-long pulse for terahertz band communication based on on-off keying (OOK) modulation. Similar to [12], the considered simulation model can barely evaluate an in-body scenario.
Shree et al. [14] introduced an approach in which they utilize the MUltiple SIgnal Classification (MUSIC) [15] algorithm in order to systematically study the Direction of Arrival (DOA) estimation for nanosensor networks. The study was done for different energy levels, distances, pulse shapes and frequencies. In the simulation studies, the authors considered the terahertz channel as standard air medium. Their investigations showed that the error can be reduced by selecting lower order and higher frequency pulses for transmission. A successful estimation of the angle of arrival could enable localization in nanosensor networks, however, sensors would need dedicated antenna arrays. Furthermore, making reliable DOA estimation is difficult in in-body scenarios where sensors are highly mobile, floating inside vessels while frequently changing their orientations.
In summary, none of the above mentioned localization approaches can be used to provide accurate localization results for the in-body environment. Furthermore, most of the simulations are rather general and do not consider the very specific energy and communication constraints of BNSs.
II-B THz Backscattering Localization
One promising direction towards obtaining accurate distance measurements, while at the same time maintaining low energy consumption, is to exploit backscattered signals [11]. Backscattering communication systems consist of two types of devices, a reader (i.e., an anchor) and a tag (i.e., a mobile node) [16]. The tag is the passive component of the system, harvesting energy from an incident RF wave radiated by the reader. Further, the tag modulates and reflects a fraction of the wave back to the reader [16]. Since tags harvest energy from incoming waves, they do not need active RF components while readers are equipped with such. A well known example for a technology which relies on backscattered signals is radio frequency identification (RFID). In order to modulate the received signal, tags change the antenna reflection properties by varying the impedance of the antenna according to the information they want to communicate. As the antenna load is varied, the reflection coefficients are changed and the reflected signal is modulated [17]. This process is known as backscatter modulation [18] and can achieve different modulation modes including binary pulse amplitude modulation (2-PAM), binary pulse position modulation (2-PPM) and On-Off keying modulation (OOK) [19]. As nanoscale transceivers can not generate carrier signals, they need to exploit carrier-less pulse-based communication schemes in any case [20, 14]. Up until now, there are several works which discuss pulse-based modulations schemes suitable for nanosensor networks, from which Time Spread On-Off Keying (TS-OOK) is the most frequently used [20, 21].
With their low-power and low heat-radiation wireless communication, backscattering tags perfectly suit the integration into BNSs to operate in in-body applications. So far, their feasibility and promising accuracy has only been demonstrated for localization problems on the macro-level [22, 23]. El-Absi et al. [22] exploited backscattered THz signals to extract the round-trip time-of-flight (RToF) between nodes and anchors to determine the distance between them. Multiple RToF readings from different anchors were used to estimate the location of the node via the linear least square algorithm. There are two main advantages of backscattering. First, the nodes do not need to actively generate RF signals, but only to modulate and reflect received ones. Second, there is no clock drift which could affect the distance estimates since the RToF is determined solely by the reader which is equipped with a high-accuracy clock [11]. However, the network in [22] was of static nature and thus does not fit an in-body scenario. The second approach [23] attempted to localize software-defined metamaterial (SDM) elements by utilizing THz backscattering communication for frequencies of GHz to THz. The localization relied on trilateration by exploiting distance estimates from RToF measurements between nanonodes and controllers. The authors demonstrated via simulations a sub-millimeter accuracy of the localization as well as a high availability and low energy consumption of the approach.
Although many next-generation networks are expected to exploit THz communication to provide accurate locations [24], research on localization algorithms for THz-based BNSs in the in-body environment is still lacking.
II-C Localization based on Inertial Positioning
Inertial positioning (or dead reckoning) refers to the process of estimating a node’s current position by using its previous position and an estimate about traveled distance and direction which are recorded by a built-in IMU. IMUs typically utilize a combination of accelerometers and gyroscopes to measure acceleration and rotation of the device they are integrated in. Doing so, they are able to determine the angular rate and the linear velocity, and thus the position of the device relative to a global reference system. The major advantage of inertial positioning is that it does not rely on external information enabling a fully autonomous navigation.
To achieve nanoscale sizes, all BNS components should be able to operate at nanoscale. A variety of nanoscale gyroscopes and accelerometers have already been developed in recent years [25, 26]. One example of a nanoscale gyroscope was presented by Song et al. [27]. The gyroscope has an atom-scale size and can provide a sensitivity in the level of rad s-1 Hz-1/2. Besides gyroscopes, graphene-based accelerometers have been presented as well. One example is the accelerometer proposed by Shi et al. [28] which features a size in the range of tens of m and a ultra high sensitivity of m/m for a range of g. In general, inertial positioning is very accurate over short periods with high update frequency. However, the accuracy is significantly affected by the accumulation of noise and drift errors from accelerometers and gyroscopes. Thus, IMU measurements are often fused with other positioning methods [29].
In the field of robotics, a variety of IMU-based localization systems have been developed to localize and track mobile robots during their missions [29, 30, 31]. Li et al. [30] presented for instance a deep learning approach to localize a mobile robot using a 2D laser and an IMU. For that purpose, a novel Recurrent Convolutional Neural Network (RCNN) architecture was exploited to fuse the laser and IMU data for pose estimation. Another method aiming at accurately locating mobile robots through sensor fusion was proposed by Marquez et al. [29]. The approach fuses acceleration data from the IMU and 2-D coordinates received from the Ultra-Wideband (UWB) anchors into a Kalman filter to estimate accurate locations. A further method for fusion-based localization was introduced by Malyavej et al. [31]. The authors proposed to localize mobile robots by exploiting sensor fusion of Received Signal Strength Indicator (RSSI) measurements from a WiFi network and IMU measurements. The proposed fusion is achieved via an extended Kalman filter (EKF).
In general, inertial positioning approaches are expected to be well suited for in-body BNS applications since they operate in a fully autonomous manner and do not require any external information. Naturally, built-in IMUs will add physical complexity to the architecture of BNSs. However, communication and computing complexity can be reduced by this type of self-localization, which eases the requirements on memory and processing unit.
III System model building blocks
Our proposed system comprises of two kinds of devices, the BNSs which float through the cardiovascular system and the anchor nodes which are attached to the skin. The BNSs are tiny sensing devices built with nanomaterials (e.g., graphene) which are injected into the human bloodstream in order to monitor certain health parameters [32, 33]. The anchors are larger in scale, more powerful, and they are intended to collect sensing and location information from the sensors as they float by. Figure 2 depicts an overview of our system model. We assume a simplified model of the skin layers including the epidermis and the dermis which in turn contains the blood vessels with the floating sensors.
III-A Anchor Nodes
Anchors are attached to the skin across the whole body of the human who is being monitored. The anchors are the active components of the backscattering communication system, and serve as basestations and gateways to enable access to the measurements of the BNSs. Anchors constantly transmit RF signals which are used by the sensors for the backscattering communication. Whenever a sensor is sufficiently close to an anchor and receives its RF signal, it harvests energy from the signal, modulates it to pack its data into the signal and reflects it back to the anchor.
Communication among anchors or between anchors and a sink node (i.e., computer) can be achieved via a standard networking technology such as IEEE or . Our localization concept foresees anchors to maintain tables in which they collect all the received information of the sensors. These tables are periodically sent to a sink computer, where they are merged in order to keep an updated view of the sensors and their measurements. Anchors are synchronized in time to be able to timestamp received packets, while sensors do not need any synchronization.
III-B Bionanosensors
Bionanosensors, i.e., BNSs, are nanoscale devices which are able to detect, (pre-)process and transfer sensed data. Thus, they comprise sensing, communication and processing unit. Depending on the physical parameter to be monitored, the sensing unit requires a certain type of sensor, e.g., pressure sensor [34], temperature sensor [35], mechanical sensor [36] or optical sensor [37]. Since the BNSs should provide sensor readings along with location information, they are further equipped with IMUs to measure velocity and rotation. Incorporating IMUs into the BNSs will allow for inertial positioning methods similar to those used in mobile robot applications (see Section II-C). As already mentioned, communication between BNSs and anchors relies on backscattering with the sensors being the passive communication partners. Thus, sensors do not need to be equipped with an active RF component. However, they need an energy harvester, a receiver and a modulator in order to exploit and modulate the received signal before reflecting it back to the anchor. Similar to standard sensors, BNSs also require a memory and a battery unit to be able to operate their local sensors.
III-C Wireless Communication
Currently, the material most commonly associated with nanoantennas is graphene, which is a flat monolayer of carbon atoms tightly packed into a 2D honey-comb lattice [6]. Graphene antennas efficiently operate at Terahertz band frequencies (0.1-10 THz) [6, 20]. With their small size of just tens of nanometers in width and a few micrometers in length, they can easily be integrated into future BNSs.
The maximum distance for successful communication between a sender and a receiver depends on the characteristics of the THz channel. The main issue in THz band communication is the very high path loss due to the molecular absorption loss [38, 39]. Molecular absorption loss is caused by the water molecules in the medium that are excited by the electromagnetic wave, which leads to the conversion of a part of the electromagnetic wave energy into kinetic energy. However, there are several works which investigated the path loss of THz signals in blood and tissue, showing that a communication in the range of a few millimeters is feasible [8, 40]. For the in-body scenario considered here, communication distances of a few millimeters are sufficient to establish connection between the anchors and BNSs.
IV Localization approach
As BNSs are envisioned to float with average velocities of cm/s in the bloodstream [41], keeping an updated view of their locations at any point in time is complex in terms of computation and communication costs. Rather than continuously tracking the highly dynamic sensors, we propose to record the location information (IMU readings) along the sensor measurements every time the sensor encounters an anomaly. This means, whenever the sensors relay their measurements to anchors, the locations of the anomalies will be transferred as well. This way, we are able to determine the location of the anomaly in the body. As sensors can exploit backscattering only within the vicinity of an anchor, anchors implicitly gather information about their locations via receiving their messages. Figure 3 depicts an overview of the localization system. Sensor is floating inside the blood vessels while the anchor nodes and are attached to the skin. Whenever the sensor passes by an anchor, it exploits the RF signal to transmit collected sensor readings along with the IMU measurements via backscattering communication. Each packet transmitted by a BNS includes the ID of the sensor and the actual sensor reading with a location stamp. Whenever a packet was transmitted to an anchor, the sensor resets its IMU to the initial state. The reset is done in order to reduce the accumulation error (i.e., the drift) of the IMU. The following subsections discuss the backscattering communication and the location stamping in detail.
IV-A Backscattering Communication
As already mentioned, a promising technique for low-power wireless communication is backscattering communication. In order to prove the feasibility of backscattering communication for in-body scenarios, we model the backscattering channel between anchors and BNSs and determine its capacity. The channel consists of a forward path (reader to tag) and a backward path (tag to reader). To be able to calculate the capacity of the complete channel, forward and backward link need to be taken into account. The backscattered power in dB received at the reader after the signal travelled through the forward and backward link can be expressed as [42]
| (1) |
where is the transmit power, is the total path loss of the signal and and are the gains of the transmitting and receiving antennas, respectively. The total path loss of the signal mainly depends on the spreading and the molecular absorption loss as the scattering loss can be neglected [43] and it is defined as
| (2) |
where is the molecular absorption loss, is the spreading loss, is the molecular absorption coefficient, is the distance and is the effective wavelength, which is defined as . and are the real and imaginary parts of the refractive index of the medium the wave is travelling through (tissue in our case). The molecular absorption coefficient depends on the effective wavelength and on the imaginary part of the refractive index and is defined as [8]
| (3) |
As backscattering reduces the power significantly, also channel capacity is affected. The channel capacity of the forward and the backscattered communication link can be expressed using the Shannon theorem and a flat power distribution as [39, 40]
| (4) |
where is the power spectral density of the signal, is sub-band width, is the total loss over the stacked tissue layers (obtained by Equation 2) and is the noise power spectral density. If the sub-band width is small enough, the channel appears as frequency-non selective and the signal power spectral density can be considered locally flat [39]. The noise spectral density can then be obtained as [44, 40]
| (5) |
where is the Boltzmann constant, is the noise temperature due to molecular absorption, is the reference temperature of K, is the frequency, is the distance, is the speed of light and is the imaginary part of the refractive index of the respective tissue.
IV-B Location Stamping
To be able to provide sensor readings with location stamps, BNSs rely on inertial positioning (see Section II-C). We propose to equip BNSs with IMUs including a nanoscale gyroscope and accelerometer to be able to measure rotation and velocity and thus get an idea of how far they have traveled within the body. As already discussed, the major drawback of inertial positioning is the accumulation of the error as it is a recursive process relying on faulty sensor readings. Thus, positions need to be refined (i.e., through sensor fusion) or the IMU needs to be reset whenever possible in order to minimize the error. Therefore, we propose that BNSs reset their IMU to the initial state whenever they have transmitted their readings to an anchor. Having a BNS communicating to an anchor infers that the sensor is in very close proximity to the anchor, which implicitly helps the sensor to understand its actual location enabling to refine the position calculated by the IMU. The communication between sensors and anchors allows the system thus to additionally keep track of the sensors’ positions in the body.
The true location of an anchor is and the location logged by the BNS passing by this anchor is , where , , , with , and being uniformly distributed errors within the bounds determined by the range of backscattering communication. Upon visiting an anchor and resetting its location, the BNS starts calculating its location using the built-in IMU. However, IMUs, especially the novel nanoscale IMUs, introduce measurement errors in all directions which are expressed for the accelerometer as
| (6) |
where is the bias and is random Gaussian noise. Similarly, the gyroscope introduces measurement errors in all three directions expressed as
| (7) |
where is the bias and is random Gaussian noise.
To calculate their current positions, BNSs combine accelerometer and gyroscope readings. Afterwards they utilize a Kalman filter to calculate their current position based on the previous one acquired at the last anchor node [45]. When a BNS senses an anomaly along its path, it records the location of the event to be able to report it to the next anchor.
Similar to anchor locations, the actual location of an anomaly is expressed . The anomaly location estimated by the BNS is expressed as , including the errors mentioned above.
V Evaluation
This section presents the evaluation results for our proposed localization approach. We first discuss the channel characteristics of in-body THz backscattering communication, followed by a discussion on sensor movement and localization accuracy.
V-A Communication
This section investigates the feasibility of THz backscattering communication between BNSs in the blood and anchors attached to the skin. To enable a realistic channel model, certain biological parameters such as human skin thickness and blood velocity are used in evaluation. The volar forearm, the scalp, the dorsums of the hand and the anterolateral thigh have been shown to have average epidermal thicknesses of m, m, m and m, respectively [46, 47]. The average dermal thicknesses for the aforementioned regions have been measured to be m, m, m and m [46, 48]. Based on these measurements, we used simulation values of m and m for epidermal and dermal thickness, respectively. Blood vessels vary a lot in terms of their diameter with m being the smallest in the capillaries, followed by m in the arterioles and m in the small arteries [41]. For our simulation studies, we thus picked an average value of m for the thickness of the blood layer. The chosen values add up to a total simulated tissue thickness of m.
In general, the propagation of THz-band waves in tissue is drastically impacted by the absorption of liquid water molecules which cause internal vibrations (i.e., absorption loss). The absorption loss is determined using the absorption coefficient of the respective tissue layer. To be able to calculate the absorption coefficient using Equation (3), the dielectric characteristics of the tissue layers are required. Table I summarizes the dielectric parameters of epidermis, dermis and blood which we used in our simulations. The complex permittivity of tissues with a high amount of water molecules (i.e., blood) can be approximated best by the double Debye relaxation [43]:
| (8) |
where is the angular frequency, is the relative permittivity at the high frequency limit, and are the amplitude changes and and are the characteristic relaxation times of the medium. Compared to that, the complex permittivity of skin and fat tissue can be modelled best by the Havriliak-Negami relationship [40]:
| (9) |
where the additional exponents and describe the asymmetry and broadness of the corresponding spectra and the static ionic conductivity.
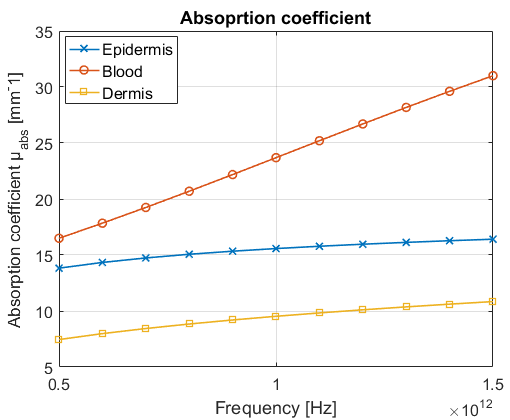
Figure 4 shows the absorption coefficient of the different tissue layers at sub-THz frequencies. As we can see from the figure, the absorption loss is more dominant in blood than in the other tissue layers, which is due to the fact that blood contains the highest amount of water molecules.
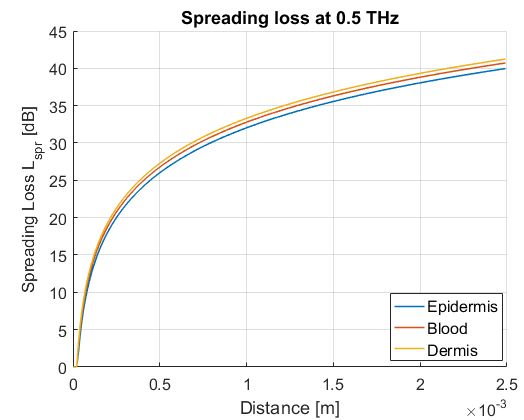
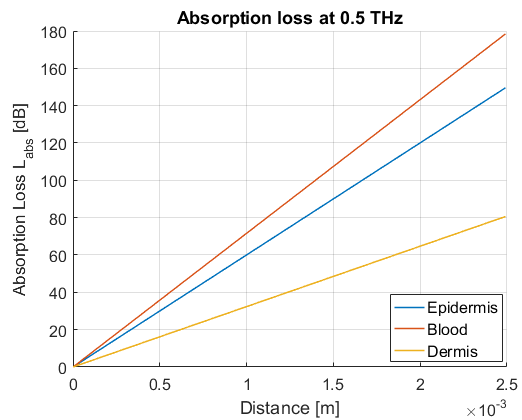
Using the absorption coefficient and the equations for spreading and absorption loss (see (2)), we determined the spreading and the absorption loss for the three tissue layers. Figure 5 shows the results for the spreading loss (a) and the absorption loss (b) in dB at THz. As can be seen from the figures, the signal suffers significantly more from molecular absorption than from spreading loss.
Since we propose to rely on backscattering communication, we are specifically interested in the backscattered power received at the anchor and defined by (1). Therefore, we stacked the three tissue layers and modeled a signal traveling the channel twice (from the anchor to the BNS and back). The thicknesses of the layers were thereby chosen as discussed above and the antenna gains and were chosen to be [50]. In line with [40, 39], the pulse energy and the pulse duration are assumed to be constant at pJ and fs, resulting in a transmitted peak power of kW. Figure 6 shows the received backscattered power in dB for frequencies of and THz when being transmitted through m of blood, m of dermis and m of epidermis (adding up to a total distance of m). As can be seen from the figure, after traveling twice through the tissue, the signal power received at the anchor is approx. , and dB depending on the used frequency.
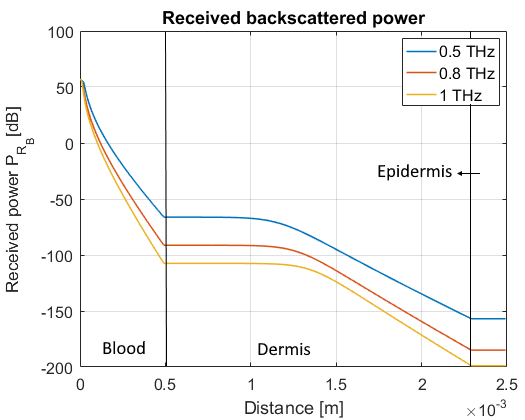
Receiving a signal at dB requires the receiver to have a sensitivity of approx. fW/Hz1/2. The sensitivity requirement can be eased by applying a higher transmit power or by using higher gain antennas. Nonetheless, nanoelectronic detectors with sensitivities of - W/Hz1/2 have already been proposed in literature [51].
The state-of-the-art further shows that channel capacities on the order of Gbps-Tbps can be achieved for distances below mm in in-body THz communication scenarios [40]. As backscattering reduces the power significantly, channel capacity is also affected. We calculated the channel capacity of the forward and the backscattered communication link using (4). We used the initial transmission power of the anchor to determine for the forward link, and the power received at the BNS to determine for the backscattered link.
Figure 7 shows the theoretical capacity of the forward and the backscattered communication link of the stacked tissue layers. In line with [40], the capacity for the forward link at a distance of m is in the order of Tbps. However, the capacity of the backscattered link is drastically decreased to approx. kbps. To achieve higher capacities in backscattering communication, the system will require significantly higher transmit power and/or antenna gains. Generally speaking, channel capacities on the order of kbps are more realistically achievable than Gbps.
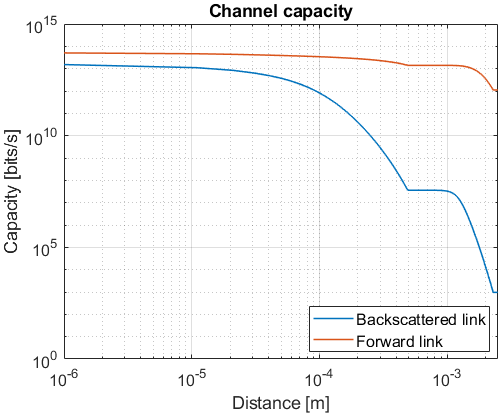
Summarized, sub-THz backscattering communication in human tissue is feasible for very limited distances. Specifically, the anchors should be attached to regions of the body where the skin and fat layers are thin, i.e., volar forearm, scalp or dorsum of the hand.
V-B Localization
This section studies the movement of the BNSs in the bloodstream, the requirements on the anchor placement and the localization accuracy of our concept. There are two factors which mainly influence the placement of the anchors. First, THz backscattering enables communication in tissue for distances of m at most. Anchors need thus to be placed at body regions with thin skin and fat layers. The second requirement on the placement of anchors comes from the errors generated by the inertial positioning process. As discussed in Section IV-B, the accelerometer and the gyroscope in the IMU suffer from drift errors inducing accumulation errors over time. Since BNSs reset their IMUs whenever they communicate with an anchor, anchors should not be placed too far from each other in order to keep accumulation errors small. The following two subsections discuss the exploited simulation environment and the localization results.
Simulation Environment
Modeling all characteristics of the cardiovascular system is non-trivial as it comprises approx. cm3 of blood volume and km of blood vessels [52]. The blood flow rate depends on the diameter of the vessel reaching from cm/s in the arteries over cm/s in the arterioles to cm/s in the capillaries [41].
There is no simulation tool available yet, which incorporates the entire circulatory system in detail. However, to achieve realistic estimates about our localization concept, a simplified model including all major vessels of the cardiovascular system is sufficient. Therefore, we used BloodVoyagerS [53], which is a medical nanonetwork simulation module for ns-3111https://www.nsnam.org/. BloodVoyagerS is modeled upon a simplified human cardiovascular system to realize the movement of nanobots within the human bloodstream. The simulator comprises a model including vessels and their respective blood flow rates ( cm/s in the aorta, cm/s in the arteries, cm/s in the veins), adding up to a total simulated vessel length of m.
BNS Movement
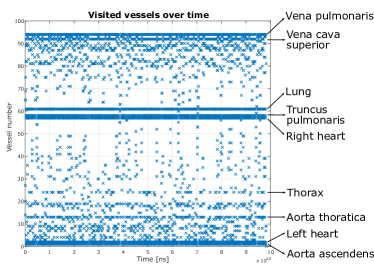
In a first step, we were interested in the movement of the BNSs, in order to get an idea which parts of the body are visited the most. For that purpose, we performed a simulation of one BNS moving in the cardiovascular system for s. Figure 8 shows which vessels have been visited by the BNS at each time step. In BloodVoyagerS, all vessels and organs have dedicated numbers. The y-axis of Figure 8 shows the numbers of the respective vessel (refer to [53] for all vessel numbers) and the x-axis shows the time step in ns. We annotated the most visited vessels to show which body locations are reached more frequently than others. As expected, the BNS passes more often through upper body regions such as the heart and the lungs than the extremities. This result suggests to place more anchors around the upper body to have BNSs floating by anchors more often.
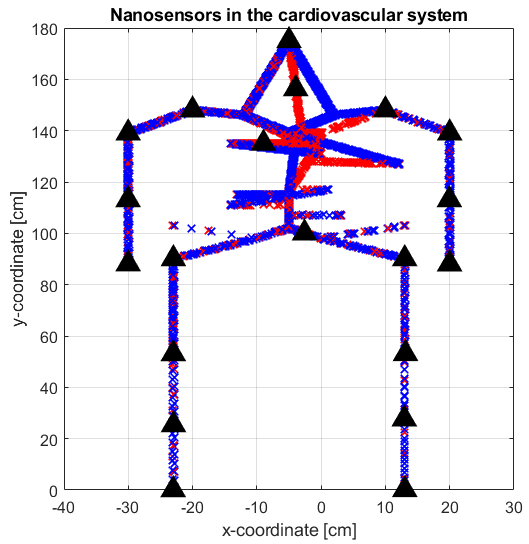
In a next step, we deployed anchors around the body and logged the locations of one BNS to study how often it passes by an anchor. We injected the BNS into the brachial artery (upper left arm) and tracked its movement for s (approx. h). Figure 9 shows the simulation results in terms of BNS locations (x and y) recorded over time and depicted by red (artery) and blue (vein) crosses. The black triangles depict the anchor locations. Using the track of the BNS, we determined each time step at which the sensor was in close proximity to an anchor (i.e., the BNS is within a cm radius of an anchor as we assumed anchors to be in the shape of cm2 patches). We ran the simulation times and determined the average duration between two anchor visits. Almost of consecutive anchor visits occurred within a time window of s. The studies showed that in the worst case, a visit can take up to s in the anchor setup. However, considering that of the time, anchor visits occur within s, an appropriate sampling rate for acquiring sensor readings could be chosen as Hz (sensor measurements are performed every s). The sampling rate depends on the requirements of the application, however, sampling rates of up to Hz are realistically achievable for current BNS prototypes [34, 36].
Event Localization
Here, we investigate the event localization of the presented system by BNSs reporting to anchors. BNSs stamp the location of an event representing an anomaly whenever they sense one (as described in Section IV-B). Since we assume anchors to be shaped as cm2 patches, sensors communicating to an anchor log their location as random point within this square. Thus, the x and y components of the location can take any value within . Since the skin thickness is assumed to be on average, BNSs infer their z direction from the interval . The upper bound is as the anchor can not be outside the body.
To analyze the performance of the localization system, we used MATLAB’s Sensor Fusion and Tracking Toolbox222https://www.mathworks.com/products/sensor-fusion-and-tracking.html along with BloodVoyagerS. The ground truth trajectories of the BNSs are determined using BloodVoyagerS and the Kalman filter based location stamping is performed with the MATLAB toolbox. For the evaluation, we used multiple BloodVoyagerS runs, calculated the localization error for each run and averaged the results.
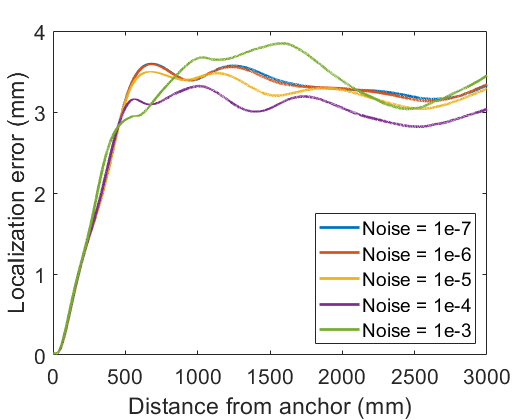
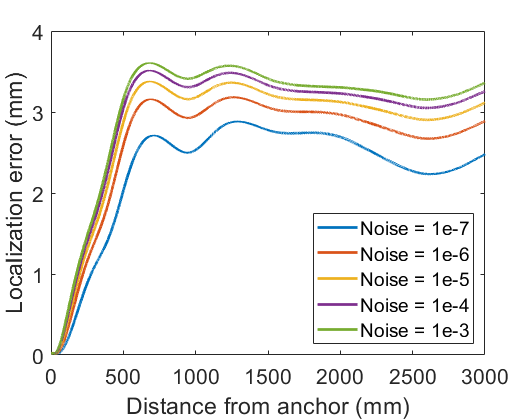
We consider a single BNS sensing the event. Figure 10 illustrates the localization error over increasing distance between the BNS and the anchor. We calculated the localization error over varying sensor noise and bias levels in accordance with typical values for nanoscale IMUs. Figure 10 (a) and (b) show the localization error with varying noise levels (and fixed bias) for the gyroscope and the accelerometer, respectively. From the figure, we can observe that the localization error first increases with increasing distance to the anchor (up to approx. mm). This matches our expectations as the IMU error accumulates over time. The error then begins to stabilize at a value of approx. mm which is due to the Kalman Filter. Figure 10 (c) and (d) depict the bias of the gyroscope and the accelerometer (with fixed noise), respectively. As can be seen from the figures, all bias levels result in the same line, which is further very similar to the noise level plots. This means that the localization error is not significantly affected by the varying IMU bias. Comparing Figure 10 (a) to 10 (c) and Figure 10 (b) to 10 (d), we can conclude that the contribution of noise is more significant than the contribution of bias. Since IMU errors accumulate over time, it is important to update BNS locations at the anchors to bound the localization errors. To keep the localization error below mm, anchors should be placed such that the distance between them does not exceed cm. However, even a localization error of mm is very reasonable as we consider monitoring the human body which has an average height of m.


VI Conclusion
Traditional localization approaches are not feasible for in-body scenarios due to the specific communication and resource constraints of nanosensors as well as the highly dynamic environment. This paper has proposed a novel localization concept for bionanosensors floating through the cardiovascular system. The outlined system comprises nanosensors floating through the bloodstream as well as anchors attached to the human skin, and relies on inertial positioning and THz backscattering communication. Simulations have been performed as a proof of concept and provide promising results. As nanosensors are still in the development process, our approach can be seen as a starting point for the development of localization methods for future health monitoring applications. To further improve our concept, future work needs to be investigated with an interdisciplinary team to explore human health and safety considerations as well as the feasibility of the proposed nanosensors.
References
- [1] T. Panigrahi, M. Hassan et al., “Energy efficient event localization and classification for nano iot,” in Proceedings of the IEEE Global Communications Conference (GLOBECOM). IEEE, 2018, pp. 1–6.
- [2] P. Singh and R. Yadava, “Nanosensors for health care,” in Nanosensors for Smart Cities. Elsevier, 2020, pp. 433–450.
- [3] A. Munawar, Y. Ong, R. Schirhagl, M. A. Tahir, W. S. Khan, and S. Z. Bajwa, “Nanosensors for diagnosis with optical, electric and mechanical transducers,” RSC advances, vol. 9, no. 12, pp. 6793–6803, 2019.
- [4] I. F. Akyildiz, M. Pierobon, S. Balasubramaniam, and Y. Koucheryavy, “The internet of bio-nano things,” IEEE Communications Magazine, vol. 53, no. 3, pp. 32–40, 2015.
- [5] I. F. Akyildiz, M. Ghovanloo, U. Guler, T. Ozkaya-Ahmadov, A. F. Sarioglu, and B. D. Unluturk, “Panacea: An internet of bio-nanothings application for early detection and mitigation of infectious diseases,” IEEE Access, vol. 8, pp. 140 512–140 523, 2020.
- [6] J. M. Jornet and I. F. Akyildiz, “Graphene-based plasmonic nano-antenna for terahertz band communication in nanonetworks,” IEEE Journal on selected areas in communications, vol. 31, no. 12, pp. 685–694, 2013.
- [7] I. F. Akyildiz, J. M. Jornet, and C. Han, “Terahertz band: Next frontier for wireless communications,” Physical Communication, vol. 12, pp. 16–32, 2014.
- [8] H. Elayan, R. M. Shubair, J. M. Jornet, and P. Johari, “Terahertz channel model and link budget analysis for intrabody nanoscale communication,” IEEE transactions on nanobioscience, vol. 16, no. 6, pp. 491–503, 2017.
- [9] J. Simonjan and B. Rinner, “Decentralized and resource-efficient self-calibration of visual sensor networks,” Ad Hoc Networks, vol. 88, pp. 112 – 128, 2019.
- [10] N. A. Alrajeh, M. Bashir, and B. Shams, “Localization techniques in wireless sensor networks,” International Journal of Distributed Sensor Networks, vol. 9, no. 6, 2013, Article ID 304628.
- [11] F. Lemic, S. Abadal, W. Tavernier, P. Stroobant, D. Colle, E. Alarcón, J. Marquez-Barja, and J. Famaey, “Survey on terahertz nanocommunication and networking: A top-down perspective,” arXiv preprint arXiv:1909.05703, 2019.
- [12] H. Tran-Dang, N. Krommenacker, and P. Charpentier, “Localization algorithms based on hop counting for wireless nano-sensor networks,” in 2014 International Conference on Indoor Positioning and Indoor Navigation (IPIN). IEEE, 2014, pp. 300–306.
- [13] L. Zhou, G. Han, and L. Liu, “Pulse-based distance accumulation localization algorithm for wireless nanosensor networks,” IEEE Access, vol. 5, pp. 14 380–14 390, 2017.
- [14] M. S. Prasad, T. Panigrahi, and M. Hassan, “Direction of arrival estimation for nanoscale sensor networks,” in Proceedings of the 5th ACM International Conference on Nanoscale Computing and Communication. ACM, 2018, p. 21.
- [15] P. Stoica and A. Nehorai, “Music, maximum likelihood, and cramer-rao bound,” IEEE Transactions on Acoustics, speech, and signal processing, vol. 37, no. 5, pp. 720–741, 1989.
- [16] W. Liu, K. Huang, X. Zhou, and S. Durrani, “Next generation backscatter communication: systems, techniques, and applications,” EURASIP Journal on Wireless Communications and Networking, vol. 2019, no. 1, pp. 1–11, 2019.
- [17] S. Khaledian, F. Farzami, H. Soury, B. Smida, and D. Erricolo, “Active two-way backscatter modulation: An analytical study,” IEEE Transactions on Wireless Communications, vol. 18, no. 3, pp. 1874–1886, 2019.
- [18] D. Dardari, F. Guidi, C. Roblin, and A. Sibille, “Ultra-wide bandwidth backscatter modulation: Processing schemes and performance,” EURASIP Journal on Wireless Communications and Networking, vol. 2011, no. 1, p. 47, 2011.
- [19] D. Dardari, “Method and apparatus for communication in ultra-wide bandwidth rfid systems,” 2015, uS Patent 8,952,789.
- [20] J. M. Jornet and I. F. Akyildiz, “Femtosecond-long pulse-based modulation for terahertz band communication in nanonetworks,” IEEE Transactions on Communications, vol. 62, no. 5, pp. 1742–1754, 2014.
- [21] A. K. Vavouris, F. D. Dervisi, V. K. Papanikolaou, and G. K. Karagiannidis, “An energy efficient modulation scheme for body-centric nano-communications in the thz band,” in Proceedings of the 7th International Conference on Modern Circuits and Systems Technologies (MOCAST). IEEE, 2018, pp. 1–4.
- [22] M. El-Absi, A. A. Abbas, A. Abuelhaija, F. Zheng, K. Solbach, and T. Kaiser, “High-accuracy indoor localization based on chipless rfid systems at thz band,” IEEE Access, vol. 6, pp. 54 355–54 368, 2018.
- [23] F. Lemic, S. Abadal, and J. Famaey, “Toward localization in terahertz-operating energy harvesting software-defined metamaterials: Context analysis,” in Proceedings of the Seventh Annual International Conference on Nanoscale Computing and Communication (NANOCOM). ACM, 2020, [to appear].
- [24] H. Sarieddeen, N. Saeed, T. Y. Al-Naffouri, and M.-S. Alouini, “Next generation terahertz communications: A rendezvous of sensing, imaging, and localization,” IEEE Communications Magazine, vol. 58, no. 5, pp. 69–75, 2020.
- [25] M. E. Tanner and J. M. Protz, “The feasibility of a nano-interial measurement unit that uses chemistry to record position,” in Chemical and Biological Sensing VIII, vol. 6554. International Society for Optics and Photonics, 2007, p. 65540H.
- [26] M. Ahmadian, K. Jafari, and M. J. Sharifi, “Novel graphene-based optical mems accelerometer dependent on intensity modulation,” ETRI Journal, vol. 40, no. 6, pp. 794–801, 2018.
- [27] X. Song, L. Wang, F. Feng, L. Lou, W. Diao, and C. Duan, “Nanoscale quantum gyroscope using a single 13c nuclear spin coupled with a nearby nv center in diamond,” Journal of Applied Physics, vol. 123, no. 11, p. 114301, 2018.
- [28] F.-T. Shi, S.-C. Fan, C. Li, and X.-B. Peng, “Modeling and analysis of a novel ultrasensitive differential resonant graphene micro-accelerometer with wide measurement range,” Sensors, vol. 18, no. 7, p. 2266, 2018.
- [29] A. Marquez, B. Tank, S. K. Meghani, S. Ahmed, and K. Tepe, “Accurate uwb and imu based indoor localization for autonomous robots,” in Proceedings of the 30th Canadian Conference on Electrical and Computer Engineering (CCECE). IEEE, 2017, pp. 1–4.
- [30] C. Li, S. Wang, Y. Zhuang, and F. Yan, “Deep sensor fusion between 2d laser scanner and imu for mobile robot localization,” IEEE Sensors Journal, 2019.
- [31] V. Malyavej, W. Kumkeaw, and M. Aorpimai, “Indoor robot localization by rssi/imu sensor fusion,” in Proceedings of the 10th International Conference on Electrical Engineering/Electronics, Computer, Telecommunications and Information Technology. IEEE, 2013, pp. 1–6.
- [32] T. Khan, M. Civas, O. Cetinkaya, N. A. Abbasi, and O. B. Akan, “Nanosensor networks for smart health care,” in Nanosensors for Smart Cities. Elsevier, 2020, pp. 387–403.
- [33] I. Santiago, “Nanoscale active matter matters: Challenges and opportunities for self-propelled nanomotors,” Nano Today, vol. 19, pp. 11–15, 2018.
- [34] H. Li, K. Wu, Z. Xu, Z. Wang, Y. Meng, and L. Li, “Ultrahigh-sensitivity piezoresistive pressure sensors for detection of tiny pressure,” ACS applied materials & interfaces, vol. 10, no. 24, pp. 20 826–20 834, 2018.
- [35] R. Rajasekar and S. Robinson, “Nano-pressure and temperature sensor based on hexagonal photonic crystal ring resonator,” Plasmonics, vol. 14, no. 1, pp. 3–15, 2019.
- [36] Z. Qu, L. Wu, B. Yue, Y. An, Z. Liu, P. Zhao, J. Luo, Y. Xie, Y. Liu, Q. Wang et al., “Eccentric triboelectric nanosensor for monitoring mechanical movements,” Nano Energy, vol. 62, pp. 348–354, 2019.
- [37] J. Simonjan, J. M. Jornet, I. F. Akyildiz, and B. Rinner, “Nano-cameras: a key enabling technology for the internet of multimedia nano-things,” in Proceedings of the 5th ACM International Conference on Nanoscale Computing and Communication, 2018, pp. 1–6.
- [38] J. Kokkoniemi, J. Lehtomäki, and M. Juntti, “A discussion on molecular absorption noise in the terahertz band,” Nano Communication Networks, vol. 8, pp. 35 – 45, 2016, electromagnetic Communication in Nano-scale. [Online]. Available: http://www.sciencedirect.com/science/article/pii/S1878778915000472
- [39] J. M. Jornet and I. F. Akyildiz, “Channel modeling and capacity analysis for electromagnetic wireless nanonetworks in the terahertz band,” IEEE Transactions on Wireless Communications, vol. 10, no. 10, pp. 3211–3221, 2011.
- [40] G. Piro, P. Bia, G. Boggia, D. Caratelli, L. A. Grieco, and L. Mescia, “Terahertz electromagnetic field propagation in human tissues: A study on communication capabilities,” Nano Communication Networks, vol. 10, pp. 51–59, 2016.
- [41] M. Fruchard, L. Arcese, and E. Courtial, “Estimation of the blood velocity for nanorobotics,” IEEE Transactions on Robotics, vol. 30, no. 1, pp. 93–102, 2013.
- [42] J. D. Griffin and G. D. Durgin, “Complete link budgets for backscatter-radio and rfid systems,” IEEE Antennas and Propagation Magazine, vol. 51, no. 2, pp. 11–25, 2009.
- [43] H. Elayan, R. M. Shubair, J. M. Jornet, and R. Mittra, “Multi-layer intrabody terahertz wave propagation model for nanobiosensing applications,” Nano communication networks, vol. 14, pp. 9–15, 2017.
- [44] K. Yang, A. Pellegrini, M. O. Munoz, A. Brizzi, A. Alomainy, and Y. Hao, “Numerical analysis and characterization of thz propagation channel for body-centric nano-communications,” IEEE Transactions on Terahertz Science and technology, vol. 5, no. 3, pp. 419–426, 2015.
- [45] M. B. Alatise and G. P. Hancke, “Pose estimation of a mobile robot based on fusion of imu data and vision data using an extended kalman filter,” Sensors, vol. 17, no. 10, p. 2164, 2017.
- [46] P. Oltulu, B. Ince, N. Kökbudak, F. Kılıç et al., “Measurement of epidermis, dermis, and total skin thicknesses from six different body regions with a new ethical histometric technique,” Türk Plastik, Rekonstrüktif ve Estetik Cerrahi Dergisi (Turk J Plast Surg), vol. 26, no. 2, pp. 56–61, 2018.
- [47] J. C. Chan, J. Ward, F. Quondamatteo, P. Dockery, and J. L. Kelly, “Skin thickness of the anterior, anteromedial, and anterolateral thigh: A cadaveric study for split-skin graft donor sites,” Archives of plastic surgery, vol. 41, no. 6, p. 673, 2014.
- [48] O. Akkus, A. Oguz, M. Uzunlulu, M. Kizilgul et al., “Evaluation of skin and subcutaneous adipose tissue thickness for optimal insulin injection,” J Diabetes Metab, vol. 3, no. 8, p. 2, 2012.
- [49] C. B. Reid, G. Reese, A. P. Gibson, and V. P. Wallace, “Terahertz time-domain spectroscopy of human blood,” IEEE journal of biomedical and health informatics, vol. 17, no. 4, pp. 774–778, 2013.
- [50] M. M. Seyedsharbaty and R. A. Sadeghzadeh, “Antenna gain enhancement by using metamaterial radome at thz band with reconfigurable characteristics based on graphene load,” Optical and Quantum Electronics, vol. 49, no. 6, p. 221, 2017.
- [51] A. Rogalski, M. Kopytko, and P. Martyniuk, “Two-dimensional infrared and terahertz detectors: Outlook and status,” Applied Physics Reviews, vol. 6, no. 2, p. 021316, 2019.
- [52] G. J. Tortora and B. H. Derrickson, Principles of anatomy and physiology. John Wiley & Sons, 2018.
- [53] R. Geyer, M. Stelzner, F. Büther, and S. Ebers, “Bloodvoyagers: simulation of the work environment of medical nanobots,” in Proceedings of the 5th ACM International Conference on Nanoscale Computing and Communication, 2018, pp. 1–6.