subsecref \newrefsubsecname = \RSsectxt \RS@ifundefinedthmref \newrefthmname = theorem \RS@ifundefinedlemref \newreflemname = lemma
Lane level context and hidden space characterization
for autonomous driving
Abstract
For an autonomous vehicle, situation understanding is a key capability towards safe and comfortable decision-making and navigation. Information is in general provided by multiple sources. Prior information about the road topology and traffic laws can be given by a High Definition (HD) map while the perception system provides the description of the space and of road entities evolving in the vehicle surroundings. In complex situations such as those encountered in urban areas, the road user behaviors are governed by strong interactions with the others, and with the road network. In such situations, reliable situation understanding is therefore mandatory to avoid inappropriate decisions. Nevertheless, situation understanding is a complex task that requires access to a consistent and non-misleading representation of the vehicle surroundings. This paper proposes a formalism (an interaction lane grid) which allows to represent, with different levels of abstraction, the navigable and interacting spaces which must be considered for safe navigation. A top-down approach is chosen to assess and characterize the relevant information of the situation. On a high level of abstraction, the identification of the areas of interest where the vehicle should pay attention is depicted. On a lower level, it enables to characterize the spatial information in a unified representation and to infer additional information in occluded areas by reasoning with dynamic objects.
I Introduction
An autonomous vehicle senses its surrounding environment through its sensors and continuously takes decisions. Level 3 autonomous driving systems are able to handle very structured and clear situations like highways. However, there is still a lack for operating in urban situations where the decision-making has to be performed in much more complex situations. Several processes are involved before taking the final decision. The data provided by perception sensors such as LiDARs or cameras is processed by perception algorithms in order to supply information about the surroundings. Then, the situation must be understood so that the decision-making can plan the maneuver to adopt. The work presented in this article focuses on the lane level situation modeling for autonomous driving. In 1, the gray module defines the working area in which this work takes place.
The notions of scene and situation defined in [1] are bases for describing the driving situation context. The selection process, or “prioritization” as described in [2], enables to infer the most relevant information. There is a need to analyze a situation by aggregating all available information from different sources, i.e., perception, map, localization. Situation understanding implies to have a representation which provides non-misleading information for decision-making. Further, it also allows to reason by predicting the evolution of the elements of the environment. Depending on the situation, e.g., a roundabout or a pedestrian crossing, the areas of interest where the vehicle has to pay attention are different. These areas must be identified all along the journey. Relevant road users that are in interaction or may interact with the vehicle should be identified while others can be ignored.

A list of agents can be supplied by the perception system as in [3, 4] in the form of object maps. However, in case of missed detections, absence of object does not mean that the space is free as there may be a lack of visibility. This can lead the vehicle to an inconsistent situation interpretation. Another approach is to discretize the environment with grids. Each cell can supply information like occupancy which can be used by the decision-making to plan the best trajectory [5]. Evidential grids have the advantage to distinguish a cell that has not been observed, i.e., missing information, from a cell that is conflicting between occupied and non-occupied states [6]. However, classification and prediction of dynamic occupied cells is more complicated, grids are less suited to manage dynamic road users. The current trend is to use a prior map with several layers like a geometric layer, a topological layer and a semantic layer (see [7]) which can be used jointly with the detected objects as in [8] or with the free space characterized by an occupancy grid [9].
The environment representation is therefore a key point to understand the situation and to infer knowledge. Missing information comes from occlusions [10, 11, 12, 13] but also from limited range of the vehicle field of view [14]. Depending on the situation encountered and areas of interest, this will not have the same impact.
This paper aims at defining a lane level grid representation based on areas of interest. We propose a spatial representation that handles occlusions and infers additional knowledge in hidden areas to facilitate safe decision-making. Indeed, some hidden parts do not present any danger to the ego-vehicle. We therefore propose a formalism that allows to characterize and manipulate them in real-time. These are our main contributions. Section III and IV depict the selection of these areas and the classification process. Finally, some case studies are presented.
| Interaction type vs | Lane keeping | Lane Changing | Lane Merging | Lane Crossing |
|---|---|---|---|---|
| Lanes importance | ||||
| Primary order | ![[Uncaptioned image]](/html/2108.13664/assets/x2.png) |
![[Uncaptioned image]](/html/2108.13664/assets/x3.png) |
![[Uncaptioned image]](/html/2108.13664/assets/x4.png) |
![[Uncaptioned image]](/html/2108.13664/assets/x5.png) |
| Secondary order | ![[Uncaptioned image]](/html/2108.13664/assets/x6.png) |
![[Uncaptioned image]](/html/2108.13664/assets/x7.png) |
![[Uncaptioned image]](/html/2108.13664/assets/x8.png) |
![[Uncaptioned image]](/html/2108.13664/assets/x9.png) |
II Related work
Decisions operated by the autonomous vehicle are taken at different levels of abstraction. Early with [15], the notion of abstraction levels is presented and reused in several architectures, especially for the decision-making [8]. The Operational Level concerns dense information updated at a high rate and is reactive to events that occur close in time and space, e.g., the local trajectory planned with its related speed profile. The upper level is the tactical level that corresponds to bigger events which happen in a longer time horizon like maneuvers [16]. The most abstracted layer is the Strategic level. The mission planer plans a global trajectory over a larger horizon of time and space.
Each level of abstraction contributes to the representation of the situation and enables reasoning. In several architectures, all processes that refer to situation understanding or context modeling notions are not defined in a unified point of view. In [17], the scene modeling and situation modeling are separated whereas in [18] they rather stand in the perception module. The notion of a separated world model module is used as well [19, 20, 21]. The purpose of such a module is to provide a representation of the situation of the vehicle, with prediction and analysis to the decision-making.
The representation of information can be done either in a continuous or discrete manner. In [22], the Local Dynamic Map structures all the objects and features of the world. A map is also used and as in [7], a metrical layer of information is stored. The notion of a Parametric Free Space [23] gives information on the free space and its contour, i.e., obstacle boundary or unknown boundary. When the representation is discrete, the use of grids is popular [9, 13].
As presented before, there is a need to combine these representations, as it is presented in [18, 8] architectures. Occlusions in specific situations need to be addressed and may need objects representation. Several decision-making approaches enable to take into account occluded areas. POMDP are used for handling occlusions for static obstacles [24] as well as dynamic ones [12, 11]. The authors in [13] uses several layers of information: a dynamic grid, an object list and a map of unobservable regions to assess likely collisions. Some articles handle directly polygons of occluded areas [25], in some cases the centerline is used [12] and in other cases the segment border is used [14].
When hidden areas appear, one needs to assess whether all of them are relevant for a safe decision making. The notion of areas of interest will be presented as there is a need to identify where relevant information is missing. As demonstrated in [10], the term “Social perception” is defined in order to infer information in occluded zones from the behavior of road users. In specific situations, additional information is inferred. A method patented [26] shows the mechanism to determine a visibility distance by intersecting the path of a vehicle from a map with the dynamic field of view. This example shows a characterization of the following path of the vehicle by two states: the free space that is of interest and the hidden one. The Responsibility Sensitive Safety (RSS) model presented in [27], also highlights the spatial safety requirement with objects representation. The concept of a safety distance is introduced for several situations.
Several works need a spatial representation handling occlusions and objects for tasks like decision-making [11], risk analysis [28] or safety evaluation [13]. In [14], reachable sets are used for predicting the path and intention of a potential vehicle that could be hidden in an occluded area. Particle filters are also used in order to determine the plausibility of a hidden vehicle [25]. Then, as presented in [16], a global method for motion planning could use non-misleading information provided by such a context modeling module.
In this paper, the different levels of abstraction of the information allows to identify the relevant parts of the situation that the autonomous vehicle encounters. Then an analysis of the areas of interest is presented. Additional information that can be inferred from occluded zones and from objects are integrated in a unified representation.
III Interacting lane grid
The three levels of abstraction provide a hierarchy of levels in which several processes take place. Each level has a specific type of task to achieve in a world model module.
III-A Strategic level of abstraction (high level)
This level has the duty to compute and infer high-level information. At this level the mission planning process provides the intended path of the autonomous vehicle on a topological representation of the map. From this intended path, one can define all the driving lanes that may interact with the car during its cruise. Two types of interacting lanes are differentiated. The primary order lanes are directly in interaction, i.e., shares a common driving space, with the ego vehicle intended path. These lanes are the ones for which the vehicle needs to have information, typically whether they are occupied by another road user, for decision-making. The second order encompasses lanes that have an indirect interaction with the autonomous vehicle, in the sense that they have a direct interaction (i.e., primary order) with the primary order lanes of the ego vehicle itself. The vehicle does not necessarily need information about the second order lanes to drive, but they are able to provide additional information about the primary ones.
In this paper, we consider fours types of interactions that widely cover common driving situations: lane keeping, changing, merging and crossing interactions. In I the interacting paths are defined based on the topological layer of the road. In lane keeping, the followed lane belongs to the primary order area of interest. The changing lanes belong to the secondary order, as they are the primary order lanes of the lane changing interaction type.
A similar approach can also be considered towards vulnerable road users. A map with the cycle paths, sidewalks or pedestrian crossing would enable to define additional types of interaction. These cases are out of the scope of this work.
III-B Tactical level of abstraction (intermediate level)
At the tactical level, the autonomous vehicle has to convert the topological information provided at the strategic level into a metrical representation. Moreover, the vehicle has to focus on areas of interest that are in its vicinity in terms of time and distance.
Using a metrical HD map, the spatial areas of a lane can be extracted as a 2D polyline, i.e., a sequence of line segments, representing the center of the lane along with a width. The advantage of coding the center of a lane compared to coding only the lane borders, e.g., with Lanelets [7], is that it is straightforward to discretize in the longitudinal direction. By defining a threshold in terms of interacting distance, we prune geometrically the interacting lanes and construct a spatial Area Of Interest (). The is therefore composed of the primary and the secondary one , all the space outside of the , denoted as , is considered out of interest as there will be no interaction with the ego vehicle.
The next step is to characterize the using perception information from exteroceptive sensors such as cameras or LiDAR.The sensor setup of the vehicle can be characterized beforehand in order to determine its physical perception range. Prior to the perception itself, it is possible to define the spatial Field Of View () of the vehicle. Its complementary , corresponds to regions where the vehicle has no means to perceive anything using its own embedded sensors.
For decision-making at the tactical level, we propose to use a lane level grid representation that discretizes the lanes within along their longitudinal direction.
III-C Operational level of abstraction (low level)
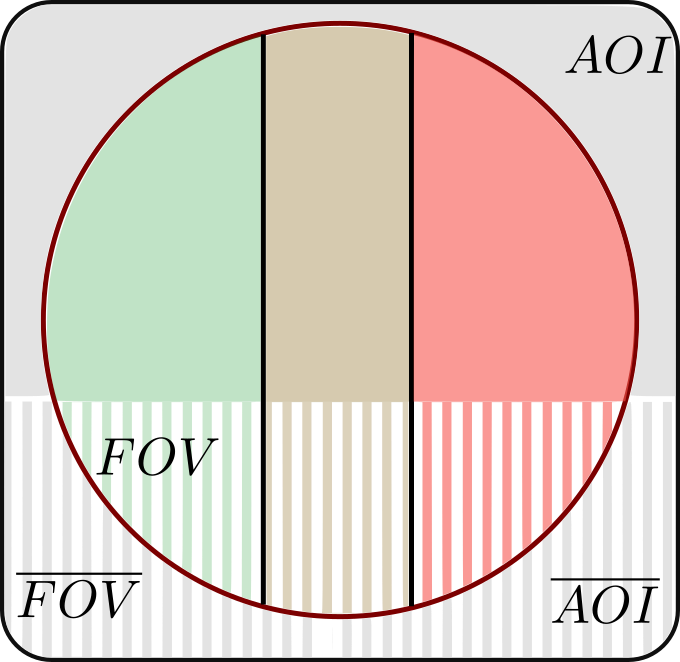
The lowest level of abstraction corresponds to a representation at the sensor level. The space characterization is classically done using grids [13] or parametric free space [23]. The frame of discernment , i.e., the space state, is then decomposed into three categories: free (), occupied () and unknown ().
So far, the frame has been decomposed in three different ways:
| (1) |
By crossing these three breakdowns, we obtain the space depicted in 2a. One can see that the free and occupied sets are necessarily inside the . Conversely, the unknown set has non-empty intersection with the . Therefore, we will distinguish the hidden set , that represents the space within the of the sensors but cannot be characterized because of occlusions, from the rest of unknown space that are out of reach from the sensors range. As we are only interested in the space inside the , the remaining sets of interests becomes:
| (2) | |||||
| (3) | |||||
| (4) | |||||
| (5) |
These four sets , , , are represented in 2a by the colors green, brown, red and gray, respectively. The subsets of interest are represented in filled color whereas their complement is hatched.
IV Interacting objects
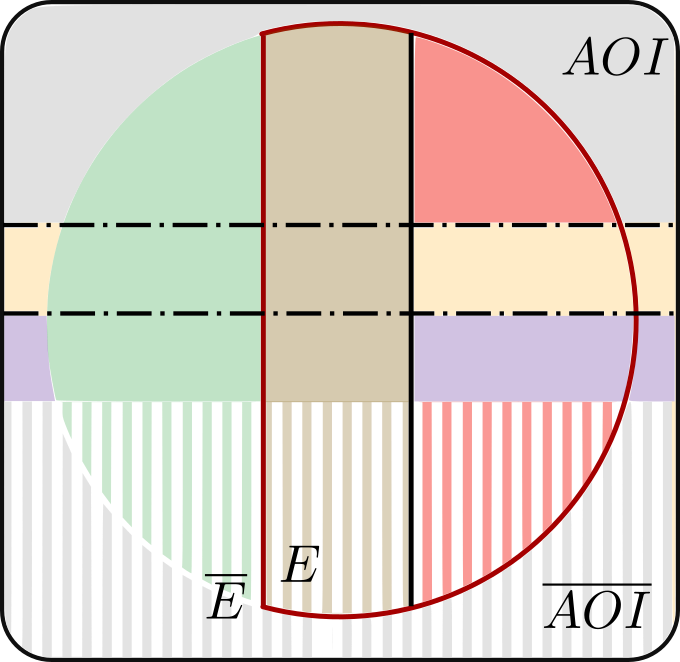
Static objects have an impact on the decision-making process. They are typically well represented in occupancy grids. At the opposite, dynamic objects (e.g., other road users) interact with the surrounding environment. More complex information can be inferred from their presence. The detected objects that are outside of the are discarded. On 2b, an entity defined as a dynamic object is denoted and gives information about the occupied and hidden space states. Its complementary is all but dynamic objects.
IV-A Safety area
When driving, the space in front of the vehicle needs to be obstacle-free for obvious safety reason. This space is defined by a safety distance that is an increasing function of the vehicle velocity. The faster a vehicle is driving the more space needs to be kept as free in front of it. This safety distance encompasses the driver’s reaction time, the minimum braking distance and safety regulations.
Therefore, when a vehicle is detected and its speed estimated, a safety area at its front denoted is defined. In the case where this safety area is visible and characterized as free (as it should be) or occupied (it means that the theoretical safety distance is not respected), then the safety property can be ignored as it is less informative than the free or occupied knowledge. The safety property is therefore only useful to further characterize an unknown area which could be either hidden or out of the . Its corresponding set of interest is:
| (6) |
This set is represented in yellow in 2b.
IV-B Protected area
One important aspect of the interaction between road users is that they impose physical constraints among each other. Once a vehicle occupies a given space of the road, no other road users can cross this space without causing an accident.
In our case study, we propose to use objects belonging to the second order to further characterize the first order . Because the lanes in have a direct interaction, e.g., crossing, with the ones in , a vehicle in may obstruct the circulation in . This will happen when a vehicle belongs to and occupies a spatial space that also belongs to a lane in . All the space behind this vehicle along the lane in is protected in the sense that no other road users can go through the obstacle. This protected area is denoted .
Like the safety case, the protected property is only relevant within the unknown category and can be modeled by the following set of interest:
| (7) |
This set is represented in purple in 2b.
LABEL:Tab:Characterization-sets-table depicts only the classification of the . As areas of interest are linked to the ego-vehicle main path, their representation can also be seen as a graph of successive states whose edges are represented by a distance to the ego-vehicle state. A whole cell can be classified as been occupied regardless of the object size. Indeed, the distance to this occupied state and the area of interest which it belongs will be supplied to the decision-making.
This characterization process brings information and enables to structure the environment understanding. It should be noticed that if additional information characterization can be refined, the model is able to extend the process to integrate potentially new sets of information.
For clarity, in the rest of the paper, everything outside of the (dashed set in 2) will be ignored and the notation will be omitted.
| Free | Occupied | Hidden | ||||
| Unknown | ||||||
| : Safety | ||||||
| : Protected | ||||||
V Case studies
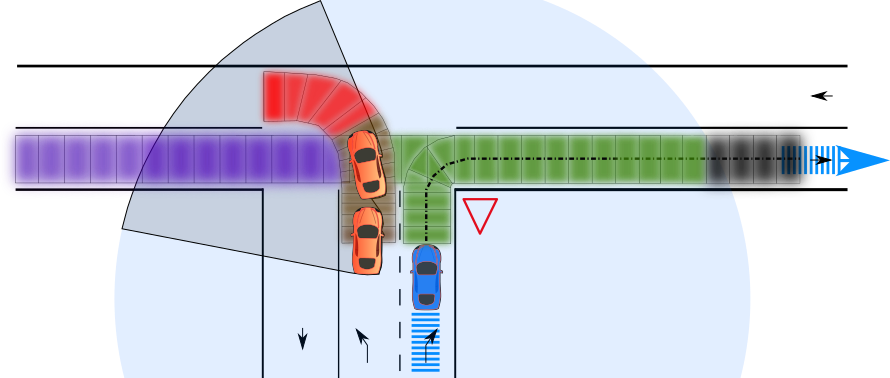
To illustrate the concepts introduced in the previous sections, let us consider the two case studies pictured in 3 and 4. The ego vehicle is represented by the blue car which follows the dotted intend path. The set of all colored lanes constitutes the as defined in I, these lanes are discretized in cells along their longitudinal direction. The light blue circle depicts the of the ego vehicle. The orange cars are other road users.
V-A T-intersection
The first situation is at a T-intersection as shown in 3. The ego-vehicle intends to turn right and has to give way to the vehicles coming from the left merging lane. The two red cars on the adjacent left lane do not interact with the ego vehicle but cross the merging lane and cause occlusions. This example represents a situation where the ego-vehicle should be able to take a decision even under occlusion at a give-way intersection.
In this situation, the ego-vehicle has two primary order interacting lanes: a lane keeping one, i.e., the right-turn lane, and a lane merging one, i.e., the lane coming from the left. The adjacent left lane of the ego vehicle is a secondary order interacting lane as it crosses one of the primary ones. The set of all these lanes are then pruned down to a distance horizon of interest to constitute the . One can note that the second order lane is pruned very early as it becomes out of interest. Within the visible area the free cells () are shown in green. The cells occupied by the red cars are in brown (). The black cells are unknown () as they are out of the . The red cells are also unknown but, as they are inside the and not observed because of occlusions caused by obstacles, they are categorized as hidden (). Last, the purple cells highlight the protected () area. Like and , is not observed, but its space is physically obstructed by the presence of other road users. It should be noted that the protected area may reach outside of the .
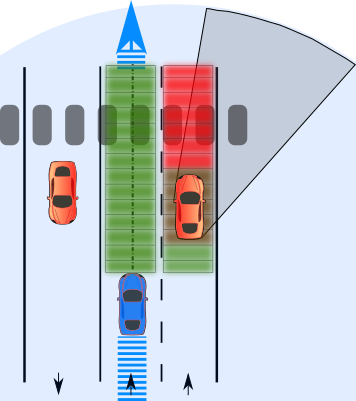
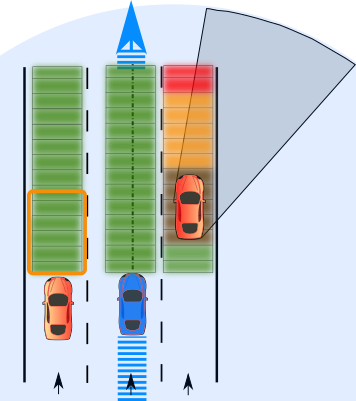
V-B Overtaking
Let us consider a second situation where the ego vehicle intends to overtake a vehicle positioned on its right side as pictured in 4. As explained in section IV-A, a safety area is defined in front of every detected object by using its estimated speed. It is assumed here that vehicles constantly keep safe inter-distance with other vehicles so they can safely perform emergency braking to avoid collision in case of dangerous situations. It means that it is likely that the immediate space in front of any vehicle is free. In 4a the orange vehicle on the right is stopped. In this case, there is no safety space, therefore the unknown area in front of it is characterized as hidden (red). In 4b, the same vehicle is moving, therefore a portion of the space in front of it is safe (orange). Note that for the car on the left side of the ego vehicle, the safe property of the cells in front of it (orange rectangle) is ignored as the cells have already been classified as free, which is more informative.
V-C Experimental setup and implementation
The methodology presented in the previous sections has been implemented on a Renault ZOE experimental vehicle of the Heudiasyc laboratory. Experiments have been conducted in the city of Compiï¿œgne, France, where an HD map has been constructed. The lanes in the map are represented by their center as a polyline with their nodes being geo-referenced with centimeter accuracy. The borders of each lane are also encoded. The graph structure behind the map is used at both the topological and metrical levels. It enables to compute the ego vehicle intended path as well as all the primary and secondary order interacting lanes. For the computation of the , we set a longitudinal distance of interest of m and an arbitrary cell discretization step of m.
A NovAtel SPAN-CPT solution, combining an IMU and GNSS with RTK corrections, was used to have an accurate localization of the ego-vehicle. A Velodyne VLP32-C LiDAR was used for the environment perception. This sensor has a field of view with a theoretical range of meters. A simple geometric ground fitting and clustering algorithm was used to measure the free space and object surrounding the ego vehicle [29]. For the computation of the safety space, an emergency braking model with a deceleration of is used. The safety distance associated to a vehicle driving at a speed is computed as
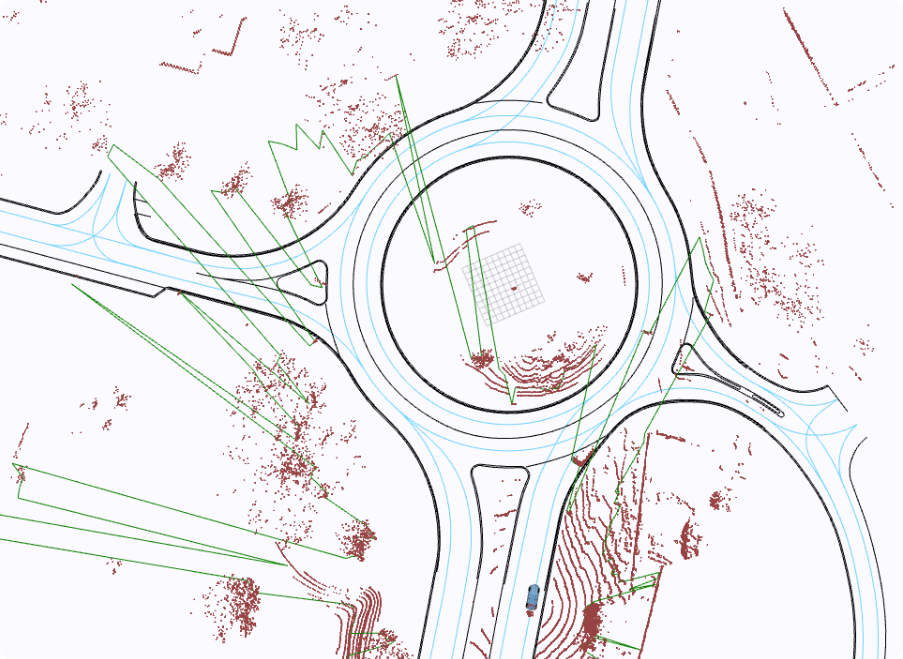
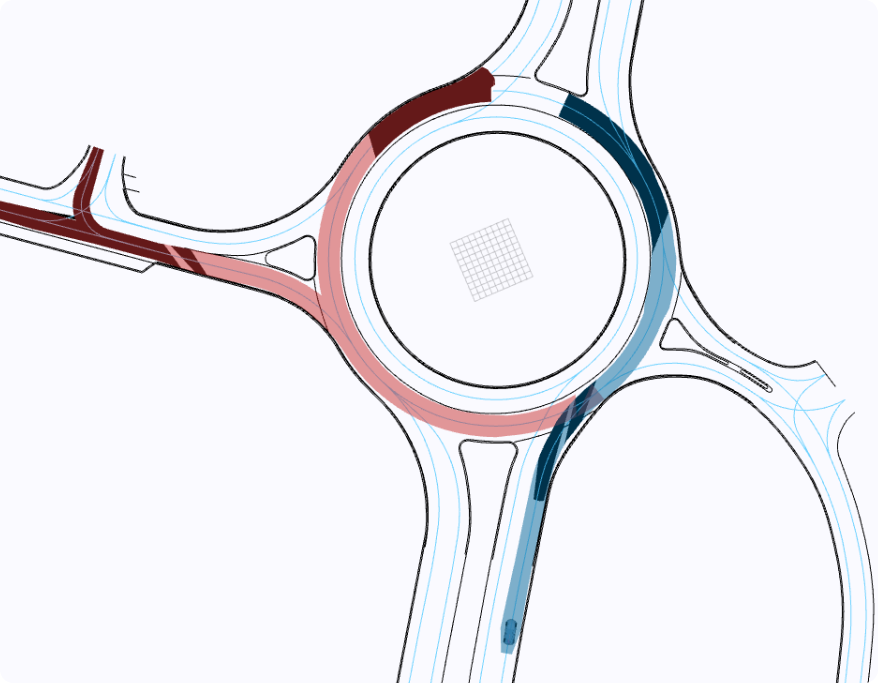
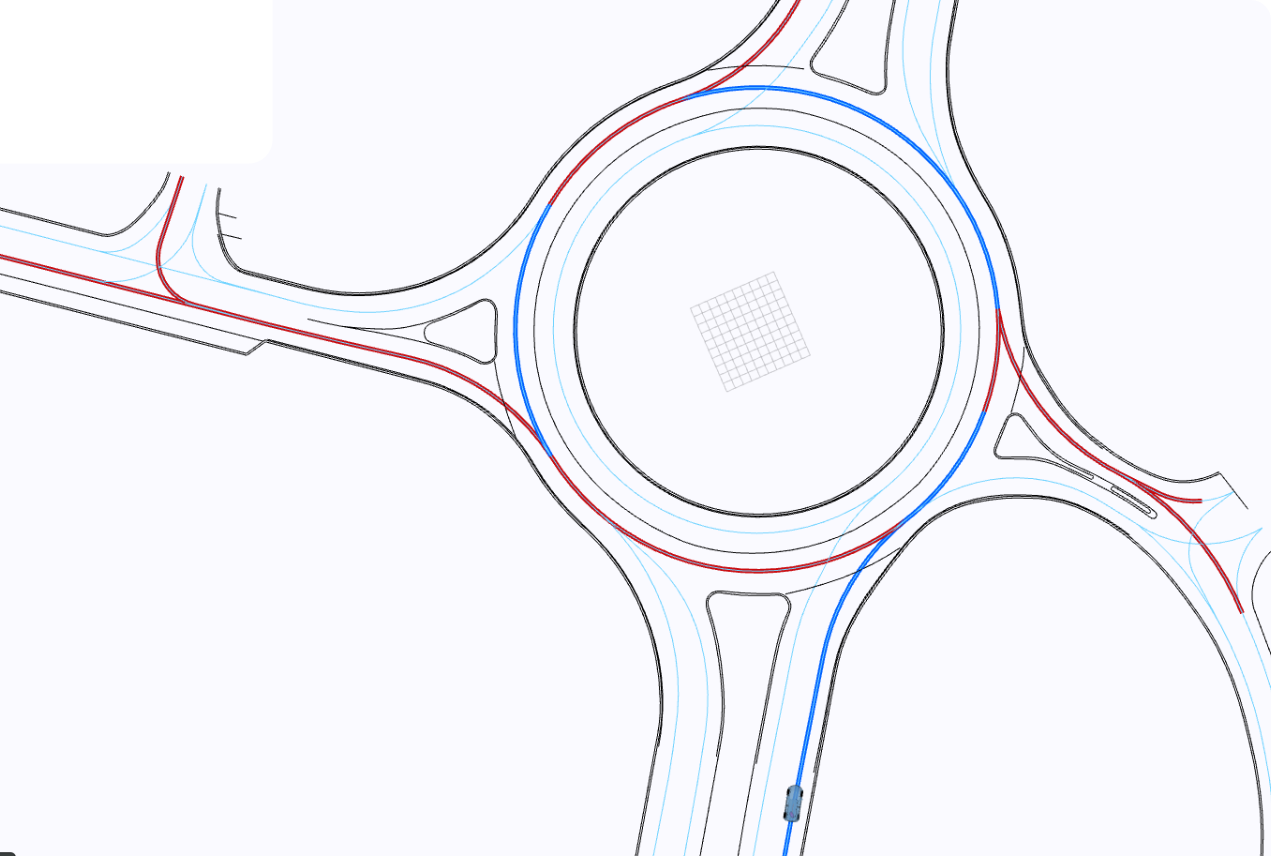
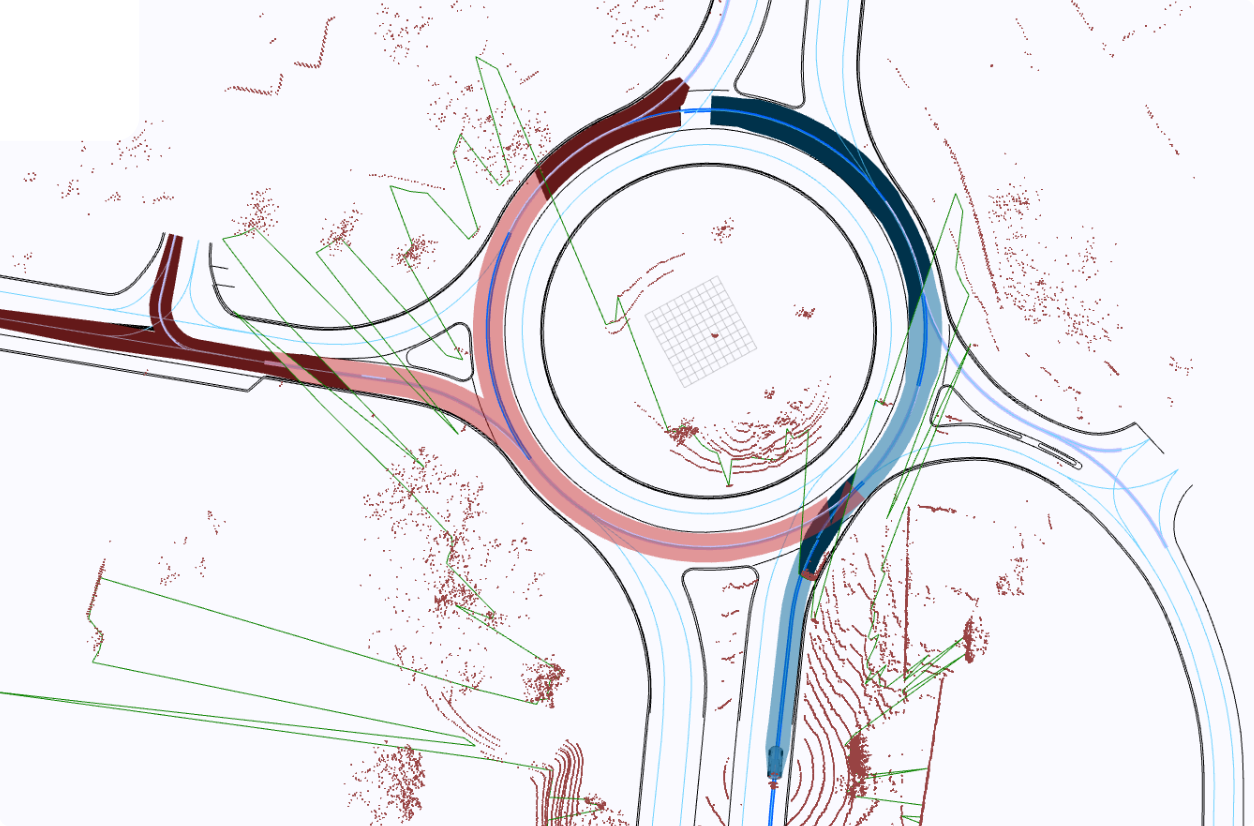
The ego-vehicle and paths of interest are extracted recursively from the HD map as they can be preprocessed thanks to the topological layer. Areas of interest are represented by polygons using the center line with its width. The ROS middle-ware was used for the implementation and the Shapely Python library was used for the geometric operations between areas of interest and the free space polygons. The difference characterizes the hidden space. LABEL:Fig:Rviz-display shows the results from real data in a round about scenario.
V-D Discussions
LABEL:Fig:Rviz-display shows the result from real data in a roundabout scenario at a given time.
The hypothesis made in our experiments can easily be extended to more complex assumptions. The interaction distance of the can be set dynamically depending on the ego vehicle dynamic state. The cell discretization step can also be set dynamically instead of a constant. The further we are, the more the step increases. The free space can be replaced by a more reliable occupancy grid that integrates information over time and more sophisticated perception algorithms, e.g., deep learning-based, can be used of object detection and tracking. Extension to include vulnerable road users can also be done based on the same principles.
It is important to note that the illustrations shown for the two case studies are instantaneous representation of the world at a given time. For the T-intersection case, the decision of the ego vehicle to enter in the intersection relies on the fact that the protected area remains protected during the whole duration of the insertion maneuver. Our representation space should therefore also be used for prediction purposes where the predicted positions of the tracked objects are used instead.
 |
 |
 |
 |
VI Conclusion
In this work, an intermediate lane level information representation approach has been proposed with an interacting lane grid. Interacting lanes are extracted from the map and define the interactions encountered by the autonomous vehicle. These interacting areas enable the autonomous vehicle to focus on relevant space parts and to look for the corresponding potential interactions. This lane level grid is discretized and each cell is classified from most informative state: free, occupied, protected, safety zone, to less informative: hidden, out of field of view. This process for the cell grid classification has been depicted. We build information on space representation from spatial perception (as grids) and from objects. This information representation is provided for decision-making at the maneuver planner level.
In future work, objects detection, tracking and behavior prediction will be implemented in order to improve cells classification and situation predictions will be explored.
References
- [1] S. Ulbrich, T. Menzel, A. Reschka, F. Schuldt, and M. Maurer, “Defining and Substantiating the Terms Scene, Situation, and Scenario for Automated Driving,” in IEEE International Conference on Intelligent Transportation Systems, Sept. 2015, pp. 982–988.
- [2] K. Refaat, K. Ding, N. Ponomareva, and S. Ross, “Agent Prioritization for Autonomous Navigation,” arXiv:1909.08792 [cs], Sept. 2019.
- [3] C. Hubmann, J. Schulz, M. Becker, D. Althoff, and C. Stiller, “Automated Driving in Uncertain Environments: Planning With Interaction and Uncertain Maneuver Prediction,” IEEE Transactions on Intelligent Vehicles, vol. 3, no. 1, pp. 5–17, Mar. 2018.
- [4] S. Noh, “Decision-Making Framework for Autonomous Driving at Road Intersections: Safeguarding Against Collision, Overly Conservative Behavior, and Violation Vehicles,” IEEE Transactions on Industrial Electronics, vol. 66, no. 4, pp. 3275–3286, Apr. 2019.
- [5] C. Laugier, “Situation Awareness & Decision-making for Autonomous Driving,” in IEEE/RSJ International Conference on Intelligent Robots and Systems(IROS), Nov. 2019, pp. 1–25.
- [6] J. Moras, V. Cherfaoui, and P. Bonnifait, “Moving Objects Detection by Conflict Analysis in Evidential Grids,” in IEEE Intelligent Vehicles Symposium (IV), June 2011, pp. 1122–1127.
- [7] F. Poggenhans, J. Pauls, J. Janosovits, S. Orf, M. Naumann, F. Kuhnt, and M. Mayr, “Lanelet2: A high-definition map framework for the future of automated driving,” in 21st International Conference on Intelligent Transportation Systems (ITSC), Nov. 2018, pp. 1672–1679.
- [8] S. Ulbrich, T. Nothdurft, M. Maurer, and P. Hecker, “Graph-based context representation, environment modeling and information aggregation for automated driving,” in IEEE Intelligent Vehicles Symposium (IV), June 2014, pp. 541–547.
- [9] H. Mouhagir, V. Cherfaoui, R. Talj, F. Aioun, and F. Guillemard, “Using evidential occupancy grid for vehicle trajectory planning under uncertainty with tentacles,” in IEEEInternational Conference on Intelligent Transportation Systems (ITSC), Oct. 2017, pp. 1–7.
- [10] L. Sun, W. Zhan, C. Chan, and M. Tomizuka, “Behavior Planning of Autonomous Cars with Social Perception,” in IEEE Intelligent Vehicles Symposium (IV), June 2019, pp. 207–213.
- [11] P. Schorner, L. Tottel, J. Doll, and J. Zollner, “Predictive Trajectory Planning in Situations with Hidden Road Users Using Partially Observable Markov Decision Processes,” in IEEE Intelligent Vehicles Symposium (IV), June 2019, pp. 2299–2306.
- [12] C. Hubmann, N. Quetschlich, J. Schulz, J. Bernhard, D. Althoff, and C. Stiller, “A POMDP Maneuver Planner For Occlusions in Urban Scenarios,” in IEEE Intelligent Vehicles Symposium (IV), June 2019, pp. 2172–2179.
- [13] S. Hoermann, F. Kunz, D. Nuss, S. Renter, and K. Dietmayer, “Entering crossroads with blind corners. A safe strategy for autonomous vehicles,” in IEEE Intelligent Vehicles Symposium, June 2017, pp. 727–732.
- [14] P. Orzechowski, A. Meyer, and M. Lauer, “Tackling Occlusions & Limited Sensor Range with Set-based Safety Verification,” 2018 21st International Conference on Intelligent Transportation Systems (ITSC), pp. 1729–1736, Nov. 2018.
- [15] J. Michon, “A Critical View of Driver Behavior Models: What Do We Know, What Should We Do?” in Human Behavior and Traffic Safety. Springer US, 1985, pp. 485–524.
- [16] C. Hubmann, M. Aeberhard, and C. Stiller, “A generic driving strategy for urban environments,” in IEEEInternational Conference on Intelligent Transportation Systems (ITSC), Nov. 2016, pp. 1010–1016.
- [17] S. Ulbrich, A. Reschka, J. Rieken, S. Ernst, G. Bagschik, F. Dierkes, M. Nolte, and M. Maurer, “Towards a Functional System Architecture for Automated Vehicles,” arXiv:1703.08557 [cs], Mar. 2017.
- [18] O. Tas, F. Kuhnt, J. Zollner, and C. Stiller, “Functional system architectures towards fully automated driving,” in IEEE Intelligent Vehicles Symposium (IV), June 2016, pp. 304–309.
- [19] J. S. Albus, “4D/RCS: A reference model architecture for intelligent unmanned ground vehicles,” in AeroSense, July 2002, pp. 303–310.
- [20] I. Gheţa, M. Heizmann, A. Belkin, and J. Beyerer, “World modeling for autonomous systems,” in KI: Advances in Artificial Intelligence. Springer Berlin Heidelberg, 2010, pp. 176–183.
- [21] A. Furda and L. Vlacic, “Enabling Safe Autonomous Driving in Real-World City Traffic Using Multiple Criteria Decision Making,” IEEE Intelligent Transportation Systems Magazine, vol. 3, no. 1, pp. 4–17.
- [22] Z. Papp, C. Brown, and C. Bartels, “World modeling for cooperative intelligent vehicles,” in IEEE Intelligent Vehicles Symposium, June 2008, pp. 1050–1055.
- [23] M. Schreier, V. Willert, and J. Adamy, “Compact Representation of Dynamic Driving Environments for ADAS by Parametric Free Space and Dynamic Object Maps,” IEEE Transactions on Intelligent Transportation Systems, vol. 17, no. 2, pp. 367–384, Feb. 2016.
- [24] M. Bouton, A. Nakhaei, K. Fujimura, and M. Kochenderfer, “Scalable Decision Making with Sensor Occlusions for Autonomous Driving,” in IEEE International Conference on Robotics and Automation (ICRA), May 2018, pp. 2076–2081.
- [25] P. Narksri, E. Takeuchi, Y. Ninomiya, and K. Takeda, “Crossing Blind Intersections from a Full Stop Using Estimated Visibility of Approaching Vehicles,” in IEEE Intelligent Transportation Systems Conference (ITSC), Oct. 2019, pp. 2427–2434.
- [26] C. Burca, “Determining visibility distances based on a dynamic field of view of a vehicle,” in U.S. Patent 0001877 A1, issued January, 2020.
- [27] S. Shalev-Shwartz, S. Shammah, and A. Shashua, “On a Formal Model of Safe and Scalable Self-driving Cars,” arXiv:1708.06374v6, Oct. 2018.
- [28] M. Yu, R. Vasudevan, and M. Johnson-Roberson, “Occlusion-Aware Risk Assessment for Autonomous Driving in Urban Environments,” IEEE Robotics and Automation Letters, vol. 4, pp. 2235–2241, Apr. 2019.
- [29] D. Zermas, I. Izzat, and N. Papanikolopoulos, “Fast segmentation of 3D point clouds: A paradigm on LiDAR data for autonomous vehicle applications,” in IEEE International Conference on Robotics and Automation, May 2017, pp. 5067–5073.