The DUVET Survey: Direct -based metallicity mapping of metal-enriched outflows and metal-poor inflows in Mrk 1486
Abstract
We present electron temperature () maps for the edge-on system Mrk 1486, affording “direct-method” gas-phase metallicity measurements across (4.1 kpc) along the minor axis and (6.9 kpc) along the major axis. These maps, enabled by strong detections of the [O iii] 4363 auroral emission line across a large spatial extent of Mrk 1486, reveal a clear negative minor axis gradient in which temperature decreases with increasing distance from the disk plane. We find that the lowest metallicity spaxels lie near the extremes of the major axis, while the highest metallicity spaxels lie at large spatial offsets along the minor axis. This is consistent with a picture in which low metallicity inflows dilute the metallicity at the edges of the major axis of the disk, while star formation drives metal-enriched outflows along the minor axis. We find that the outflow metallicity in Mrk 1486 is 0.20 dex (1.6 times) higher than the average ISM metallicity, and more than 0.80 dex (6.3 times) higher than metal-poor inflowing gas, which we observe to be below 5 % . This is the first example of metallicity measurements made simultaneously for inflowing, outflowing, and inner disk ISM gas using consistent –based methodology. These measurements provide unique insight into how baryon cycle processes contribute to the assembly of a galaxy like Mrk 1486.
1 Introduction
The cycle of baryons into galaxies via accretion and back out via outflows is one of the most important regulators of galaxy evolution (Somerville & Davé, 2015; Tumlinson et al., 2017). Metal enrichment during this cycle is a critical element of galaxy assembly. Simulations predict inflows of metal-poor gas along the major axis of the galaxy, while metal-enriched outflows are ejected along the minor axis (Nelson et al., 2019; Péroux et al., 2020; Kim et al., 2020; Mitchell et al., 2020). However, this picture remains poorly constrained by observations.
Gas-phase metallicities in star-forming galaxies are widely derived from emission line ratios (e.g. Maiolino & Mannucci 2019; Kewley et al. 2019b). Although widely used, strong-line methods to measure metallicity are sensitive to assumptions surrounding the ionization conditions and relative abundance ratios. This approach carries large systematic uncertainties that are difficult to quantify (e.g. Kewley & Ellison, 2008; Berg et al., 2011). Nevertheless, metallicity measurements have been compiled for large samples of galaxies with resultant scaling relations offering indirect evidence of metal-poor inflows and metal-enriched outflows (Tremonti et al., 2004; Dalcanton et al., 2004; Mannucci et al., 2010; Kacprzak et al., 2016; Sanders et al., 2020).
Variations in the ionization conditions of halo gas at large separations from the inner disk make it challenging to reliably map metallicity throughout the halo with strong-line methods. Quasar absorption lines can be used to measure line-of-sight circumgalactic medium (CGM) metallicity, although suitable sightlines are rare and these samples can only be assembled in a statistical way. Currently there is no consensus as to whether the CGM metallicity varies as a function of azimuthal angle from major to minor axis as observational evidence is mixed (Péroux et al., 2016; Pointon et al., 2019; Kacprzak et al., 2019; Lehner et al., 2020; Lundgren et al., 2021; Wendt et al., 2021).
Chisholm et al. (2018) directly measured outflow metallicities from UV absorption lines for a small sample of local galaxies, finding these to be metal-enriched relative to emission line measurements of the interstellar medium (ISM) metallicity. However, systematic offsets are widely observed between different metallicity measurement techniques (e.g. Kewley & Ellison, 2008; Maiolino & Mannucci, 2019). Moreover, it is difficult to interpret how the geometry of the gas may affect the metal loading of the outflows.
The gold standard for emission-line abundance studies is the so-called “direct method” in which metallicity is determined using an electron temperature () measurement (Pérez-Montero, 2017). in H ii regions reflects the balance of heating from the ionization source and radiative cooling which is highly metallicity dependent. can be measured via the ratio of a so-called “auroral” emission line (most commonly [O iii] 4363) to a strong line. Auroral lines are, however, 50-100 fainter than strong lines. Accordingly, the direct method is very challenging to apply, even at low redshift, and spatially resolved measurements remain rare (Berg et al., 2013, 2020; Li et al., 2013; Croxall et al., 2015, 2016; Ho et al., 2019; Leung et al., 2020; Cameron et al., 2021).
In this letter we map direct method abundance variations, using Keck/KCWI observations of edge-on starburst galaxy Mrk 1486, along both the major and minor axes, providing unique constraints simultaneously on the metallicity of inflowing and outflowing gas, as well as the average ISM. These abundance measurements, derived from a single self-consistent method, represent a powerful new method for studying metal enrichment throughout the baryon cycle.
2 Observations and Data Reduction
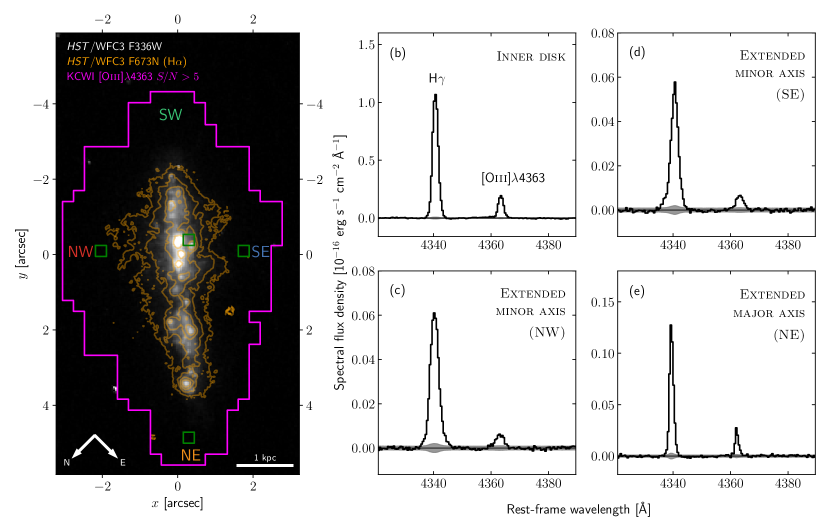
Mrk 1486 is a star-forming galaxy at (-band magnitude ) with stellar mass log( and star-formation rate SFR yr-1 (Chisholm et al., 2018). In HST/WFC3 imaging, Mrk 1486 has morphology consistent with a disk-like galaxy that is oriented almost directly edge-on (Figure 1). Narrow-band imaging shows extended H emission along the minor axis and previous studies have shown that this is consistent with bipolar outflows (Duval et al., 2016). The metallicity reported for Mrk 1486 (; Östlin et al. 2014) is very low for its stellar mass, consistent with recent accretion of metal-poor gas. Together, these suggest Mrk 1486 is a unique target for studying baryon cycle gas flows.
Integral field unit (IFU) observations of Mrk 1486 were carried out on 2020 March 22nd with Keck/KCWI as part of the Deep near-UV observations of Entrained gas in Turbulent galaxies (DUVET) survey (Fisher et al., in prep.) in good seeing conditions ( at 5000 Å). The large IFU slicer setting was used giving a spatial sampling of over a field-of-view. Two configurations of the blue medium-dispersion grating (BM) were used (“blue” central wavelength: 4180 Å; “red” central wavelength: 4850 Å) providing continuous spectral coverage from 3731 Å to 5284 Å111The two settings overlap between 4408 Å and 4627 Å with spectral resolution , affording coverage of emission lines from [O ii] 3726, 3729 to [O iii] 5007. Total integration for the red grating was 2260 s across seven long exposures ( s and s) and two short exposures ( s). The blue grating setting received s exposures for 2100 s of total integration.
The data were reduced with the KCWI Data Extraction and Reduction Pipeline v1.1.0. Long exposures in the red grating setting saturated [O iii] 5007 in some spaxels. Saturated spaxels were identified based on the [O iii] 5007/4959 ratio (which should have a constant value of ) and spectral pixels proximal to [O iii] 5007 were replaced by measurements from the shorter exposures (McPherson et al. in prep.).
Exposures were spatially aligned using a linear interpolation of the H flux which was detected and unsaturated in all frames (short and long, red and blue). Sky subtraction was performed within the pipeline using an off-object sky frame taken immediately before or after a set of exposures.
3 Spectral fitting
3.1 Continuum subtraction
We perform four-moment fits to the stellar continuum with model spectra from the Binary Population and Spectral Synthesis code (BPASS, v2.2.1; Eldridge et al. 2017; Stanway & Eldridge 2018222BPASS model spectra can be easily handled with the purpose built python package hoki (https://github.com/HeloiseS/hoki; Stevance et al. 2020)) for both grating settings of each spaxel with pPXF (Cappellari, 2017), adopting the ‘135_300’ IMF (refer to Table 1 in Stanway & Eldridge 2018). Since we detect many faint emission lines in our KCWI data, we first run a continuum fit on the summed global spectrum of Mrk 1486 in which the iterative sigma-clipping approach of Cappellari et al. (2002)333This is contained within the pPXF package and can be used by setting the clean=True keyword in the main pPXF routine. is employed to mask out these faint emission features. We apply these masks to individual spaxels during subsequent fitting to minimise the impact of faint emission features on the template fitting.
3.2 Emission line fitting
Emission line fits are performed on the continuum-subtracted data for each spaxel according to the following procedure: velocity (or redshift, ) and velocity dispersion () is obtained by simultaneously fitting single-component Gaussian profiles to the H, H, and [O iii] 4959, 5007, emission features in the red setting using a -minimisation procedure. Treating these values as fixed for that spaxel, fluxes are then fit individually for each emission line, using a 30 Å sub-interval of the complete spectrum centred on the expected centroid of the line at the best-fit redshift. We fit the [O ii] 3726, 3729, [Ne iii] 3869, H, H, and [O iii] 4363 lines in the blue grating setting, and the H, [O iii] 4363, H, [O iii] 4959, [O iii] 5007 lines in the red grating setting.444At metallicities above , [O iii] 4363 can be contaminated by emission from [Fe ii] 4360. Mrk 1486 is, however, much lower metallicity and shows no evidence of such contamination. [O ii] 3726, 3729 doublet lines are fit simultaneously, since they are partially blended at this resolution; no restrictions are imposed on the flux ratio. Additionally, we fit the [O iii] 5007 and [O iii] 4959 fluxes independently to verify that the saturation of [O iii] 5007 has been appropriately corrected for in the data reduction (see Section 2). We corrected for dust extinction based on the H/H flux ratio observed in the red grating setting, assuming an intrinsic Balmer decrement of (Dopita & Sutherland, 2003; Groves et al., 2012) and a Cardelli et al. (1989) extinction law with . We found a peak extinction of () on the disk. At large separations, was commonly observed, suggesting little extincting dust is present in the outflows and inflows, perhaps due to the low metallicity of the system.
Line flux uncertainties are estimated using a bootstrapping method in which the observed spectrum is perturbed at each spectral pixel by a normal distribution with standard deviation derived from the KCWI variance cube. We measure fluxes for 100 such synthetic spectra and the standard deviation of the resulting flux distribution is adopted as the 1- flux uncertainty. Additionally, uncertainties from the reddening correction were propagated through to the line ratios and derived properties presented throughout the remainder of the paper.
4 Results
4.1 Electron temperature
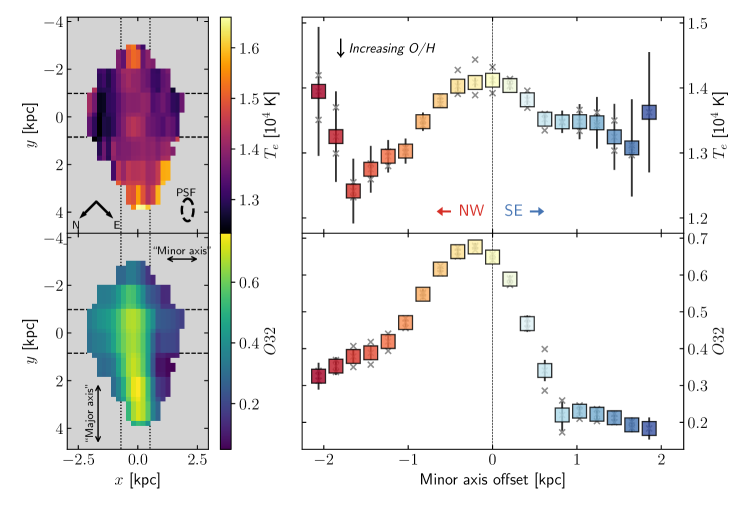
Our Keck/KCWI observations afford detections of the critical [O iii] auroral line at per spaxel over a spatial extent of (6.9 kpc) along the major-axis and (4.1 kpc) along the minor-axis, well beyond (Figure 1). We derive an electron temperature () map for Mrk 1486 from the [O iii] 4363 / 5007 emission line ratio according to the relation set out by Nicholls et al. (2020), with resultant temperatures in the range (Figure 2 top left panel). The edge-on orientation of Mrk 1486 enables us to derive profiles along and above the disk plane with consistent methodology, providing unique direct-method metallicity measurements of inflowing and outflowing gas.
The upper right panel of Figure 2 shows our derived minor axis profile for a wide strip centred on the peak KCWI white light flux. is seen to peak on the plane of the disk at and decreases in both directions. This decrease is most significant in the Northwest (NW; red) direction, dropping by K to at kpc. In the Southeast (SE; blue) direction we instead measure a decrease of K to at kpc. In both directions, the gradient in reverses in the final resolution elements.
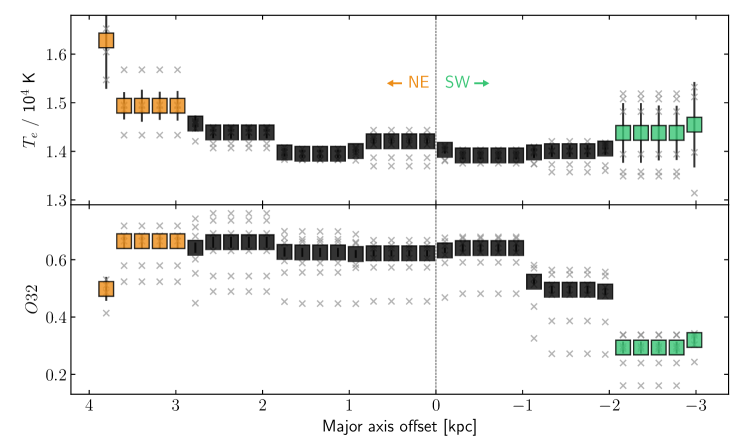
Our derived major axis profile is shown in the lower panels of Figure 2. The highest temperature values preferentially reside at larger radius, consistent with a negative radial metallicity gradient.
Recent studies have shown that metallicity measurements derived from only a single temperature measurement can result in misleading metallicity trends if the ionization conditions of the emitting H ii regions are not constant (Yates et al., 2020; Cameron et al., 2021). Figure 2, therefore, shows the 555 = log ([O iii] 5007 / [O ii] 3726, 3729) profile along the minor and major axes. This ratio is a commonly used ionization parameter (log ) diagnostic. There is a negative minor axis gradient, consistent with the fiducial assumption that ionization parameter will be lower further from the disk. Since our DUVET observations of Mrk 1486 yield an auroral line ratio only for [O iii], in the next sections we use predictions from photoionization modelling to explore the contribution of ionization parameter to the observed temperature gradient, and ultimately infer metallicity variations.
4.2 Mappings model grids
We compare observed [O iii] 4363 / 5007 and line ratios from Mrk 1486 to predictions from Mappings V model grids (A. D. Thomas; private communication). These models were computed with Mappings V (Sutherland & Dopita, 2017) for a STARBURST99 continuous star-formation model, ensuring a fully populated IMF, (Leitherer et al., 2014) over a range of nebular metallicity, ionization parameter, and ISM pressure values.
We find that while the ratio is dependent on pressure in high metallicity systems, the effect is minimal below , which our measurements strongly favour for Mrk 1486. What little pressure dependence exhibits at low metallicity is strongest at high pressure. However, our measurements of the [O ii] 3729/3726 doublet ratio, which can be used as an effective pressure diagnostic (Kewley et al., 2019a), strongly favour low pressure (log) throughout Mrk 1486. Thus, we conclude that our observed temperature variations are not caused by pressure variations. We measure a median density of cm-3 and infer a median pressure of log. For the remainder of the paper, we fix the pressure to log in our model grids.666The model grids were computed for 12 pressure values, of which log, 6.2 are nearest our observed pressure. Since the effect of pressure on the ratio is so small at low metallicity, adopting either of these two values ultimately makes no difference to our results.
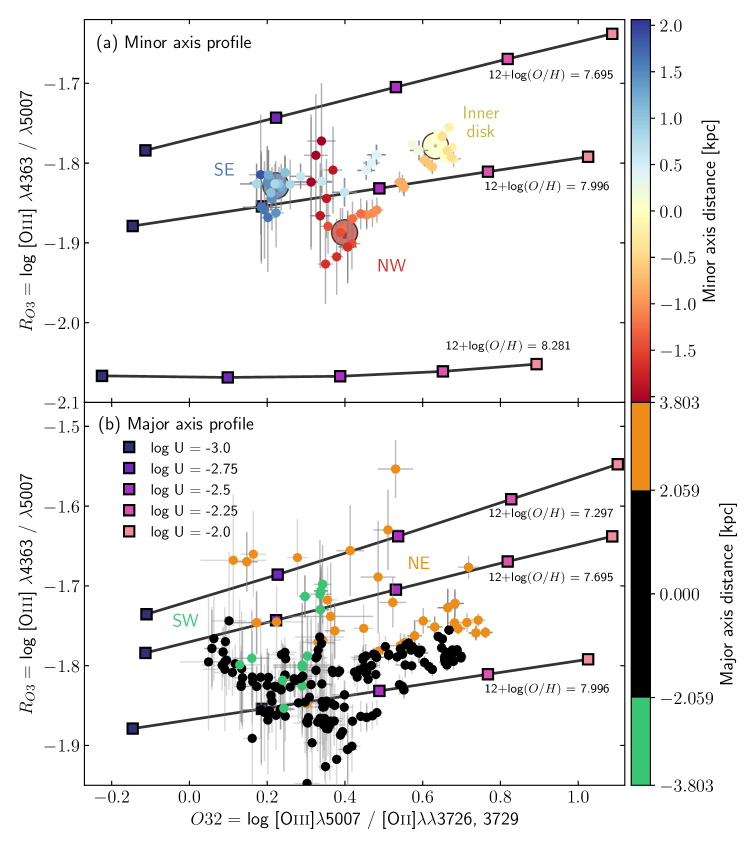
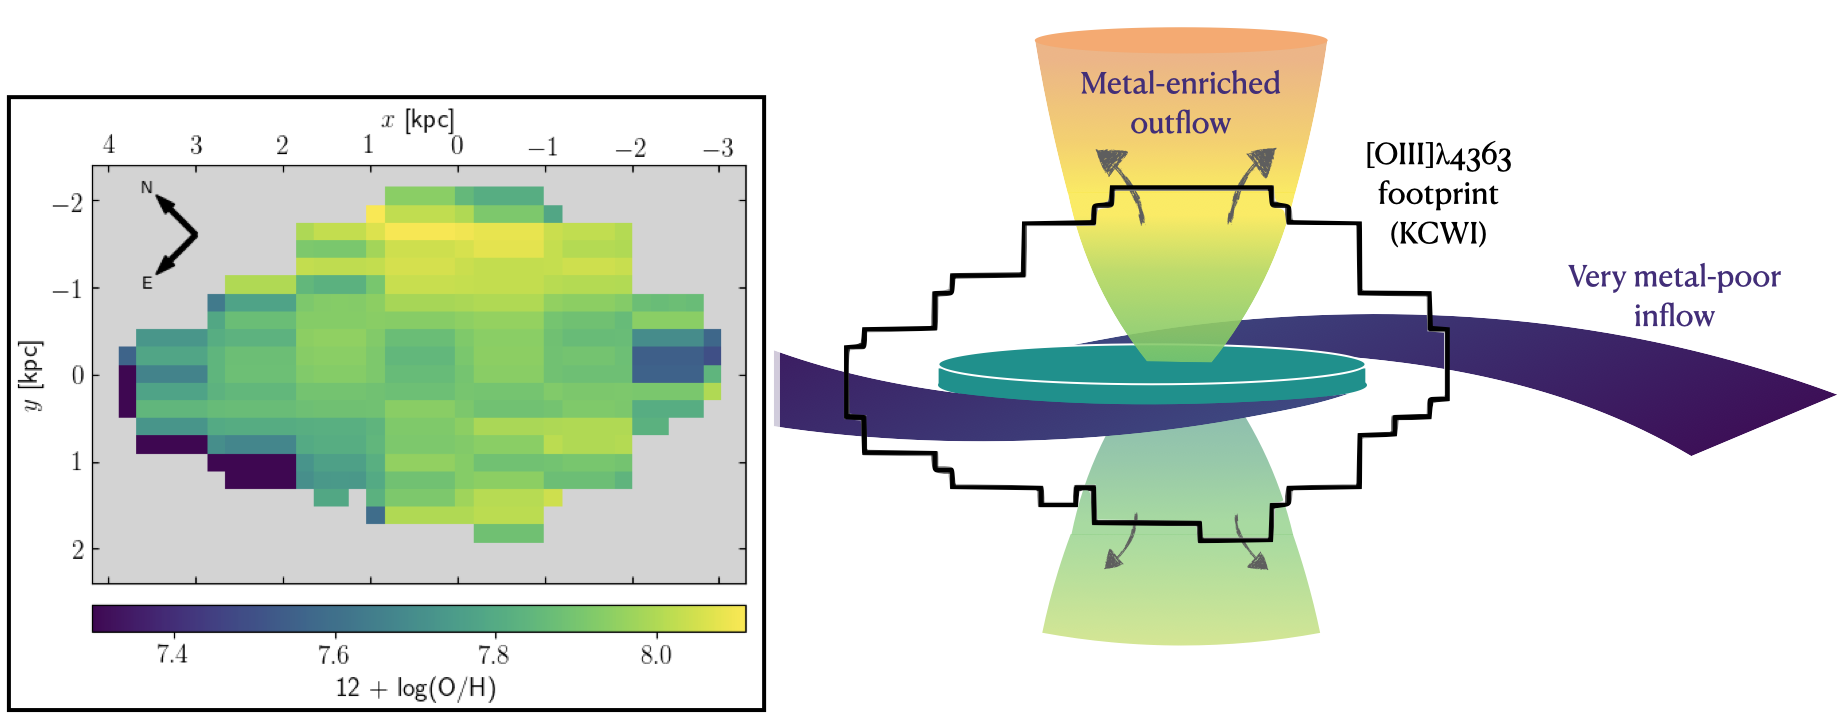
Figure 3 shows how predictions for the auroral line ratio (which traces ) and the ratio (which traces log ) compare to the observed values along the minor and major axes of Mrk 1486. For visual clarity, we plot the models only for four values of metallicity, each at five different values of ionization parameter. The left panel of Figure 4 then shows a metallicity map for Mrk 1486 derived from interpolation of these grids, performed with a -minimisation procedure based on the and line ratios. The lowest metallicities we infer have , lying beyond the low metallicity extreme of our model grids. Inferring oxygen abundances in this extremely low metallicity regime is very susceptible to modelling uncertainties and has extremely few empirical constraints from observations (e.g. Senchyna et al., 2019; Stanway & Eldridge, 2019). Direct measurements from a lower ionization zone (e.g. (Oii)) are required to robustly determine the oxygen abundance of most metal-poor spaxels in Mrk 1486. We instead adopt as an upper limit in these cases for remainder of this analysis.
4.3 Minor axis metallicity variation: metal-enriched outflows
In panel (a) of Figure 3 we show observed minor axis points from a wide region centred on the peak of the white light flux, with the color bar indicating the projected offset. Particularly notable is the NW (red) measurements decreasing steeply toward lower . This suggests that the metallicity increases out to a minor axis offset of kpc in this direction.
The increase in minor-axis metallicity is clearly seen in the metallicity map (Figure 4). The highest metallicities we observe in Mrk 1486 are offset from the disk plane along the minor axis, particularly in this NW direction. This is consistent with a scenario in which star formation activity drives metal-enriched outflows (see Figure 4 right panel), which has been widely invoked to explain metallicity scaling relations (e.g. Tremonti et al., 2004; Mannucci et al., 2010; Sanders et al., 2020). The maximum metallicity measured along the minor axis ( at kpc) is 1.6 times (0.20 dex) higher than the luminosity-weighted average metallicity of the inner disk.
Chisholm et al. (2018) used UV absorption line measurements from HST/COS to measure outflow metallicities for a sample of low-redshift galaxies including Mrk 1486. Their data yield a much higher outflow metallicity for Mrk 1486 of ( assuming a solar value of ).
Using our measurement of the ISM metallicity, this yields an outflow enrichment factor of for Mrk 1486.777Chisholm et al. (2018) use the ISM metallicity determination from Östlin et al. (2014) which results in a larger quoted value of for Mrk 1486 While this value is substantially higher than ours, we note that different metallicity measurement techniques are prone to systematic offsets and values obtained via different methods are difficult to compare (e.g. Kewley & Ellison, 2008; Maiolino & Mannucci, 2019). Furthermore, the outflow metallicity measured by Chisholm et al. (2018) is derived from kinematically offset absorption lines observed for the aperture of COS, centred on the plane of the disk. This measurement probes gas that is flowing along the line-of-sight towards us. Our DUVET observations instead probe outflowing gas along a projected spatial offset. It is not simple to understand how these differences in geometry would affect the metallicity.
The metallicity increase is milder in the SE direction, only reaching a maximum value of at kpc. This suggests that the bipolar outflows in Mrk 1486 may be asymmetric, and that the NW outflow is perhaps more enriched at this point in the evolution of Mrk 1486. In both minor axis directions, we observe that the metallicity decreases for the few spaxels at the largest offsets (see also Figure 2 upper right panel). This could be an indication of inhomogeneity within an outflow lobe, suggesting a clumpy structure. However, we strongly caution against over interpreting these few data points. These are our faintest spaxels and the [O iii]4363 peak line flux is only 10-19 erg s-1 cm-2 Å-1. At these low fluxes, systematic errors from sky subtraction may be important, which are not currently included in our error bars. Hence we stop short of drawing strong conclusions from these points without deeper data.
4.4 Major axis metallicity variation: metal-poor inflows
In panel (b) of Figure 3, all observed spaxels are plotted with a discrete colorbar distinguishing points within the major-axis 90% -band flux radius (black) from those beyond it (orange and green). We find that spaxels nearer to the core are generally observed to have higher metallicity. Almost 95 % (17/18) of points consistent with very low metallicity gas () are situated outside . For an edge-on galaxy, a line-of-sight measurement at a given projected radius along the major-axis will sample emission from a range of physical radii from the galaxy center. At low projected radius, observed line-of-sight emission will be dominated by gas from the inner disk, which is likely to have been enriched by recent star formation activity. If a disk is experiencing accretion, at the largest projected radii the emission may arise from a mixture of gas in the outer stellar disk, and dilution from metal-poor inflows. These measured metallicities are thus likely to be over-estimates of the metallicity of accreting gas.
Near the major axis NE extreme we observe a number of points with . This upper limit is at least 0.6 dex lower than the ISM metallicity (). Our observed major axis metallicity trend does not stabilise before the coverage cuts off, suggesting that even lower metallicities might be observed at larger radii. This indicates that the sources of the gas inflow into Mrk 1486 are likely below 5% . From our measurements we report that outflowing gas from Mrk 1486 is at least 6.3 times (0.8 dex) more metal rich than inflowing gas, noting that this value represents a lower limit. Direct measurements from a lower ionisation zone (e.g. (Oii)) and improved spatial coverage from deeper data will be important in better constraining this value.
4.5 Implications for galaxy evolution
Metal-enriched outflows and metal-poor inflows are frequently invoked as an important mechanism for explaining a number of galaxy observables including scaling relations (e.g. Tremonti et al., 2004; Dalcanton et al., 2004; Mannucci et al., 2010; Sanders et al., 2020) and metallicity gradients (Sharda et al., 2021b, a). The difference between our and those observed in Chisholm et al. (2018) are roughly a factor of 2–3. This is significant compared to differences in analytic predictions of what values of are required to match observed Mass-Metallicity Relations (MZR), particularly in the mass range of M⊙. We note that the difference between these two observations, as well as the asymmetry in we observe in Mrk 1486, are both reasons motivating the dire need for observations like those reported here to understand basic observables like the MZR.
Metal loss from metal-enriched outflows is predicted to be a critical parameter in determining metallicity gradients. The model outlined by Sharda et al. (2021b) quantifies this by the so-called “yield reduction factor”, . Larger values of imply that metals are mixed efficiently with the ISM prior to ejection, and hence metal retention is higher. This results in steeper metallicity gradients and a larger possible range of gradients. Adopting mass loading factors (Heckman et al., 2015; Chisholm et al., 2018), our measurement of from Mrk 1486 yields an estimated value in the range (refer to Appendix A in Sharda et al. 2021a). This predicts galaxies with masses 108.5 – 109.5 to have steeper gradients than those observed in large IFU surveys (Figure 2 in Sharda et al., 2021a). On the other hand, models with in our measured range reproduce global metallicity scaling relations more readily. We note, however, that Mrk 1486 is a multiple sigma outlier below the global MZR, and it remains unclear how appropriate these generalized models are for starbursting galaxies. Finally, we note that our observations probe only the warm (104 K) ionized outflowing phase. Thus, our estimates of the outflow metallicity do not include metals in hotter phases, which may be significant (e.g. Lopez et al., 2020). Any metal enrichment in hot phase outflows would decrease for the same mass loading factor and, in the absence of hot phase outflow measurements, the quoted value of should be considered as an upper limit.
5 Discussion
A basic expectation of the baryon cycle is that gas expelled as outflows will be chemically enriched relative to the inflowing gas that fuels star formation (Tumlinson et al., 2017, and references therein). However, practical challenges associated with measuring chemical abundances mean there is an absence of observations directly comparing the abundances in these regimes.
Mrk 1486 presents a unique opportunity to study chemical processing throughout the baryon cycle. Previous studies have shown that the extended minor-axis emission of Mrk 1486 is consistent with bipolar outflowing nebulae (Duval et al., 2016). Similarly, kinematic line-of-sight observations are consistent with outflows (Chisholm et al., 2015, 2018). Mrk 1486 is offset below the local mass-metallicity relation by multiple sigma (Östlin et al., 2014; Curti et al., 2020). Considering also the high SFR of Mrk 1486, this offset can be explained by the recent accretion of large amounts of metal-poor gas (e.g. Mannucci et al., 2010). Given the thin disk observed in starlight (Figure 1) and well-ordered, disk-like rotation field, it is unlikely Mrk 1486 is undergoing a major merger. We, thus, conclude it is likely experiencing a period of gas accretion that is fuelling a starburst, which is driving bipolar outflows.
Due to the edge-on orientation of Mrk 1486, our DUVET observations map direct method metallicity at all azimuthal angles out to 2 kpc away from the inner disk, well beyond the -band 90% flux radius (Figure 4). These measurements fit remarkably well with the basic baryon cycle scenario: (1) our lowest metallicity points lie at the major axis extremes (presumably dominated by inflows); (2) our highest metallicity points lie at large offsets along the minor axis nebulae (likely outflows). Moreover, in mapping abundances with a consistent direct method technique, we are uniquely placed to provide constraints on the degree of chemical enrichment arising from gas processing from inflow to outflow in Mrk 1486. We measure a factor of 6.3 metallicity increase (0.80 dex) from the major axis extreme to the minor axis extreme.
Péroux et al. (2020) found a similar azimuthal metallicity dependence in TNG50 and EAGLE simulated galaxies at high impact parameters ( kpc). However, they found this dependence decreases at lower separations and disappears almost entirely within kpc, in conflict with our measurements of Mrk 1486. There is either a very significant azimuthal mixing process between a few-to-25 kpc, or alternatively the wind material does not extend to the distances probed in the simulations. We note that there is marginal evidence of a decrease in the metallicity at the largest distance along the minor-axis, but this hinges on interpretation of extremely faint emission lines. An alternate possibility is that the simulations could be not appropriate to describe galaxies like Mrk 1486, which are in a starburst phase.
Previous observational studies on the azimuthal dependence of metallicity in galaxy haloes from quasar absorption line measurements have not reached a clear consensus (e.g. Pointon et al., 2019; Wendt et al., 2021). However, the requirement for a serendipitous quasar along the line-of-sight means that these measurements must be compiled in a statistical way, averaged across a sample of galaxies. Furthermore, absorption line measurements tend to be made at larger separations (ranging from kpc), and low metallicity regions can be masked by high metallicity systems along the line-of-sight where metal absorption is more prominent. Based on our measurements of Mrk 1486, there is a clear azimuthal metallicity variation within the inner few kpc from the major to the minor axis for this single low metallicity galaxy. More observations like ours are direly needed to determine the extent to which this is representative of the broader galaxy population.
At the extremes of the major axis, we observe a number of points with metallicities below 5–10% solar (Figures 3 & 4). Since [O iii] 4363 emission is biased toward low metallicity gas, if the minor axis nebulae were a mixture of high and low metallicity gas, we would expect to observe low metallicity points, similar to that seen along the major axis. The absence of these in our observations provide evidence for the lack of minor-axis accretion. Instead, our data are consistent with a co-planar accretion model. Moreover, we note that inflowing gas along the major axis is likely mixed with disk gas in our observations meaning our measurement is likely an upper limit on the metallicity of inflowing gas. This suggests the degree of baryon cycle enrichment could be higher than the 0.80 dex quoted above. Furthermore, it may imply that extremely low metallicity sources of gas can persist even at .
We conclude by reiterating that Mrk 1486 is in a starburst phase and hence, by definition, not a typical galaxy. We therefore advise caution in extending conclusions presented here to the broader galaxy population. Nevertheless, while observational studies and simulations often focus on “average” galaxies, we have highlighted here the power of studying a low metallicity, high SFR galaxy such as Mrk 1486 where the key [O iii] 4363 emission line can be mapped out in detail. Galaxy simulations providing testable predictions for starburst galaxies like Mrk 1486 would provide a useful comparison for single object studies such as this. Moreover, broader observational studies are required to understand whether findings presented here for Mrk 1486 are common amongst other starbursting galaxies, and to what extent they are representative of local galaxies with lower SFR.
References
- Berg et al. (2020) Berg, D. A., Pogge, R. W., Skillman, E. D., et al. 2020, arXiv e-prints, arXiv:2001.05002. https://arxiv.org/abs/2001.05002
- Berg et al. (2013) Berg, D. A., Skillman, E. D., Garnett, D. R., et al. 2013, ApJ, 775, 128, doi: 10.1088/0004-637X/775/2/128
- Berg et al. (2011) Berg, D. A., Skillman, E. D., & Marble, A. R. 2011, ApJ, 738, 2, doi: 10.1088/0004-637X/738/1/2
- Cameron et al. (2021) Cameron, A. J., Yuan, T., Trenti, M., Nicholls, D. C., & Kewley, L. J. 2021, MNRAS, 501, 3695, doi: 10.1093/mnras/staa3757
- Cappellari (2017) Cappellari, M. 2017, MNRAS, 466, 798, doi: 10.1093/mnras/stw3020
- Cappellari et al. (2002) Cappellari, M., Verolme, E. K., van der Marel, R. P., et al. 2002, ApJ, 578, 787, doi: 10.1086/342653
- Cardelli et al. (1989) Cardelli, J. A., Clayton, G. C., & Mathis, J. S. 1989, ApJ, 345, 245, doi: 10.1086/167900
- Chisholm et al. (2018) Chisholm, J., Tremonti, C., & Leitherer, C. 2018, MNRAS, 481, 1690, doi: 10.1093/mnras/sty2380
- Chisholm et al. (2015) Chisholm, J., Tremonti, C. A., Leitherer, C., et al. 2015, ApJ, 811, 149, doi: 10.1088/0004-637X/811/2/149
- Croxall et al. (2015) Croxall, K. V., Pogge, R. W., Berg, D. A., Skillman, E. D., & Moustakas, J. 2015, ApJ, 808, 42, doi: 10.1088/0004-637X/808/1/42
- Croxall et al. (2016) —. 2016, ApJ, 830, 4, doi: 10.3847/0004-637X/830/1/4
- Curti et al. (2020) Curti, M., Mannucci, F., Cresci, G., & Maiolino, R. 2020, MNRAS, 491, 944, doi: 10.1093/mnras/stz2910
- Dalcanton et al. (2004) Dalcanton, J. J., Yoachim, P., & Bernstein, R. A. 2004, ApJ, 608, 189, doi: 10.1086/386358
- Dopita & Sutherland (2003) Dopita, M. A., & Sutherland, R. S. 2003, Astrophysics of the diffuse universe
- Duval et al. (2016) Duval, F., Östlin, G., Hayes, M., et al. 2016, A&A, 587, A77, doi: 10.1051/0004-6361/201526876
- Eldridge et al. (2017) Eldridge, J. J., Stanway, E. R., Xiao, L., et al. 2017, PASA, 34, e058, doi: 10.1017/pasa.2017.51
- Groves et al. (2012) Groves, B., Brinchmann, J., & Walcher, C. J. 2012, MNRAS, 419, 1402, doi: 10.1111/j.1365-2966.2011.19796.x
- Heckman et al. (2015) Heckman, T. M., Alexandroff, R. M., Borthakur, S., Overzier, R., & Leitherer, C. 2015, ApJ, 809, 147, doi: 10.1088/0004-637X/809/2/147
- Ho et al. (2019) Ho, I. T., Kreckel, K., Meidt, S. E., et al. 2019, ApJ, 885, L31, doi: 10.3847/2041-8213/ab4feb
- Kacprzak et al. (2019) Kacprzak, G. G., Pointon, S. K., Nielsen, N. M., et al. 2019, ApJ, 886, 91, doi: 10.3847/1538-4357/ab4c3c
- Kacprzak et al. (2016) Kacprzak, G. G., van de Voort, F., Glazebrook, K., et al. 2016, ApJ, 826, L11, doi: 10.3847/2041-8205/826/1/L11
- Kewley & Ellison (2008) Kewley, L. J., & Ellison, S. L. 2008, ApJ, 681, 1183, doi: 10.1086/587500
- Kewley et al. (2019a) Kewley, L. J., Nicholls, D. C., Sutherland, R., et al. 2019a, ApJ, 880, 16, doi: 10.3847/1538-4357/ab16ed
- Kewley et al. (2019b) Kewley, L. J., Nicholls, D. C., & Sutherland, R. S. 2019b, ARA&A, 57, 511, doi: 10.1146/annurev-astro-081817-051832
- Kim et al. (2020) Kim, C.-G., Ostriker, E. C., Somerville, R. S., et al. 2020, ApJ, 900, 61, doi: 10.3847/1538-4357/aba962
- Lehner et al. (2020) Lehner, N., Berek, S. C., Howk, J. C., et al. 2020, ApJ, 900, 9, doi: 10.3847/1538-4357/aba49c
- Leitherer et al. (2014) Leitherer, C., Ekström, S., Meynet, G., et al. 2014, ApJS, 212, 14, doi: 10.1088/0067-0049/212/1/14
- Leung et al. (2020) Leung, G. C. K., Coil, A. L., Rupke, D. S. N., & Perrotta, S. 2020, arXiv e-prints, arXiv:2011.09587. https://arxiv.org/abs/2011.09587
- Li et al. (2013) Li, Y., Bresolin, F., & Kennicutt, Robert C., J. 2013, ApJ, 766, 17, doi: 10.1088/0004-637X/766/1/17
- Lopez et al. (2020) Lopez, L. A., Mathur, S., Nguyen, D. D., Thompson, T. A., & Olivier, G. M. 2020, ApJ, 904, 152, doi: 10.3847/1538-4357/abc010
- Lundgren et al. (2021) Lundgren, B. F., Creech, S., Brammer, G., et al. 2021, ApJ, 913, 50, doi: 10.3847/1538-4357/abef6a
- Maiolino & Mannucci (2019) Maiolino, R., & Mannucci, F. 2019, A&A Rev., 27, 3, doi: 10.1007/s00159-018-0112-2
- Mannucci et al. (2010) Mannucci, F., Cresci, G., Maiolino, R., Marconi, A., & Gnerucci, A. 2010, MNRAS, 408, 2115, doi: 10.1111/j.1365-2966.2010.17291.x
- Mitchell et al. (2020) Mitchell, P. D., Schaye, J., & Bower, R. G. 2020, MNRAS, 497, 4495, doi: 10.1093/mnras/staa2252
- Nelson et al. (2019) Nelson, D., Pillepich, A., Springel, V., et al. 2019, MNRAS, 490, 3234, doi: 10.1093/mnras/stz2306
- Nicholls et al. (2020) Nicholls, D. C., Kewley, L. J., & Sutherland, R. S. 2020, PASP, 132, 033001, doi: 10.1088/1538-3873/ab6818
- Östlin et al. (2014) Östlin, G., Hayes, M., Duval, F., et al. 2014, ApJ, 797, 11, doi: 10.1088/0004-637X/797/1/11
- Pérez-Montero (2017) Pérez-Montero, E. 2017, PASP, 129, 043001, doi: 10.1088/1538-3873/aa5abb
- Péroux et al. (2020) Péroux, C., Nelson, D., van de Voort, F., et al. 2020, MNRAS, 499, 2462, doi: 10.1093/mnras/staa2888
- Péroux et al. (2016) Péroux, C., Quiret, S., Rahmani, H., et al. 2016, MNRAS, 457, 903, doi: 10.1093/mnras/stw016
- Pointon et al. (2019) Pointon, S. K., Kacprzak, G. G., Nielsen, N. M., et al. 2019, ApJ, 883, 78, doi: 10.3847/1538-4357/ab3b0e
- Sanders et al. (2020) Sanders, R. L., Shapley, A. E., Jones, T., et al. 2020, arXiv e-prints, arXiv:2009.07292. https://arxiv.org/abs/2009.07292
- Senchyna et al. (2019) Senchyna, P., Stark, D. P., Chevallard, J., et al. 2019, MNRAS, 488, 3492, doi: 10.1093/mnras/stz1907
- Sharda et al. (2021a) Sharda, P., Krumholz, M. R., Wisnioski, E., et al. 2021a, MNRAS, 504, 53, doi: 10.1093/mnras/stab868
- Sharda et al. (2021b) —. 2021b, MNRAS, 502, 5935, doi: 10.1093/mnras/stab252
- Somerville & Davé (2015) Somerville, R. S., & Davé, R. 2015, ARA&A, 53, 51, doi: 10.1146/annurev-astro-082812-140951
- Stanway & Eldridge (2018) Stanway, E. R., & Eldridge, J. J. 2018, MNRAS, 479, 75, doi: 10.1093/mnras/sty1353
- Stanway & Eldridge (2019) —. 2019, A&A, 621, A105, doi: 10.1051/0004-6361/201834359
- Stevance et al. (2020) Stevance, H., Eldridge, J., & Stanway, E. 2020, The Journal of Open Source Software, 5, 1987, doi: 10.21105/joss.01987
- Sutherland & Dopita (2017) Sutherland, R. S., & Dopita, M. A. 2017, ApJS, 229, 34, doi: 10.3847/1538-4365/aa6541
- Tremonti et al. (2004) Tremonti, C. A., Heckman, T. M., Kauffmann, G., et al. 2004, ApJ, 613, 898, doi: 10.1086/423264
- Tumlinson et al. (2017) Tumlinson, J., Peeples, M. S., & Werk, J. K. 2017, ARA&A, 55, 389, doi: 10.1146/annurev-astro-091916-055240
- Wendt et al. (2021) Wendt, M., Bouché, N. F., Zabl, J., Schroetter, I., & Muzahid, S. 2021, MNRAS, 502, 3733, doi: 10.1093/mnras/stab049
- Yates et al. (2020) Yates, R. M., Schady, P., Chen, T. W., Schweyer, T., & Wiseman, P. 2020, A&A, 634, A107, doi: 10.1051/0004-6361/201936506