Mu-MASS collaboration
Precision measurement of the Lamb shift in Muonium
Abstract
We report a new measurement of the Lamb shift in Muonium using microwave spectroscopy. Our result of MHz comprises an order of magnitude improvement upon the previous best measurement. This value matches the theoretical calculation within one standard deviation allowing us to set limits on CPT violation in the muonic sector, as well as on new physics coupled to muons and electrons which could provide an explanation of the muon anomaly.
The classical Lamb shift (LS) is the difference between the and levels of a hydrogenic atom. It stems in the most part from the so called electron self-energy, i.e the possibility for the orbiting particle to emit and re-absorb a virtual photon Weisskopf (1939). This effect is not accounted for by the Dirac theory. Following the clear identification of the LS in hydrogen by Lamb and Retherford Lamb and Retherford (1947), Bethe completed the first successful calculation of the interaction of an electron with the radiation field Bethe (1947), finding agreement with the experimental result. The discrepancy between the then-prevailing theory and measurements of the LS, together with that of the electron anomalous moment Schwinger (1948), had found unambiguous evidence for what was at the time new physics. These findings lead to the development of modern Quantum Electrodynamics (QED).
In hydrogen, the increasing precision in LS measurements, as well as more advanced theoretical calculations, have made their comparison susceptible to the proton charge distribution. Various discrepancies in the proton charge radius determination have appeared already in the 1980’s Grotch (1988). They peaked when another LS measurement, that of muonic hydrogen Pohl et al. (2010), returned a significantly smaller radius than the accepted one. This is the so called proton radius puzzle Pohl et al. (2013), with recent measurements arguably nearing its resolution Ubachs (2020); Karr et al. (2020); Gao and Vanderhaeghen (2021). This saga embodies the fact that when dealing with measurements involving hadronic particles such as protons, at a certain precision we learn more about their internal structure than about the consistency of QED.
In leptonic systems such as Muonium (M), the bound state of a positive muon and an electron; and Positronium, made of an electron and a positron; hadronic effects are entering only as loop corrections, and there are no finite-size contributions. Precision spectroscopy of such exotic atoms offers a clean arrow pointing at bound-state QED tests and an excellent probe for numerous scenarios beyond the Standard Model. These include Lorentz/CPT violations Gomes et al. (2014), new muonic forces Karshenboim et al. (2014), Dark Sectors Frugiuele et al. (2019), the effect of gravity on anti-matter via the gravitational Redshift Karshenboim (2009) and to search for highly singular neutrino-like forces Stadnik (2018). However, despite their simplicity, these systems exhibit unique experimental challenges.
Positronium has a very short lifetime due to annihilation, resulting in broad resonances and limiting the available statistics. Being the lightest known atom, Positronium travels at high velocities, even at room temperature, creating a tremendous experimental challenge. Nevertheless, the Positronium fine structure was measured recently by microwave spectroscopy with sub MHz precision Gurung et al. (2020). Interestingly, this result differs by from the theoretical prediction and warrants further studies Gurung et al. (2021).
With a longer lifetime of s limited by the muon decay, and a larger mass, M constitutes a promising system for spectroscopic measurements Jungmann (2016); Ohayon et al. (2021). The main challenge for obtaining M in vacuum, and especially in the long-lived 2S state, is that surface muons have a high kinetic energy of MeV.
Previous experiments measuring the LS in M relied on a degrader to reduce the beam energy, creating a highly diffuse M distribution Bolton et al. (1981). This resulted in low statistics and caused a large muon-related background. Nevertheless, the LS in M was measured to be at TRIUMF Oram et al. (1984), and at LAMPF Woodle et al. (1990). The main limitation for both measurements was the lack of a high quality, low energy, positive muon beam. Such a beam is available today at the Low Energy Muon (LEM) beamline at the Paul Scherrer Institute (PSI). LEM is a unique beamline, used primarily for muon spin rotation (SR) experiments Morenzoni et al. (2000), which provides a pure beam with selectable energy between and keV Prokscha et al. (2008).
Following our demonstration of the production of an intense M2S beam at the LEM Janka et al. (2020), we report here on a precision measurement of the Lamb shift in Muonium comprising an order of magnitude improvement over the state of the art.
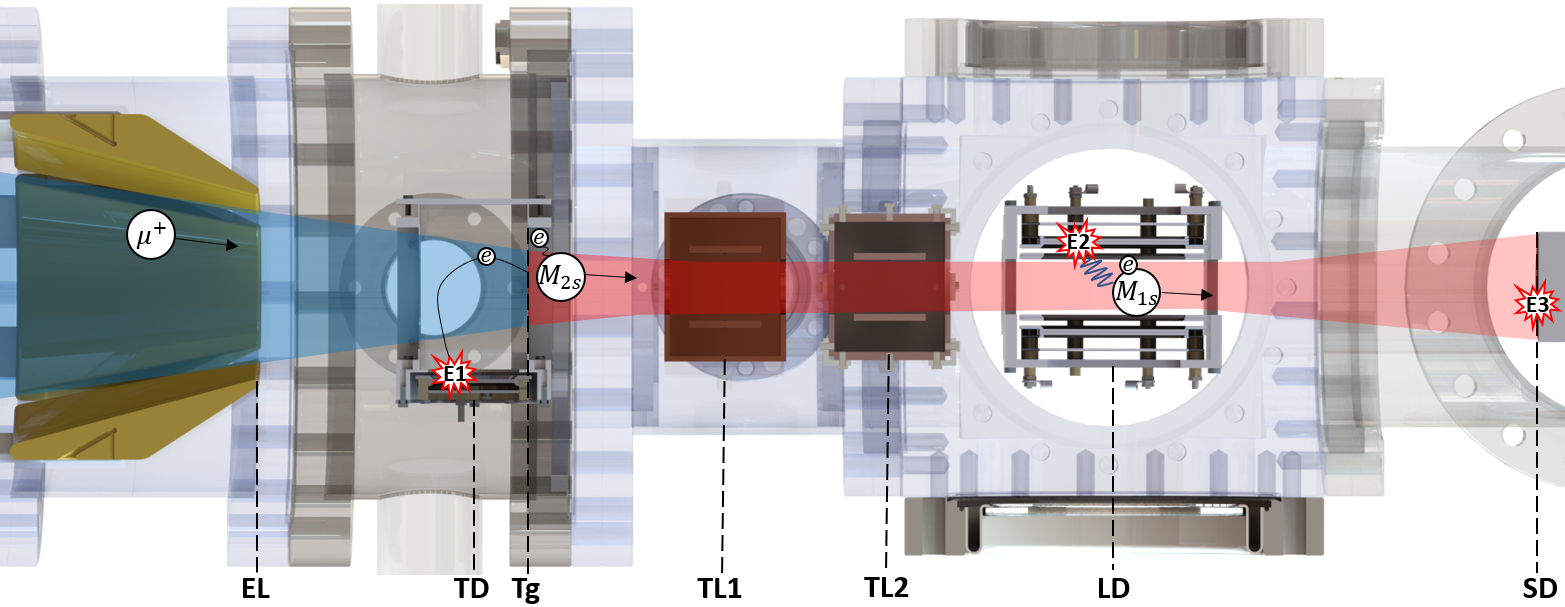
In our experiment, surface muons ( /s, momentum MeV/c) from the E4 beamline Prokscha et al. (2008) are implanted into a neon moderator from which they are re-emitted as epithermal muons with an energy of roughly eV. These are accelerated by a DC voltage of kV and transported electrostatically. An filter selects only muons while rejecting other particles such as protons and neon atoms from the moderator Salman et al. (2012). The beam is guided to our apparatus depicted in Fig. 1, where a segmented conical electrostatic lens Xiao et al. (2017) focuses it onto a nm-thick grounded carbon foil target. The foil serves a double purpose: producing M, and tagging the incoming muons.
When passing the foil, a particle has a high probability of back-scattering an electron Allegrini et al. (2016). This electron is guided by an electric field and collected on a microchannel plate (MCP) detector, thus tagging the incoming muons on an event-by-event basis. We measured the tagging efficiency, through coincidence measurement with another tagging detector, to be . The measured rate at the tagging detector was kHz, out of which we estimate that kHz is the tagged muon rate at the foil, and the rest is beam-related background. For an incident energy of keV, of the muons that traversed the foil produce Muonium, out of which are in long-lived excited states Janka et al. (2020). In the absence of electromagnetic fields, the M radiative lifetime is s, which far exceeds the muon lifetime and any other time scale in this experiment.
Within the detection region, the beam encounters a static electric field of V/cm, which mixes the with the short-lived levels and relaxes them within few nanoseconds to the ground state, emitting a Lyman-alpha photon at nm. This process is referred to as quenching. These photons are detected by two coated MCPs placed around the quenching region. By simulating the field within this region, combined with the M position and energy distribution, we estimate that the total quenching and collection efficiency is around .
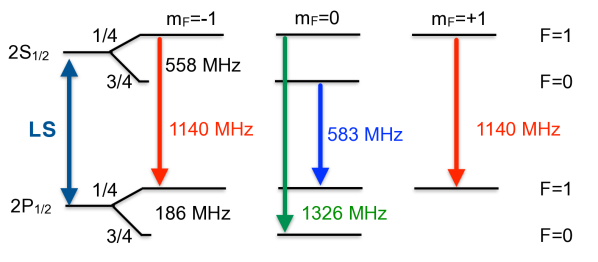
Microwave (MW) radiation, resonant with one of the transitions (see Fig. 2), reduces the Lyman-alpha signal by depopulating M2S atoms before they reach the detection region. By scanning the MW around the different transitions, we measure the resonance shape from which we determine the line center and finally deduce the LS defined as the difference between the centroid binding energies averaged over all hyperfine levels (as shown in Fig. 2 or see also Eq.(1) of Yerokhin et al. (2019)).
For this purpose, we placed two balanced dual transmission lines (TL’s) in the beam path. The design is similar to Lundeen and Pipkin (1986), in which a pair of parallel electrodes is driven degrees out of phase. In this configuration, M traveling in the center of the TL flies through a virtual ground plane which ensures that the field is linearly polarized perpendicular to the atomic beam.
At the end of the setup a position sensitive MCP detector acts as a beam monitor. This MCP is also used to measure the muon time-of-flight (TOF) and to trigger the data acquisition when a signal (events E3 in Fig. 1) is detected in coincidence with the tagging detector within s. We select TOFs that are compatible with those expected for muons at the given beam energy, taking into account losses in the foil. The coincidence rate (events E1 and E3 in Fig. 1) was Hz and reduced slowly to Hz within four days of continuous running due to aging of the neon moderator. is the sum of the muons, M, and a negligible background rate and is used as a normalization. Our signal as a function of frequency is defined as , with the rate of triple-coincidences (events E1, E2 and E3 in Fig. 1). This signal corresponds to the probability of creating and detecting photons from quenched M in long-lived excited states per tagged muon that has reached SD.
To increase the signal to background and to reduce the lineshape uncertainty, we drive of the population to the ground state by applying a frequency of MHz to TL2, while scanning the two resonances in the range MHz with TL1. Data taking took place for hours continuously, and constituted of cycles in which frequency points were measured (each point for 20 minutes), as well as one with TL1 off.
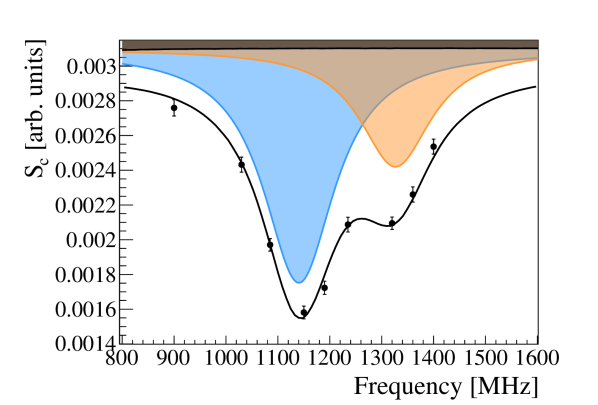
The total MW power was measured continuously outside the vacuum system. To determine the average power seen by the atoms in the TL center we measured the frequency-dependent power-loss and calibrated accordingly. We then applied a correction to the data-points in order to mimic data taken with a constant power of W in the TL center. The uncertainty in these corrections is added to the statistical one in quadrature. The corrected signal is denoted and is plotted in Fig. 3. Its main features are two overlapping resonances corresponding to the two allowed transitions from the hyperfine level.
To determine the line center from we fit the data with line shapes obtained from a detailed Monte-Carlo simulation based on Geant 4 modeling of the LEM beamline Sedlak et al. (2012), including the interaction with the thin carbon foil validated with experimental data Khaw et al. (2015). The same selection criteria for the M time-of-flight applied to the experimental data are used for the simulated events. To calculate the transition probability we use the optical Bloch equation for a 2-level system Haas et al. (2006). The density matrix equations are integrated numerically for each atom’s trajectory within the simulated time-dependent fields of the TL’s. Since we do not employ the rotating wave approximation, the Bloch-Siegert shift is included in our line shape model. The MW phase is chosen randomly for each atom before entering the TL’s so that it is averaged out.
The transitions of interest for our measurement are the at MHz, at MHz and the at MHz (see Fig. 2). The fitting procedure is done by minimization using the Minuit library within the ROOT package Brun and Rademakers (1997). The free parameters of the fit are: a horizontal offset from the simulated resonance position, an overall magnitude, and a frequency-independent background parameter. The resonance position obtained by the fitting is MHz with a reduced chi square of for degrees of freedom.
The compact nature of our setup, coupled with the high velocity of the beam, which travels on average ns between the foil and our detection system, makes us susceptible to contamination from other long-lived excited states which are populated by the beam-foil interaction and have transitions within our frequency range. The relevant transitions are between around MHz Andrews and Newton (1976a). From the horizontal offset of obtained from the fit, we estimate the maximal contribution of all excited states to be . Using the scaling factor of as in Newton et al. (1979), we get a maximal contribution of for 4S states. This is validated by keeping the magnitude of the 4S contribution as a free parameter in the fit, which returns a value compatible with zero within uncertainty. A dedicated measurement of the LS in hydrogen using protons available in the same beamline was performed, which supports our limit. Therefore, to estimate this contribution, we fit the data adding 5% 4S fraction and conservatively use the full MHz offset as the uncertainty to the line center.
To estimate the influence of the simulation input parameters on the resonance position, we scan them around their uncertainty and repeat the analysis. The ones that were found to give the largest contributions are:
-
1.
The MW field intensity which has an uncertainty of originating from the absolute calibration of the power meter () and from the mechanical tolerances in the TL construction (). The estimated systematic uncertainty is at a level of MHz. It arises from the uncertainty in the AC Stark shift.
-
2.
The M velocity distribution determined by the muon scattering in the thin C-foil. As demonstrated with previous measurements, our simulation reproduces the TOF distribution very accurately with an uncertainty on the mean energy loss of a few Khaw et al. (2015). This corresponds to a mean M energy of keV resulting in an uncertainty of MHz.
-
3.
A misalignment of the TL axis with respect to the beam could lead to a residual first order Doppler shift. Taking into account the mechanical tolerances in the TL construction, we set an upper limit on the misalignment angle to be mrad which would amount to a MHz shift.
The above contributions are summarized in table 1.
Other effects not included in the simulation can shift the central value. The main one is an overestimation of the AC Stark shift as we did not include the states in the Bloch equations. Nevertheless, this effect for the LS is well understood theoretically Andrews and Newton (1976b) and validated experimentally Andrews and Newton (1975), so that the AC Stark shift can be corrected by multiplying it with a factor resulting in MHz as given in table 1. We evaluate the magnitude of several smaller systematic effects, namely the \nth2-order Doppler, motional Stark-shift from the Earth’s magnetic field, and quantum interference-shift from the presence of Marsman et al. (2017). These are given in table 1.
Adding the various corrections, the determined frequency of the transition is MHz and the corresponding LS is MHz, where we added the statistical and systematic uncertainties in quadrature. Our result is within one standard deviation from the theoretical value quoted in the literature of MHz Woodle et al. (1990) (to be updated with recent bound state QED developments in hydrogen Yerokhin et al. (2019)) and a recent calculation based on effective field theory giving MHz Peset and Pineda (2015); Frugiuele et al. (2019).
Since our result is in agreement with the theoretical calculations, we can use it to place stringent limits on new physics scenarios. Here we focus on possible Lorentz and CPT violation effects, and new bosons interacting with muons and electrons. The M Lamb shift is sensitive to two of the isotropic nonrelativistic effective coefficients for Lorentz and CPT violation Gomes et al. (2014): namely and . Taking conservatively , we can set a bound on the linear combination:
| (1) |
which translates into Table 2, when considering only one coefficient at a time to be non-zero. These bounds are of the same order as the current ones obtained from the measurement of the 1S2S transition in M Meyer et al. (2000), and improve by an order of magnitude the previous bounds from the M Lamb Shift.
| Central Value | Uncertainty | |
| Fitting | ||
| 4S contribution | ||
| MW-Beam alignment | ||
| MW field intensity | ||
| M velocity distribution | ||
| AC Stark | ||
| \nth2-order Doppler | ||
| Earth’s Field | ||
| Quantum Interference | ||
| Hyperfine | ||
| Lamb Shift | ||
| Theoretical value Frugiuele et al. (2019) |
| Coefficient | Constraint | ||
|---|---|---|---|
| GeV-3 | |||
| GeV-3 |
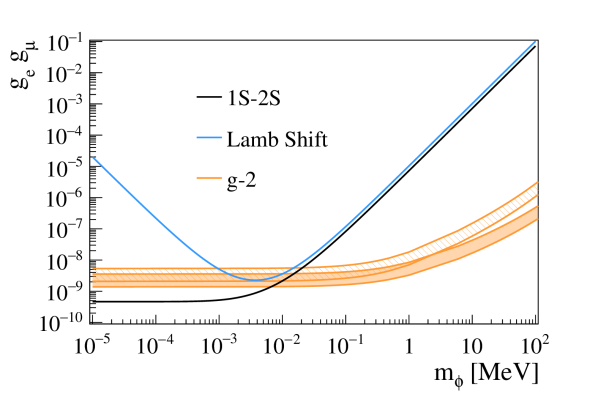
A new scalar or a new vector gauge boson could provide an explanation of the muon anomaly Jegerlehner and Nyffeler (2009); Delaunay et al. (2021); Balkin et al. (2021). If this particle is carrying a dark force between electrons and muons, then M spectroscopy offers the possibility to search for it Frugiuele et al. (2019). For the scalar case, one has a Yukawa-like attractive potential of the form (see e.g. Fadeev et al. (2019)):
| (2) |
where is the scalar boson mass and are the coupling strengths to electrons and anti-muons, respectively. For small coupling strengths, the effect of such a potential can be calculated by applying perturbation theory. The vector potential can be found in Fadeev et al. (2019). In Fig. 4, we present the sensitivity of Muonium spectroscopy to new physics. The constraints on as a function of the scalar/vector mass, which are nearly identical in the mass range considered here, are compared to the region favored by the muon anomaly Abi et al. (2021), considering the bounds from the electron gyromagnetic factor Hanneke et al. (2008). In fact, the experimental value of the electron anomalous magnetic moment is in agreement with the theoretical one when using as an input the recent new determinations of the fine structure constant Parker et al. (2018); Morel et al. (2020). We do not present results from experiments at the intensity frontier since those can be argued to be model dependent, i.e. to depend on their production or decay channels. An example is the recent results of the NA64 experiment placing stringent bounds on new bosons with the assumption that those would decay invisibly Andreev et al. (2021). The combination of the LS and 1S2S M measurements provides the most stringent laboratory constraint excluding that a new scalar/vector boson with a mass keV could contribute to the muon anomaly.
To conclude, we reported a new measurement of the Lamb shift in Muonium using microwave spectroscopy. Our result of MHz comprises an order of magnitude of improvement upon the best previously determined value. As it agrees with the theoretical value within one standard deviation, we have set limits on CPT violation in the muonic sector, as well as new physics coupled to muons and electrons.
A major increase in statistics could be obtained if beam scattering by the foil would be considerably reduced. Recently, few layer graphene foils have been successfully used for both proton tagging and hydrogen production for space missions Allegrini et al. (2014). These are times thinner than our currently used foil. As the scattering half angle is proportional to the foil thickness Vira et al. (2020), our statistics could be increased by a factor . With an order of magnitude more events, the main systematic uncertainty of the experiment, originating from a possible contamination of the M2S beam of higher excited states, would become comparable with the statistical one. These states could be suppressed by introducing a weak quenching field between Tg and the TL’s Bezginov et al. (2019). Beam misalignment could be compensated by periodically reversing the MW direction, thus reducing the associated uncertainty by more than an order of magnitude Andrews and Newton (1976a). These straightforward improvements would increase the precision to kHz level, which would significantly extend the reach of Muonium spectroscopy to search for new physics.
The realization of the High intensity Muon Beam (HiMB) at PSI Kirch would open the way to push the accuracy of this experiment to its ultimate limit of few tens of kHz. This precision, along with other ongoing M spectroscopy experiments Crivelli (2018); Kanda et al. (2021); Ohayon et al. (2021) would allow to fully probe the very interesting region of parameter space for a new scalar/vector boson with keV suggested by the anomaly where astrophysical bounds do not apply Hardy and Lasenby (2017).
Acknowledgements
This work is based on experiments performed at the Swiss Muon Source SS, Paul Scherrer Institute, Villigen, Switzerland. This work is supported by the ERC consolidator grant 818053-Mu-MASS and the Swiss National Science Foundation under the grant 197346. BO acknowledges support from the European Union’s Horizon 2020 research and innovation program under the Marie Skłodowska-Curie grant agreement No. 101019414, as well as ETH Zurich through a Career Seed Grant SEED-09 20-1. We are grateful to D. Kirpichnikov, J. Northey, Y. Soreq and A. Vargas for their help in setting the constraints from our measurement on new physics.
References
- Weisskopf (1939) V. F. Weisskopf, Phys. Rev. 56, 72 (1939).
- Lamb and Retherford (1947) W. E. Lamb and R. C. Retherford, Phys. Rev. 72, 241 (1947).
- Bethe (1947) H. A. Bethe, Phys. Rev. 72, 339 (1947).
- Schwinger (1948) J. Schwinger, Phys. Rev. 73, 416 (1948).
- Grotch (1988) H. Grotch, Physica Scripta T21, 86 (1988).
- Pohl et al. (2010) R. Pohl, A. Antognini, F. Nez, F. D. Amaro, F. Biraben, J. M. Cardoso, D. S. Covita, A. Dax, S. Dhawan, L. M. Fernandes, et al., Nature 466, 213 (2010).
- Pohl et al. (2013) R. Pohl, R. Gilman, G. A. Miller, and K. Pachucki, Annual Review of Nuclear and Particle Science 63, 175 (2013).
- Ubachs (2020) W. Ubachs, Science 370, 1033 (2020).
- Karr et al. (2020) J.-P. Karr, D. Marchand, and E. Voutier, Nature Reviews Physics 2, 601 (2020).
- Gao and Vanderhaeghen (2021) H. Gao and M. Vanderhaeghen, “The proton charge radius,” (2021), arXiv:2105.00571 [hep-ph] .
- Gomes et al. (2014) A. H. Gomes, V. A. Kostelecký, and A. J. Vargas, Phys. Rev. D 90, 076009 (2014).
- Karshenboim et al. (2014) S. G. Karshenboim, D. McKeen, and M. Pospelov, Phys. Rev. D 90, 073004 (2014), [Addendum: Phys.Rev.D 90, 079905 (2014)], arXiv:1401.6154 [hep-ph] .
- Frugiuele et al. (2019) C. Frugiuele, J. Pérez-Ríos, and C. Peset, Phys. Rev. D 100, 015010 (2019).
- Karshenboim (2009) S. G. Karshenboim, Astron. Lett. 35, 663 (2009), arXiv:0811.1008 [gr-qc] .
- Stadnik (2018) Y. V. Stadnik, Phys. Rev. Lett. 120, 223202 (2018), arXiv:1711.03700 [physics.atom-ph] .
- Gurung et al. (2020) L. Gurung, T. J. Babij, S. D. Hogan, and D. B. Cassidy, Phys. Rev. Lett. 125, 073002 (2020).
- Gurung et al. (2021) L. Gurung, T. J. Babij, J. Pérez-Ríos, S. D. Hogan, and D. B. Cassidy, Phys. Rev. A 103, 042805 (2021).
- Jungmann (2016) K. P. Jungmann, Journal of the Physical Society of Japan 85, 091004 (2016), https://doi.org/10.7566/JPSJ.85.091004 .
- Ohayon et al. (2021) B. Ohayon, Z. Burkley, and P. Crivelli, SciPost Physics Proceedings (2021).
- Bolton et al. (1981) P. R. Bolton, A. Badertscher, P. O. Egan, C. J. Gardner, M. Gladisch, V. W. Hughes, D. C. Lu, M. Ritter, P. A. Souder, J. Vetter, G. zu Putlitz, M. Eckhause, and J. Kane, Phys. Rev. Lett. 47, 1441 (1981).
- Oram et al. (1984) C. J. Oram, J. M. Bailey, P. W. Schmor, C. A. Fry, R. F. Kiefl, J. B. Warren, G. M. Marshall, and A. Olin, Phys. Rev. Lett. 52, 910 (1984).
- Woodle et al. (1990) K. Woodle, A. Badertscher, V. Hughes, D. Lu, M. Ritter, M. Gladisch, H. Orth, G. Zu Putlitz, M. Eckhause, J. Kane, et al., Physical Review A 41, 93 (1990).
- Morenzoni et al. (2000) E. Morenzoni, H. Glückler, T. Prokscha, H. Weber, E. Forgan, T. Jackson, H. Luetkens, C. Niedermayer, M. Pleines, M. Birke, A. Hofer, J. Litterst, T. Riseman, and G. Schatz, Physica B: Condensed Matter 289-290, 653 (2000).
- Prokscha et al. (2008) T. Prokscha, E. Morenzoni, K. Deiters, F. Foroughi, D. George, R. Kobler, A. Suter, and V. Vrankovic, Nuclear Instruments and Methods in Physics Research Section A: Accelerators, Spectrometers, Detectors and Associated Equipment 595, 317 (2008).
- Janka et al. (2020) G. Janka, B. Ohayon, Z. Burkley, L. Gerchow, N. Kuroda, X. Ni, R. Nishi, Z. Salman, A. Suter, M. Tuzi, et al., The European Physical Journal C 80, 1 (2020).
- Salman et al. (2012) Z. Salman, T. Prokscha, P. Keller, E. Morenzoni, H. Saadaoui, K. Sedlak, T. Shiroka, S. Sidorov, A. Suter, V. Vrankovic, and H.-P. Weber, Physics Procedia 30, 55 (2012), 12th International Conference on Muon Spin Rotation, Relaxation and Resonance (muSR2011).
- Xiao et al. (2017) R. Xiao, E. Morenzoni, Z. Salman, B.-J. Ye, and T. Prokscha, Nuclear Science and Techniques 28, 29 (2017).
- Allegrini et al. (2016) F. Allegrini, R. W. Ebert, and H. O. Funsten, Journal of Geophysical Research: Space Physics 121, 3931 (2016).
- Yerokhin et al. (2019) V. A. Yerokhin, K. Pachucki, and V. Patkóš, Annalen der Physik 531, 1800324 (2019).
- Lundeen and Pipkin (1986) S. R. Lundeen and F. M. Pipkin, Metrologia 22, 9 (1986).
- Sedlak et al. (2012) K. Sedlak, R. Scheuermann, T. Shiroka, A. Stoykov, A. Raselli, and A. Amato, Physics Procedia 30, 61 (2012).
- Khaw et al. (2015) K. S. Khaw, A. Antognini, P. Crivelli, K. Kirch, E. Morenzoni, Z. Salman, A. Suter, and T. Prokscha, JINST 10, P10025 (2015).
- Haas et al. (2006) M. Haas, U. D. Jentschura, C. H. Keitel, N. Kolachevsky, M. Herrmann, P. Fendel, M. Fischer, T. Udem, R. Holzwarth, T. W. Hänsch, M. O. Scully, and G. S. Agarwal, Phys. Rev. A 73, 052501 (2006).
- Brun and Rademakers (1997) R. Brun and F. Rademakers, Nuclear Instruments and Methods in Physics Research Section A: Accelerators, Spectrometers, Detectors and Associated Equipment 389, 81 (1997), new Computing Techniques in Physics Research V.
- Andrews and Newton (1976a) D. A. Andrews and G. Newton, Phys. Rev. Lett. 37, 1254 (1976a).
- Newton et al. (1979) G. Newton, D. Andrews, and P. Unsworth, Philosophical Transactions of the Royal Society of London. Series A, Mathematical and Physical Sciences 290, 373 (1979).
- Andrews and Newton (1976b) D. A. Andrews and G. Newton, Journal of Physics B: Atomic and Molecular Physics 9, 1453 (1976b).
- Andrews and Newton (1975) D. A. Andrews and G. Newton, Journal of Physics B: Atomic and Molecular Physics 8, 1415 (1975).
- Marsman et al. (2017) A. Marsman, M. Horbatsch, and E. A. Hessels, Phys. Rev. A 96, 062111 (2017).
- Peset and Pineda (2015) C. Peset and A. Pineda, Eur. Phys. J. A 51, 156 (2015), arXiv:1508.01948 [hep-ph] .
- Meyer et al. (2000) V. Meyer, S. N. Bagayev, P. E. G. Baird, P. Bakule, M. G. Boshier, A. Breitrück, S. L. Cornish, S. Dychkov, G. H. Eaton, A. Grossmann, D. Hübl, V. W. Hughes, K. Jungmann, I. C. Lane, Y.-W. Liu, D. Lucas, Y. Matyugin, J. Merkel, G. zu Putlitz, I. Reinhard, P. G. H. Sandars, R. Santra, P. V. Schmidt, C. A. Scott, W. T. Toner, M. Towrie, K. Träger, L. Willmann, and V. Yakhontov, Phys. Rev. Lett. 84, 1136 (2000).
- Jegerlehner and Nyffeler (2009) F. Jegerlehner and A. Nyffeler, Physics Reports 477, 1 (2009).
- Delaunay et al. (2021) C. Delaunay, B. Ohayon, and Y. Soreq, (2021), arXiv:2106.11998 [hep-ph] .
- Balkin et al. (2021) R. Balkin, C. Delaunay, M. Geller, E. Kajomovitz, G. Perez, Y. Shpilman, and Y. Soreq, (2021), arXiv:2104.08289 [hep-ph] .
- Fadeev et al. (2019) P. Fadeev, Y. V. Stadnik, F. Ficek, M. G. Kozlov, V. V. Flambaum, and D. Budker, Phys. Rev. A 99, 022113 (2019), arXiv:1810.10364 [hep-ph] .
- Abi et al. (2021) B. Abi et al. (Muon g-2), Phys. Rev. Lett. 126, 141801 (2021), arXiv:2104.03281 [hep-ex] .
- Hanneke et al. (2008) D. Hanneke, S. Fogwell, and G. Gabrielse, Phys. Rev. Lett. 100, 120801 (2008), arXiv:0801.1134 [physics.atom-ph] .
- Parker et al. (2018) R. H. Parker, C. Yu, W. Zhong, B. Estey, and H. Müller, Science 360, 191 (2018), arXiv:1812.04130 [physics.atom-ph] .
- Morel et al. (2020) L. Morel, Z. Yao, P. Cladé, and S. Guellati-Khélifa, Nature 588, 61 (2020).
- Andreev et al. (2021) Y. M. Andreev et al. (NA64), Phys. Rev. Lett. 126, 211802 (2021), arXiv:2102.01885 [hep-ex] .
- Allegrini et al. (2014) F. Allegrini, R. W. Ebert, S. A. Fuselier, G. Nicolaou, P. V. Bedworth, S. W. Sinton, and K. J. Trattner, Optical Engineering 53, 1 (2014).
- Vira et al. (2020) A. D. Vira, P. A. Fernandes, H. O. Funsten, S. K. Morley, H. Yamaguchi, F. Liu, and N. A. Moody, Review of Scientific Instruments 91, 033302 (2020), https://doi.org/10.1063/1.5134768 .
- Bezginov et al. (2019) N. Bezginov, T. Valdez, M. Horbatsch, A. Marsman, A. C. Vutha, and E. A. Hessels, Science 365, 1007 (2019).
- (54) K. Kirch, “Slow muons and muonium,” in CPT and Lorentz Symmetry, pp. 53–56.
- Crivelli (2018) P. Crivelli, Hyperfine Interactions 239, 49 (2018).
- Kanda et al. (2021) S. Kanda, Y. Fukao, Y. Ikedo, K. Ishida, M. Iwasaki, D. Kawall, N. Kawamura, K. Kojima, N. Kurosawa, Y. Matsuda, T. Mibe, Y. Miyake, S. Nishimura, N. Saito, Y. Sato, S. Seo, K. Shimomura, P. Strasser, K. Tanaka, T. Tanaka, H. Torii, A. Toyoda, and Y. Ueno, Physics Letters B 815, 136154 (2021).
- Hardy and Lasenby (2017) E. Hardy and R. Lasenby, Journal of High Energy Physics 2017, 1 (2017).