Date of publication xxxx 00, 0000, date of current version xxxx 00, 0000. xx.xxxx/ACCESS.xxxx.DOI
Corresponding author: D.Y.L Ranasinghe (e-mail: e14273@eng.pdn.ac.lk).
This work was supported by University of Peradeniya, Sri Lanka research grant (No: URG/2017/26/E).
Transmittance Multispectral Imaging for Reheated Coconut Oil Differentiation
Abstract
Oil reheating has a significant impact on global health due to its extensive consumption, especially in South Asia, and severe health risks. Nevertheless, food image analysis using multispectral imaging systems(MISs) has not been applied to oil reheating analysis despite their vast application in rapid food quality screening. To that end, the paper discusses the application of a low-cost MSI to estimate the ‘reheat cycle count classes’ (number of times an oil sample is recursively heated) and identify ‘critical classes’ at which substantial changes in the oil sample have materialized. Firstly, the reheat cycle count class is estimated with Bhattacharyya distance between the reheated and a pure oil sample as the input. The classification was performed using a support vector machine classifier that resulted in an accuracy of 83.34 % for reheat cycle count identification. Subsequently, an unsupervised clustering procedure was introduced using a modified spectral clustering (SC) algorithm to distinguish critical classes under reheating. In addition, laboratory experiments were performed to ascertain the ramifications of the reheating process with a chemical analysis. The chemical analysis of the coconut oil samples used in the experiment coincided with the chemical analysis results and was statistically significant (). Accordingly, the proposed work closes the gap for using multispectral imaging for oil reheating and proposes a novel algorithm for unsupervised detection of critical property changes in the oil. Hence, the proposed research work is significant in its practical implications, contribution to food image analysis, and unsupervised classification mechanisms.
Index Terms:
Multispectral imaging, Oil reheating, Transmittance spectrum, Quality analysis, Support vector machines, Spectral clustering=-15pt
I Introduction
The quality of food consumed plays a pivotal role in assuring the health of a society. Therefore, it is of paramount importance to continuously monitor the quality of food. Rapid screening of food and beverages, including edible oils, has become a key focus among scientists and industrialists because contamination and adulteration of food compromise the quality of food [1, 2, 3]. In this context, the need for accurate, fast, non-destructive, and economical methods to assure the standard of food are of a timely need.
In recent years, numerous sensor-based techniques and systems have been proposed and implemented to learn individual dietary and energy intake [4, 5, 6], identify unique food items in meals [7, 8], and monitor food consumption characteristics such as food microstructure [9]. Among the sensor-based food assessment, techniques based on image analysis are a prominent research avenue for rapid screening of food and beverages. Red-Green-Blue (RGB) colour photography, spectroscopy, and spectral imaging (SI) could be food image analyses. In RGB photography, recorded images are reconstructed by mixing available ground-truths for the three spectral regions in various proportions. This technique has been used in a wide range of applications: detection of skin defects in citrus fruits [10], development of sorting and grading mechanisms [11, 12], and dietary assessment via food image analysis with deep learning [13]. Although RGB photography has its merits in food analyses, the technique has spectral limitations when analyzing items responsive to UV-region, such as oil and vinegar. Besides that, spectroscopy and SI techniques are superior to RGB photography at sensing and differentiating such items as these methods include signatures from outside the visible region. Besides that, spectroscopy and SI provide better feature discrimination power with greater spectral bands than RGB photography.
In particular, spectroscopy methods are useful in deriving elaborative quality parameters [14, 15, 16] using spectral characteristics. Especially, spectroscopy techniques such as Fourier Transform Infra-Red (FTIR) [17], and Raman spectroscopy [18] are regularly used in the compositional analysis of oil and agricultural produce [19]. Though both the above spectroscopy techniques have disparate operating spectral regions, both methods can derive the respective spectrum of the specimen within minutes. Nonetheless, spectroscopy techniques are contingent upon established reference spectra similar to RGB photography for calibration and baseline removal. Hence, without accurate references, the potential of this method is severely hindered. Besides that, spectroscopy equipment is complex, expensive, and restricted to a laboratory environment rather than for field use compared to regular RGB images. Moreover, the method requires professional knowledge and experience to operate the instrument and analyze the measurements.
SI is a cost-effective alternative to spectroscopy methods which could be described as an extension of RGB photography into near-infrared (NIR) and ultraviolet (UV) regions [20]. Similar to spectroscopy, SI could be used to analyze both solids [21] and liquids [22], as well as opaque and translucent materials. SI could be categorized as hyperspectral imaging systems (HISs) and multispectral imaging systems (MISs) depending on the spectral discriminating power each system offers. Usually, HISs have more discrete wavelengths with a narrow spectral resolution, and the monochrome spectral images are acquired with a diffraction mechanism. Whereas MISs only utilize a few selected wavelengths ranging from NIR to UV and use either optical filters with ambient light or separate light sources for each spectral band along with a monochrome camera for image acquisition. In the literature, hyperspectral imagery has been used to extract information about bruises in peaches [23], and strawberries [24] with significant accuracies. Moreover, HISs have been used to analyze skim and nonfat milk powder [25] and to predict microbial spoilage of bakery products [26] which demonstrate the applicability of HISs at various levels in the food chain. Although HISs offer superior spectral features to MISs, it demands complex systems to control and standardize the image acquisition process. Additionally, it costs about USD 8000 [27] to build a low-cost HIS when the average GDP per capita in South Asian countries, where oil reheating is a more prevalent issue[28, 29], is around USD 2000 [30]. It can be argued that the HIS is not suitable for on spot testing instead of the proposed imaging setup considering the cost and hardware complexity of a HIS compared to an MIS. Besides that, MISs could be used as an on-spot primary screening mechanism to separate aberrant samples, which then can be analyzed extensively with HIS, spectroscopy or chemical methods. Nevertheless, the development of an MIS imposes an optimization problem for the band selection in a cost-effective manner. Since MISs integrate both imaging and spectroscopy techniques, MISs offer advantages such as minimal sample preparation, non-destructive examination, and fast-acquisition times over chemical analyses [31, 32, 33]. These practical advantages, along with the development of computational imaging, have fomented exploring MISs as a viable option for various applications in food image analysis [34, 35, 36] amongst researchers. Furthermore, MISs are simpler and less expensive to build and could be used as a portable device, as evidenced by the developed MIS in the proposed work instead of HISs.
Reheating is another form of food preservation among injecting chemicals to ripen, preserving perishable goods, but done for cost mitigation. In particular, this practice is commonplace in South Asian countries [28, 29], especially at households and restaurants. Though reheating and reusing oil has its financial incentive, such corruption is pernicious to health. Consequently, the ramifications of oil reheating are significant because the degree of harm from consumption and the total population of consumers is high. Hence, it is a clear requirement to flag if such appreciable change has occurred and is detected in the oil. Besides that, there are no rapid screening techniques to identify such changes due to oil reheating, even though they happen vastly in fast food chains. However, several assessment techniques were proposed in the past few decades to estimate various quality parameters of edible oils with MISs under different degrading processes like adulteration and toxin formation during the manufacturing stage. At the same time, only a limited amount of work has been carried out to assess the effects of reheating and reusing the oil. Since repetitive use of coconut oil is expected in food-service establishments and households as a measure to cut down the cost [37], coconut oil was used to obtain experimental results in the proposed work. Though reheating is a continuous process, the number of times oil is reheated is a discrete variable. Therefore, contamination due to reheating can happen at different levels and can have significant alterations at different reheat cycles. Hence, it is a clear requirement to flag if such appreciable change has occurred and been detected. Since such demarcations can be done for the same oil under different reheat cycles, the change detection must be unsupervised. It is necessary to treat this as a specific novel unsupervised research problem in food image analysis. Moreover, the chemical and thermophysical properties are altered during reheat [38] and these physicochemical changes compromise the safety of the oil, thus potentially making fried foods unsafe for consumption [39]. Many secondary oxidative products such as carbonyls, organic acids, hydrocarbons, and polymerized compounds are generated during repeated heating. Furthermore, the production of trans-fatty acids raises low-density lipoprotein (LDL) and total cholesterol while decreasing high-density lipoprotein (HDL) cholesterol. Consequently, often use of impure coconut oil leads to an increased risk of cardiovascular diseases [40, 41], carcinogenesis, and other non-communicable diseases [42]. Though it is patent that the formation of secondary products is unhealthy, it is difficult to determine the healthiness and unhealthiness of contaminated samples; instead, food analyses are more concerned about the relative change in the chemical composition of the sample; specifically, the oxidative stability [43, 44, 45, 46] since it involves significant health risks.
This work discusses a novel application for MISs with coconut oil as the case study. As articulated above, spectral imaging has not been applied to study reheating in food quality analysis, let alone coconut oil. Hence, the application of multispectral imaging to oil reheating is a novel contribution to food image analysis. Then, the proposed work discusses two analytical methods: reheat cycle count classification and significant alteration detection. The former is similar to algorithms proposed in adulteration for constructing a functional relationship. However, this functional relationship is used for classification for the class estimation problem, unlike in oil adulteration studies. However, the latter proposes a novel usage for oil contamination detection where the primary agenda is to find at what point significant property change occurs. We are proposing using unsupervised classification to identify appreciable changes in spectral properties. Further, we propose a novel mechanism to determine the number of clusters with spectral clustering. The proposed application estimates the reheat cycle count class (number of times a given oil sample has been reheated) compared to a fresh batch of the oil and can be used to recognize reheat cycle count classes with significant chemical alterations to the oil during the reheating process. For brevity, the reheat cycle count classes where these dramatic changes in the composition occur will be referred to as ‘critical reheat cycle count classes’. The method proposed in this work utilizes the transmittance of light through the specimen to produce a transmittance spectrum of the oil sample. Then, the algorithm developed to estimate the reheat cycle count classes first incorporates Fisher Discriminant Analysis (FDA) for dimension reduction. These selected features were used to calculate Bhattacharyya distance, which the Support Vector Machine used to estimate the reheat cycle count. Next, spectral clustering was used to build an algorithm to distinguish the reheat cycle count classes with significant spectral property changes. The outcome of the grouping is the formation of umbrella clusters of reheat cycle count classes with incremental changes in spectral properties due to reheating. As for reheating causes changes in chemical properties, cluster boundaries could perhaps imply critical changes in composition, indicating health risks.
The proposed work contributes to multispectral imaging under the food image analysis research, and we are proposing two analytical methods for oil reheating. Firstly, to determine the reheat level count class and secondly to detect significant chemical property changes of the oil. Since the reheat level count class determination is a classification task, we have compared different classifiers using Bhattacharyya distance as the input feature. Finding a suitable classifier under the proposed feature selection method is one of the technical contributions of this work. Secondly, we proposed a novel mechanism to detect marked changes in the oil, in particular oxidative stability of the oil. For that, we are proposing a novel mechanism to determine the number of clusters using spectral clustering to select the optimal number of clusters. Furthermore, we compared the algorithm results with the chemical analysis because multispectral imaging has not been applied in analyzing property changes. The contributions of the work can be listed as follows: (a) An in-house developed portable transmittance-based MIS. (b) A rapid and cost-effective screening algorithm for reheated coconut oil. (c) A methodology that estimates the number of times the oil has been reheated. (d) The proposed methodology can identify the reheat cycle counts at which a notable change in the oil has happened via monitoring spectral properties indicative of significant chemical and thermophysical property changes.
The paper is organized as follows. First, a summary of related works in MISs in food image analysis is included in section II. Followingly, specifications of the MIS, experimental procedure, image pre-processing, and algorithm development are expounded in section III. Lastly, the results of the developed algorithms and the chemical analysis for the proposed application are available in section IV along with the evaluation in section V.
| LED Number | Typical peak wavelength (nm) | Typical emitting spectral band (nm) | Typical half power bandwidth (nm) |
| 1 | 405 | 375 – 435 | 20 |
| 2 | 430 | 375 – 475 | 20 |
| 3 | 500 | 450 – 550 | 30 |
| 4 | 610 | 520 – 620 | 10 |
| 5 | 660 | 630 – 685 | 20 |
| 6 | 740 | 670 – 770 | 20 |
| 7 | 850 | 770 – 900 | 30 |
| 8 | 890 | 830 – 970 | 40 |
| 9 | 950 | 900 – 1000 | 50 |
II Related work
Multispectral imaging systems have been used in applications from various fields such as agriculture [47], microbiology [16], entomology [48], etc. In specific, adulteration and defects of agricultural produce have been analyzed using MIS for turmeric [49], fruits [50, 51, 52], beef [53], and rice [54], as well as in packed foods [55], and tomato paste [56]. Besides that, different imaging systems have been proposed in the literature with applications. For example, the growth of mould on food has been examined [57] using the VideometerLab spectral imaging instrument with 18 spectral bands. Also, an MIS operating in the spectral range of 405–970 nm consisting of 19 different spectral bands has been used to determine the aerobic plate count of cooked pork sausages [58]. In addition, SI has been used for crop monitoring, and vegetation index calculation [59] and to assess the health status of crops [60]. In [61], an MIS has been developed to detect oil-containing dressing on salad leaves to assess the energy intake. Furthermore, SI has been used to analyze coconut oil adulteration with palm oil [62], mustard oil [63]. The work proposed in [64] presents the determination of turbidity in coconut oil with food image analysis.
In most work found in the literature for studies on edible oil, the prime focus has been natural degradation, adulteration, and defect identification. However, processes such as oil reheating and associated changes have not been under scrutiny with SI as much compared to other debasing processes: oil adulteration and toxin formation, even though the chemical changes from reheating are equally deleterious. In particular, oil adulteration is the most extensively studied contamination method in the food research community using chemical analyses [65, 66, 67] and spectroscopy methods [68, 69, 70, 71, 17]. However, the application of spectral imaging to study oil adulteration has been limited, let alone coconut oil, even though spectral imaging has been used to detect adulterants in consumables such as wheat flour in turmeric [49], limestone powder in tapioca starch [72], horsemeat in beef [73], sucrose in tomato paste [56].
In [74, 62] for oil adulteration studies, the focus has been on developing a functional relationship since the requirement is to calculate the growth of a parameter. However, in the adulteration analysis using MSIs, the change detection in chemical properties has not been studied as opposed to the proposed work for reheating analysis. Unlike the adulteration or reheat cycle count class estimation, which uses supervised learning, the discrimination of appreciable chemical property changes has been performed with unsupervised learning. Then, toxin formation detection in oil has been studied in [75, 76] using mass spectrometry and FTIR spectroscopy, respectively. Though multispectral imagery has not been applied in toxin formation in oil so far to the best of our knowledge, considering the parallelity of spectroscopy and spectral imaging, it should be possible to develop an algorithm to detect the presence aflatoxin in oil.
III Materials and methods
III-A Development of the multispectral imaging system
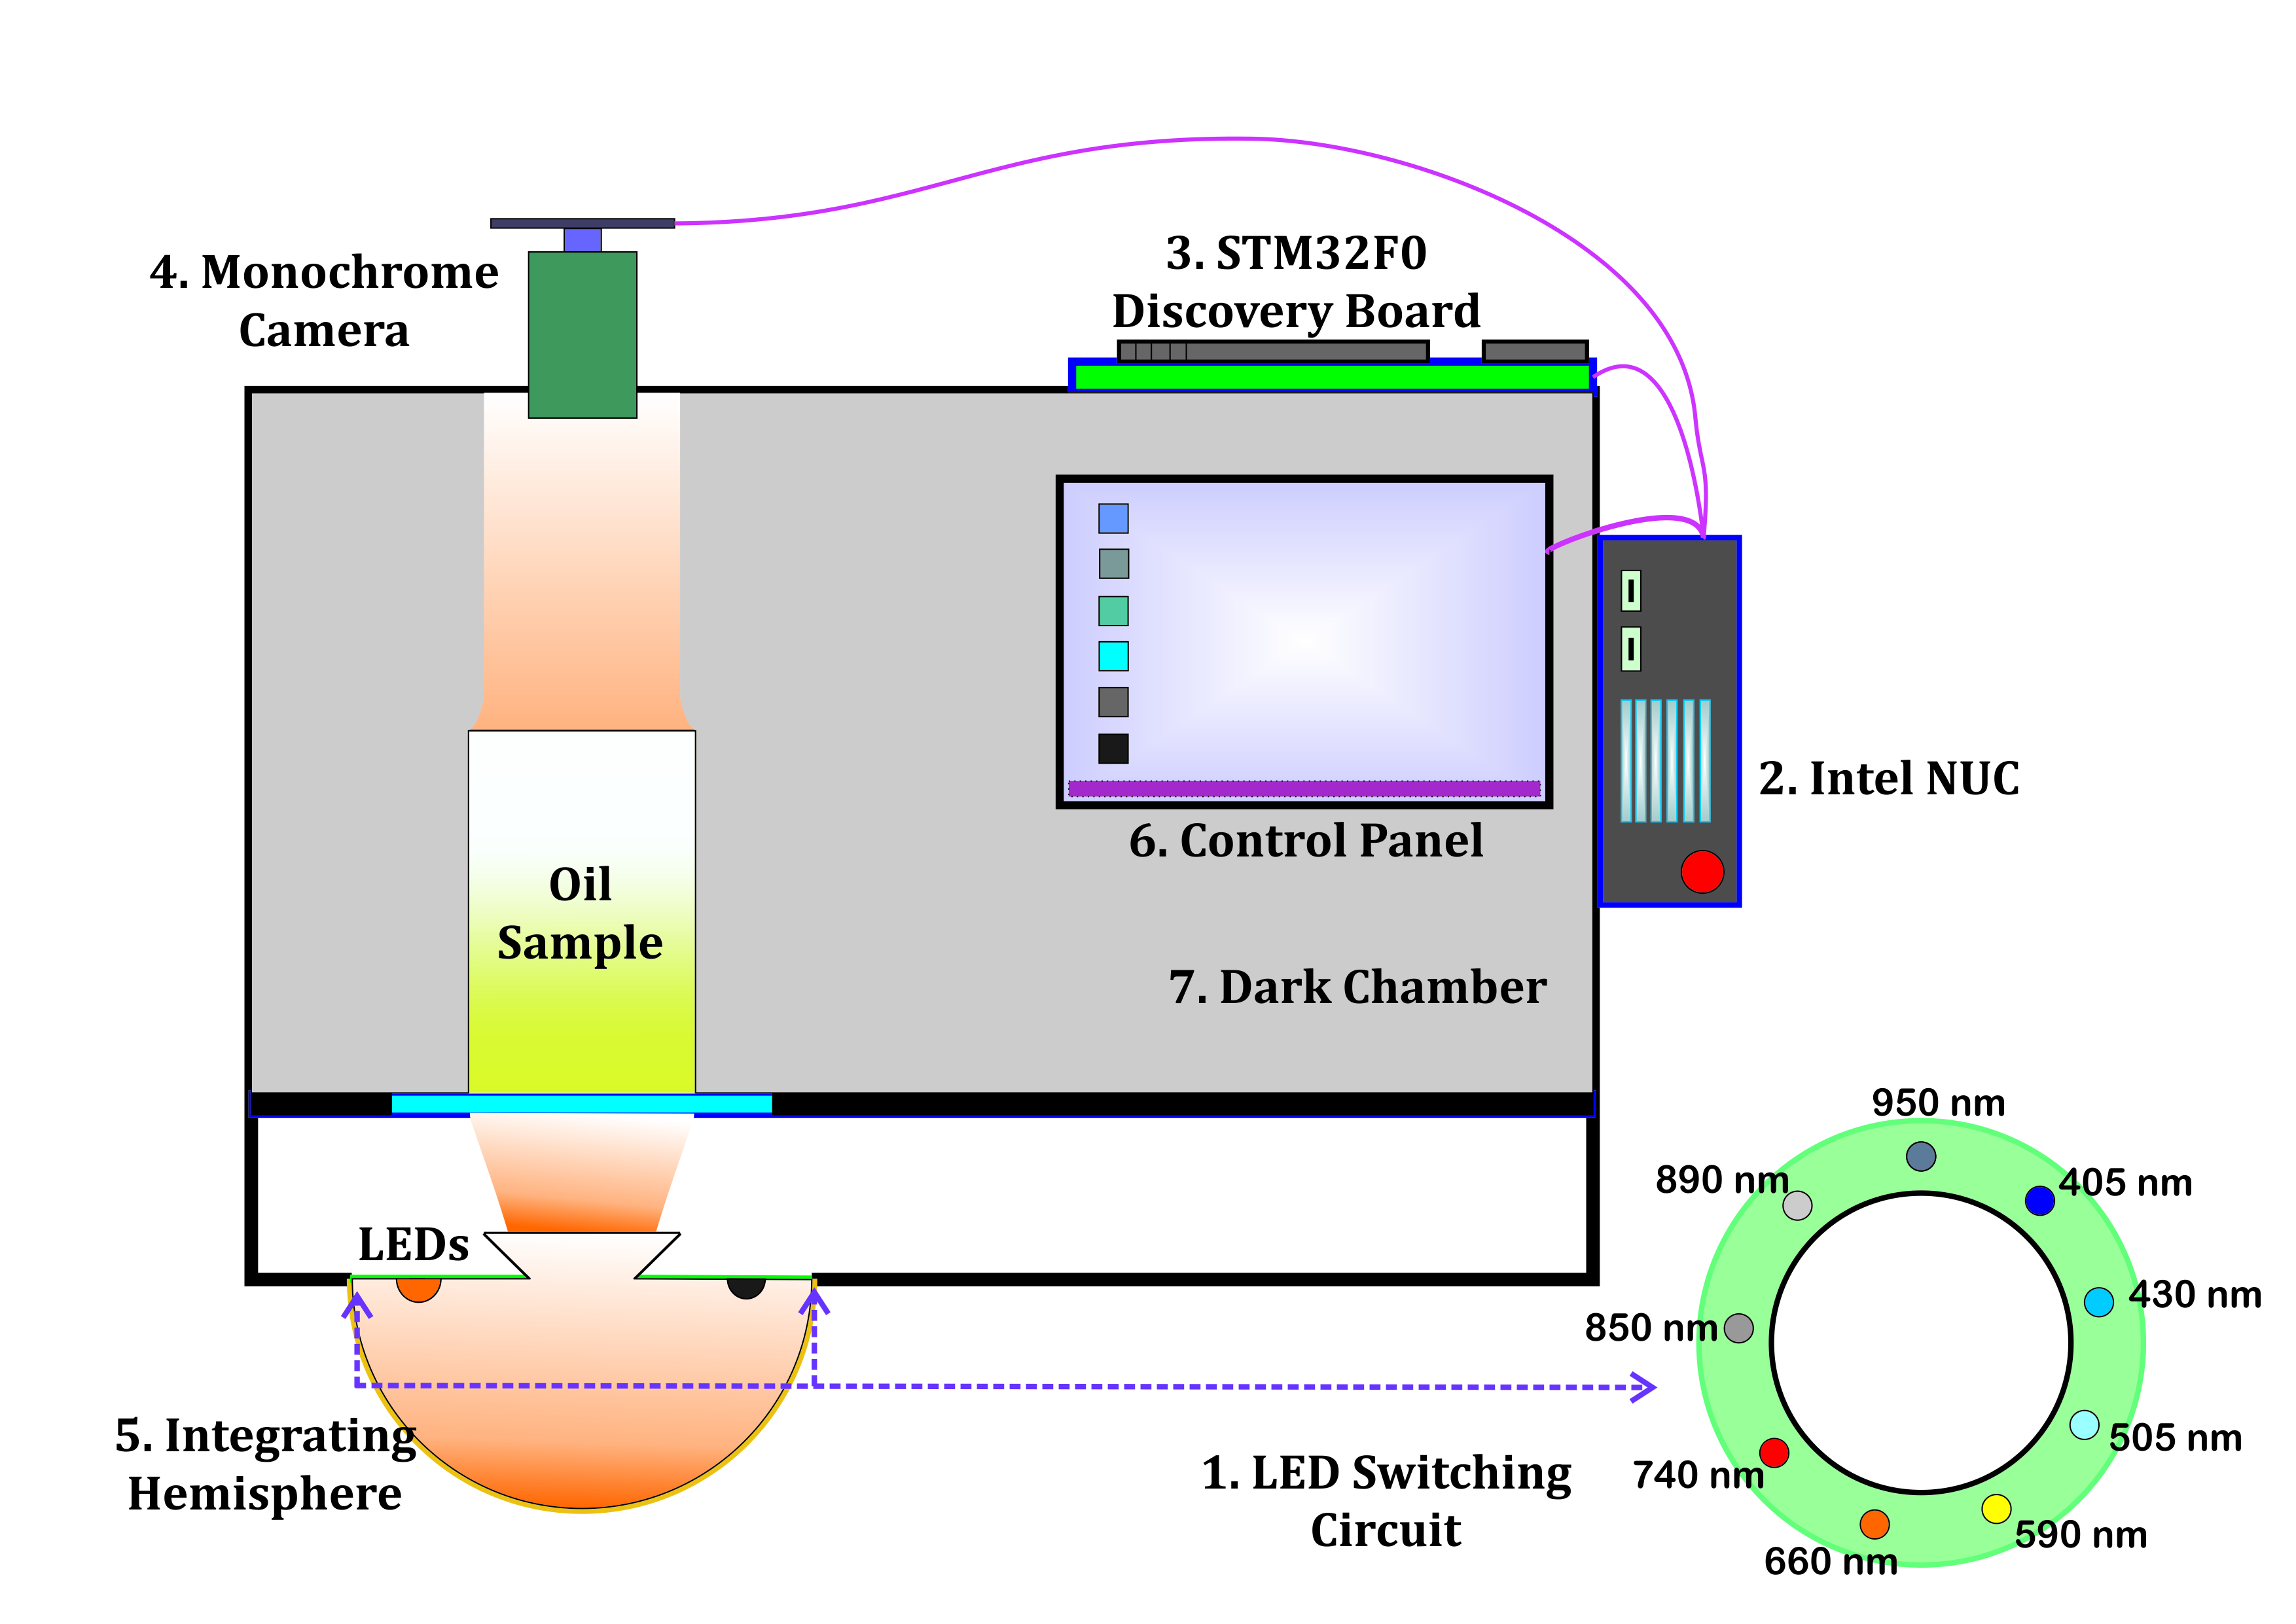
Most MISs found in the literature have been designed to derive the reflectance spectrum of the specimen, often of opaque and solid materials. However, this configuration is futile with translucent liquids such as oils and vinegar because only a fraction of light is reflected while most light is transmitted through the sample. To that end, the MIS developed for this application was configured as depicted in Fig. 1(a) to measure the transmittance spectrum of liquids which is an adaptation of the reflectance-based setup proposed in [77, 78]. The optical excitation for the sample is generated using a dedicated illumination panel comprised of narrow-band LEDs corresponding to nine spectral bands from 375 nm to 1000 nm with specifications as given in Table LABEL:table:_led_panel_specifications, accompanied by an illumination panel made of Aluminum with a 130 mm inner diameter to provide better illumination for the
| Item | Detailed Description | Manufacturer Product Number | Manufacturer | Headquaters |
| IC - 1 | Linear Voltage Regulator IC Positive Fixed 1 Output 300mA 8-MSOP | ADP3333ARMZ-3.3-R7 | Analog Devices Inc. | United States |
| IC - 2 | Linear Voltage Regulator IC Positive Fixed 1 Output 500mA 8-MSOP | ADP3335ARMZ-5 | Analog Devices Inc. | United States |
| IC - 3 | USB Bridge, USB to UART USB 2.0 UART Interface 28-SSOP | FT232RL | FTDI, Future Technology Devices International Ltd | Scotland |
| LED - 1 | Ultraviolet (UV) Emitter 405nm 3.2V 30mA 2.5mW/sr @ 20mA 120 2-PLCC | VLMU3100-GS08 | Vishay Semiconductor Opto Division | United States |
| LED - 2 | Ultraviolet (UV) Emitter 430nm 3.4V 700mA - 130 1414 (3535 Metric) | LTPL-C034UVH430 | Lite-On Inc. | Taiwan |
| LED - 3 | Green 505nm LED Indication - Discrete 3.3V 1204 (3210 Metric) | SM1204PGC | Bivar Inc. | United States |
| LED - 4 | Orange 606nm LED Indication - Discrete 2.15V 4-PLCC | 5973209202F | Dialight | United Kingdom |
| LED - 5 | Red 647nm LED Indication - Discrete 1.7V 0603 (1608 Metric) | 5975112402F | Dialight | United Kingdom |
| LED - 6 | Infrared (IR) Emitter 740nm 1.9V 700mA 250mW/sr @ 350mA 120 2-SMD, No Lead Exposed Pad | QBHP684-IR4BU | QT Brightek (QTB) | United States |
| LED - 7 | Infrared (IR) Emitter 850nm 1.65V 100mA 50mW/sr @ 100mA 20 2-SMD, Gull Wing | VSMY2850G | Vishay Semiconductor Opto Division | United States |
| LED - 8 | Infrared (IR) Emitter 890nm 1.4V 100mA 6mW/sr @ 100mA 120 2-PLCC | VSMF3710-GS08 | Vishay Semiconductor Opto Division | United States |
| LED - 9 | Infrared (IR) Emitter 950nm 1.3V 100mA 1.6mW/sr @ 100mA 120 2-PLCC | VSMS3700-GS08 | Vishay Semiconductor Opto Division | United States |
| Microcontroller | STM32F051R8T6 Discovery series ARM® Cortex®-M0 MCU 32-Bit Embedded Evaluation Board | STM32F0DISCOVERY | STMicroelectronics | Switzerland |
| Camera | Blackfly S Mono 1.3 MP USB3 Vision (ON Semi PYTHON 1300) | BFS-U3-13Y3M | Teledyne FLIR LLC | United States |
| Computer | Intel NUC Kit with Intel Celeron Processors | NUC Kit NUC5CPYH | Intel Corporation | United States |
specimen. The LED driver ICs (MAX16839ASA+) of the illumination panel was powered by an in-house developed AC regulated 12 V DC power supply and the LEDs were controlled using a separate switching circuit.
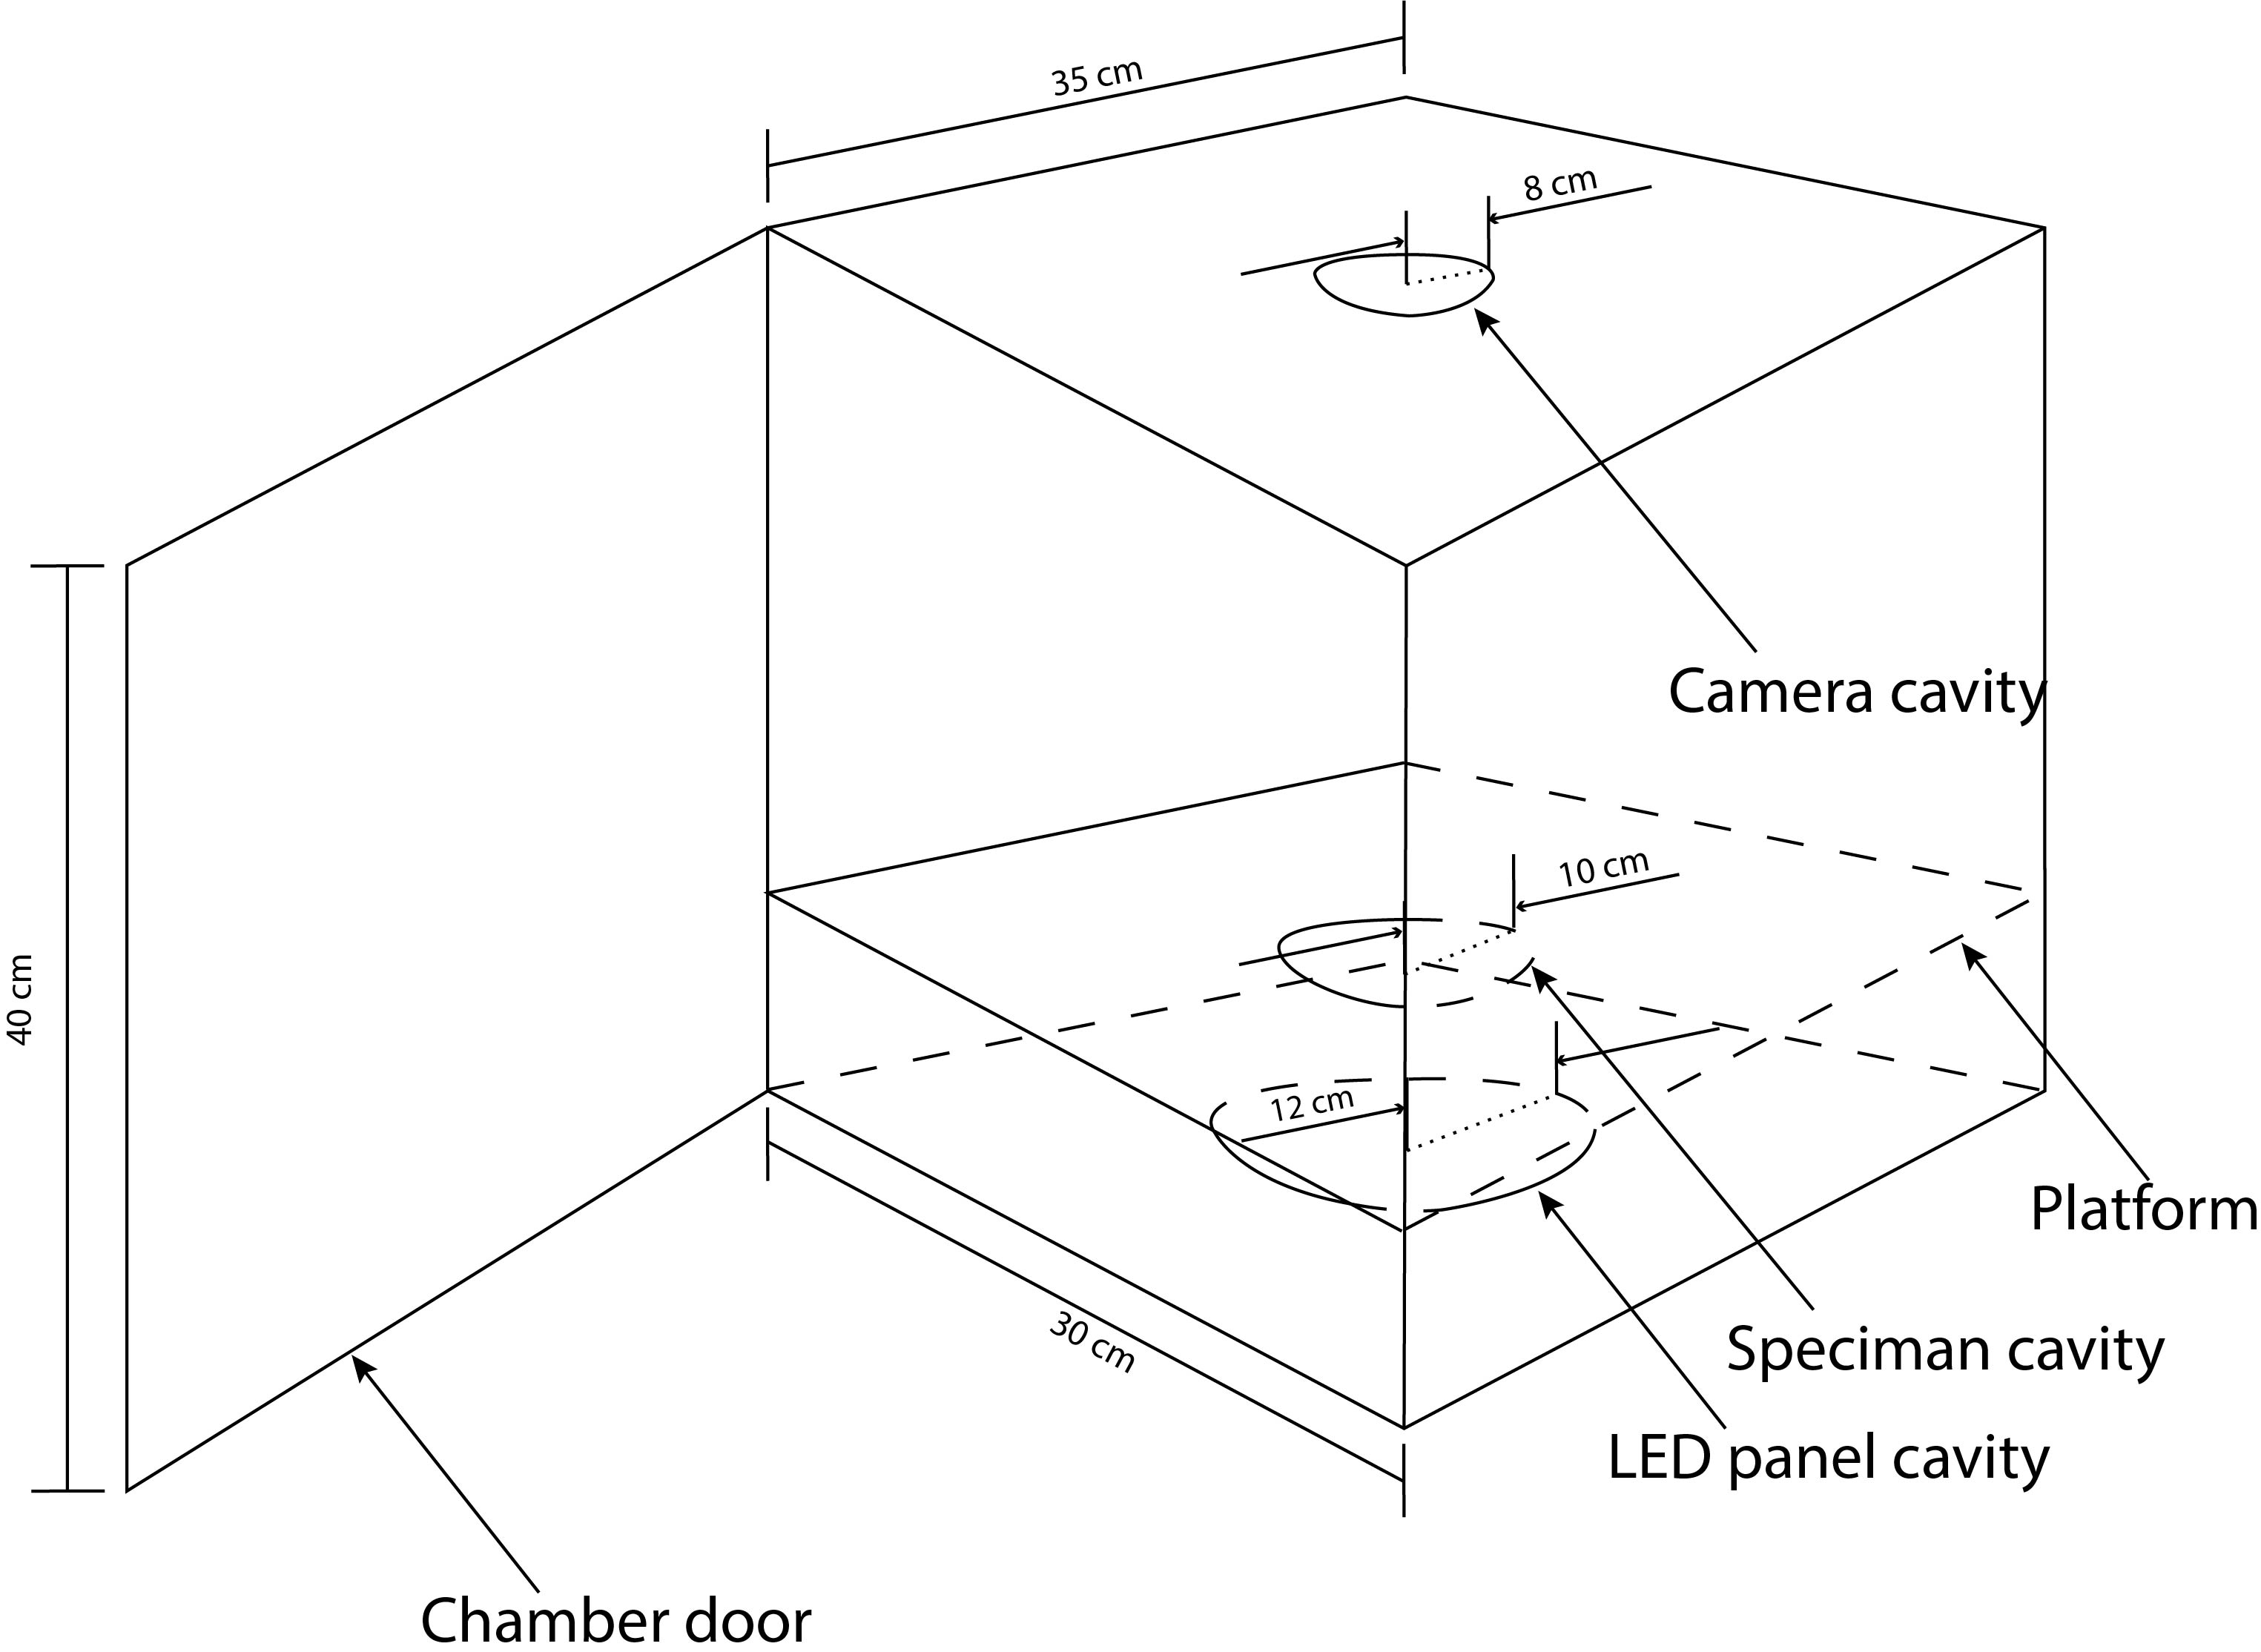
The camera used for the study is a 10-bit CMOS monochrome camera (FLIR Blackfly S Mono, 1.3 MP, USB3 Vision camera, Resolution – ) with a similar bandwidth as the illumination panel. A dark chamber was utilized to mount the camera and illumination panel, as well as to hold the liquid sample and to preclude ambient light interference on the sample and the camera. The dark chamber was fabricated using plywood with dimensions to affix the LED panel and place the specimen. Also, the design for the dark chamber is given in Fig. 1(b). The camera was mounted at the apex of the chamber to acquire the transmittance spectrum of the sample, and the cost of construction for the proposed imaging setup was USD 650, which is less than that of a low-cost HIS. A mini PC (Intel® NUC) was used to store images and to send commands to both the Discovery™ board (STM32F0DISCOVERY) and the camera. The liquid sample was contained in an opaque cylindrical container with a 10 cm diameter made of PVC and a 2 mm plain glass was affixed to the base of the hollow pipe. The monochrome camera and LED switching circuit were synchronized using a Windows batch script before capturing the images.
III-B Preparation of samples
Authentic, freshly expelled coconut oil was obtained from a reputed large-scale coconut oil producer and exporter. Potatoes were obtained from the local market, washed thoroughly with water to remove soil, peeled off, and sliced into pieces with a commercial slicer to obtain a uniform thickness of 0.5 cm, and then the slices were cut using a circular cutter to obtain a uniform diameter of 4.5 cm. The potato slices were blanched at an average temperature of 80 C for 1 min, blotted with a paper towel (Flora 2-ply kitchen paper towel), packed in zip-lock freezer bags (thickness: 2 mil, water vapour permeability: 177 g/ m2/ 24 h) and stored at -80 C in food storage refrigerators until further analysis. All the potato samples were processed and stored the day before the initial day of the experiment and used within five days. A batch of potato chips was defrosted for each day of the experiment, and the drip was blotted out before the experiment. On the first day, 1 L of coconut oil was heated to 150 C and the temperature was maintained in the range of 150 5C for 10 min by adjusting the flame of the burner. Potato slices (100 g) were fried in open pans for 3 min at 150 5C. At the time of the introduction of fresh potato slices into the fryer, it was made sure not to allow the temperature to drop below 140 C. The fried potato slices were removed from the fryer and left to drain for 5 min under ambient temperature conditions. After allowing oil samples to attain the ambient temperature, an image of repeatedly heated and reused coconut oil was acquired using the multispectral image (MSI) acquisition system. The oil was stored in edible oil cans at ambient temperatures for use on the following day, and the complete process was repeated for five consecutive days. Each day, the number of times an oil sample has been heated was incremented by one, which created a separate reheat cycle count class. The day-to-day reheating done at the consumer level was emulated by the repetitive heating cycles in sample preparation.
III-C Image pre-processing
It is necessary to treat the images to mitigate the noise effects and artefacts superimposed on the captures [79] due to various noise. Hence, the primary correction on the images was to remove any biases added by the camera’s sensor. The images were corrected using a dark current reduction step preparatory to further image improvements. In the dark current reduction step, first, an image is captured with zero-illumination in a dark environment (usually known as dark frames / dark current images), and then this dark frame is subtracted from the corresponding actual raw MSIs [80]. The dark frames were captured at the beginning of each MSI acquisition process in the implementation. After that, the dark current subtraction process was applied to subsequent MSIs utilizing the 1,
| (1) |
where, is the dark current removed image at wavelength , is the raw image at wavelength and is the dark current image. However, it is impossible to perform the spectral image normalization using white-references, which is the standard practice for reflectance-based MSIs [79] for transmittance-based due to physical constraints. Even though the white-reference normalization in the reflectance configuration can increase the resolution of the pixel values through the scaling operation, it is ineffective in the transmittance configuration as more light is passed through the specimen, thus yielding normalized values closer to unity.
Next, the nonlinear median filtering process was carried out on the dark current subtracted images to remove the aforementioned random noise from the images. Here the median filter was utilized to remove some inherent noise by removing the isolated pixels while preserving the spatial resolution [81]. The input pixel value is replaced by the moving average filter output given by,
| (2) |
where, is the replaced value of the pixel , is the pixel value of the dark current subtracted image at location, is a suitable window size, and is the number of pixels in the window. A window size of is chosen for the implementation of 2 in the application.
III-D Algorithms on reheated oil analysis
III-D1 Dataset
For the experiment, nine independent trials were conducted where the oil sample was reheated six times during each trial. In each trial, an MSI was acquired at the end of reheating for each reheating instance. After pre-processing the image, a window was cropped, which results in 900 spectral signatures for the respective reheat cycle count class under the respective trial, and when accounted for the nine trials, 8100 spectral signatures were recorded for each reheat cycle count class. Since there were six classes, a dataset with a size of 48600 spectral signatures were recorded and made available for public access [82]. This dataset was used for both studies, nonetheless, with the reformation of the dataset as appropriately.
For the first study in III-D2, labelled sets are required to train the classifier with the reheat cycle count as the class label. According to related work on using multispectral images to detect oil-containing salad dressing [61], a sample size of 44.6 is sufficient for each class to produce a statistically significant result according to [83]. Hence, sixty labelled sets were prepared from the 8100 spectral signatures recorded for each reheat cycle count class. Consequently, each labelled set included 135 spectral signatures once the 8100 signatures of each reheat cycle count class were divided amongst the sixty sets, and the reformed dataset consisted of a total of 360 labelled sets. Next, a training-testing split of 80:20 was used on the sixty labelled sets from each reheat cycle count class.
For the second study in III-D3, the proposed method identifies significant property changes in the same oil sample as the reheat cycle count is increased through unsupervised classification of the multispectral images. Since the image data from different trails should not be mixed and the learning technique is unsupervised, the labelled sets used for the first study can not be used here. Instead, the original dataset was separated according to their respective trial to create nine subsets of data, and each subset included the spectral signatures for all six reheat cycle count classes of that trial. Accordingly, each subset, therefore, constituted a total of 5400 spectral signatures.
III-D2 Reheat cycle count estimation
The first objective of the study was to estimate the number of times a given coconut oil sample has been reheated as compared to a pure sample. Since the estimated quantity is a discrete variable, the estimation problem can be converted to a classification problem. To construct the classifier, first, the dimension of the training dataset was reduced with FDA. Even though the classifier could be trained to output the estimated reheat cycle count of each pixel — with the reduced spectral signature at each pixel considered as the input — and then attempt to interpret the reheat cycle count class of the image in a post-analysis, it is more pertinent to determine the reheat cycle count of the entire oil sample at once with the input image for the classifier. For that, the input to the classifier has to be constructed by concatenating the individual spectral signatures of each sample. However, this circumscribes the selection of an appropriate sample size of choice. To that end, the classifier was developed to use the statistics of the sample rather than raw signatures, and the use of statistics relieves the constraints on the sample size and the requirement of a post-analysis of a pixel-level classification.
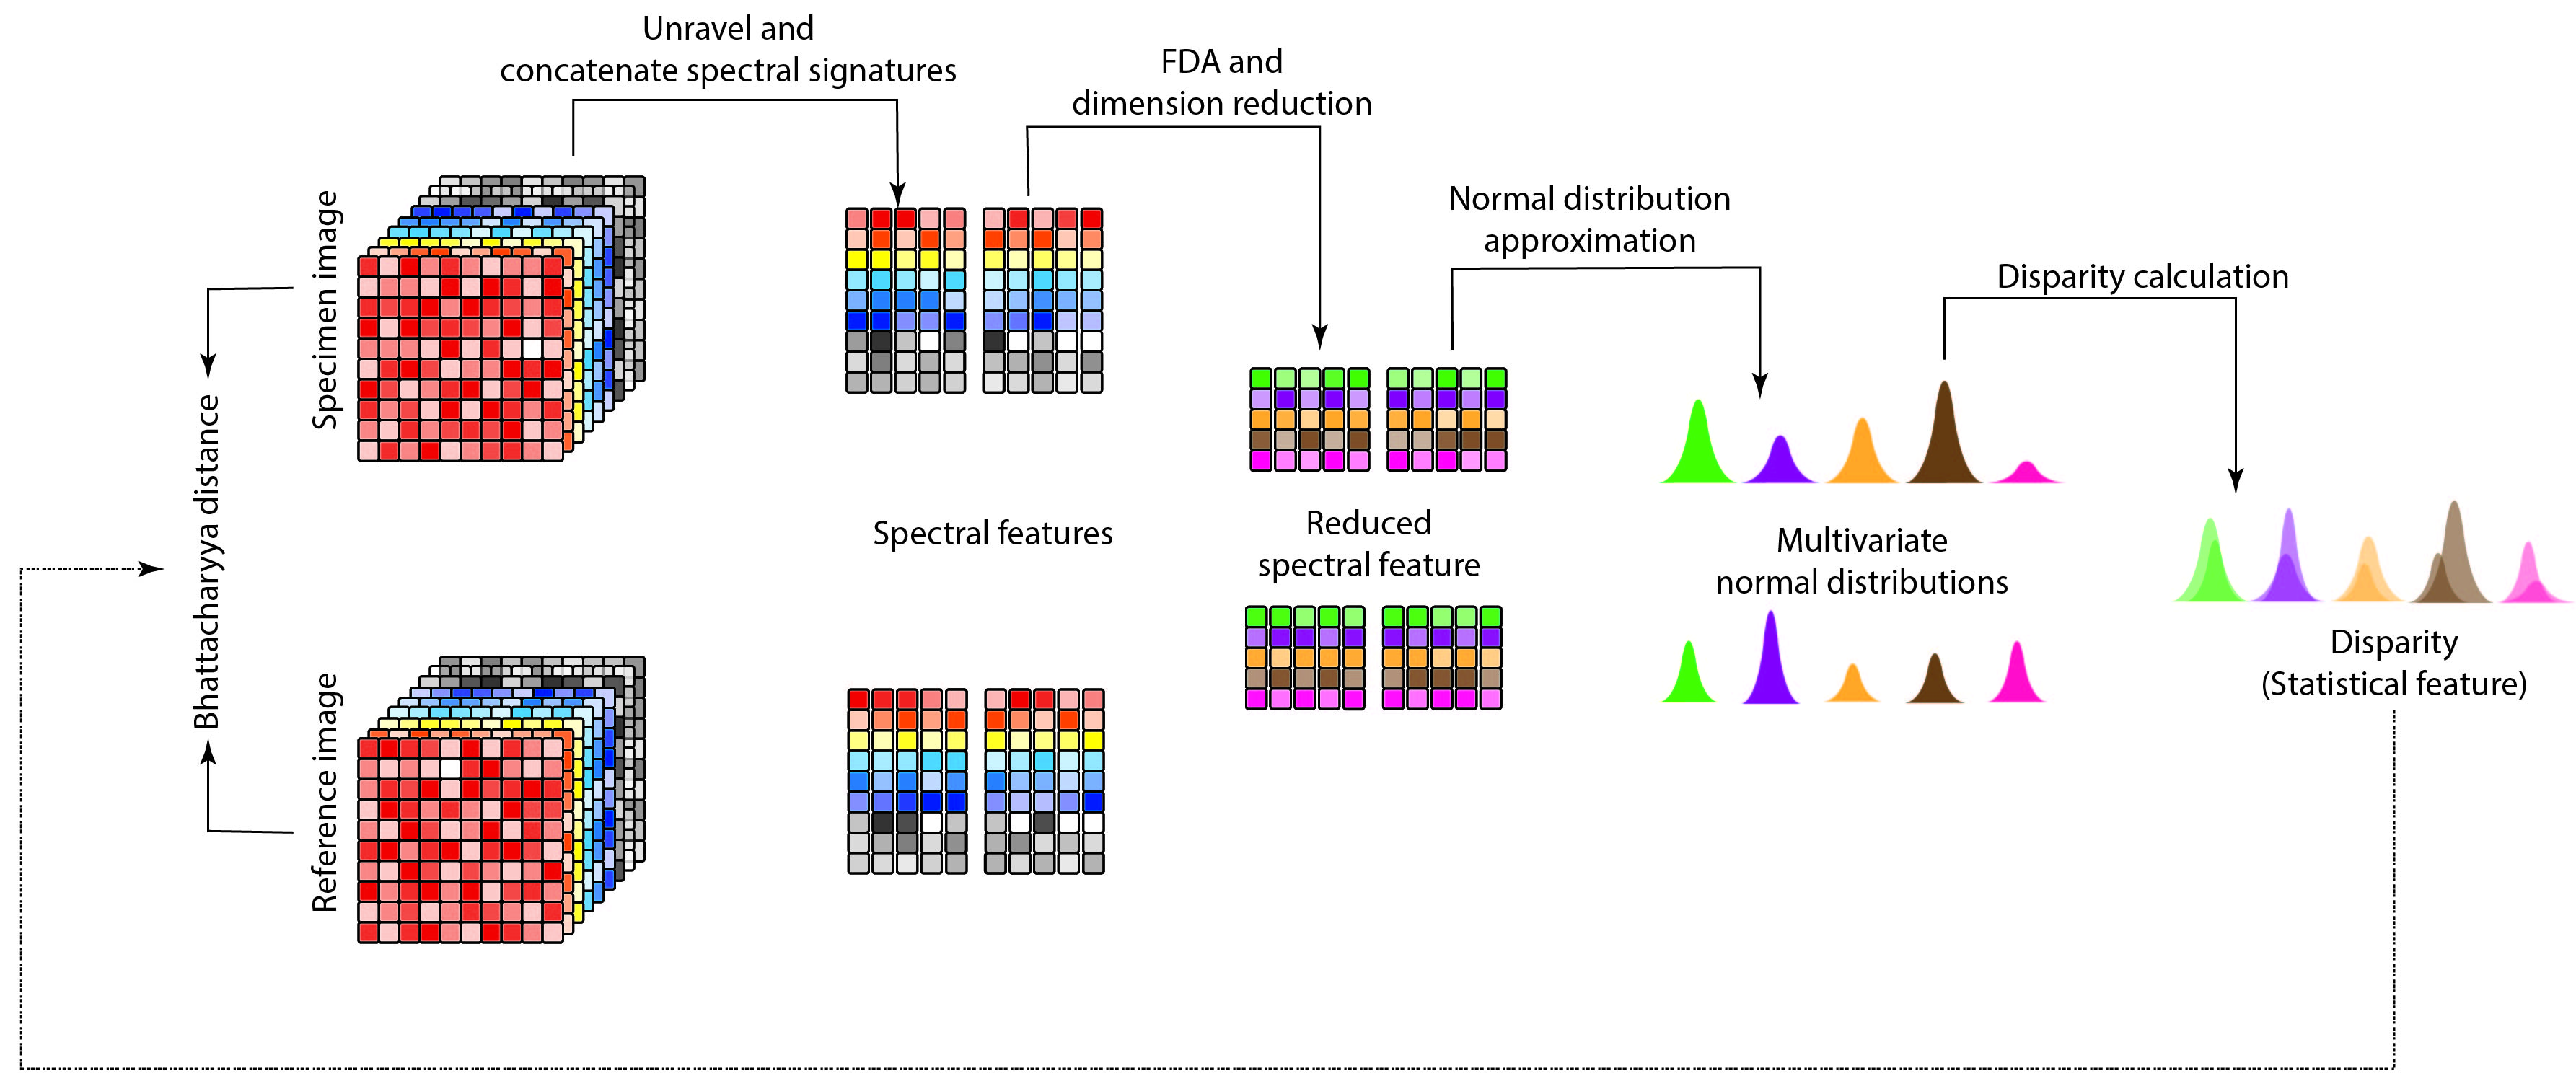
Here, a separate pure oil sample was used as the reference sample to compute Bhattacharyya distance, and each reheated oil sample was a target sample. Bhattacharyya distance () is a measure of the similarity between two distributions and can be calculated according to 5 for multivariate normal distributions,
| (3) | ||||
| (4) | ||||
| (5) |
with , as the mean signature and the covariance matrix of the target oil sample, and , as the mean signature and the covariance matrix of the reference oil sample. Then and represent the Mahalanobis distance and variance disparity between the two distributions. With the calculation of Bhattacharyya distance (), the spectral features of the oil samples will be converted to a statistical feature and this uni-dimensional feature is used for the classification of reheat count classes. The conversion sequence from spectral features to the statistical feature is summarized in Fig. 2.
For the classification of the sample, a Support Vector Machine (SVM) [84, 85] classifier was used to find the optimal decision thresholds with Bhattacharyya distance. The resulting linear decision boundaries from the use of a single input espoused the use of an SVM classifier, as the SVM classifier is superior at finding the best hyperplanes which maximally separate different classes (see Appendix A). An SVM classifier with the radial basis function as the kernel was constructed using five-fold cross-validation. The parameter and the cost were chosen through a parametric sweep (see Appendix B) for the optimal combination of the two parameters. The SVM model was evaluated for all data points using the accuracy of the classification, and since the dataset used for training was balanced, the accuracy was defined as in 6 as below,
| (6) |
with the terms true-positive (TP), true-negative (TN), false-positive (FP), and false-negative (FN).
III-D3 Discrimination of appreciable alterations
The number of reheating cycles of an oil sample is a discrete realization of an underlying continuous process, vis-à-vis, changes in chemical properties. Even though the control parameters (temperature and duration) were maintained uniform throughout different trials, frying of different potato batches could change the chemical properties of the oil gradually or abruptly at consecutive reheats. Therefore, identifying any sudden change in oil properties is an indicator of significant damage to the oil with a step increment in the reheat cycle count. However, the development of the discriminator falls within the realms of unsupervised learning because the developed framework has to be applicable in the case of other fryable foods. Since the framework’s objective is to realize reheat cycle count classes where a noticeable change has occurred in the oil, the problem could be transformed into an unsupervised clustering problem, wherein only gradual changes have had happened with the number of reheat cycle counts in each cluster. However, to group these reheat cycle count classes, it is imperative to determine the optimal number of clusters considering the global structure of the spectral signatures prior to clustering. To that end, spectral clustering (SC) [86] is an apposite clustering algorithm that facilitates the consideration of the global structure of the dataset and the search for the optimal number of clusters in the dataset. SC uses the spectral connectivity of the dataset to group data; hence the connectivity amongst data points has to be improved for optimal grouping. Sigma-sweep [87] was performed to augment the spectral connectivity, according to 7 as below,
| (7) | ||||
| (8) | ||||
| (9) |
where, is the affinity matrix, is the degree matrix, is the Graph Laplacian and is the identity matrix. A Gaussian kernel was used to compute the affinity matrix, with and denoting the and signatures of the set of spectral signatures for the oil sample and as the radius of neighbourhood. Then, denotes the matrix element at the th row and th column of the matrix .
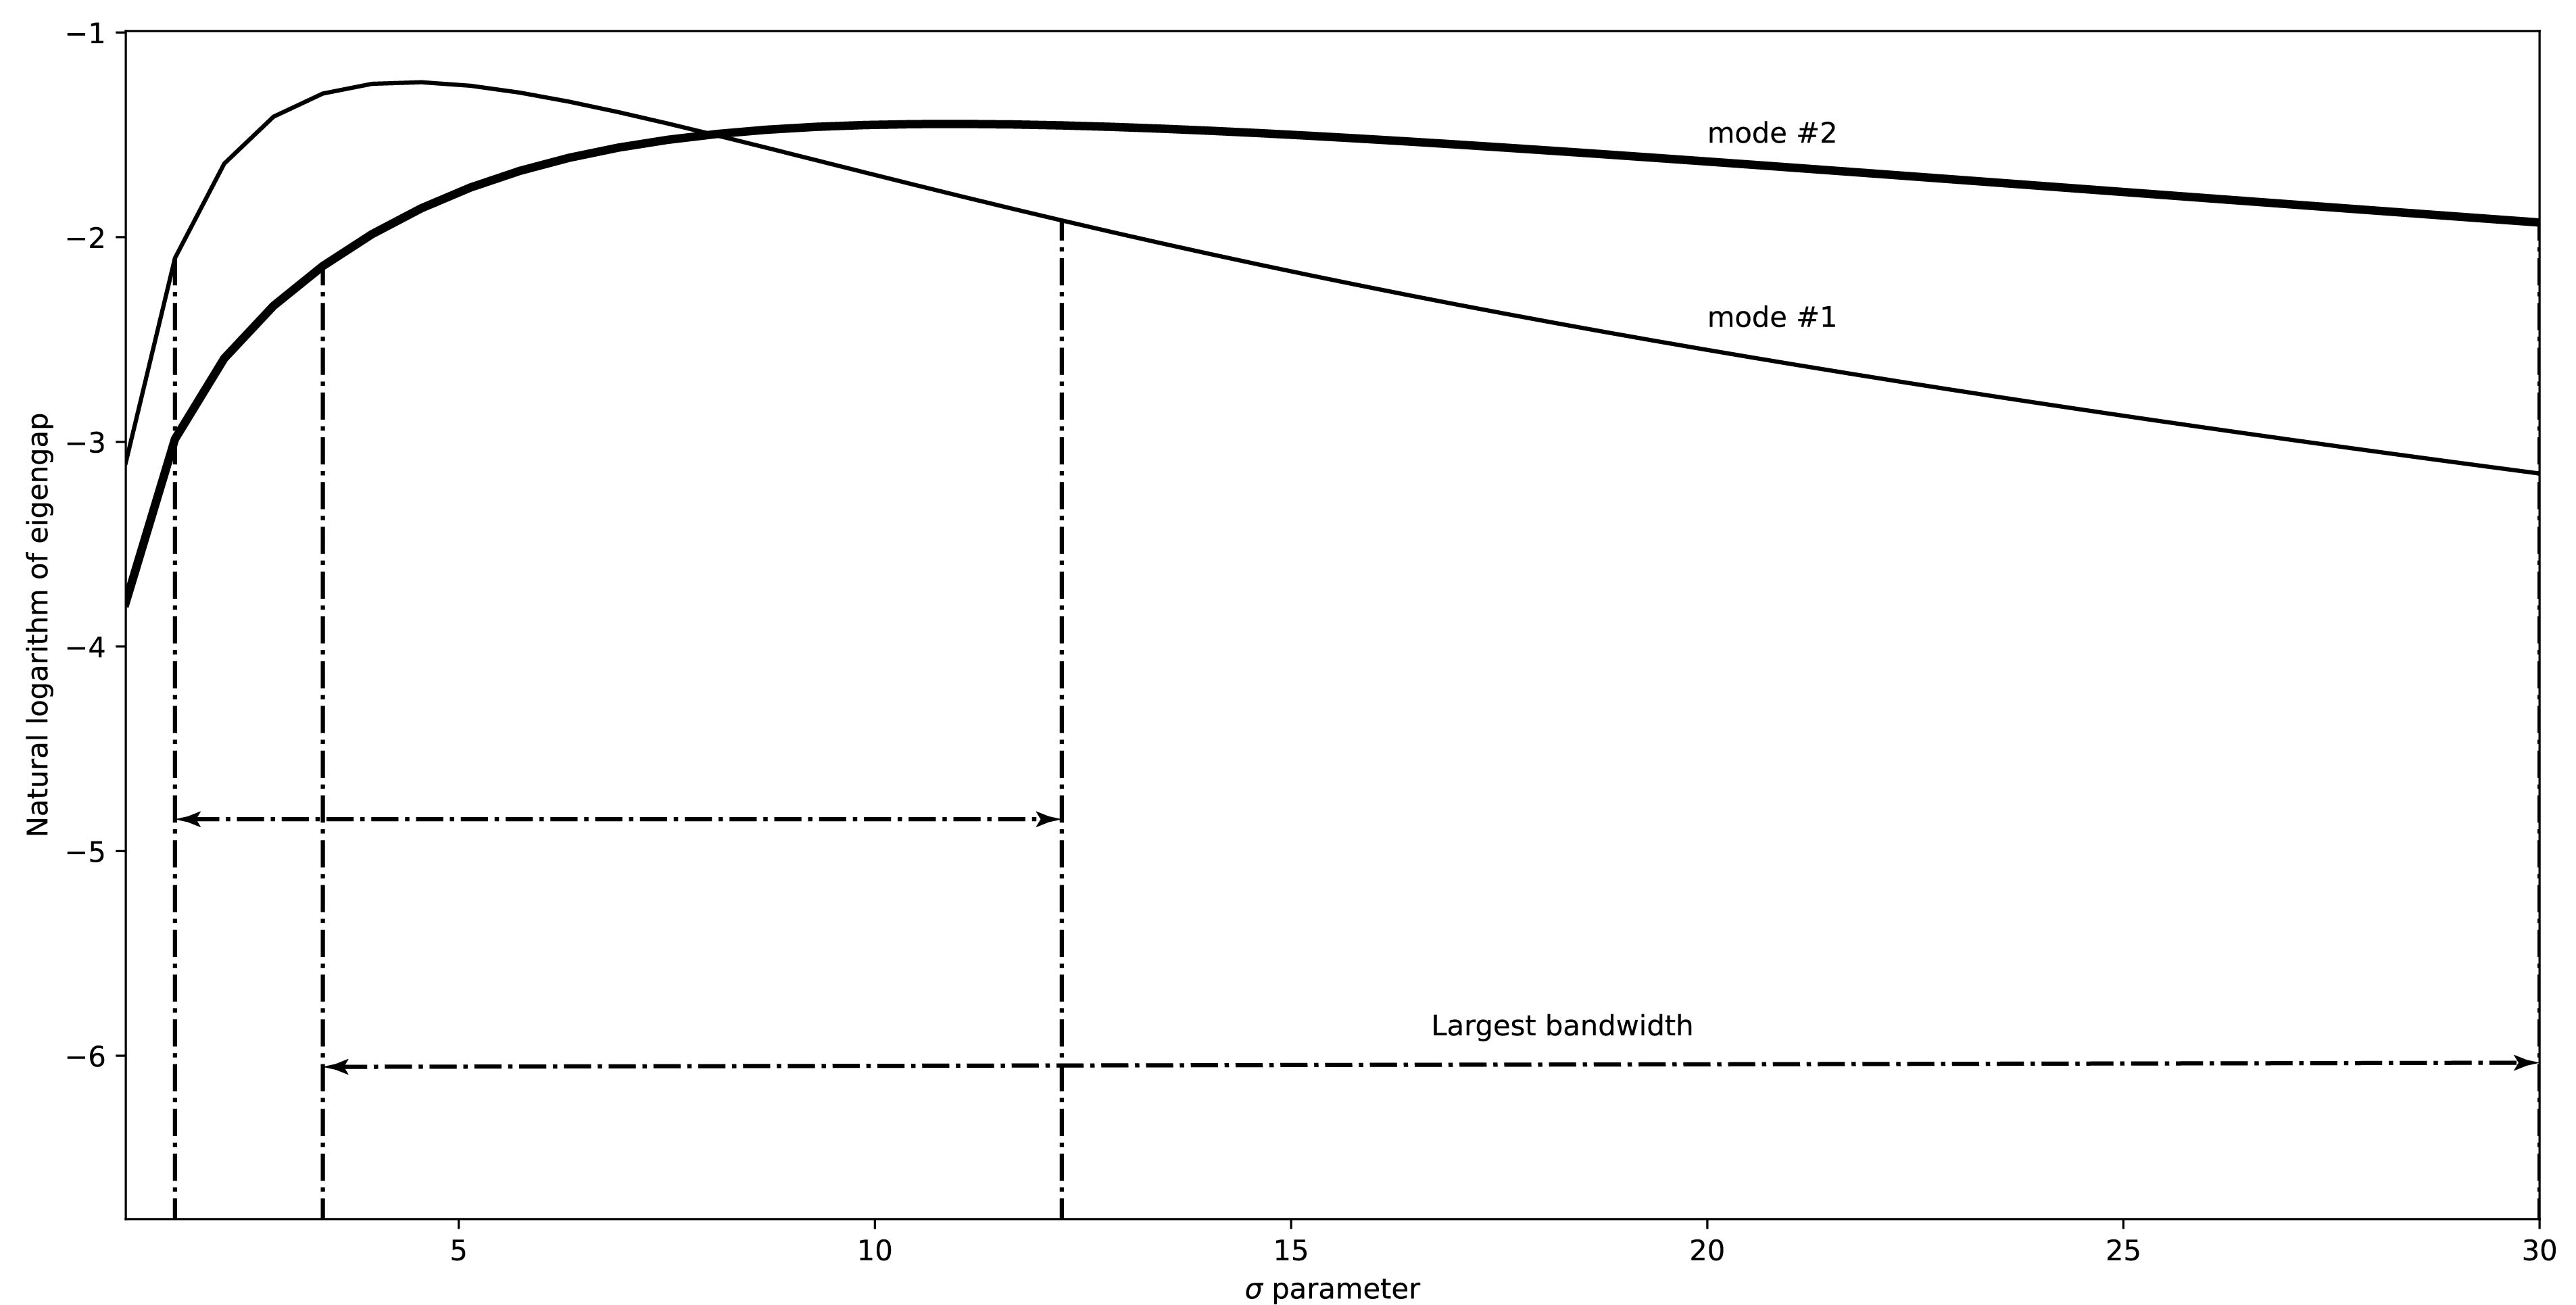
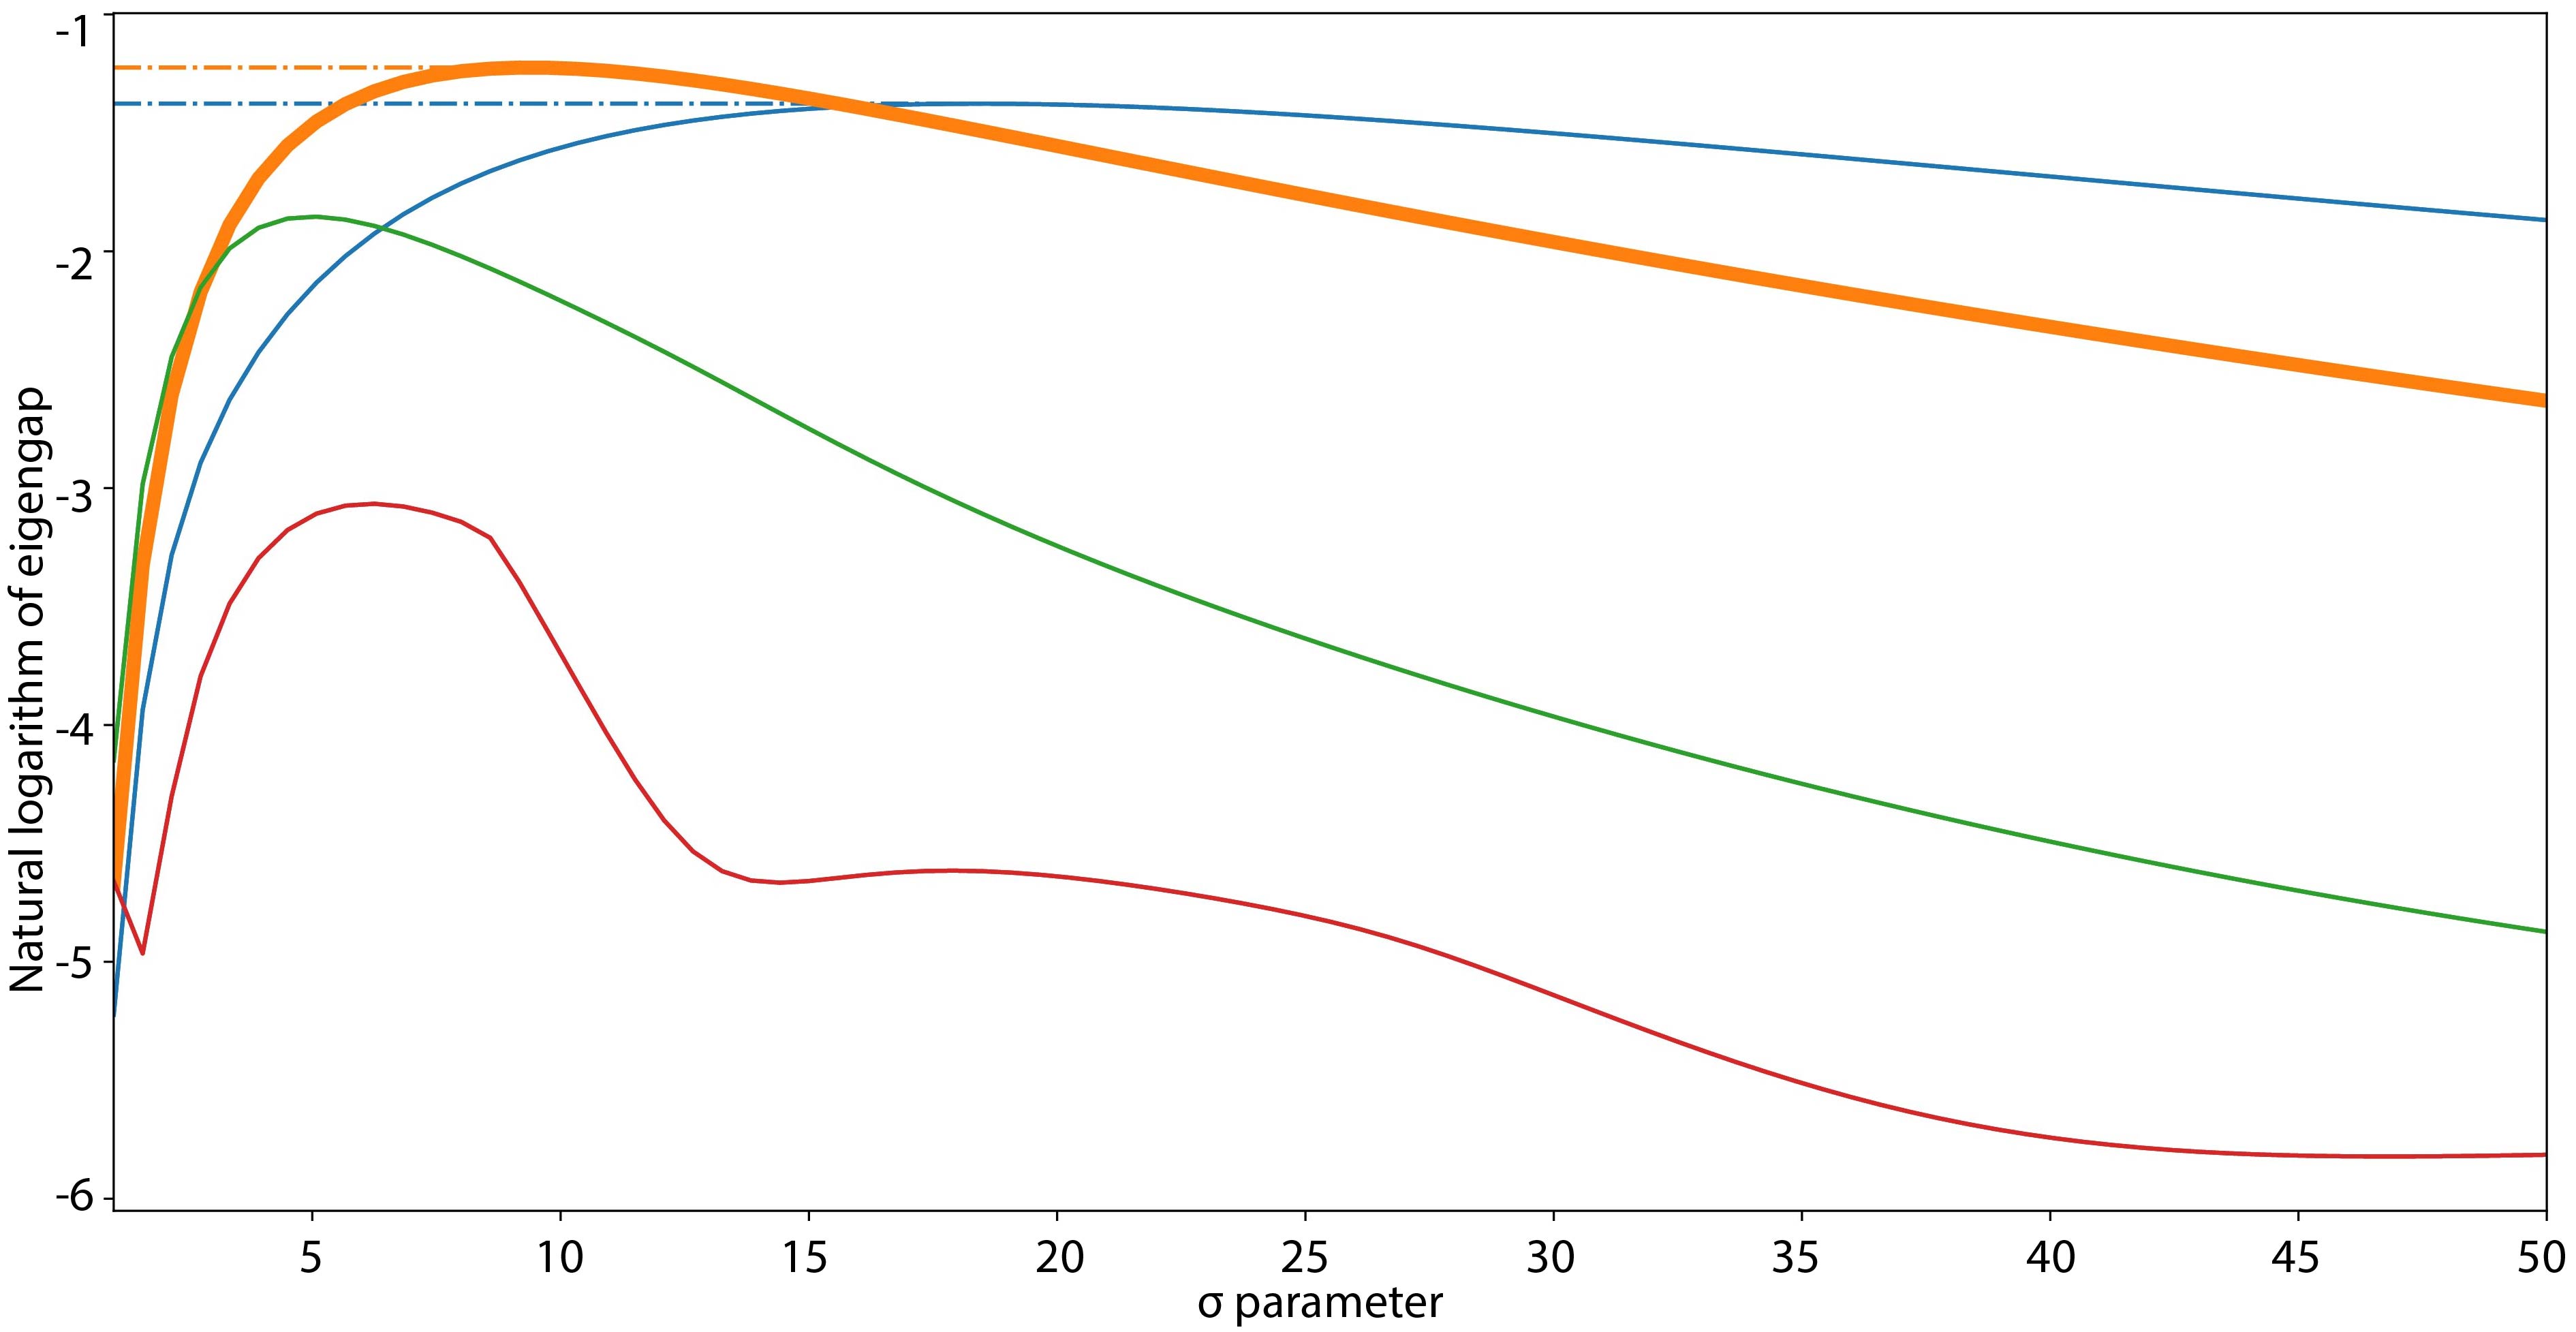
In the sigma-sweep, the tuning parameter () was increased from since the requirement was to group different reheat cycle count classes rather than detecting sub-clusters within a class. This grouping method will lump classes with marginal changes in spectral properties together while separating reheat cycle count class clusters with significant changes. Accordingly, the outcome of the grouping is the formation of umbrella clusters of classes with incremental changes in spectral properties — which reflects the chemical characteristics of the oil — due to reheating. Hence, the inter-class boundaries demarcate significant or perhaps critical changes in composition and are worthy of identification because of the health risks. Then, to determine the optimal number of clusters, the eigengaps were considered between the third and sixth eigengap, where eigengap is the difference between consecutive eigenvalues of in the ascending order.
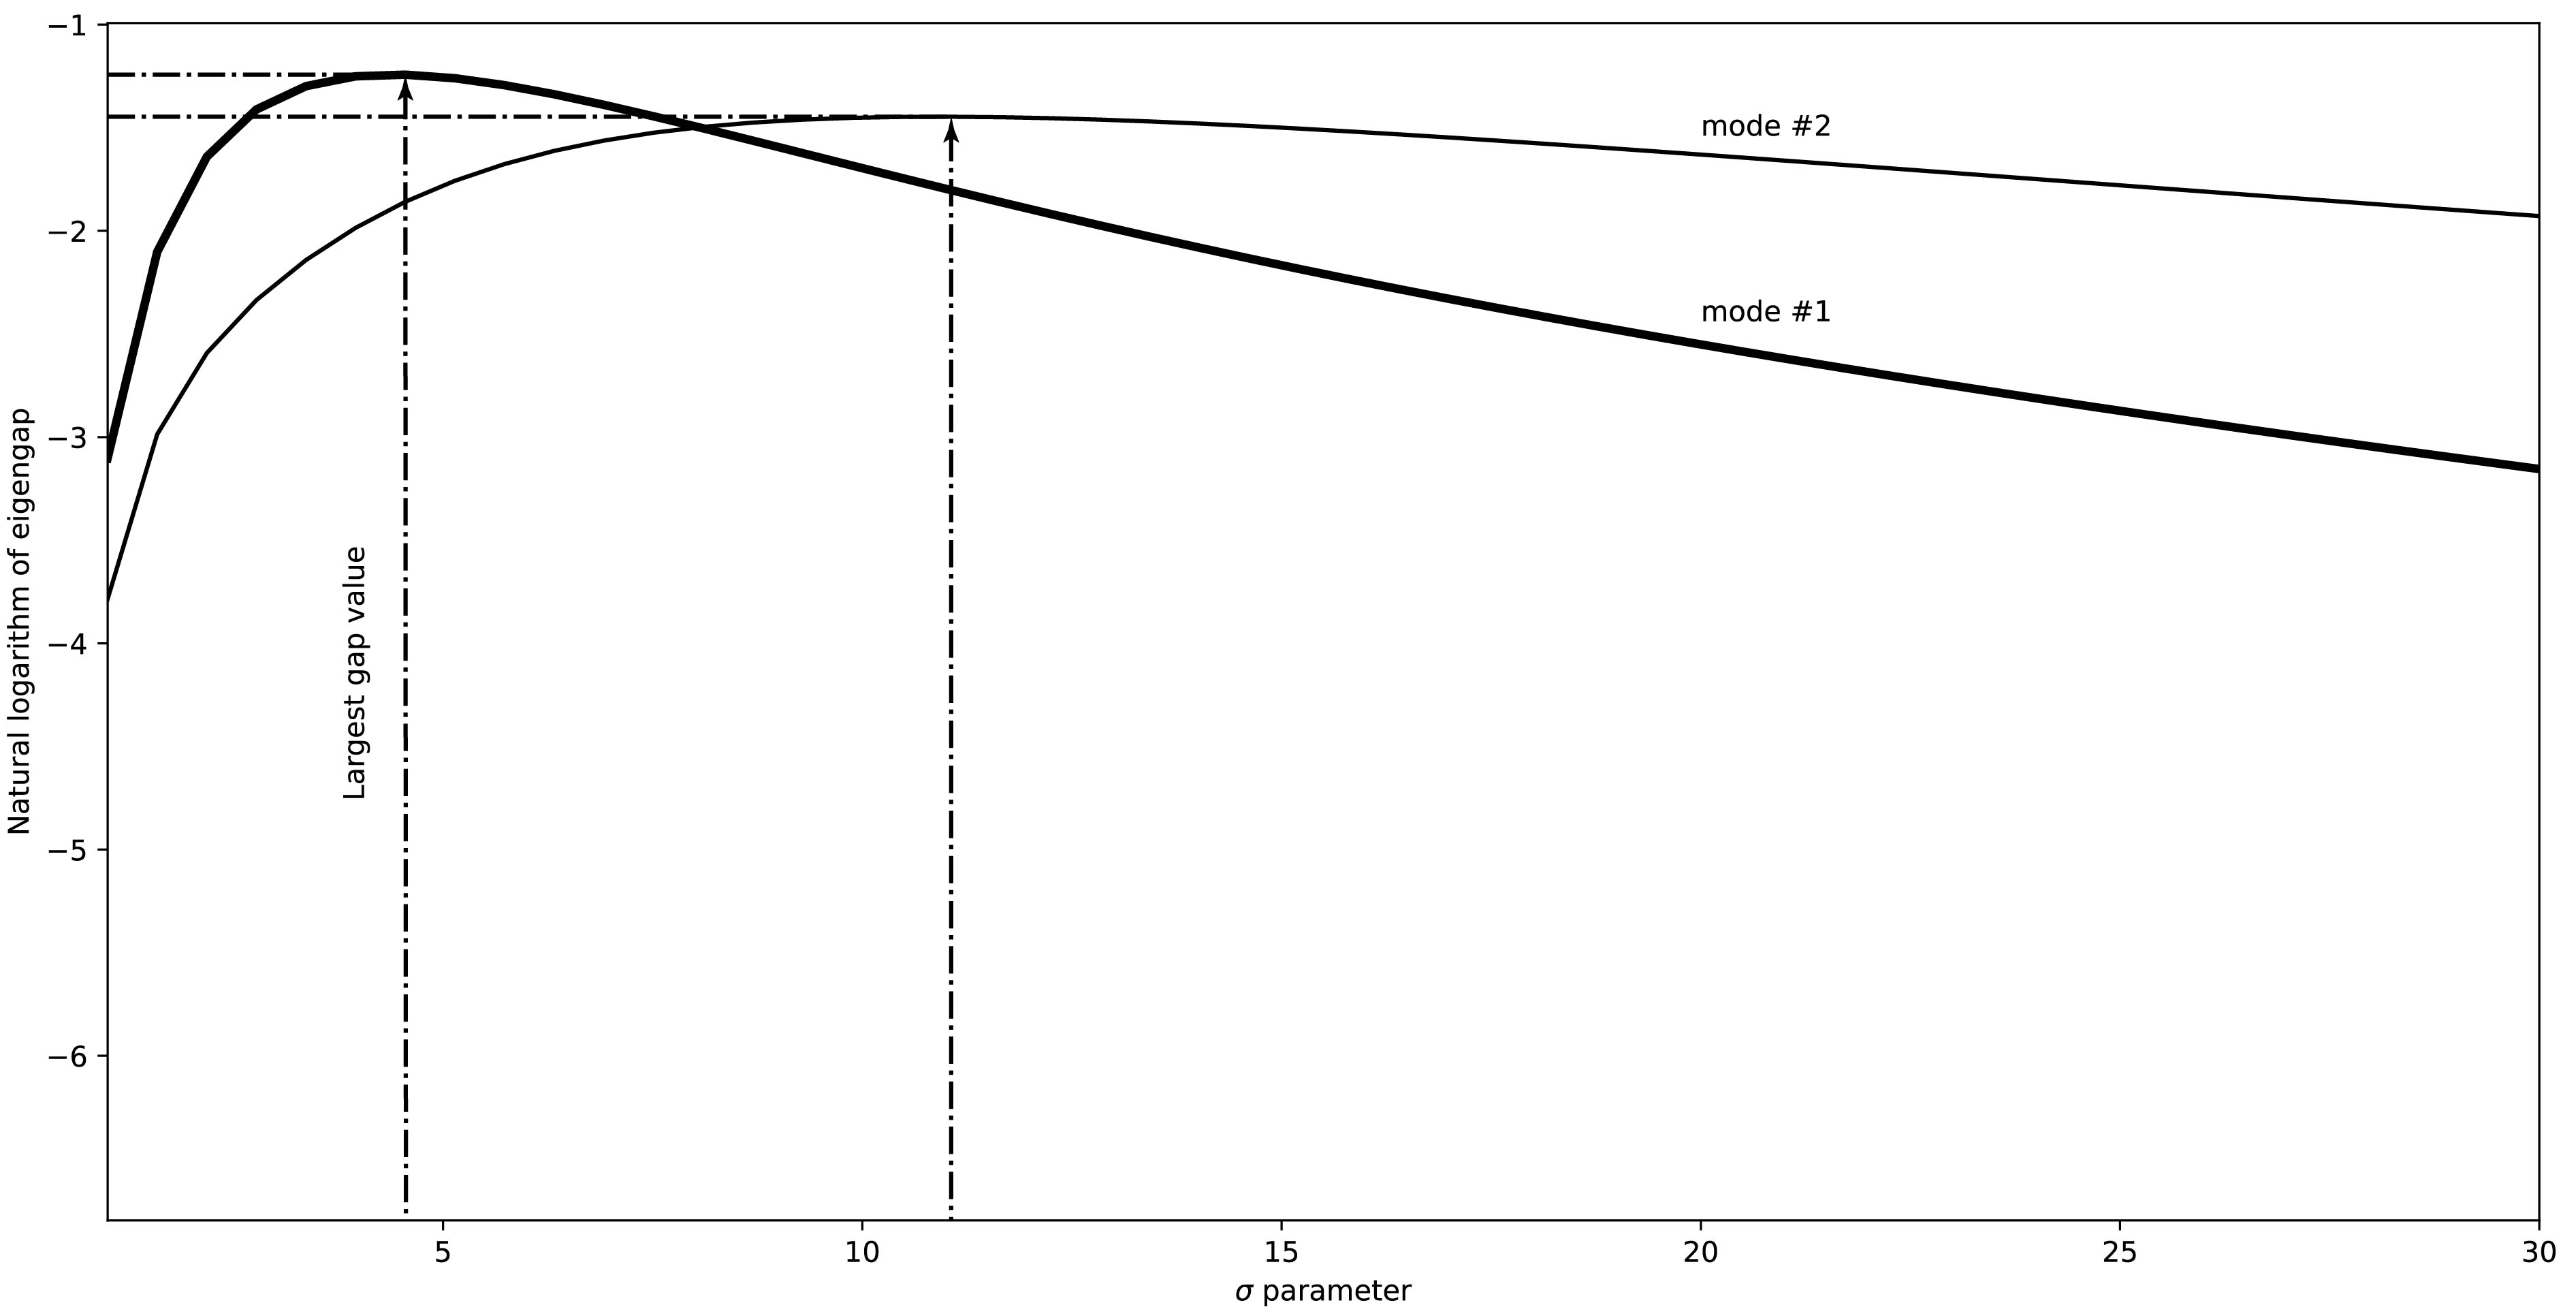
Two selection algorithms were used to select the optimal number of clusters, considering the variation of the sigma-sweep curves.
-
1.
Largest gap value (LGV): the eigengap with the highest gap value was considered as the prominent mode. The connectivity of the spectral signatures is at its summit for the resulting prominent mode.
-
2.
Largest bandwidth (LBW): the eigengap with the largest span for which the gap values are higher than half the maximum gap value for that mode was considered as the prominent mode. The connectivity of the spectral signatures is more stable in the prominent mode than the structures resulting from the rest of the modes.
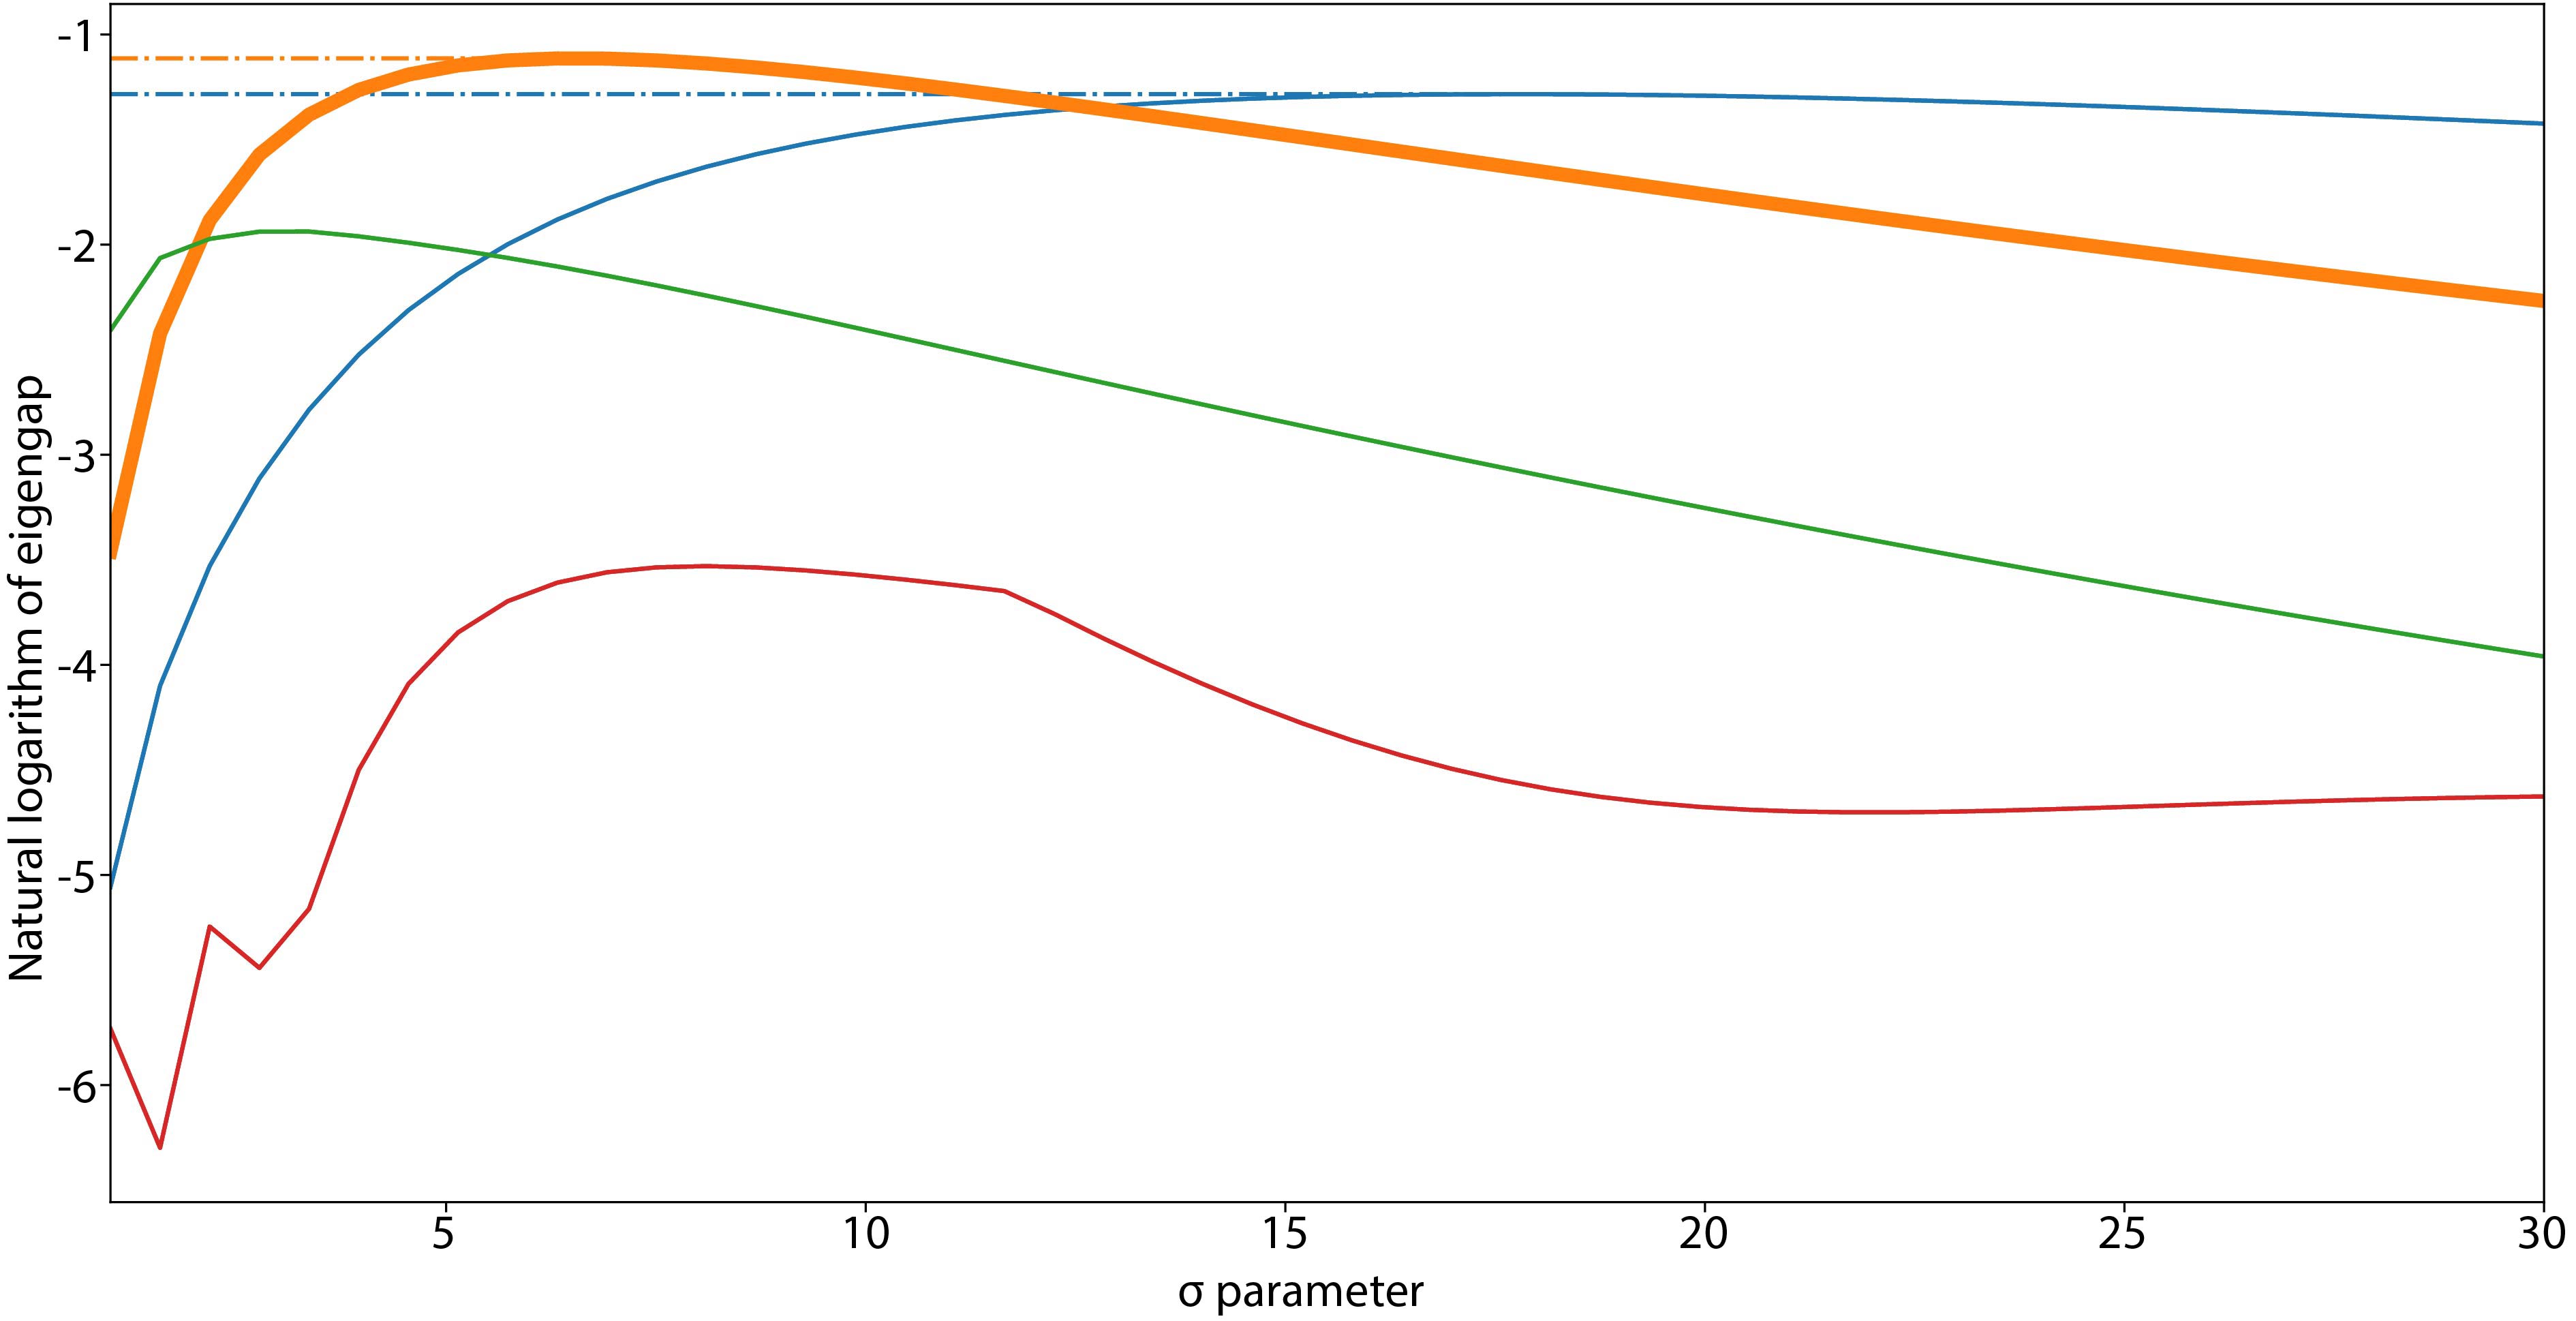
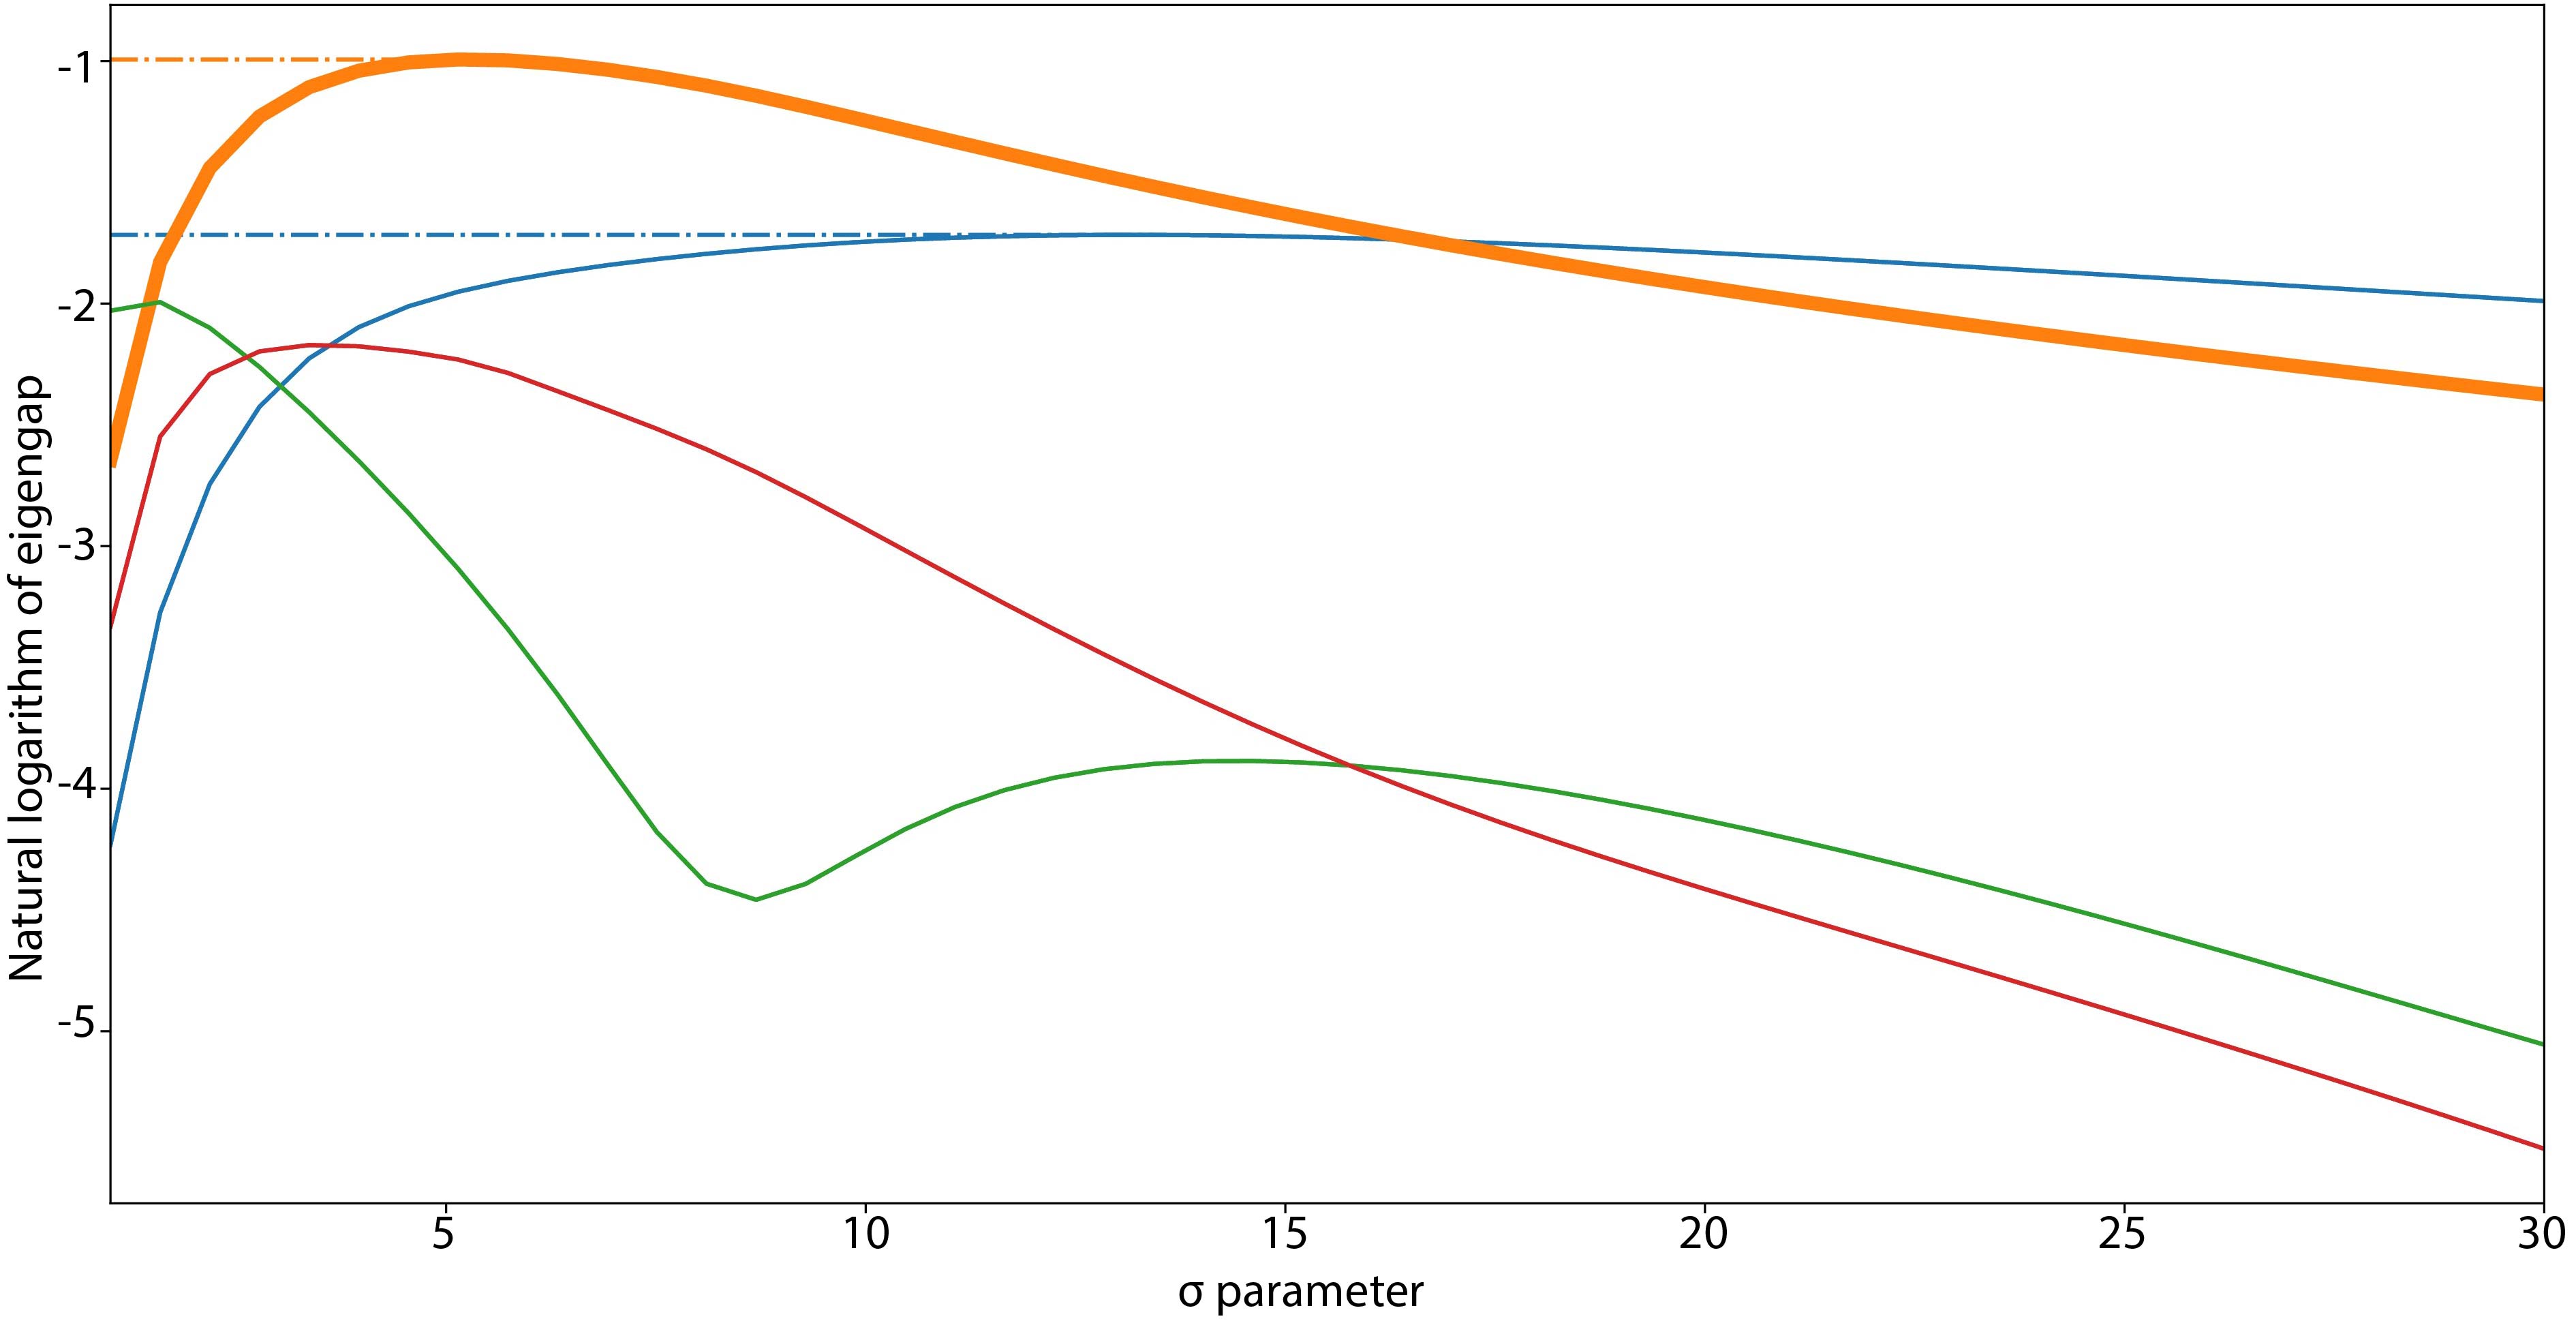
Once the prominent mode is selected, the value for which the highest gap value was recorded for the prominent mode was selected as the dominant under each selection algorithm. The dominant improves the spectral connectivity, and the prominent mode gives the optimal number of clusters. In Fig. 3, the curve characteristics corresponding to the two selection algorithms are demonstrated. Once these two parameters (prominent mode and dominant ) are computed, the reheat cycle count classes are clustered using SC to distinguish the classes that have had a marked change in the spectral properties from one reheat cycle count class to the next.
IV Results
IV-A Multispectral imagery vs. RGB photography
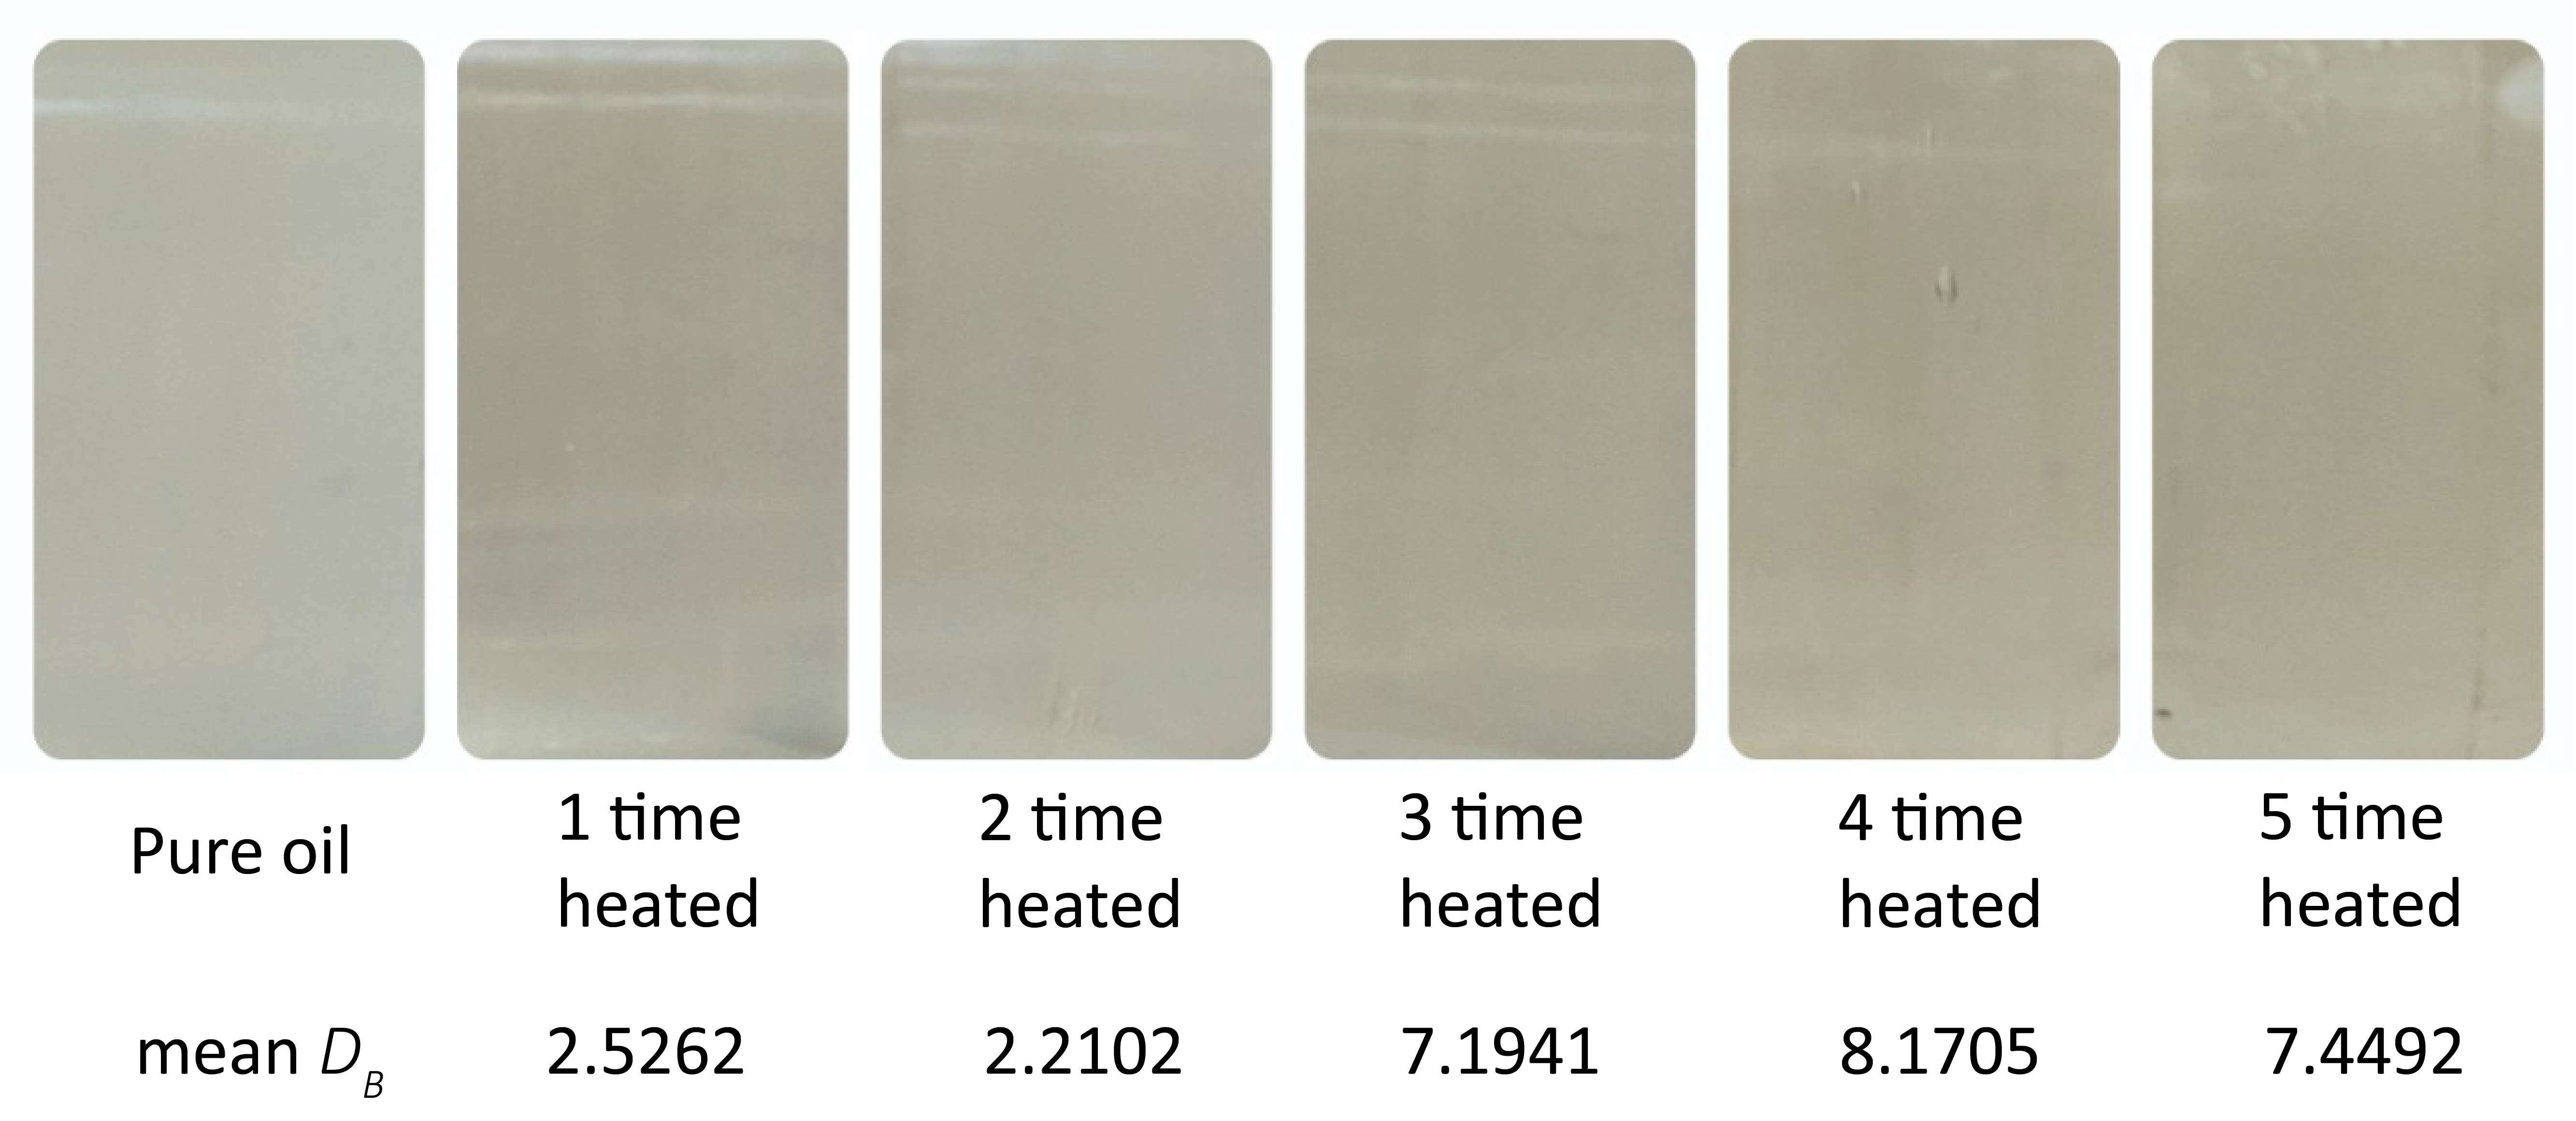
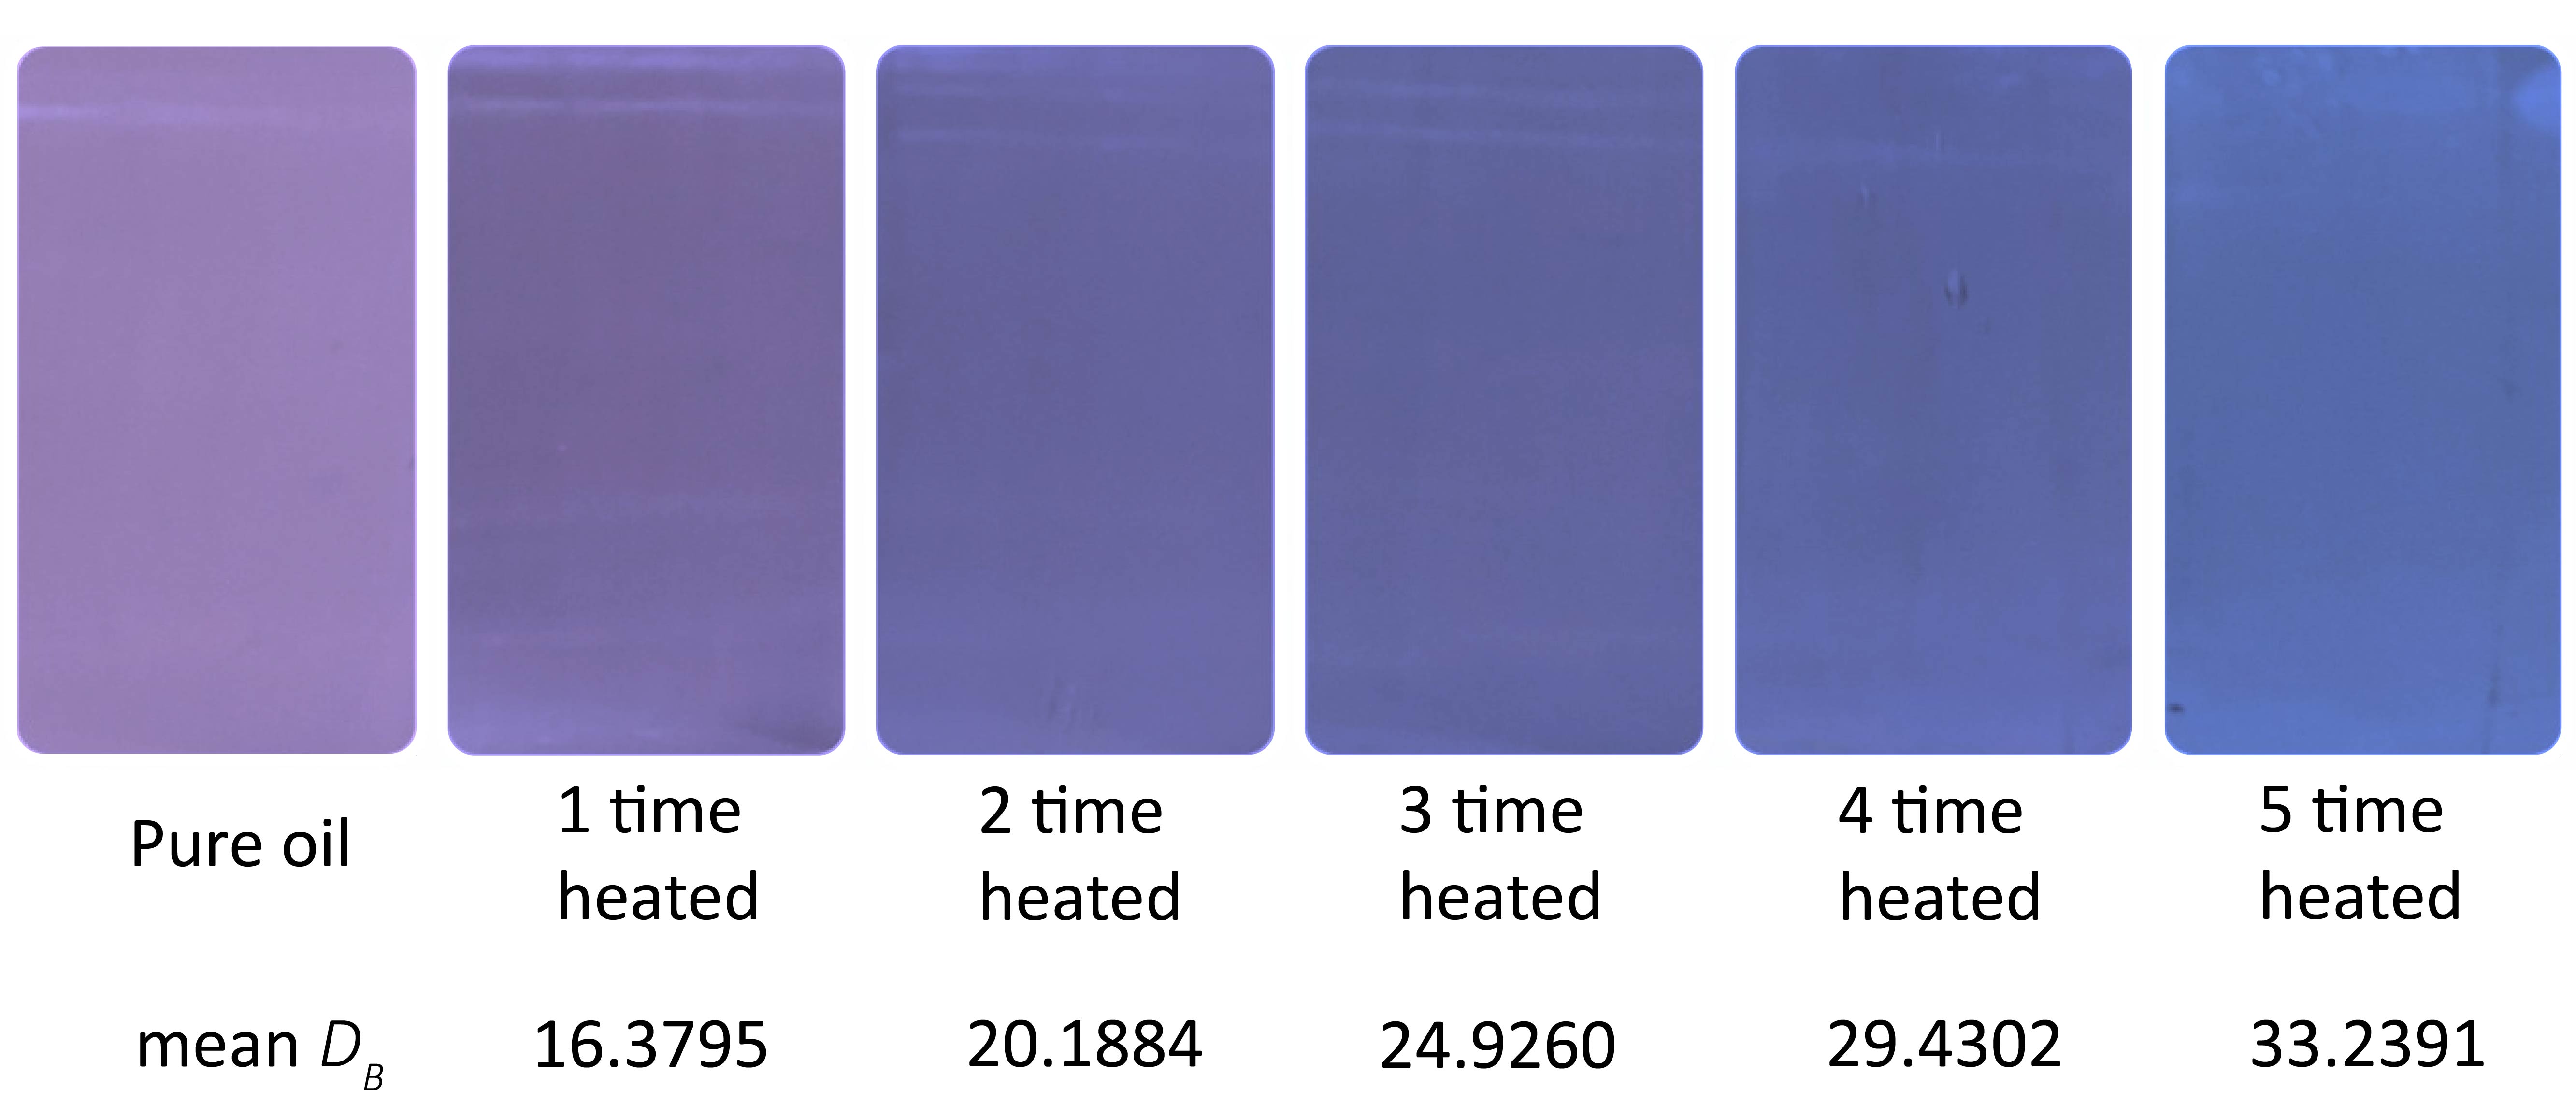
The premise for the application of image analysis is that the changes in the oil properties are observable by the spectral properties of the oil sample. For illustration, the true-colour image under RGB photography is given in Fig. 4(a) of the same oil batch for different reheat cycle count classes. The false RGB representation of the MSIs of the same oil batch is provided in Fig. 4(b) to demonstrate the differentiation capability of the MIS, as the raft of dimensions of MSIs are cumbersome to be showcased. Also, the mean Bhattacharyya distance to each reheat cycle count class from the pure oil class is given under each class for both the imaging techniques.
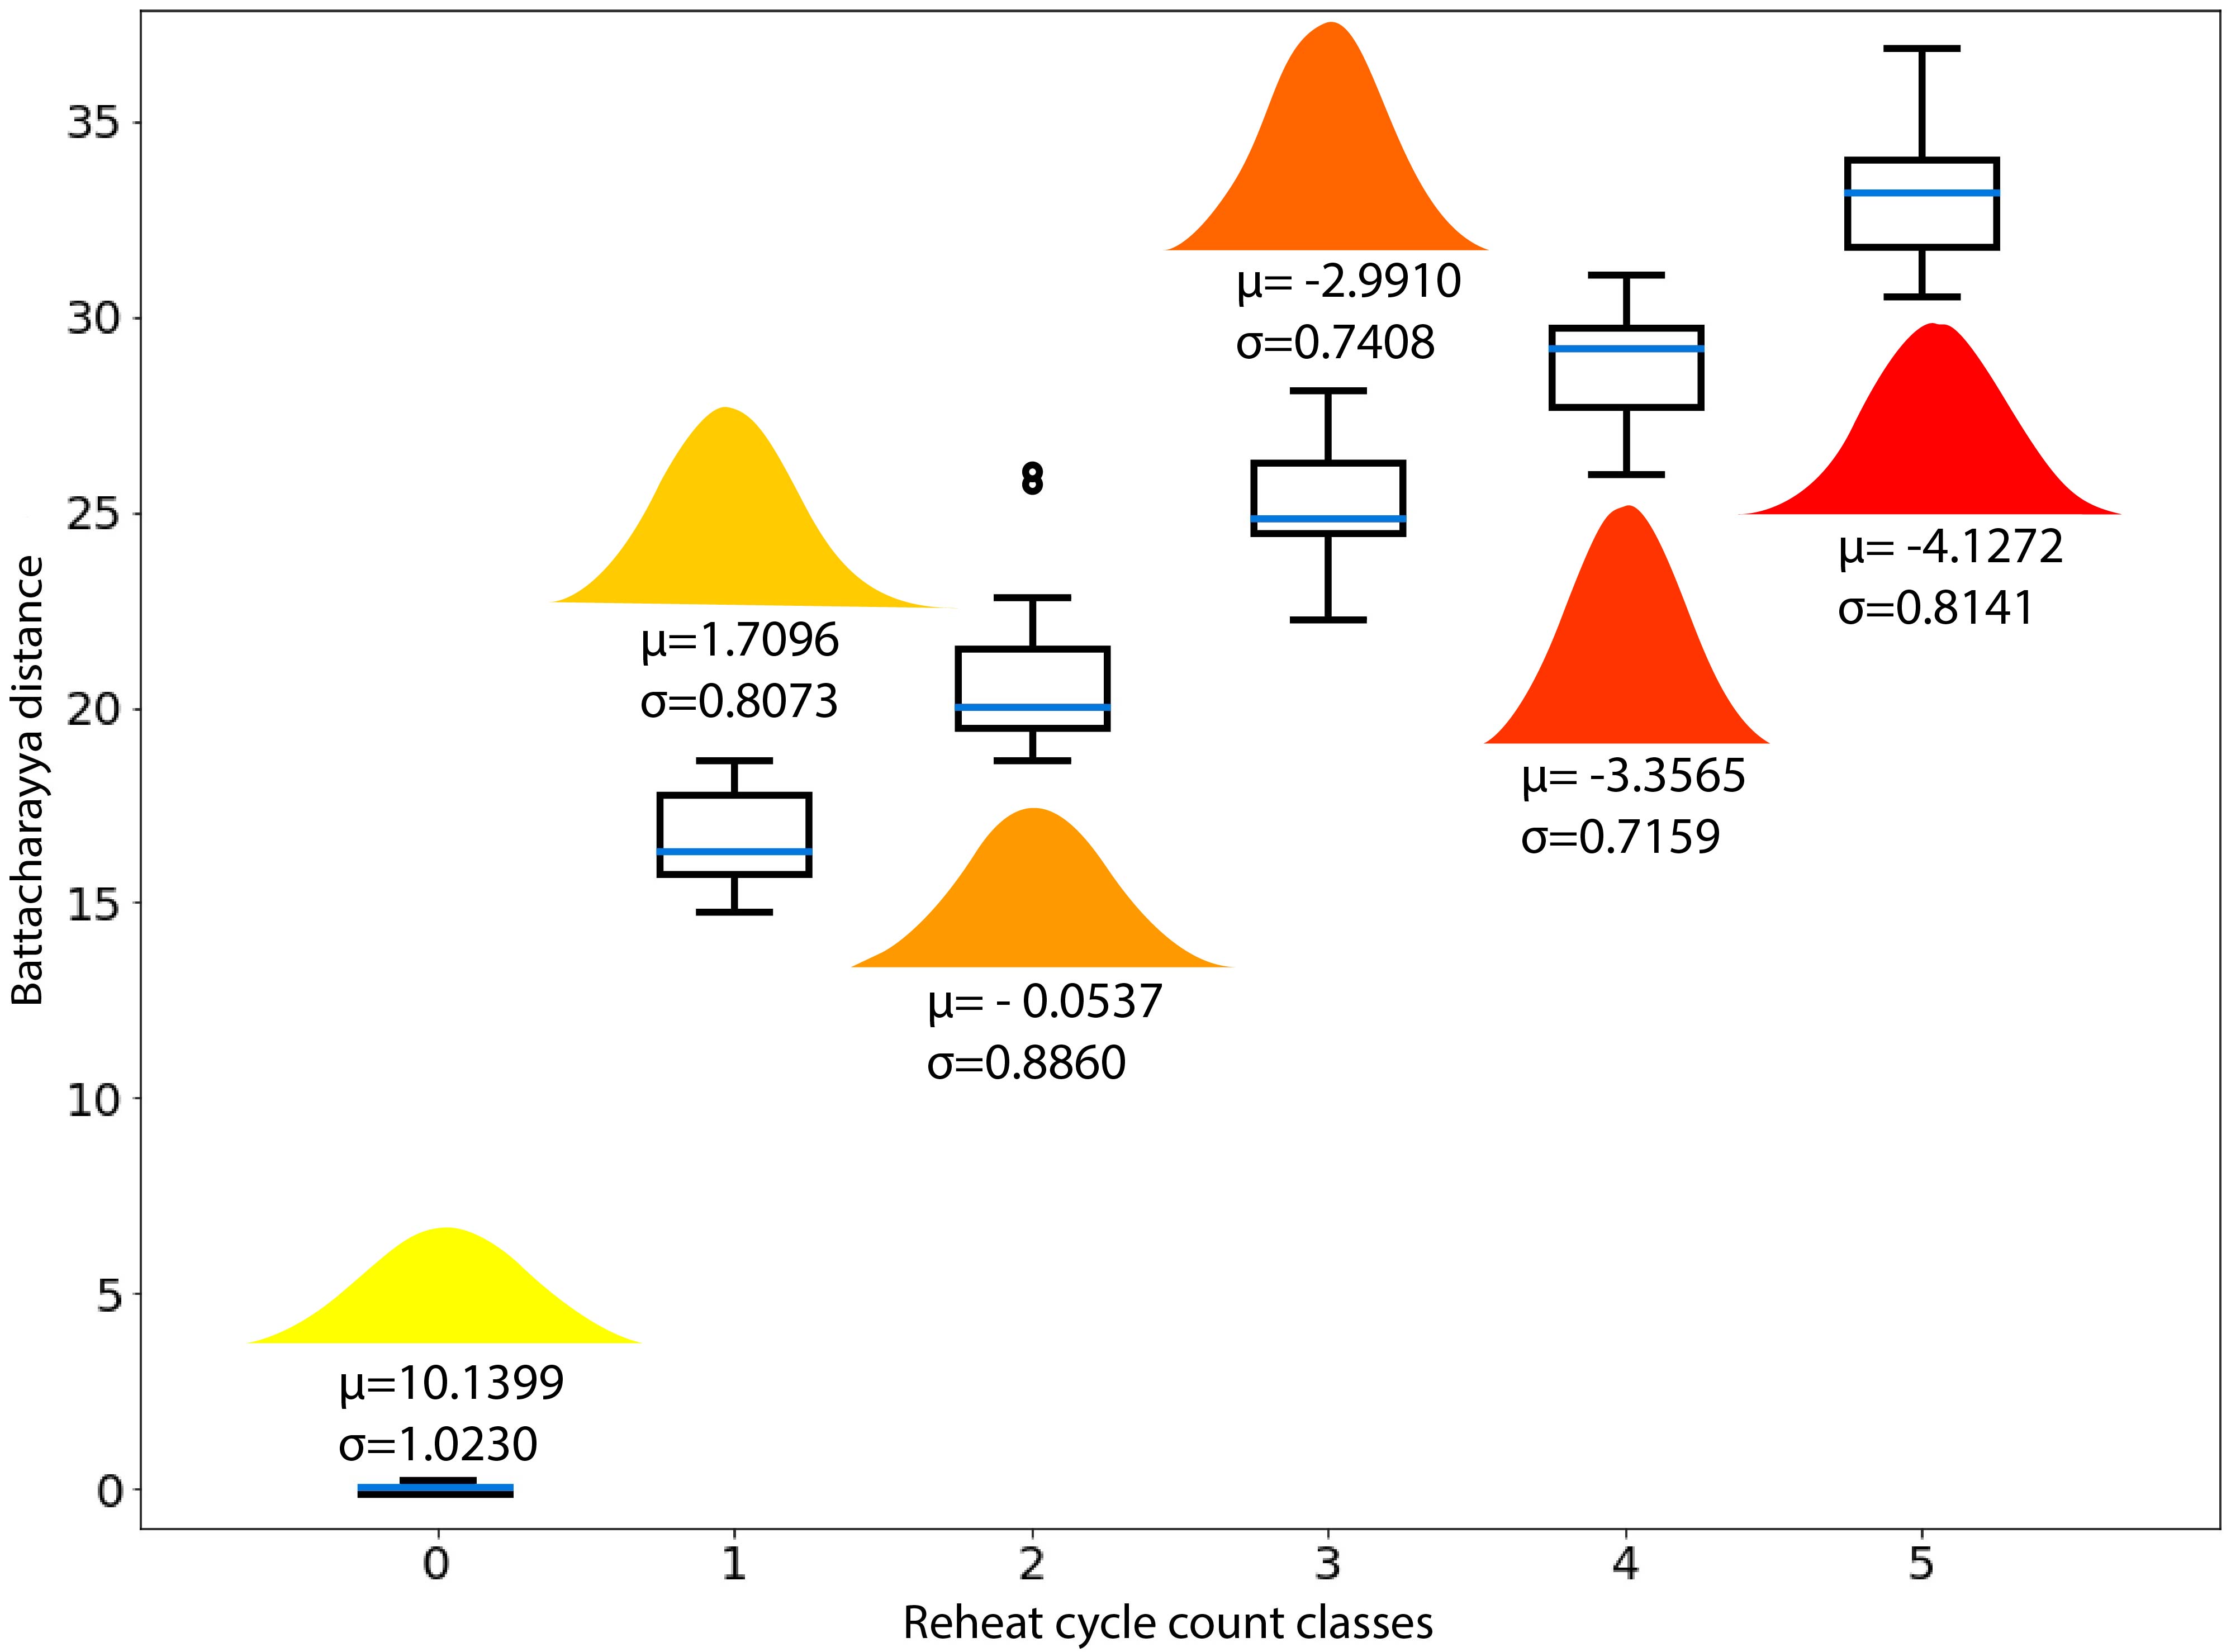
IV-B Classifier decision boundaries and performance
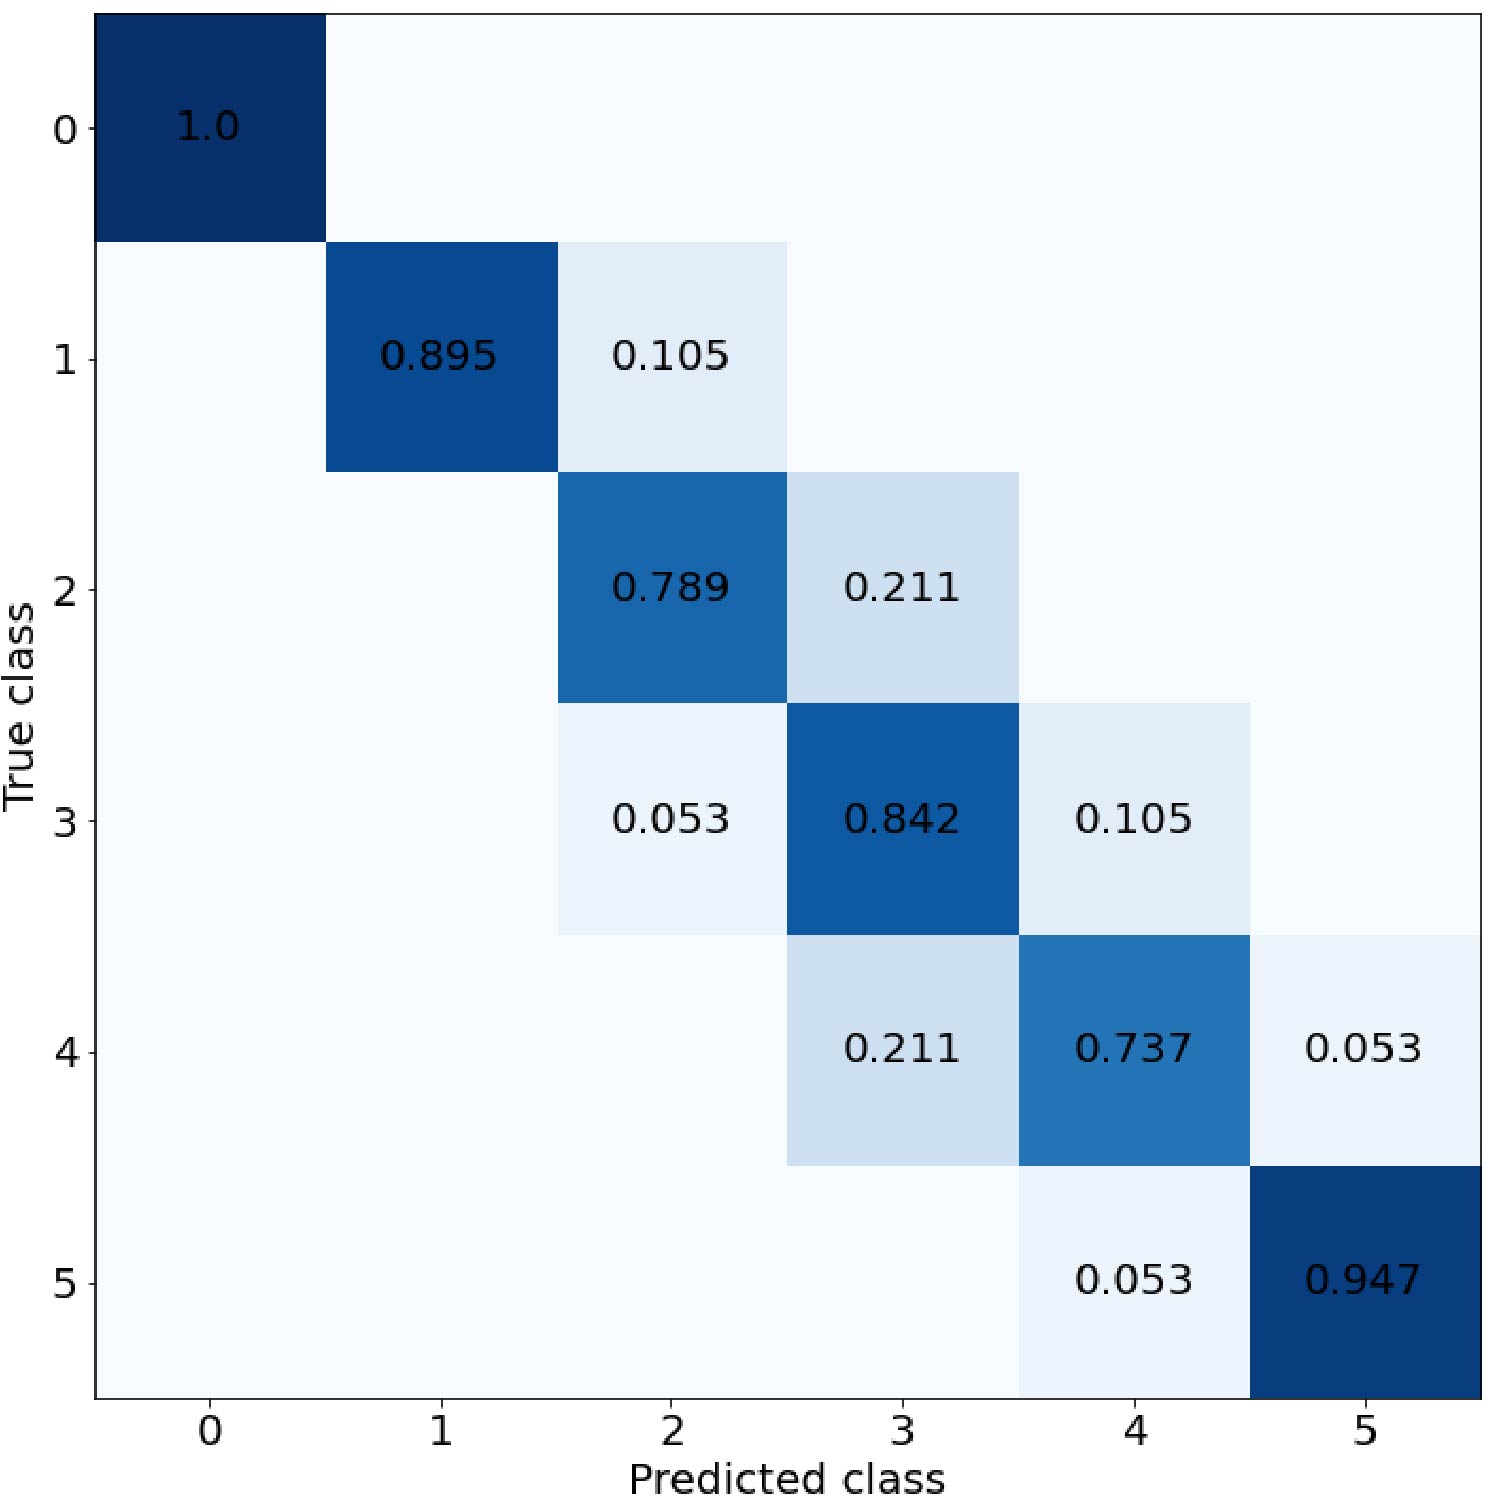
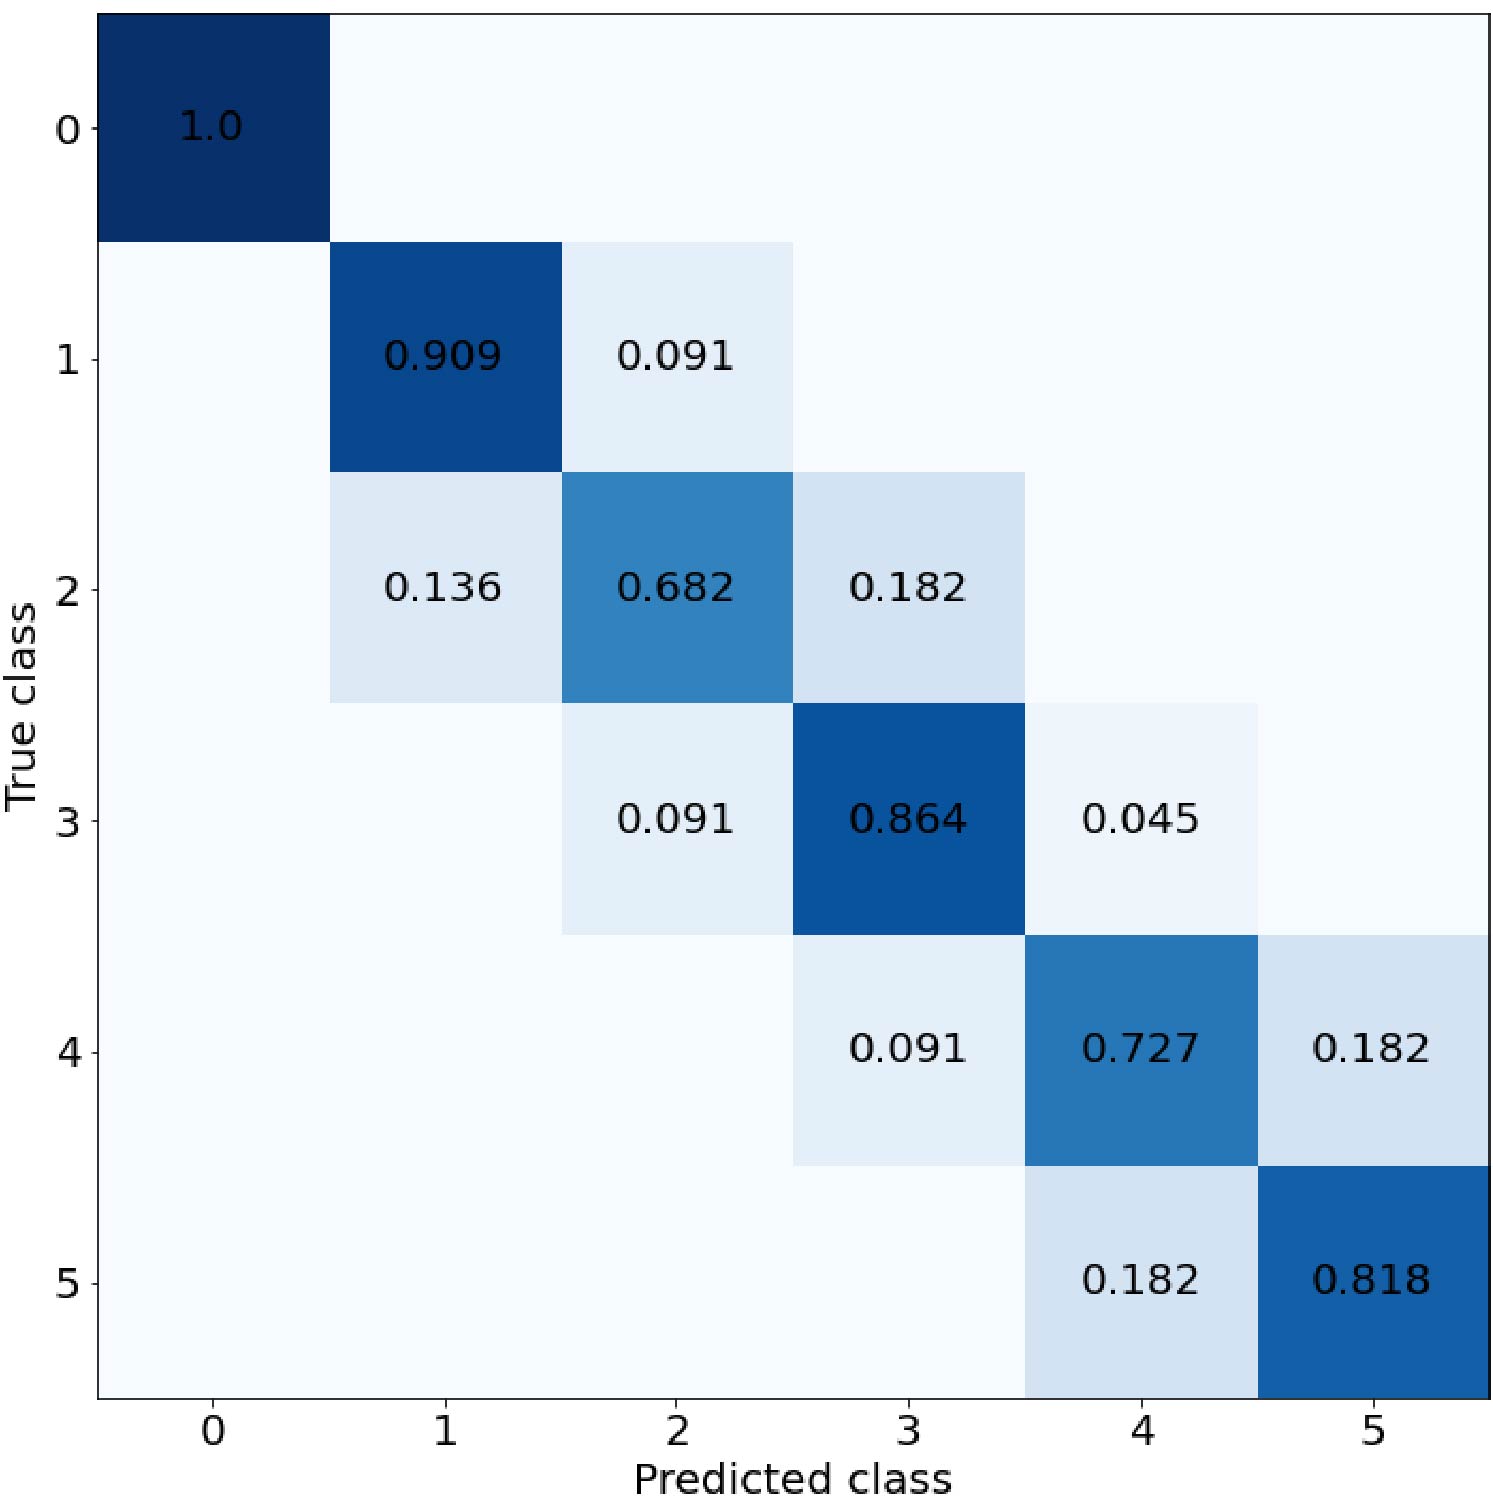
The SVM classifier was developed with the Bhattacharyya distance between an oil sample and the pure sample (reference sample) as the input variable. The variation of Bhattacharyya distances computed for different reheat cycle count classes are given Fig. 5(a), and the corresponding decision boundaries of the SVM classifier are depicted in Fig. 5(b). The classification results for the reheat cycle count class estimation for train and test data are presented in the form of confusion matrices in Fig. 6, respectively. The box plots given in Fig. 5(b) are mostly contained within the decision boundaries from the SVM classifier, which is propitious for higher classification accuracies as corroborated by the confusion matrices in Fig. 6, whose non-zero elements are primarily on either the main or the closest diagonal.

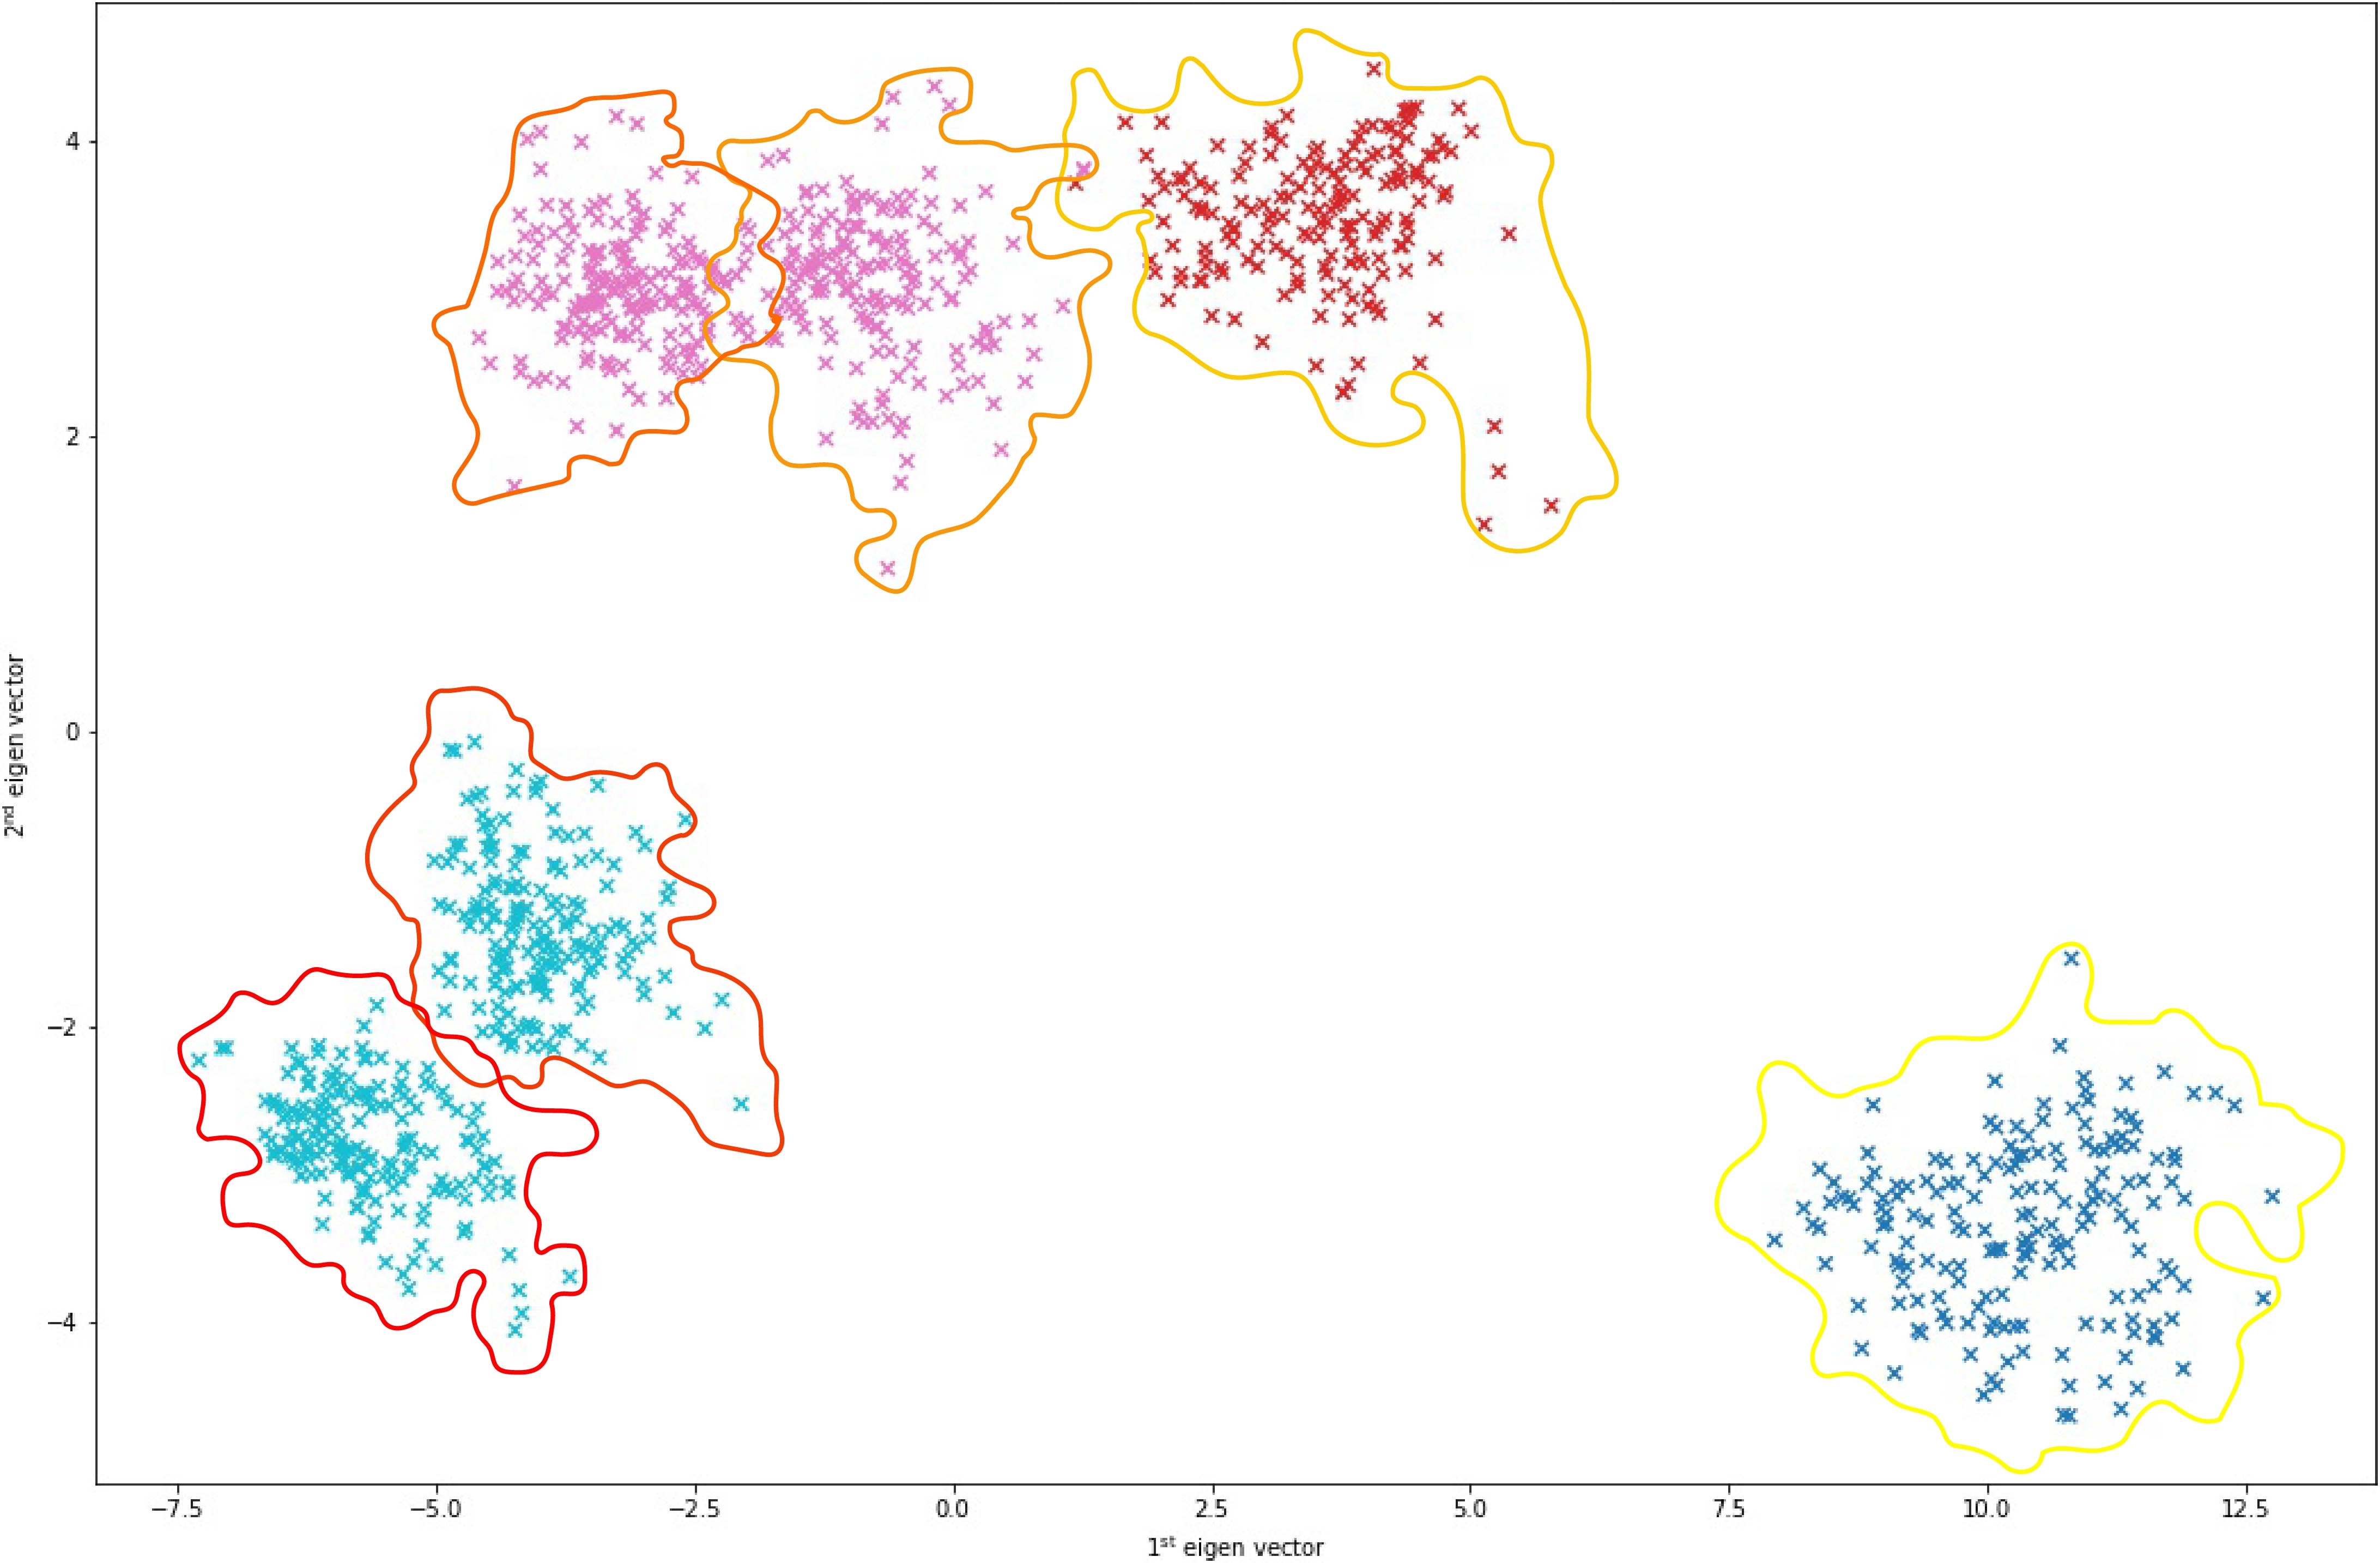
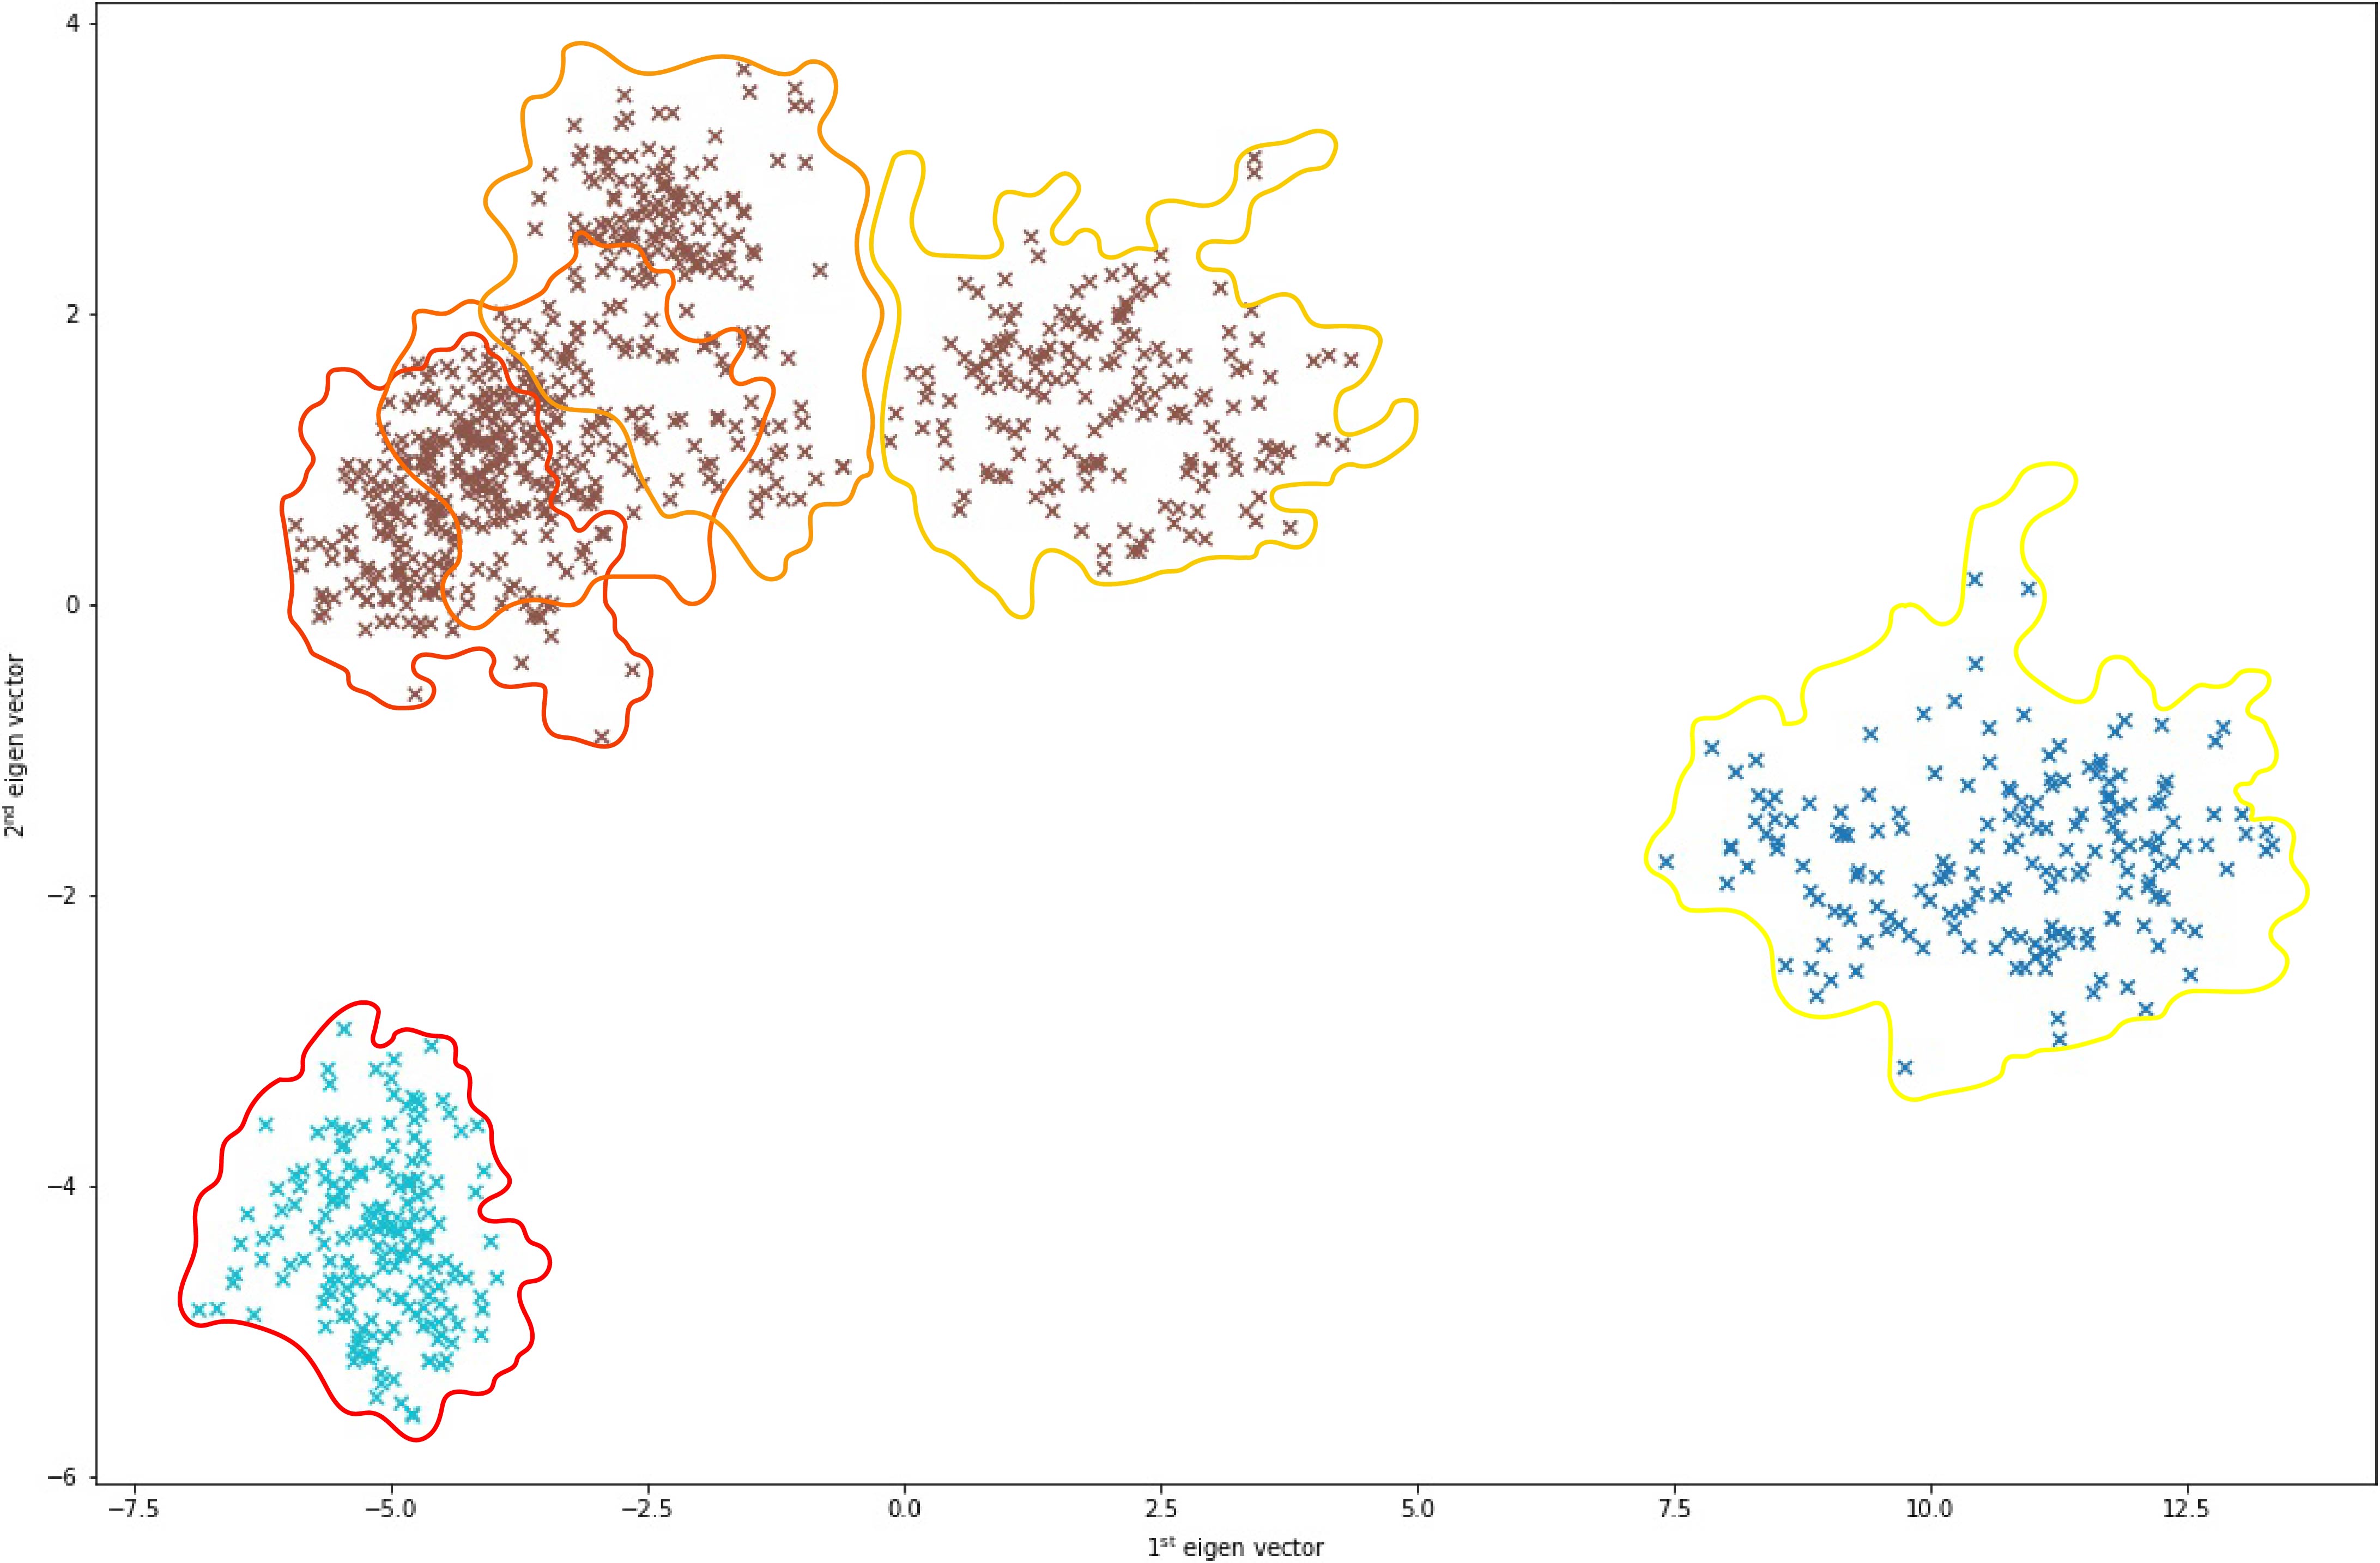
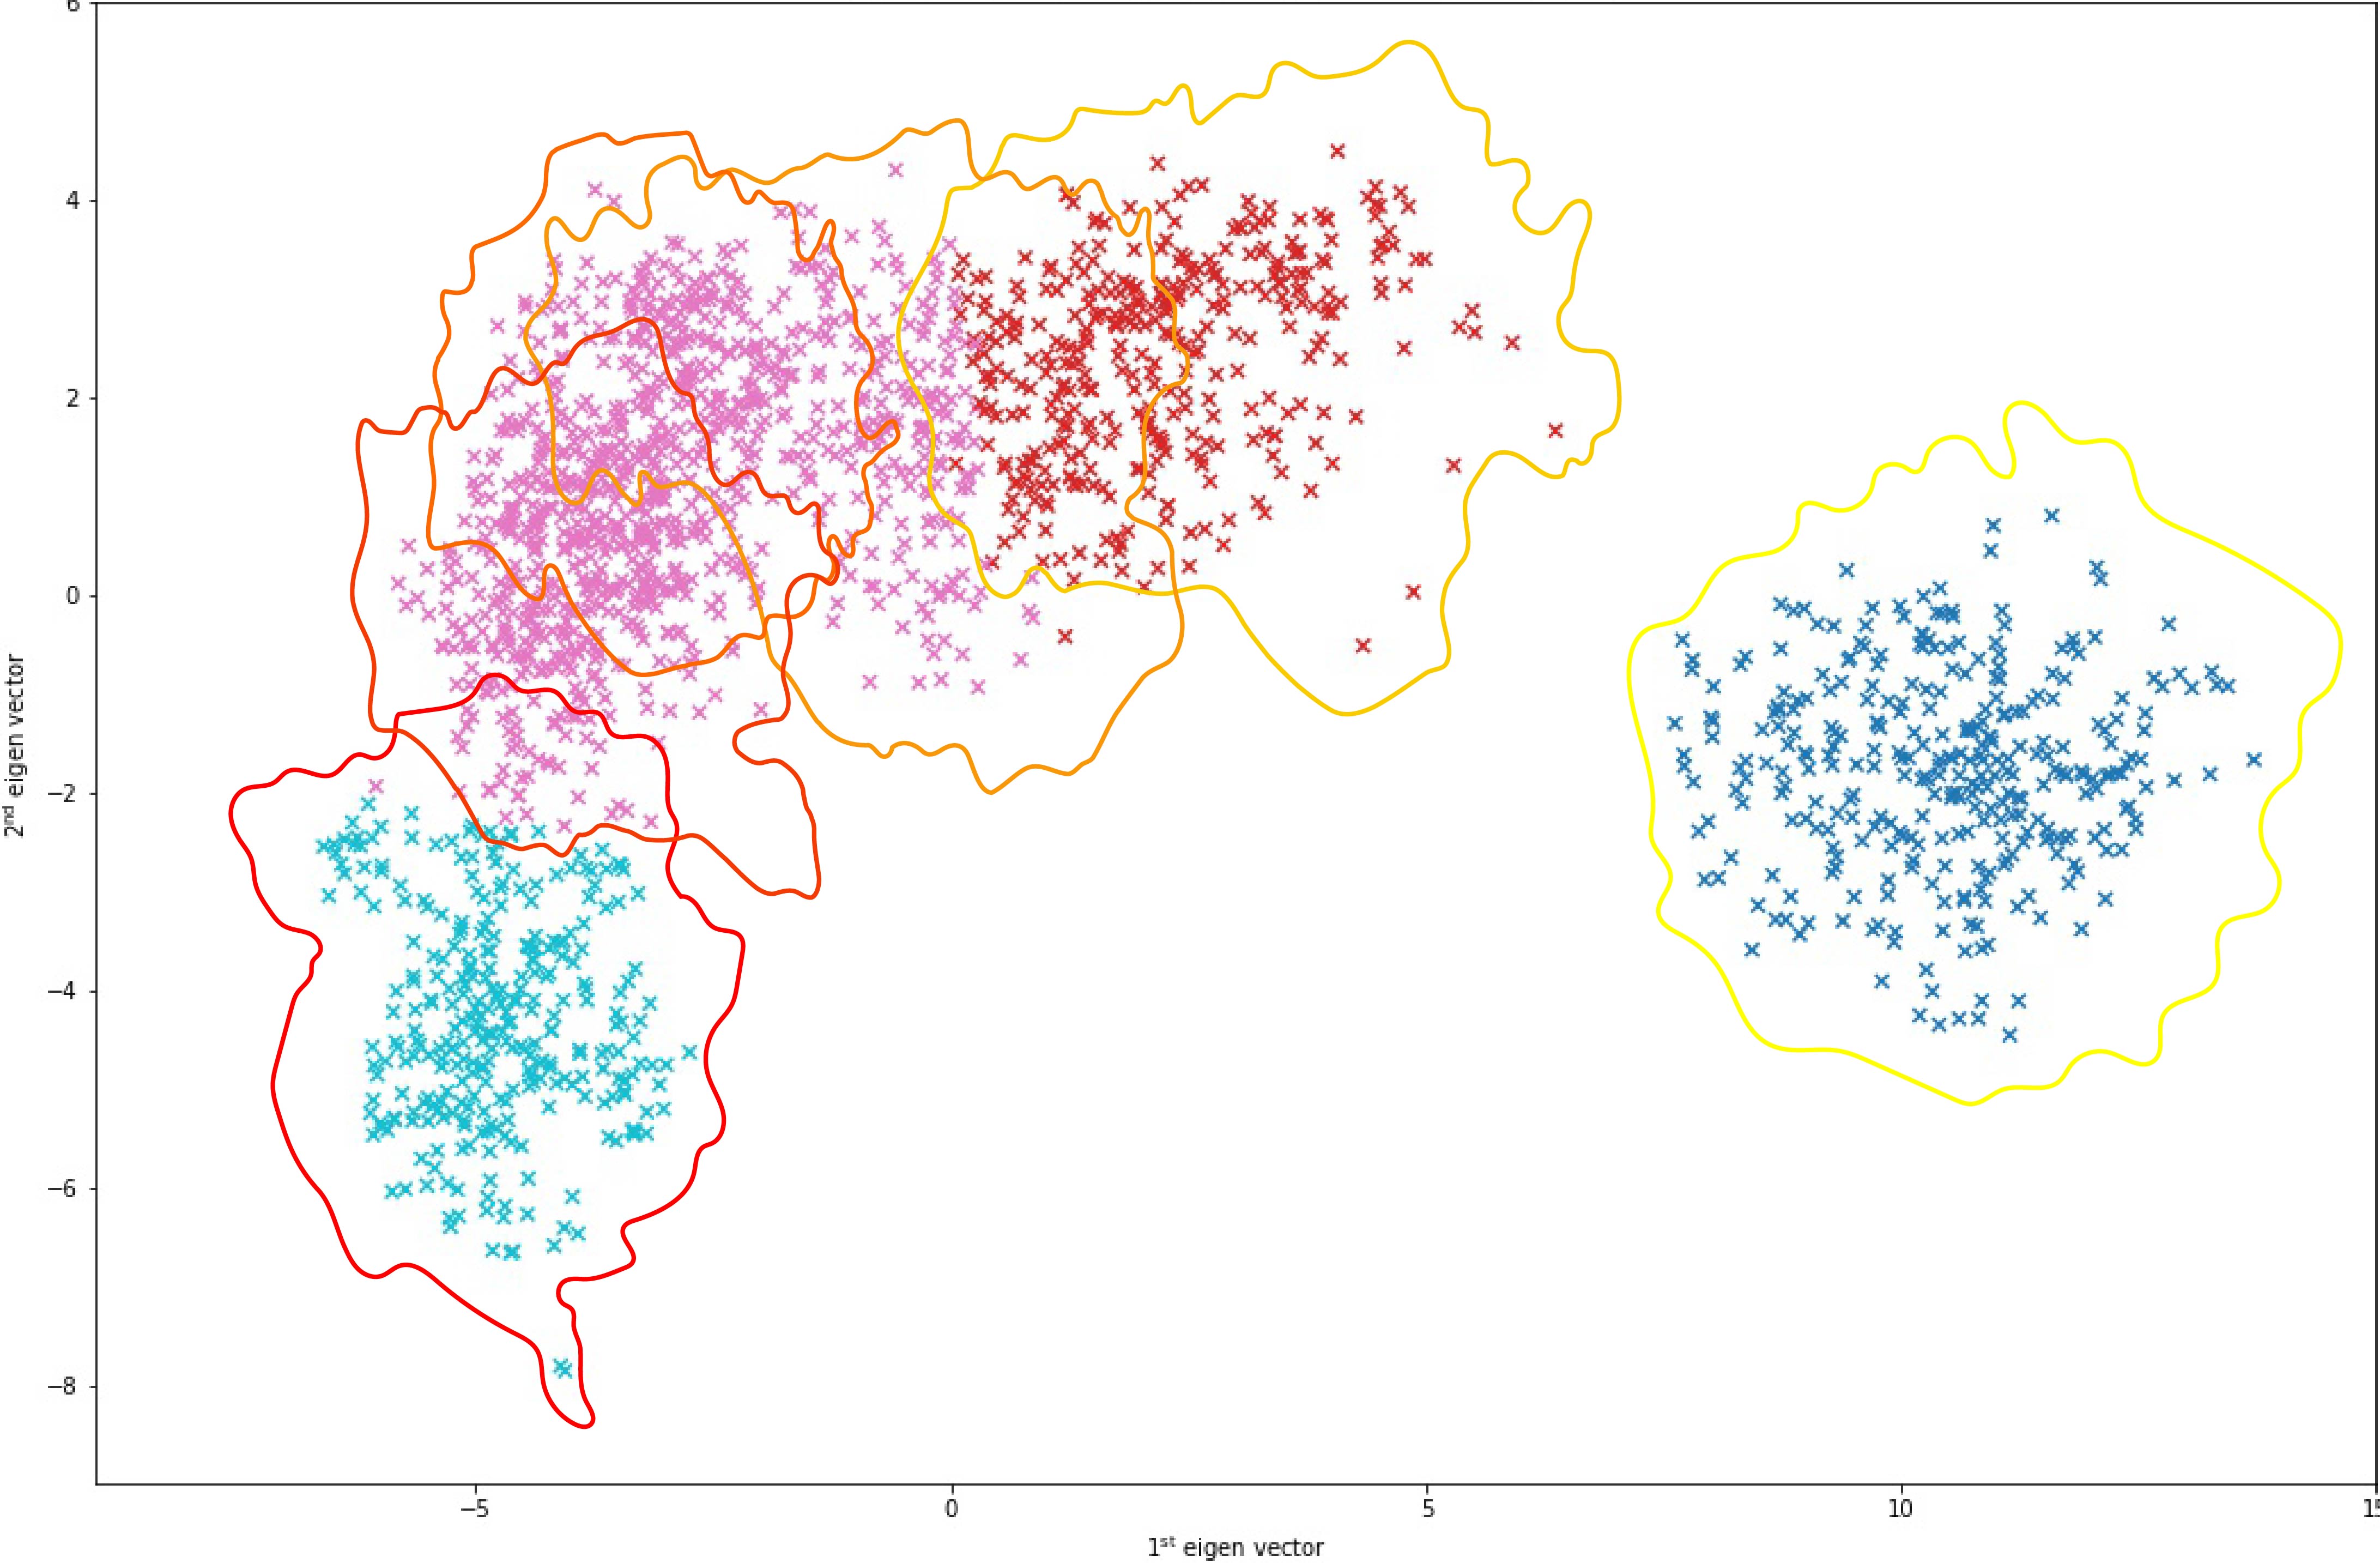
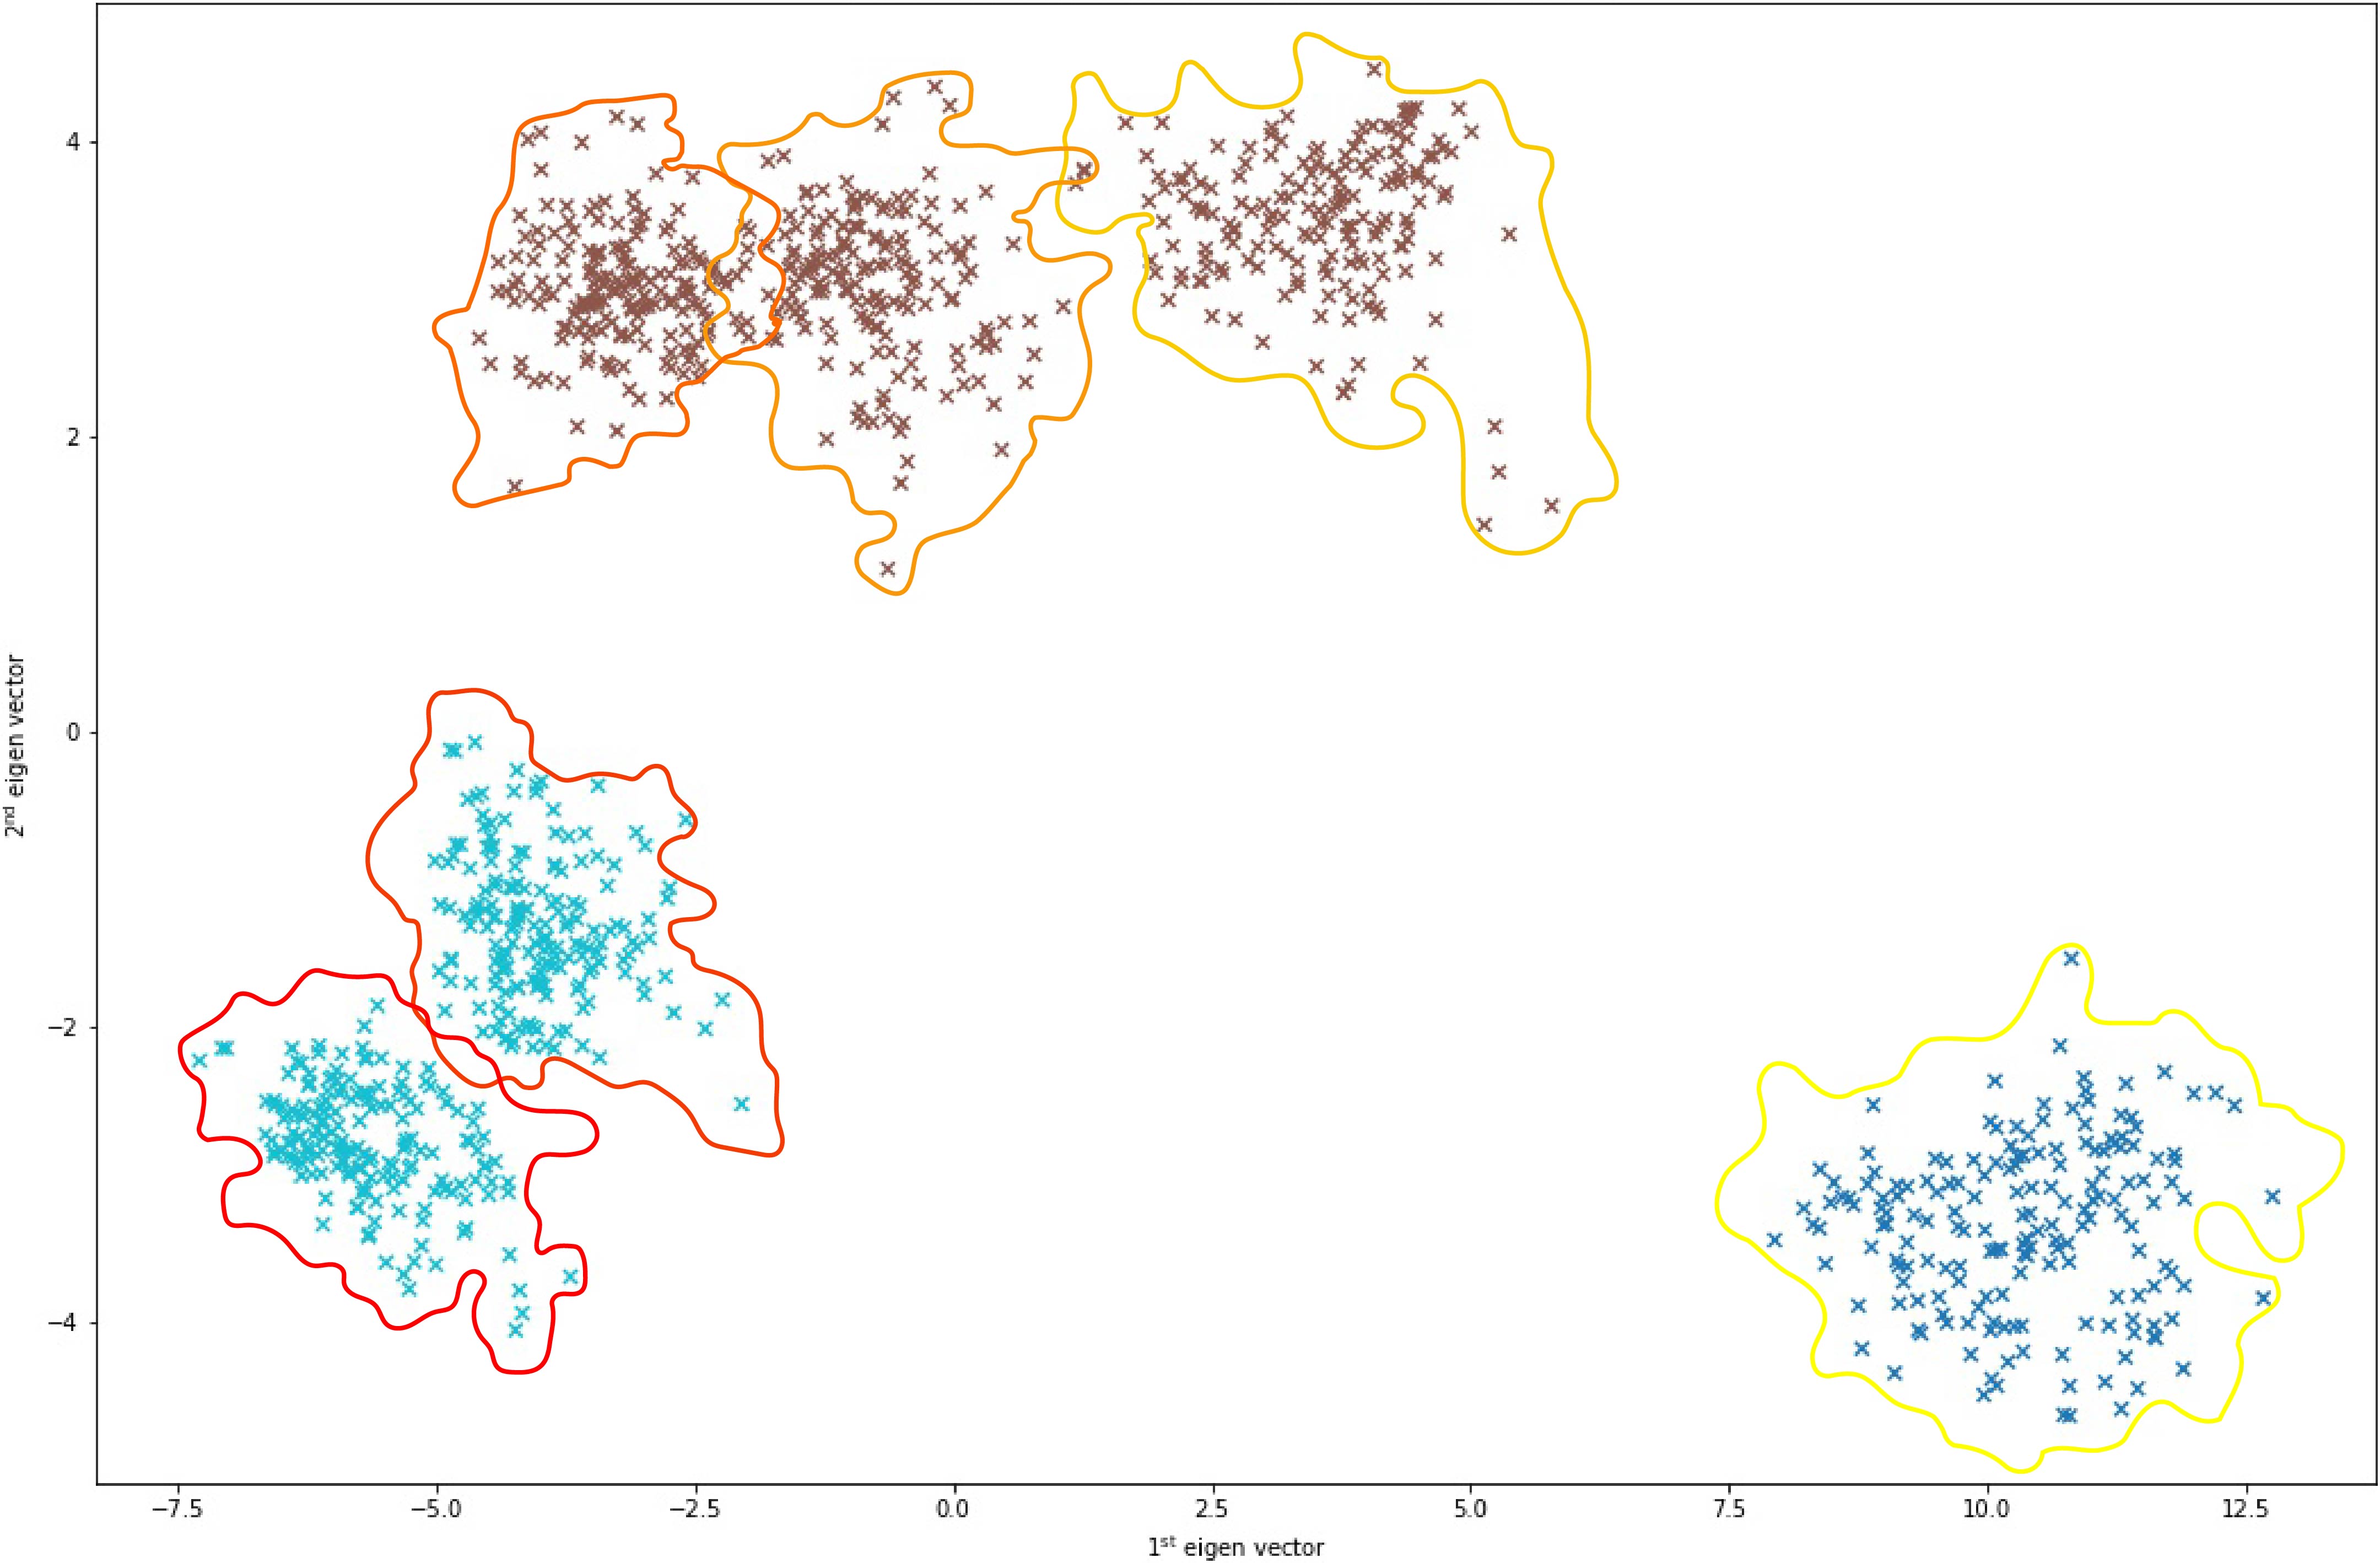
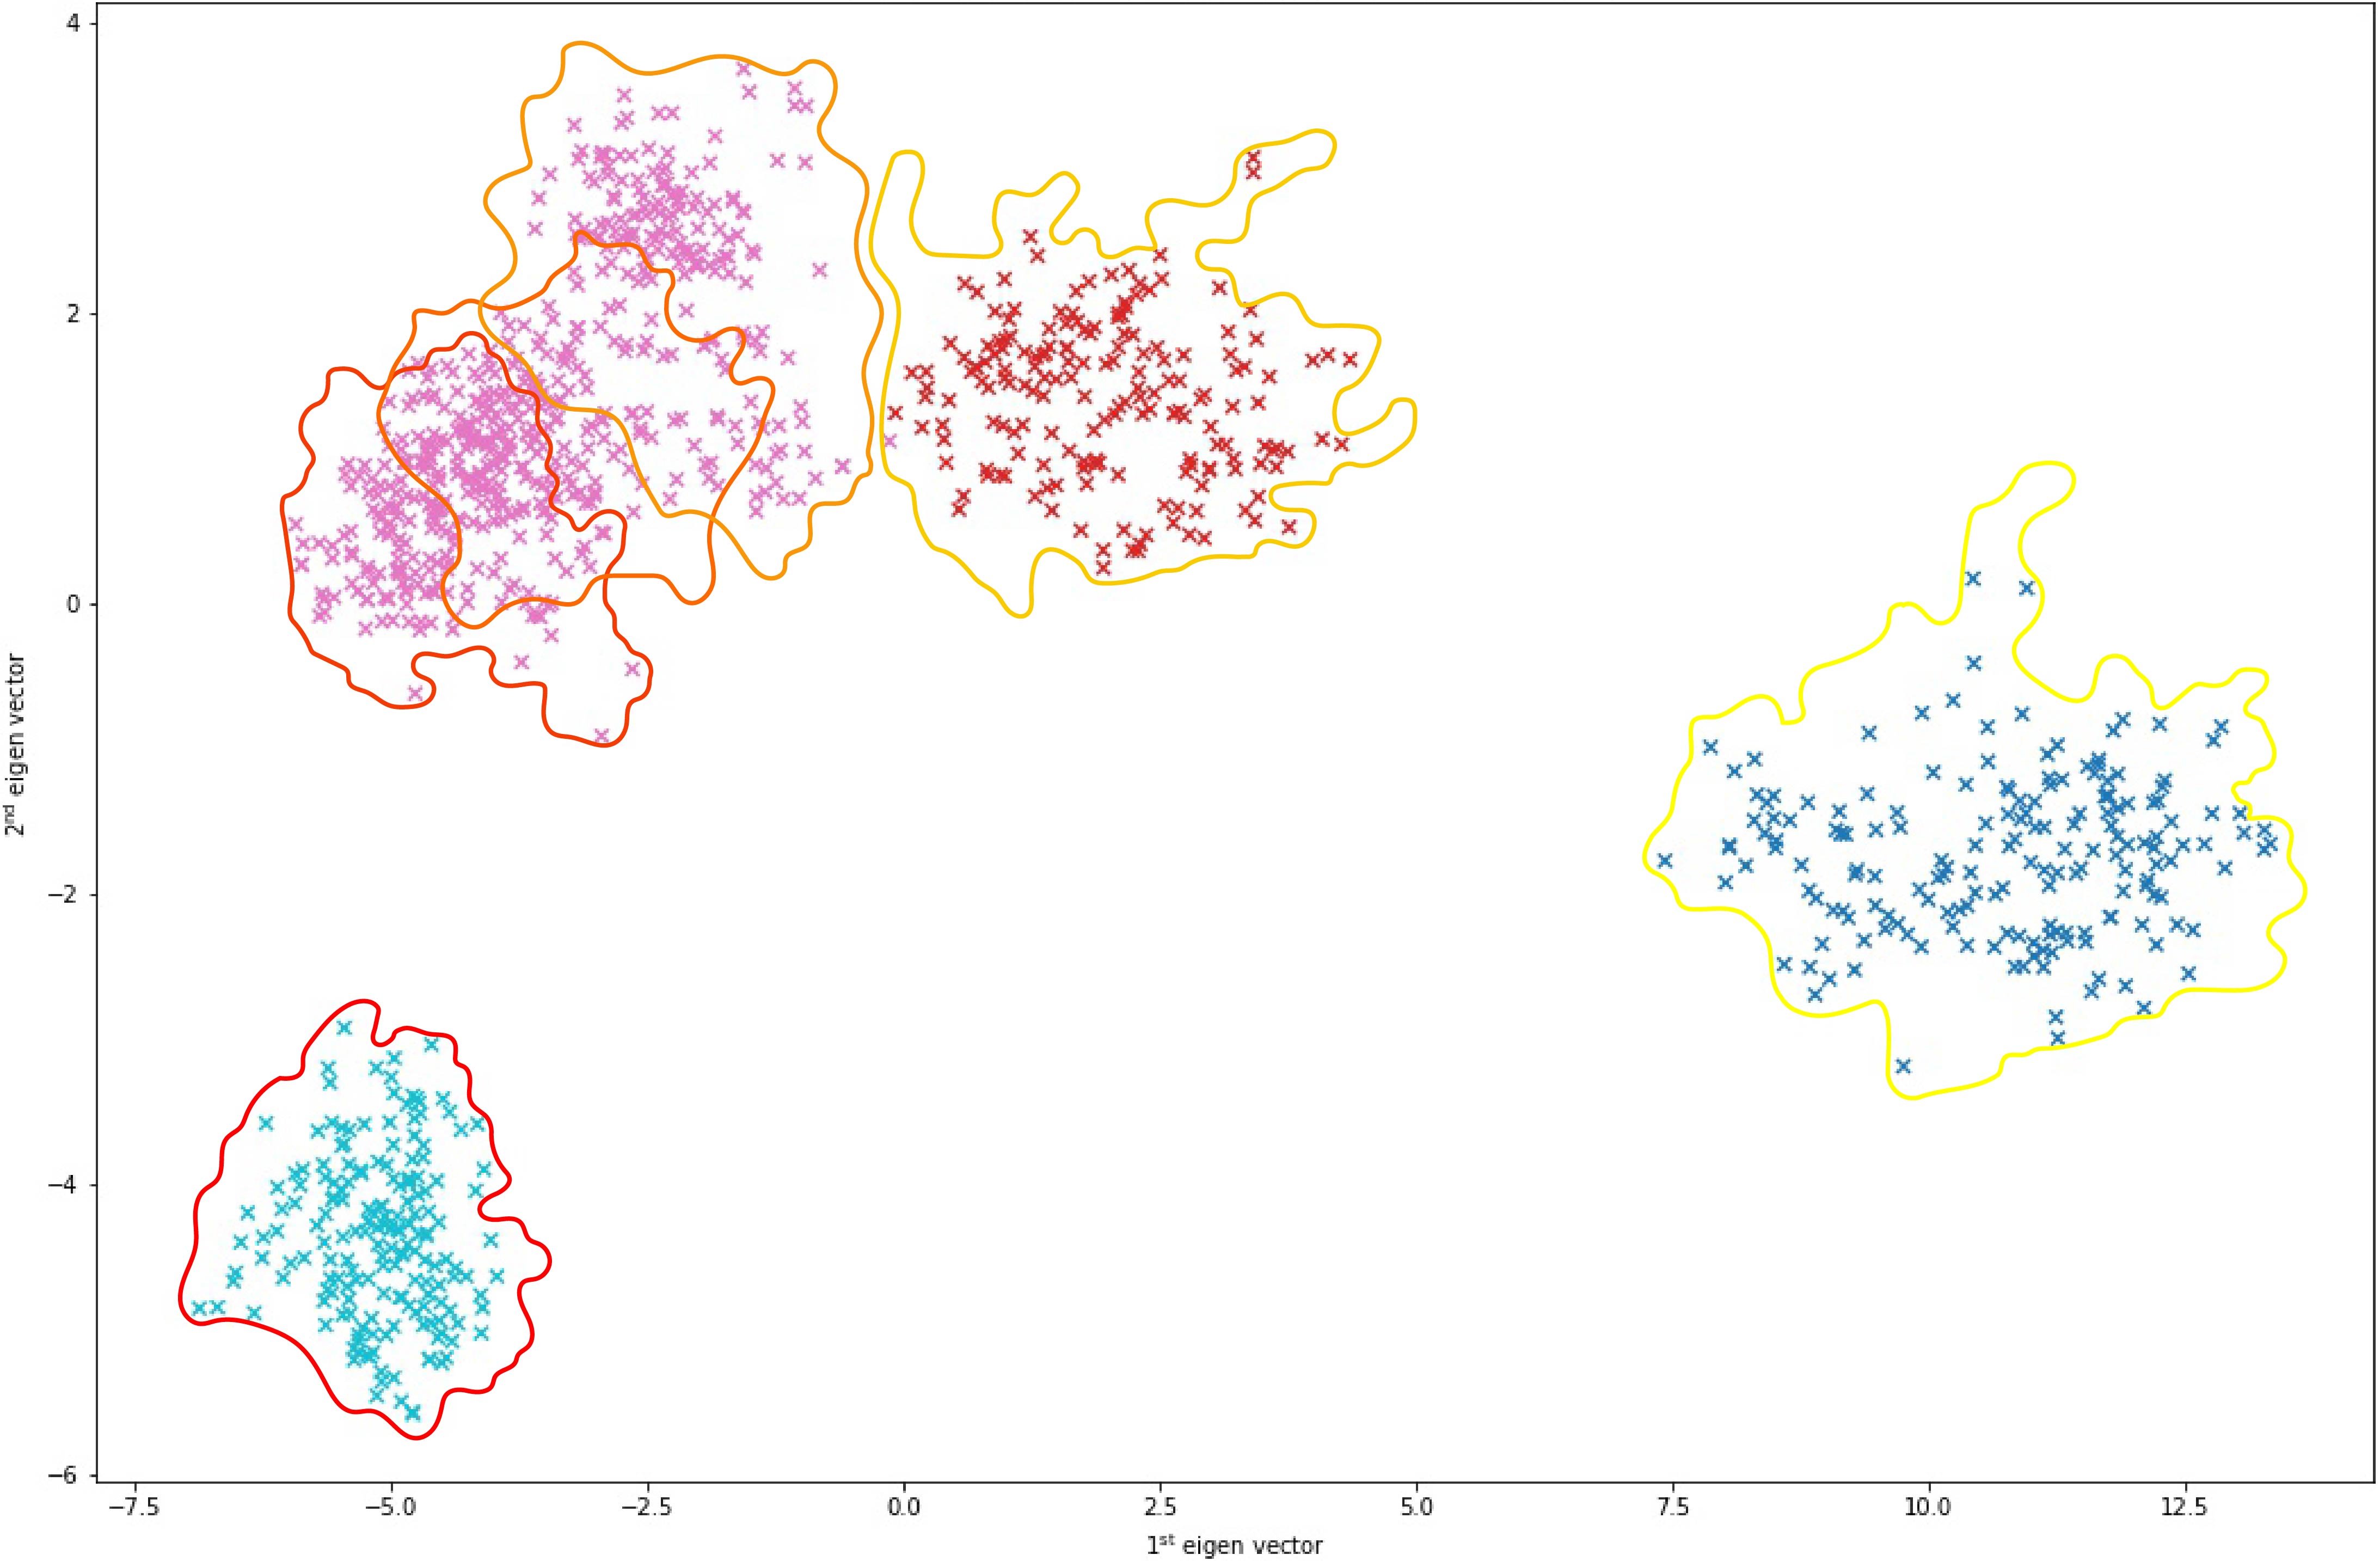
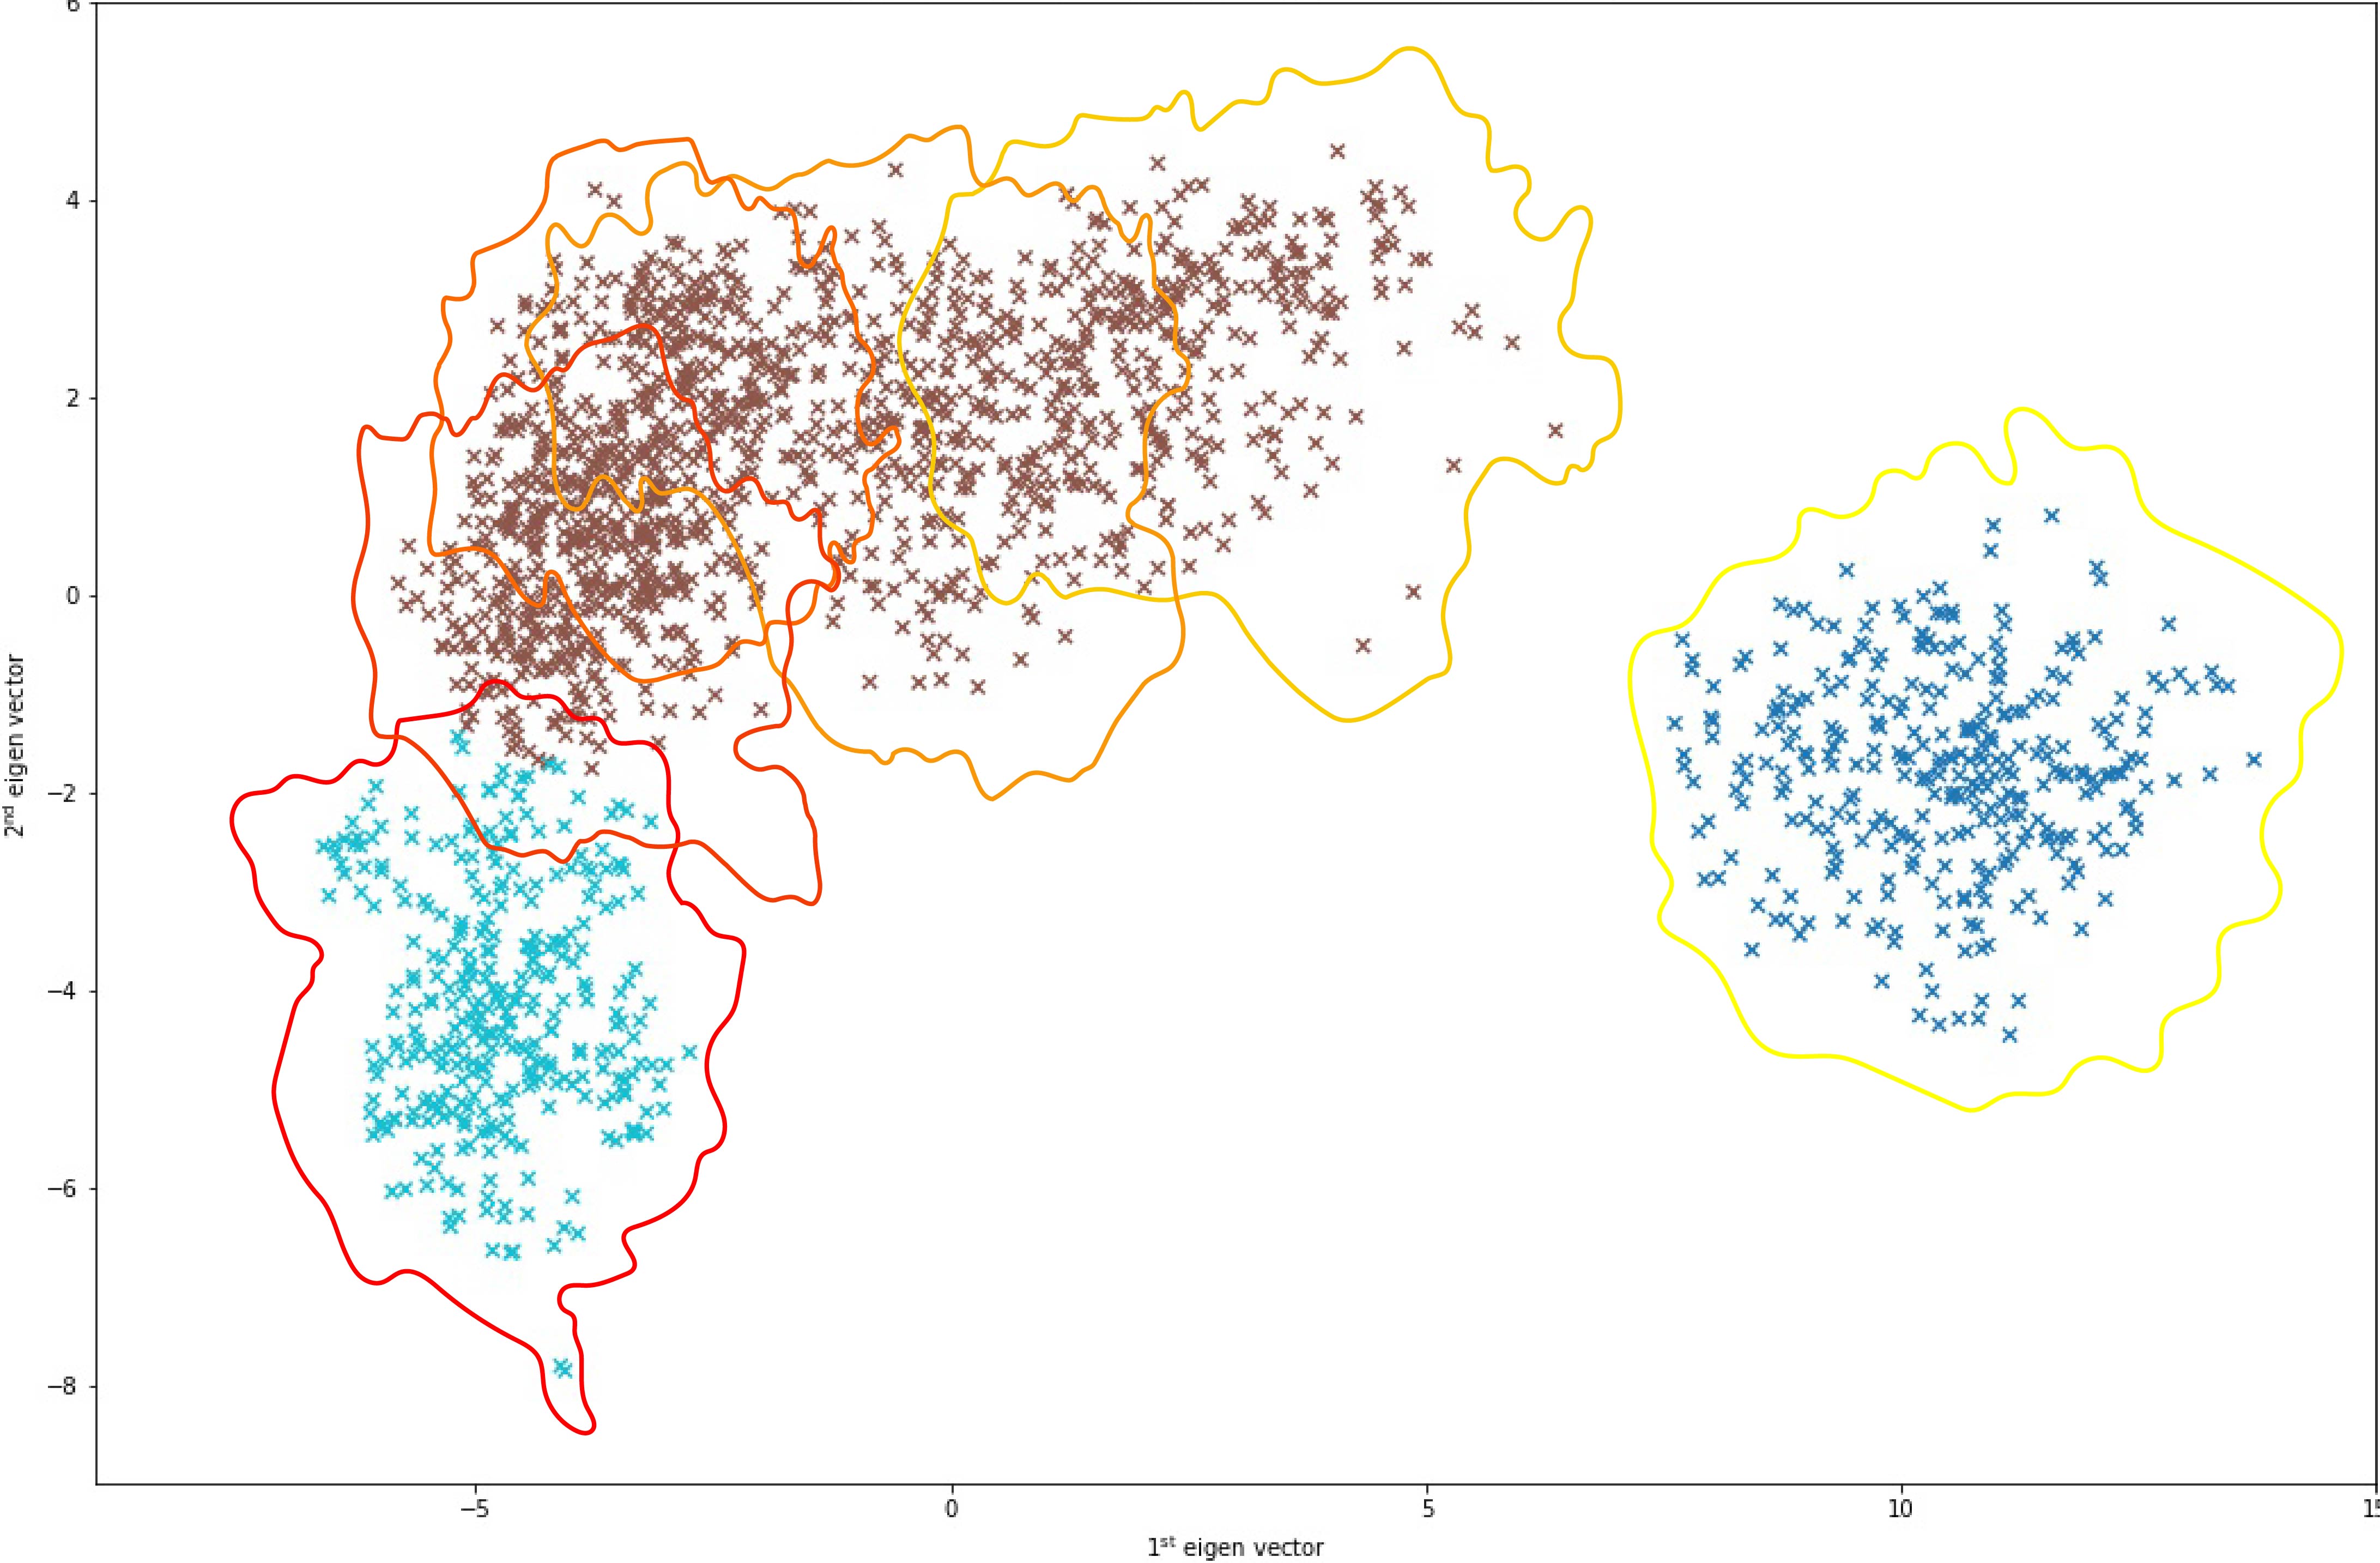
IV-C Sigma-sweep and reheat cycle count classes clustering
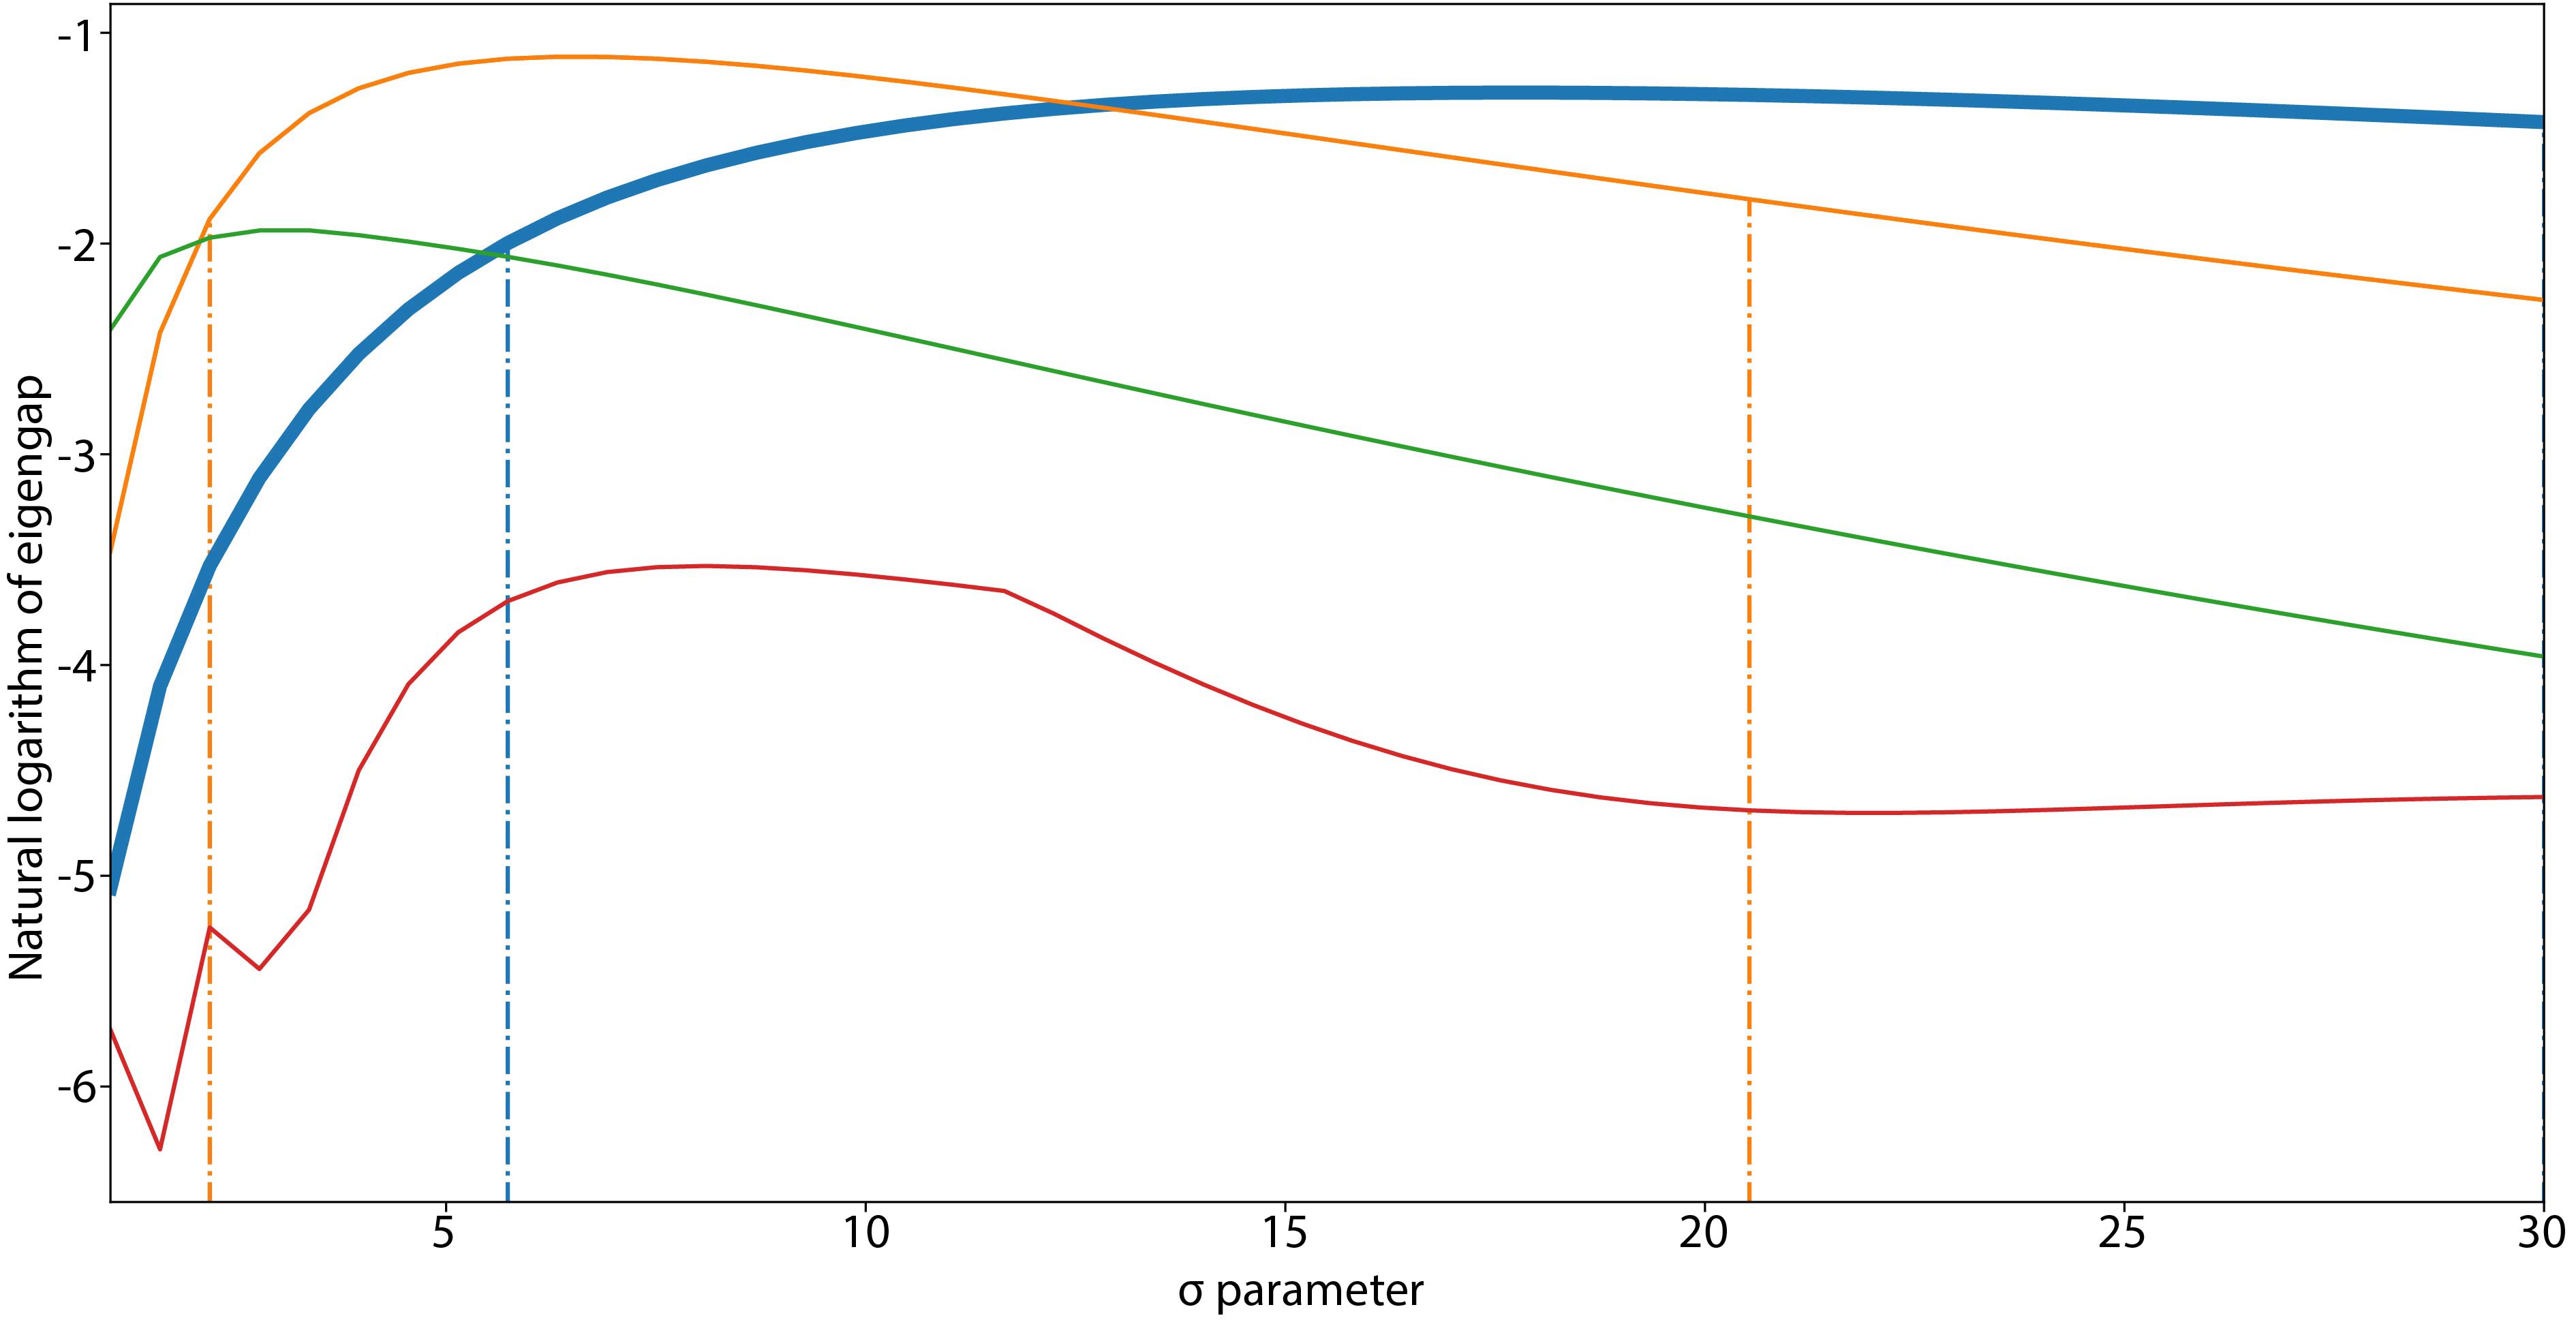
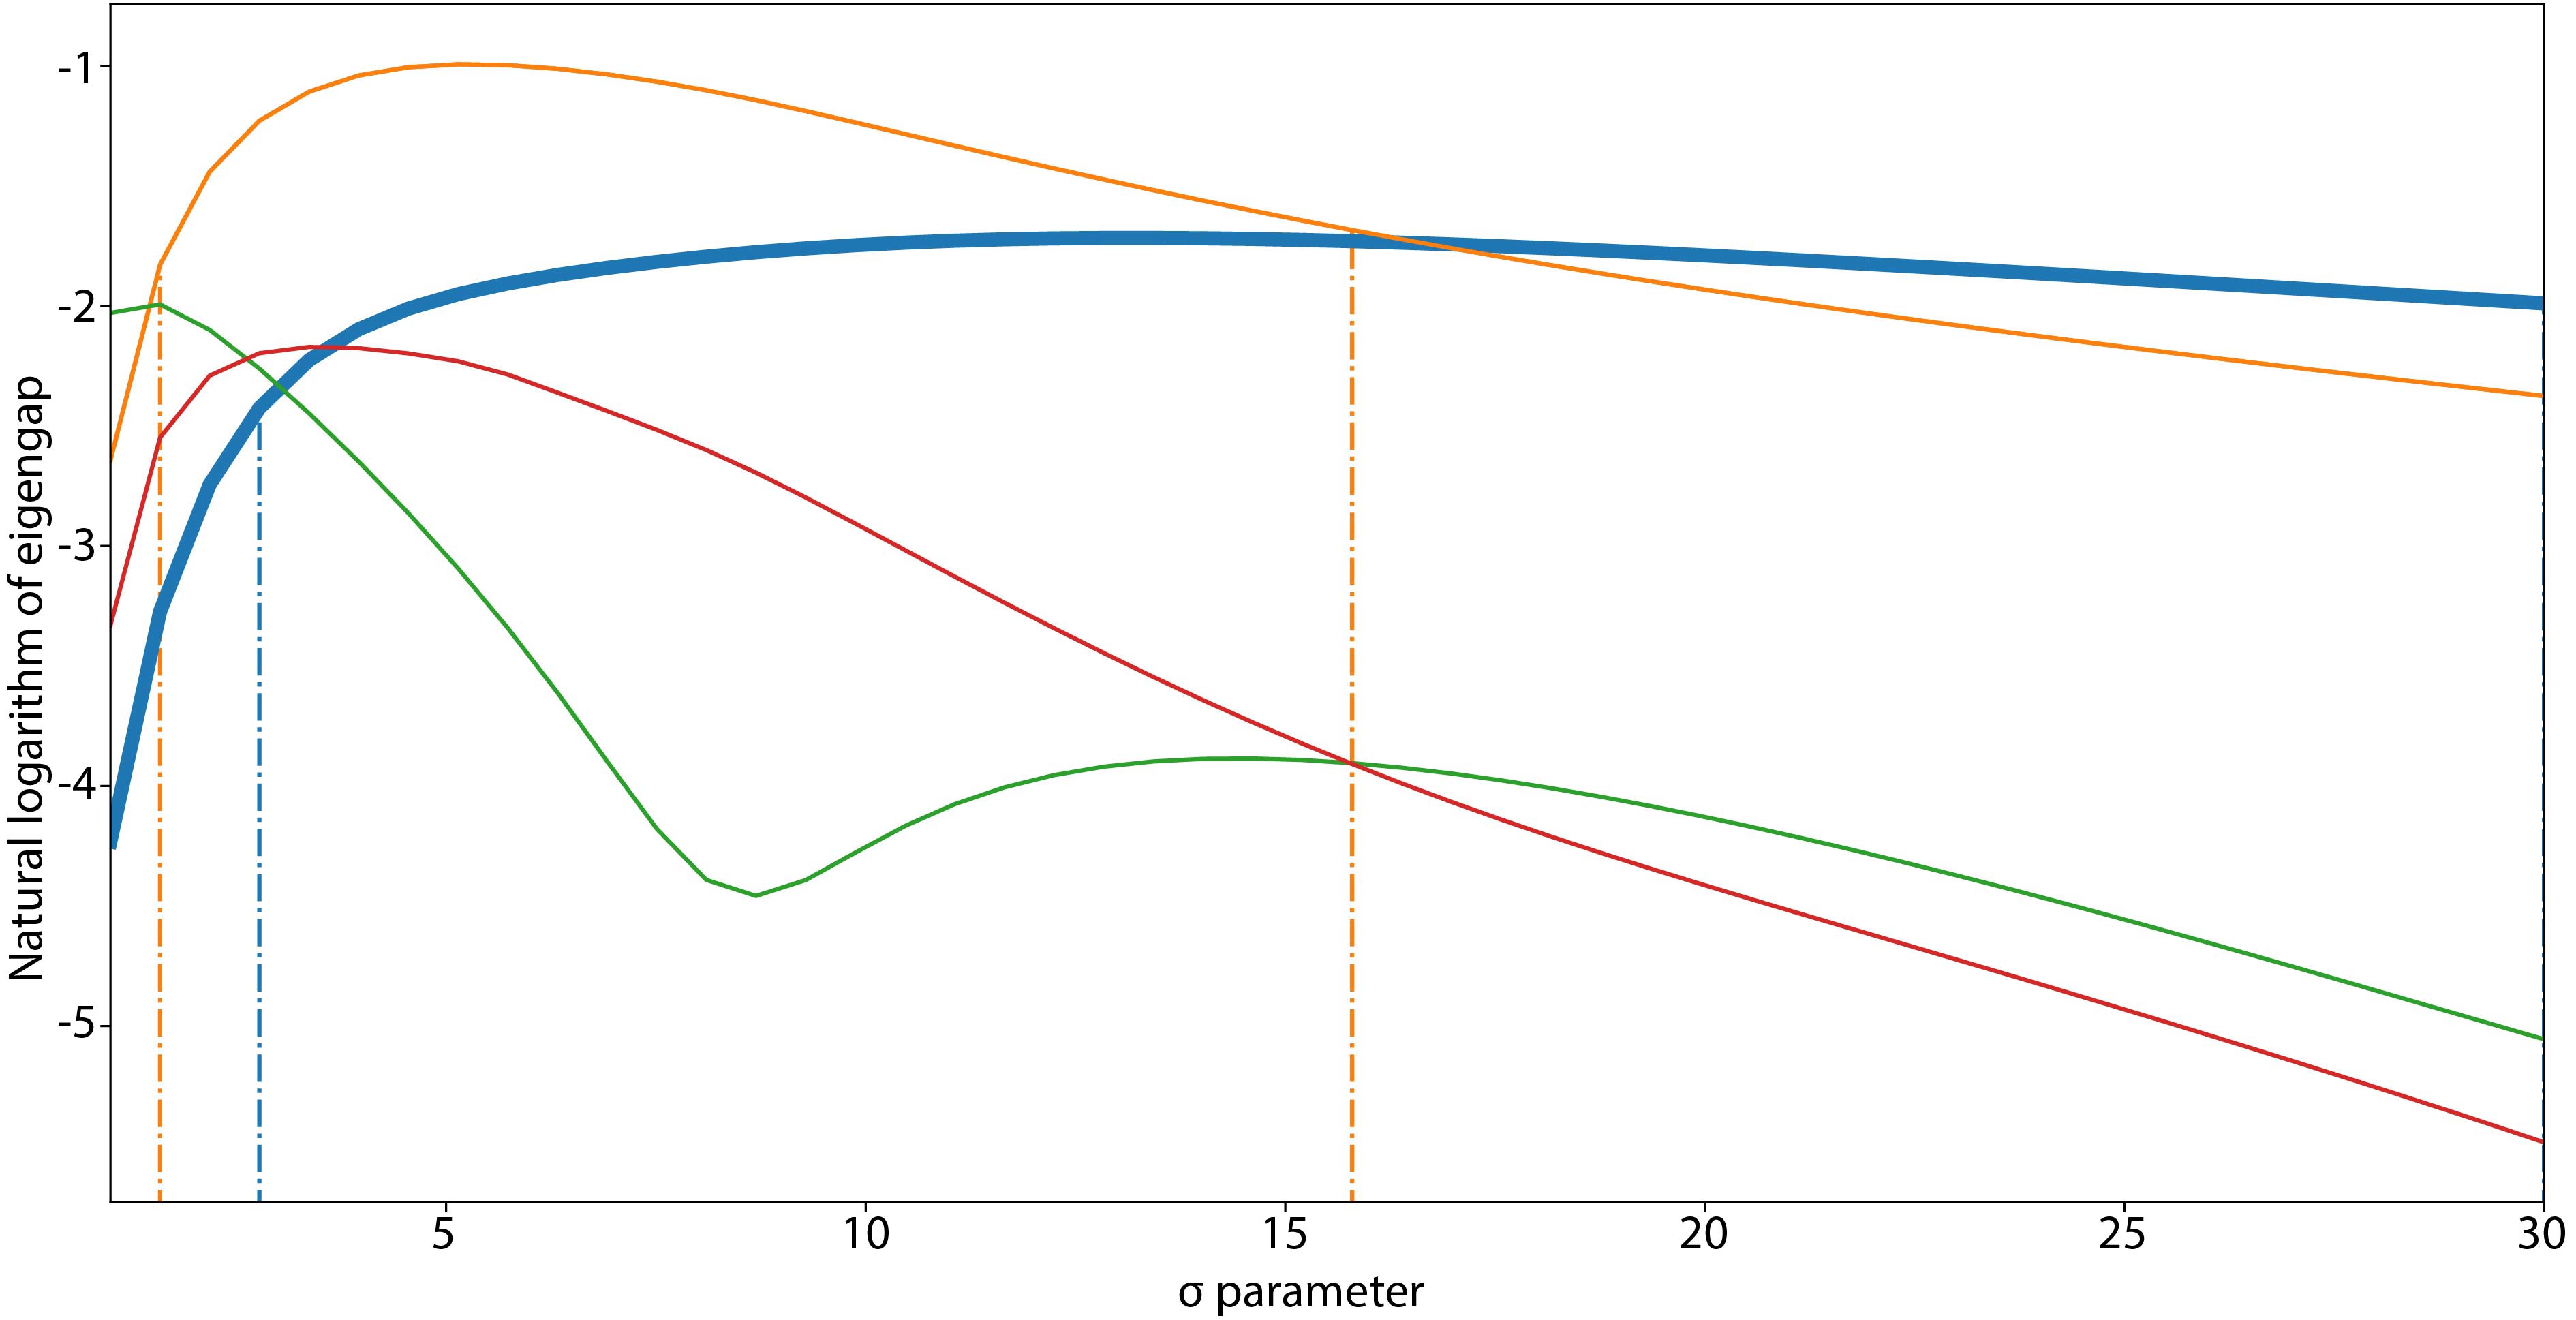
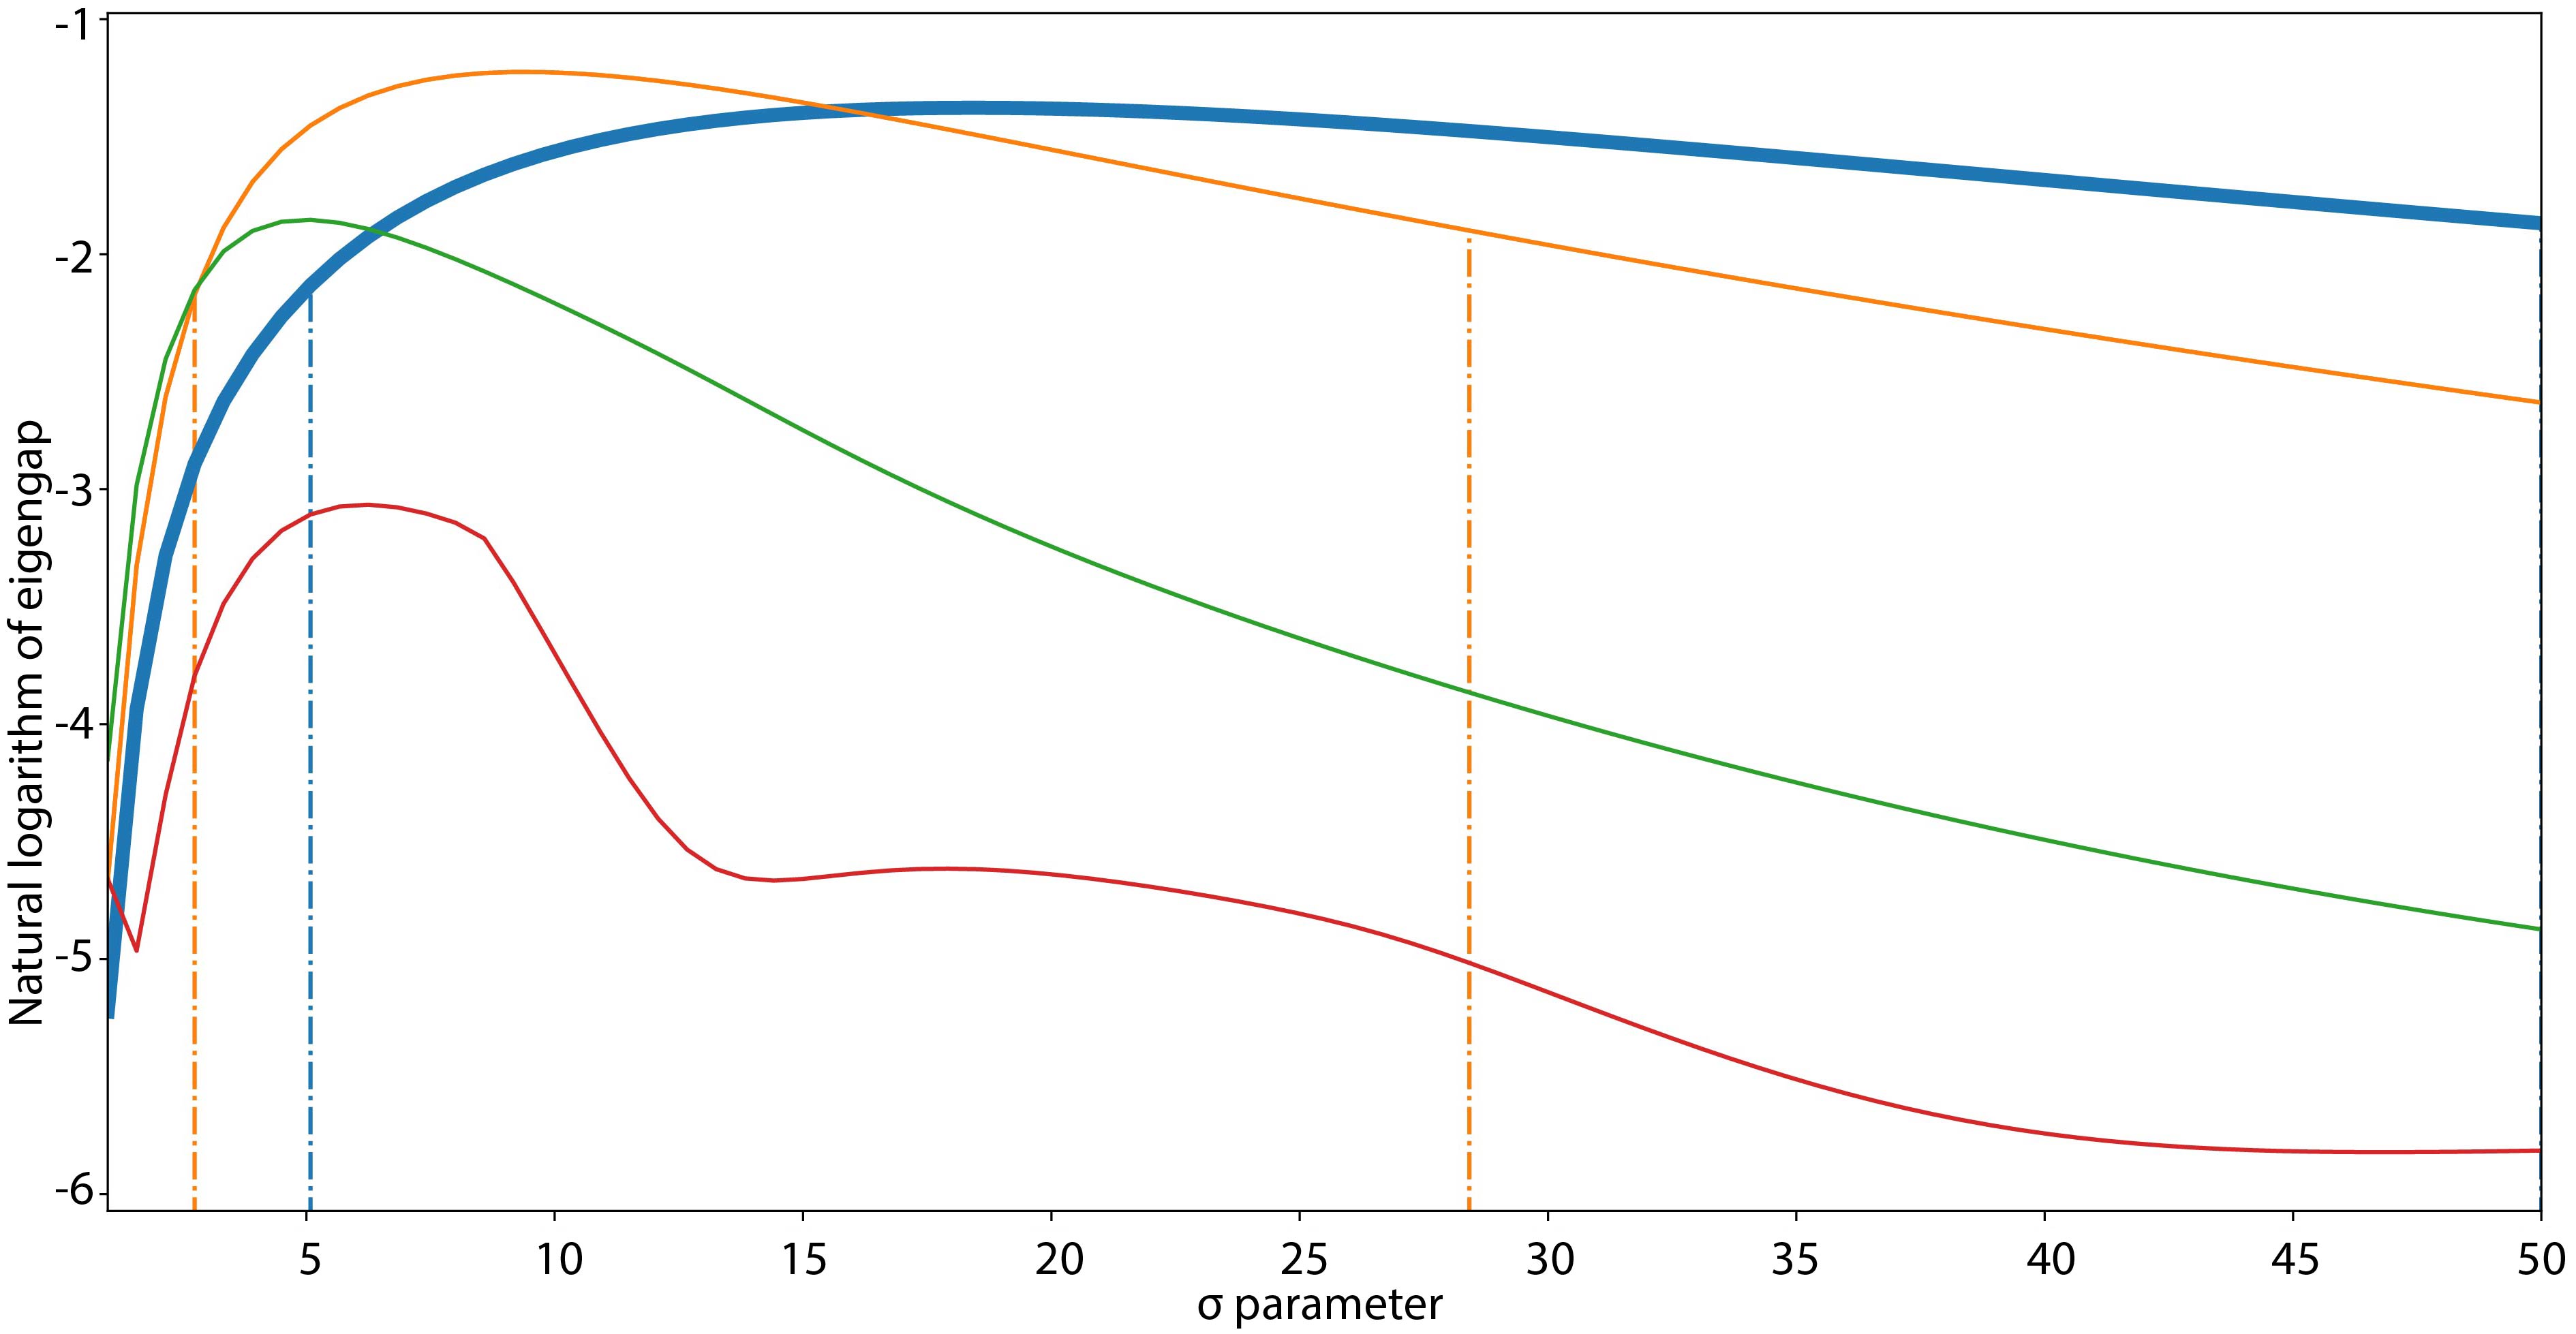
In this section, the operation of the SC framework to distinguish noticeable changes in the oil as the reheat cycle count class is waxed exemplified for several trials. In Fig. 8, the variation of the eigengaps with as introduced in section III-D3 are plotted. Then, the corresponding clustering configurations are presented in Fig. 9. Separately, the change in thiobarbituric acid reactive substances (TBARS) and total oxidation (TOTOX) were measured from a chemical analysis for the trials to check the results from the SC framework. The measured TBARS and TOTOX for the overall trials and two randomly selected trials (trial 0 and trial 5) out of the nine independent trials are given in Table III as percentages according to [88]. In the incremental percentage values (given in parentheses in Table III), a 20% and 200% increase in TBARS and TOTOX values respectively were observed with implying a statistically significant result. Table IV presents the reheat cycle count classes with an appreciable change in the respective property (spectral, TBARS, and TOTOX).


| Chemical Property | Reheat cycle count class | |||||
|---|---|---|---|---|---|---|
| 1 | 2 | 3 | 4 | 5 | ||
| Overall trials | TBARS | 78.5 35 | 86.0 35 | 99.5 40 | 117.5 40 | 142.0 40 |
| (+ 78.5) | (+ 7.5) | (+ 13.5) | (+ 18.0) | (+ 24.5) | ||
| TOTOX | 240 40 | 395 50 | 530 80 | 820 50 | 925 105 | |
| (+ 240) | (+ 155) | (+ 135) | (+ 290) | (+ 105) | ||
| Trial 0 | TBARS | 105.5 | 114.5 | 122 | 161.5 | 161.5 |
| (+ 105.5) | (+ 9.0) | (+ 7.5) | (+ 39.5) | (+ 0) | ||
| TOTOX | 250 | 455 | 625 | 1005 | 1140 | |
| (+ 250) | (+ 205) | (+ 170) | (+ 380) | (+ 135) | ||
| Trial 5 | TBARS | 38.5 | 58.0 | 63.0 | 69.0 | 108.5 |
| (+ 38.5) | (+ 19.5) | (+ 5.0) | (+ 6.0) | (+ 39.5) | ||
| TOTOX | 250 | 445 | 530 | 615 | 845 | |
| (+ 250) | (+ 195) | (+ 85) | (+ 85) | (+ 230) | ||
| Method | Sample | |||||||||
|---|---|---|---|---|---|---|---|---|---|---|
| Trial 0 | Trial 1 | Trial 2 | Trial 3 | Trial 4 | Trial 5 | Trial 6 | Trial 7 | Trial 8 | ||
| SC framework | LGV | 1, 2, 4 | 1, 2, 5 | 1, 4, 5 | 1, 3, 4 | 1, 5 | 1, 2, 5 | 1, 3, 5 | 1, 4, 5 | 1, 3 |
| LBW | 1, 4 | 1, 5 | 1, 5 | 1, 4 | 1, 5 | 1, 5 | 1, 3 | 1, 4 | 1, 3 | |
| Chemical Analysis | TBARS | 1, 4 | 1, 5 | 1, 5 | 1, 4 | 1, 5 | 1, 5 | 1, 3 | 1, 4 | 1, 3 |
| TOTOX | 1, 2, 4 | 1, 2, 5 | 1, 5 | 1, 4 | 1, 5 | 1, 5 | 1, 3 | 1, 4, 5 | 1, 3 | |
V Discussion
This work proposed a novel application for MISs and their employment in food quality analysis. There is a conspicuous variance amongst the spectral properties of different reheat cycle count classes according to the false RGB representation given in Fig. 4(b) which promotes the use of MSIs to detect and estimate the effects of reheating. Besides that, the insignificant differences between the RGB images of different reheat cycle count classes in Fig. 4(a) corroborate the applicability of transmittance MSIs over RGB photography with translucent specimens. Also, the mean Bhattacharyya distances in adjacent reheat cycle count classes in Fig. 4(a) for RGB photography are marginally separable compared to the values obtained with MSIs as provided in Fig. 4(b). In addition, the monotonic variation in Bhattacharyya distances observed for MSIs has not been replicated with RGB photographs. Furthermore, the variation observed in spectral properties with the reheat cycle count class has reemerged in Fig. 5(a). This result first validates the use of the particular statistical measure in estimating the number of reheating cycles but essentially intimates the usage of the Bhattacharyya distance in estimating the underlying chemical process.
The mean Bhattacharyya distance recorded for each reheat cycle count class monotonically increased (Fig. 5(a)) with the reheat cycle count class, and this monotonic variation allowed to define decision boundaries that gradually increase as observed in Fig. 5(b). Nonetheless, there were overlapping distance intervals in Fig. 5(a) which indicates the existence of coinciding spectral properties of adjacent reheat cycle count classes. As established previously, these characteristics of spectral properties are reflections of the chemical properties of the oil, and the resulted overlapping intervals implicate the divergent nature in the oil chemistry and the similarity in chemical properties of adjacent reheat cycle count classes.
Further, using a statistical measure has inadvertently allowed the classifier to use the sample properties in estimating the reheat cycle count class analogous to a chemical analysis. Whereas, had the classifier been trained on spectral properties of individual pixels, the estimations of the pixels of a sample will inherit the distribution observed in the signatures. Therefore, the distribution of the classification results has to be considered to estimate the reheat cycle count class of the sample, which is antithetical to the use of individual spectral properties over sample properties. In addition, the application of a statistical measure offers flexibility in selecting a preferable sample size from the MSIs of a given oil sample. Moreover, the use of a statistical measure could be construed as observing a superpixel that inherits the spectral properties of that sample. Hence, the proposed method could even be used with low image resolutions because low-resolution images will record the cumulative effect — similar to using a statistical measure — of spectral signatures under observations. Besides, high-resolution images inherently perform superior as these images could contain more delicate information of the spectral properties.
The decision boundaries given in Fig. 5(b) have distinctly separated the pure oil samples from heated oil, indicating the spectral properties are drastically changed. Also, this distinction has been recorded in confusion matrices for both train and test data with a classification accuracy of 100%. Overall, the SVM classifier has recorded an overall accuracy of 86.84% and 83.34% for train and test data. Since the classifier can differentiate pure oil from heated oil, it is apt to reconsider the classifier’s performance with heated oil only. With only heated oil samples, the classifier can estimate the reheat cycle count class with accuracy levels of 84.21% and 80.00% for train and test data, respectively.
The SC framework was introduced to detect the reheat cycle count classes where a marked change in the spectral properties happened. In both illustrated sigma-sweep curves in Fig. 8(a) and 8(b), the dominant clustering mode has been recorded as four under the LGV algorithm. However, the corresponding clustering configuration of the two trials is disparate according to Fig. 9(a) and 9(b). According to Fig. 9(a), the framework has chosen the first, second, and fourth reheat cycle count classes as the stages where a drastic alteration has occurred in the oil sample in trial 0. When compared with the chemical results in Table III for trial 0, a similar pattern is noticeable for the TOTOX level, whereas, with TBARS value, a suitable separation would be the first, and fourth as the critical reheat cycle count classes. In fact, in Fig. 8(a), the maximum gap value of the third and fourth eigengap is similar, and the prominent mode of 4 has been chosen with a slight margin. Furthermore, the SC framework has chosen first, second, and fifth as the reheat cycle count classes of interest for trial 5, and the separation could be observed in both the TBARS and TOTOX values from the chemical analysis. However, similar to trial 0, the optimal separation could be redressed to three prominent clusters with the first and fifth cycles as critical.
The variation in sigma-sweep curves, for both the trials as is extremely increased, complements the above correction for the prominent mode, as the value of the third eigengap supersedes that of the fourth eigengap. Besides that, the commonality in both these cases is that the eigengap (mode) that sustained the gap value over an extensive range of is the same and is three as presented in Fig. 8(d) and 8(e). The clustering results with the LBW algorithm are presented in Fig. 9(d) and 9(e). When the LGV algorithm and the LBW algorithm are juxtaposed, each method has its merits and demerits. For example, the LGV algorithm tends to overestimate the number of critical reheat stages but guarantees the maximal closeness of the spectral properties of the reheat stages that are grouped. Whereas the LBW algorithm is more robust in operation and is immune to noise in spectral properties, yet could underestimate the number of critical stages as the algorithm seeks for maximally and equally separated clusters. Further, both the LGV and LBW methods grouped reheat cycle count classes with slight alterations in spectral properties while dividing at reheat cycle count classes with significant changes. Thereby, the inter-class boundaries represented appreciable changes in composition, which indicates significant chemical property changes that could be a potential health risk.
The performance of the LGV algorithm on an ensemble of reheated oils are illustrated in Fig. 8(c) and Fig. 9(c) along with the chemical analysis results in Table III. The prominent clustering mode given by the framework is four since the fourth eigengap is the largest. However, the clustering configuration of the mixture of an oil sample is inconsistent with the results of the chemical analysis even though the individual trials complied with the framework results. This inconsistency could have been influenced by the spectral similarity of adjacent reheat cycle count classes of different trials. Hence, the SC framework has recognized the first, second, and fifth reheat cycle count class as critical, while the chemical analysis ruled first and fourth cycles and first and fifth cycles as critical for TOTOX and TBARS values, respectively. Nonetheless, the LBW algorithm has managed to replicate the results (Fig. 8(f) and Fig. 9(f)) for TBARS values of the mixture and this agreement of results powerfully portrays the association between the spectral properties and TBARS values. Despite the hodgepodge of spectral signatures from different trials, the framework has managed to group signatures from the same reheat cycle count class and minimize misclassifications.
In this paper, the experimental procedure mimics edible oils for frying in foodservice establishments. The proposed application could be used to estimate the reheat cycle count class of coconut oil and to visualize the harm to the chemical properties of the oil as the reheat cycle count class is increased. The food authorities could use the application to check the use of reheated oil at food establishments. Also, the vendors could use the MIS as visual assistance for safe reheating and detect significant changes to the oil, which could cause the oil to be deemed unfit for consumption.
VI Conclusion
In this paper, a novel application was proposed for MISs to estimate reheat cycle count class and discrimination of appreciable alterations in the chemical and thermophysical properties under repetitive heating for frying oil, with coconut oil as the case study. The proposed work introduced the transmittance configuration of the MIS to acquire images of translucent liquid specimens instead of the conventional reflectance configuration. It was observed that the reheating of oil is another oil degradation process like adulteration, and MSIs prevail over RGB images in the detection of these corruptions. The spectral properties were proven to be sensitive to the reheat cycle count class of the oil with the incorporation of Bhattacharyya distance. The SVM classifier had an accuracy of 80.00 %, 83.34 %, and 100 % for estimating reheat cycle count classes excluding pure oil, including pure oil, and separation of pure oil and heated oil, respectively, for test data. Furthermore, a novel algorithm was discussed to select the prominent mode and dominant for the SC framework suggested for detecting critical reheat cycle count classes using spectral properties. The proposed LBW algorithm identified clusters of reheat cycle count classes that are dramatically separated in terms of spectral properties due to the significant changes in the chemical properties. The identification was performed using a modified version of SC to group reheat cycle count classes that were only marginally separated. The modified version resulted in the formation of umbrella clusters where the separation was significant in the feature space. The cluster formation was shown to be in line with the results of the chemical validation performed subsequently. At the same time, the LGV algorithm promoted the connectivity of intra-class spectral signatures in each umbrella cluster more than the separation between those umbrella clusters. Hence, while the LGV algorithm managed to reproduce the results from the LBW algorithm, it was able to identify ‘reheat cycle count classes’ with minor alterations as well. Furthermore, it was evident that for proper operation of the framework, it is necessary to analyze different oil samples separately, similar to alternative analytical techniques, and should not be amalgamated. The chemical analysis yielded that the TBARS and TOTOX values of oil significantly changed with the reheat cycle count classes, and the results of the SC framework were deemed to coincide with the formerly mentioned chemical property alterations. Food authorities and foodservice establishments could use the proposed application for adherence to health and safety protocol regarding safe reheating of oil. However, the case study used in this work was limited to coconut oil and potato chips as fryable food. Hence, we wish to expand the proposed application and frameworks to other oil types such as palm and soybean and other fryable food types. Also, the MIS could be extended to measure the change in TBARS and TOTOX values as there was an appreciable variation (p ) in TBARS and TOTOX readings as the reheat cycle count class was incremented.
Appendix A
The reheat count class classification accuracies of SVM classifier were compared with different classifiers: Neural networks, Nearest neighbor classifier, Nearest centroid classifier, Gaussian process classifier, and Random Forrest. The comparison results are given in Table A1.
| Reheat count class | Classifier | |||||
|---|---|---|---|---|---|---|
| Support Vector Machine | Neural networks | Nearest Neighbor Classifier | Nearest Centroid Classifier | Gaussian Process Classifier | Random Forrest | |
| 0 | 1.000 | 1.000 | 1.000 | 1.000 | 1.000 | 1.000 |
| 1 | 0.909 | - | 0.886 | 1.000 | 1.000 | 0.800 |
| 2 | 0.682 | 1.000 | 0.486 | 0.514 | 0.457 | 0.600 |
| 3 | 0.864 | - | 0.486 | 0.800 | 0.714 | 0.429 |
| 4 | 0.727 | - | 0.314 | 0.600 | 0.229 | 0.257 |
| 5 | 0.818 | 1.000 | 0.029 | - | - | 0.057 |
| overall | 0.8334 | 0.5000 | 0.5335 | 0.6524 | 0.5664 | 0.5238 |
Appendix B
| Classification Accuracy | |||||||||||
|---|---|---|---|---|---|---|---|---|---|---|---|
| 0.5 | 0.6 | 0.7 | 0.8 | 0.9 | 1.0 | 1.1 | 1.2 | 1.3 | 1.4 | ||
| Cost | 0.7997 | 0.8206 | 0.8206 | 0.8218 | 0.8206 | 0.8229 | 0.8276 | 0.8299 | 0.8334 | 0.8334 | |
| 0.7997 | 0.8206 | 0.8206 | 0.8218 | 0.8206 | 0.8229 | 0.8276 | 0.8299 | 0.8334 | 0.8334 | ||
| 0.8113 | 0.8253 | 0.8299 | 0.8287 | 0.8276 | 0.8311 | 0.8311 | 0.8345 | 0.8334 | 0.8369 | ||
| 0.8160 | 0.8299 | 0.8334 | 0.8345 | 0.8392 | 0.8369 | 0.8380 | 0.8380 | 0.8369 | 0.8357 | ||
| 0.8183 | 0.8345 | 0.8369 | 0.8369 | 0.8369 | 0.8334 | 0.8369 | 0.8369 | 0.8415 | 0.8427 | ||
| 0.8241 | 0.8334 | 0.8380 | 0.8369 | 0.8345 | 0.8369 | 0.8427 | 0.8684 | 0.8438 | 0.8450 | ||
| 0.8264 | 0.8369 | 0.8369 | 0.8345 | 0.8369 | 0.8438 | 0.845 | 0.8427 | 0.8462 | 0.8415 | ||
| 0.8253 | 0.838 | 0.8369 | 0.8369 | 0.8438 | 0.8427 | 0.8438 | 0.8438 | 0.8415 | 0.8462 | ||
The classification accuracy from the parametric sweep are given in Table B1 for the selection of optimal and cost.
Acknowledgment
The authors thank Ms. E.G.T.S. Wijethunga, Department of Food Science and Technology, University of Peradeniya, Sri Lanka for assisting the chemical analysis of this work. Also, the authors acknowledge Silver Mills Groups, Meerigama for supplying coconut oil.
References
- [1] K. Lim, K. Pan, Z. Yu, and R. H. Xiao, “Pattern recognition based on machine learning identifies oil adulteration and edible oil mixtures,” Nature communications, vol. 11, no. 1, pp. 1–10, 2020.
- [2] S. Popa, M. S. Milea, S. Boran, S. V. Nițu, G. E. Moșoarcă, C. Vancea, and R. I. Lazău, “Rapid adulteration detection of cold pressed oils with their refined versions by uv–vis spectroscopy,” Scientific reports, vol. 10, no. 1, pp. 1–9, 2020.
- [3] M. A. Subhi, S. H. Ali, and M. A. Mohammed, “Vision-based approaches for automatic food recognition and dietary assessment: A survey,” IEEE Access, vol. 7, pp. 35 370–35 381, 2019.
- [4] M. Farooq and E. Sazonov, “A novel wearable device for food intake and physical activity recognition,” Sensors, vol. 16, no. 7, p. 1067, 2016.
- [5] T. Prioleau, E. Moore, and M. Ghovanloo, “Unobtrusive and wearable systems for automatic dietary monitoring,” IEEE Transactions on Biomedical Engineering, vol. 64, no. 9, pp. 2075–2089, 2017.
- [6] M. Farooq and E. Sazonov, “Segmentation and characterization of chewing bouts by monitoring temporalis muscle using smart glasses with piezoelectric sensor,” IEEE journal of biomedical and health informatics, vol. 21, no. 6, pp. 1495–1503, 2016.
- [7] P. Lopez-Meyer, S. Schuckers, O. Makeyev, J. M. Fontana, and E. Sazonov, “Automatic identification of the number of food items in a meal using clustering techniques based on the monitoring of swallowing and chewing,” Biomedical signal processing and control, vol. 7, no. 5, pp. 474–480, 2012.
- [8] Y. He, C. Xu, N. Khanna, C. J. Boushey, and E. J. Delp, “Food image analysis: Segmentation, identification and weight estimation,” in 2013 IEEE International Conference on Multimedia and Expo (ICME). IEEE, 2013, pp. 1–6.
- [9] A. Doulah, M. Farooq, X. Yang, J. Parton, M. A. McCrory, J. A. Higgins, and E. Sazonov, “Meal microstructure characterization from sensor-based food intake detection,” Frontiers in nutrition, vol. 4, p. 31, 2017.
- [10] F. López-García, G. Andreu-García, J. Blasco, N. Aleixos, and J.-M. Valiente, “Automatic detection of skin defects in citrus fruits using a multivariate image analysis approach,” Computers and Electronics in Agriculture, vol. 71, no. 2, pp. 189–197, 2010.
- [11] Y. Al Ohali, “Computer vision based date fruit grading system: Design and implementation,” Journal of King Saud University-Computer and Information Sciences, vol. 23, no. 1, pp. 29–36, 2011.
- [12] B. Zhang, W. Huang, L. Gong, J. Li, C. Zhao, C. Liu, and D. Huang, “Computer vision detection of defective apples using automatic lightness correction and weighted rvm classifier,” Journal of Food Engineering, vol. 146, pp. 143–151, 2015.
- [13] L. Jiang, B. Qiu, X. Liu, C. Huang, and K. Lin, “Deepfood: food image analysis and dietary assessment via deep model,” IEEE Access, vol. 8, pp. 47 477–47 489, 2020.
- [14] R. Jamwal, S. Kumari, A. S. Dhaulaniya, B. Balan, D. K. Singh et al., “Application of atr-ftir spectroscopy along with regression modelling for the detection of adulteration of virgin coconut oil with paraffin oil,” LWT, vol. 118, p. 108754, 2020.
- [15] C. A. Nunes, “Vibrational spectroscopy and chemometrics to assess authenticity, adulteration and intrinsic quality parameters of edible oils and fats,” Food Research International, vol. 60, pp. 255–261, 2014.
- [16] L.-C. Fengou, I. Mporas, E. Spyrelli, A. Lianou, and G.-J. Nychas, “Estimation of the microbiological quality of meat using rapid and non-invasive spectroscopic sensors,” IEEE Access, vol. 8, pp. 106 614–106 628, 2020.
- [17] R. Jamwal, S. Kumari, S. Kelly, A. Cannavan, D. K. Singh et al., “Rapid detection of pure coconut oil adulteration with fried coconut oil using atr-ftir spectroscopy coupled with multivariate regression modelling,” LWT, vol. 125, p. 109250, 2020.
- [18] R. Li, D. Dhankhar, J. Chen, A. Krishnamoorthi, T. C. Cesario, and P. M. Rentzepis, “Identification of live and dead bacteria: A raman spectroscopic study,” IEEE Access, vol. 7, pp. 23 549–23 559, 2019.
- [19] M. A. Manaf, Y. B. C. Man, N. S. A. Hamid, A. Ismail, and S. Z. Abidin, “Analysis of adulteration of virgin coconut oil by palm kernel olein using fourier transform infrared spectroscopy,” Journal of Food Lipids, vol. 14, no. 2, pp. 111–121, 2007.
- [20] M. J. Khan, H. S. Khan, A. Yousaf, K. Khurshid, and A. Abbas, “Modern trends in hyperspectral image analysis: A review,” IEEE Access, vol. 6, pp. 14 118–14 129, 2018.
- [21] M. Li, M. Huang, Q. Zhu, M. Zhang, Y. Guo, and J. Qin, “Pickled and dried mustard foreign matter detection using multispectral imaging system based on single shot method,” Journal of Food Engineering, vol. 285, p. 110106, 2020.
- [22] J. Qin and R. Lu, “Measurement of the absorption and scattering properties of turbid liquid foods using hyperspectral imaging,” Applied spectroscopy, vol. 61, no. 4, pp. 388–396, 2007.
- [23] L. Pan, Q. Zhang, W. Zhang, Y. Sun, P. Hu, and K. Tu, “Detection of cold injury in peaches by hyperspectral reflectance imaging and artificial neural network,” Food chemistry, vol. 192, pp. 134–141, 2016.
- [24] M. Nagata, J. G. Tallada, and T. Kobayashi, “Bruise detection using nir hyperspectral imaging for strawberry (fragaria ananassa duch.),” Environmental Control in Biology, vol. 44, no. 2, pp. 133–142, 2006.
- [25] J. M. Harnly, P. B. Harrington, L. L. Botros, J. Jablonski, C. Chang, M. M. Bergana, P. Wehling, G. Downey, A. R. Potts, and J. C. Moore, “Characterization of near-infrared spectral variance in the authentication of skim and nonfat dry milk powder collection using anova-pca, pooled-anova, and partial least-squares regression,” Journal of agricultural and food chemistry, vol. 62, no. 32, pp. 8060–8067, 2014.
- [26] Z. Saleem, M. H. Khan, M. Ahmad, A. Sohaib, H. Ayaz, and M. Mazzara, “Prediction of microbial spoilage and shelf-life of bakery products through hyperspectral imaging,” IEEE Access, vol. 8, pp. 176 986–176 996, 2020.
- [27] M. B. Stuart, L. R. Stanger, M. J. Hobbs, T. D. Pering, D. Thio, A. J. McGonigle, and J. R. Willmott, “Low-cost hyperspectral imaging system: Design and testing for laboratory-based environmental applications,” Sensors, vol. 20, no. 11, p. 3293, 2020.
- [28] S. Kakde, R. S. Bhopal, S. Bhardwaj, and A. Misra, “Urbanized south asians’ susceptibility to coronary heart disease: The high-heat food preparation hypothesis,” Nutrition, vol. 33, pp. 216–224, 2017.
- [29] U. S. Arachchige, K. A. Wijenayake, K. V. Miyuranga, D. Thilakarathne, N. A. Weerasekara, and R. A. Jayasinghe, “Potential utilization of waste cooking oil in sri lanka: Policy implementation,” International Journal of Scientific Engineering and Science, vol. 5, pp. 1–5, 2021.
- [30] “GDP per capita (current US$) - South Asia,” https://data.worldbank.org/indicator/NY.GDP.PCAP.CD?locations=8S&most_recent_value_desc=true, The World Bank, 2020, [Online; accessed 25-December-2021].
- [31] A. A. Gowen, C. P. O’Donnell, P. J. Cullen, G. Downey, and J. M. Frias, “Hyperspectral imaging–an emerging process analytical tool for food quality and safety control,” Trends in food science & technology, vol. 18, no. 12, pp. 590–598, 2007.
- [32] S. Rahi, H. Mobli, and B. Jamshidi, “Spectroscopy and spectral imaging techniques for non-destructive food microbial assessment,” in Proceedings of the 5th Iranian International NDT Conference November, 2018, pp. 4–5.
- [33] N. Wang, G. ElMasry, S. Sevakarampalayam, and J. Qiao, “Spectral imaging techniques for food quality evaluation,” Stewart Postharvest Review, vol. 3, no. 1, pp. 1–8, 2007.
- [34] T. Brosnan and D.-W. Sun, “Improving quality inspection of food products by computer vision—-a review,” Journal of food engineering, vol. 61, no. 1, pp. 3–16, 2004.
- [35] J.-H. Cheng and D.-W. Sun, “Rapid and non-invasive detection of fish microbial spoilage by visible and near infrared hyperspectral imaging and multivariate analysis,” LWT-food Science and Technology, vol. 62, no. 2, pp. 1060–1068, 2015.
- [36] G. ElMasry, N. Wang, C. Vigneault, J. Qiao, and A. ElSayed, “Early detection of apple bruises on different background colors using hyperspectral imaging,” LWT-Food Science and Technology, vol. 41, no. 2, pp. 337–345, 2008.
- [37] S. Bhardwaj, S. J. Passi, A. Misra, K. K. Pant, K. Anwar, R. Pandey, and V. Kardam, “Effect of heating/reheating of fats/oils, as used by asian indians, on trans fatty acid formation,” Food chemistry, vol. 212, pp. 663–670, 2016.
- [38] M. Bhuiyan, M. Chowdhury, R. Akter, M. H. Rahman, M. A. Rahman, and M. Khan, “Determination of thermophysical prop-erties of edible oil at high temperature using differential scanning calorimetry (dsc),” Middle-East Journal of Scientific Research, vol. 24, pp. 3302–3306, 2016.
- [39] C. Guillaume, F. De Alzaa, and L. Ravetti, “Evaluation of chemical and physical changes in different commercial oils during heating,” Acta Scientific Nutritional Health, vol. 2, no. 6, pp. 2–11, 2018.
- [40] A. V. Khera, M. Cuchel, M. De La Llera-Moya, A. Rodrigues, M. F. Burke, K. Jafri, B. C. French, J. A. Phillips, M. L. Mucksavage, R. L. Wilensky et al., “Cholesterol efflux capacity, high-density lipoprotein function, and atherosclerosis,” New England Journal of Medicine, vol. 364, no. 2, pp. 127–135, 2011.
- [41] Á. Hernáez, M. T. Soria-Florido, H. Schröder, E. Ros, X. Pintó, R. Estruch, J. Salas-Salvadó, D. Corella, F. Arós, L. Serra-Majem et al., “Role of hdl function and ldl atherogenicity on cardiovascular risk: a comprehensive examination,” PLoS One, vol. 14, no. 6, p. e0218533, 2019.
- [42] M. A. Hamsi, F. Othman, S. Das, Y. Kamisah, Z. C. Thent, H. M. S. Qodriyah, Z. Zakaria, A. Emran, K. Subermaniam, and K. Jaarin, “Effect of consumption of fresh and heated virgin coconut oil on the blood pressure and inflammatory biomarkers: an experimental study in sprague dawley rats,” Alexandria Journal of Medicine, vol. 51, no. 1, pp. 53–63, 2015.
- [43] H. Ghazali, A. Tan, S. Abdulkarim, M. Dzulkifly et al., “Oxidative stability of virgin coconut oil compared with rbd palm olein in deep-fat frying of fish crackers,” J Food Agric Environ, vol. 7, pp. 23–37, 2009.
- [44] S. Karimi, M. Wawire, and F. M. Mathooko, “Impact of frying practices and frying conditions on the quality and safety of frying oils used by street vendors and restaurants in nairobi, kenya,” Journal of Food Composition and Analysis, vol. 62, pp. 239–244, 2017.
- [45] K. N. Seneviratne, W. C. Prasadani, and B. Jayawardena, “Phenolic extracts of coconut oil cake: a potential alternative for synthetic antioxidants,” Food Science and Technology, vol. 36, pp. 591–597, 2016.
- [46] E. Melo, F. Michels, D. Arakaki, N. Lima, D. Gonçalves, L. Cavalheiro, L. Oliveira, A. Caires, P. Hiane, and V. Nascimento, “First study on the oxidative stability and elemental analysis of babassu (attalea speciosa) edible oil produced in brazil using a domestic extraction machine,” Molecules, vol. 24, no. 23, p. 4235, 2019.
- [47] C. Li, B. Li, and D. Ye, “Analysis and identification of rice adulteration using terahertz spectroscopy and pattern recognition algorithms,” IEEE Access, vol. 8, pp. 26 839–26 850, 2020.
- [48] J. Fennell, C. Veys, J. Dingle, J. Nwezeobi, S. van Brunschot, J. Colvin, and B. Grieve, “A method for real-time classification of insect vectors of mosaic and brown streak disease in cassava plants for future implementation within a low-cost, handheld, in-field multispectral imaging sensor,” Plant methods, vol. 14, no. 1, pp. 1–12, 2018.
- [49] W. G. C. Bandara, G. W. K. Prabhath, D. W. S. C. B. Dissanayake, V. R. Herath, G. M. R. I. Godaliyadda, M. P. B. Ekanayake, D. Demini, and T. Madhujith, “Validation of multispectral imaging for the detection of selected adulterants in turmeric samples,” Journal of Food Engineering, vol. 266, p. 109700, 2020.
- [50] N. Hashim, D. I. Onwude, and M. S. Osman, “Evaluation of chilling injury in mangoes using multispectral imaging,” Journal of food science, vol. 83, no. 5, pp. 1271–1279, 2018.
- [51] D. Ariana, D. E. Guyer, and B. Shrestha, “Integrating multispectral reflectance and fluorescence imaging for defect detection on apples,” Computers and electronics in agriculture, vol. 50, no. 2, pp. 148–161, 2006.
- [52] C.-N. Nguyen, Q.-T. Phan, N.-T. Tran, M. Fukuzawa, P.-L. Nguyen, and C.-N. Nguyen, “Precise sweetness grading of mangoes (mangifera indica l.) based on random forest technique with low-cost multispectral sensors,” IEEE Access, vol. 8, pp. 212 371–212 382, 2020.
- [53] A. Ropodi, D. Pavlidis, F. Mohareb, E. Panagou, and G.-J. Nychas, “Multispectral image analysis approach to detect adulteration of beef and pork in raw meats,” Food Research International, vol. 67, pp. 12–18, 2015.
- [54] C. Liu, W. Liu, X. Lu, W. Chen, J. Yang, and L. Zheng, “Nondestructive determination of transgenic bacillus thuringiensis rice seeds (oryza sativa l.) using multispectral imaging and chemometric methods,” Food chemistry, vol. 153, pp. 87–93, 2014.
- [55] L. Senni, P. Burrascano, and M. Ricci, “Multispectral laser imaging for advanced food analysis,” Infrared Physics & Technology, vol. 77, pp. 179–192, 2016.
- [56] C. Liu, G. Hao, M. Su, Y. Chen, and L. Zheng, “Potential of multispectral imaging combined with chemometric methods for rapid detection of sucrose adulteration in tomato paste,” Journal of Food Engineering, vol. 215, pp. 78–83, 2017.
- [57] P. Ebrahimi, F. van den Berg, S. D. Aunsbjerg, A. Honoré, C. Benfeldt, H. M. Jensen, and S. B. Engelsen, “Quantitative determination of mold growth and inhibition by multispectral imaging,” Food Control, vol. 55, pp. 82–89, 2015.
- [58] F. Ma, J. Yao, T. Xie, C. Liu, W. Chen, C. Chen, and L. Zheng, “Multispectral imaging for rapid and non-destructive determination of aerobic plate count (apc) in cooked pork sausages,” Food research international, vol. 62, pp. 902–908, 2014.
- [59] A. M. de Oca, L. Arreola, A. Flores, J. Sanchez, and G. Flores, “Low-cost multispectral imaging system for crop monitoring,” in 2018 International Conference on Unmanned Aircraft Systems (ICUAS). IEEE, 2018, pp. 443–451.
- [60] J. Honrado, D. B. Solpico, C. Favila, E. Tongson, G. L. Tangonan, and N. J. Libatique, “Uav imaging with low-cost multispectral imaging system for precision agriculture applications,” in 2017 IEEE Global Humanitarian Technology Conference (GHTC). IEEE, 2017, pp. 1–7.
- [61] V. B. Raju and E. Sazonov, “Detection of oil-containing dressing on salad leaves using multispectral imaging,” IEEE Access, vol. 8, pp. 86 196–86 206, 2020.
- [62] H. Weerasooriya, H. Lakmal, D. Ranasinghe, W. Bandara, H. Herath, G. Godaliyadda, M. Ekanayake, and T. Madujith, “Transmittance multispectral imaging for edible oil quality assessment,” in 3D Image Acquisition and Display: Technology, Perception and Applications. Optical Society of America, 2020, pp. JW5C–8.
- [63] R. Jamwal, S. Kumari, A. S. Dhaulaniya, B. Balan, S. Kelly, A. Cannavan, D. K. Singh et al., “Utilizing atr-ftir spectroscopy combined with multivariate chemometric modelling for the swift detection of mustard oil adulteration in virgin coconut oil,” Vibrational Spectroscopy, vol. 109, p. 103066, 2020.
- [64] A. Palananda and W. Kimpan, “Turbidity of coconut oil determination using the mamoh method in image processing,” IEEE Access, vol. 9, pp. 41 494–41 505, 2021.
- [65] E. N. Frankel, “Chemistry of extra virgin olive oil: adulteration, oxidative stability, and antioxidants,” Journal of agricultural and food chemistry, vol. 58, no. 10, pp. 5991–6006, 2010.
- [66] H. Jabeur, A. Zribi, J. Makni, A. Rebai, R. Abdelhedi, and M. Bouaziz, “Detection of chemlali extra-virgin olive oil adulteration mixed with soybean oil, corn oil, and sunflower oil by using gc and hplc,” Journal of agricultural and food chemistry, vol. 62, no. 21, pp. 4893–4904, 2014.
- [67] T. Chen, X. Chen, D. Lu, and B. Chen, “Detection of adulteration in canola oil by using gc-ims and chemometric analysis,” International journal of analytical chemistry, vol. 2018, 2018.
- [68] A. Rohman and Y. B. Che Man, “Analysis of cod-liver oil adulteration using fourier transform infrared (ftir) spectroscopy,” Journal of the American Oil Chemists’ Society, vol. 86, no. 12, p. 1149, 2009.
- [69] N. Quiñones-Islas, O. G. Meza-Márquez, G. Osorio-Revilla, and T. Gallardo-Velazquez, “Detection of adulterants in avocado oil by mid-ftir spectroscopy and multivariate analysis,” Food Research International, vol. 51, no. 1, pp. 148–154, 2013.
- [70] V. Baeten, M. Meurens, M. T. Morales, and R. Aparicio, “Detection of virgin olive oil adulteration by fourier transform raman spectroscopy,” Journal of Agricultural and Food Chemistry, vol. 44, no. 8, pp. 2225–2230, 1996.
- [71] A. Rohman and Y. B. C. Man, “The use of fourier transform mid infrared (ft-mir) spectroscopy for detection and quantification of adulteration in virgin coconut oil,” Food Chemistry, vol. 129, no. 2, pp. 583–588, 2011.
- [72] D. Khamsopha, S. Woranitta, and S. Teerachaichayut, “Utilizing near infrared hyperspectral imaging for quantitatively predicting adulteration in tapioca starch,” Food Control, vol. 123, p. 107781, 2021.
- [73] A. I. Ropodi, E. Z. Panagou, and G.-J. E. Nychas, “Multispectral imaging (msi): A promising method for the detection of minced beef adulteration with horsemeat,” Food Control, vol. 73, pp. 57–63, 2017.
- [74] S. Herath, H. Weerasooriya, D. Ranasinghe, W. Bandara, H. Herath, G. Godaliyadda, M. Ekanayake, and T. Madhujith, “Quantitative assessment of adulteration and reuse of coconut oil using transmittance multispectral imaging,” arXiv preprint arXiv:2011.14644, 2020.
- [75] A. Kumar, P. P. Singh, and B. Prakash, “Assessing the efficacy of chitosan nanomatrix incorporated with cymbopogon citratus (dc.) stapf essential oil against the food-borne molds and aflatoxin b1 production in food system,” Pesticide Biochemistry and Physiology, p. 105001, 2021.
- [76] J. Chen, F. Liu, Z. Li, L. Tan, M. Zhang, and D. Xu, “Solid phase extraction based microfluidic chip coupled with mass spectrometry for rapid determination of aflatoxins in peanut oil,” Microchemical Journal, vol. 167, p. 106298, 2021.
- [77] M. Goel, E. Whitmire, A. Mariakakis, T. S. Saponas, N. Joshi, D. Morris, B. Guenter, M. Gavriliu, G. Borriello, and S. N. Patel, “Hypercam: Hyperspectral imaging for ubiquitous computing applications,” in Proceedings of the 2015 ACM International Joint Conference on Pervasive and Ubiquitous Computing, ser. UbiComp ’15. Association for Computing Machinery, 2015, p. 145–156.
- [78] G. Prabhath, W. Bandara, D. Dissanayake, H. Hearath, G. Godaliyadda, M. Ekanayake, S. Demini, and T. Madhujith, “Multispectral imaging for detection of adulterants in turmeric powder,” in Hyperspectral Imaging and Sounding of the Environment. Optical Society of America, 2019, pp. HTu3B–3.
- [79] J. Qin, K. Chao, M. S. Kim, R. Lu, and T. F. Burks, “Hyperspectral and multispectral imaging for evaluating food safety and quality,” Journal of Food Engineering, vol. 118, no. 2, pp. 157–171, 2013.
- [80] W. C. Porter, B. Kopp, J. C. Dunlap, R. Widenhorn, and E. Bodegom, “Dark current measurements in a cmos imager,” in Sensors, Cameras, and Systems for Industrial/Scientific Applications IX, vol. 6816. International Society for Optics and Photonics, 2008, p. 68160C.
- [81] T. Acharya and A. K. Ray, Image processing: principles and applications. John Wiley & Sons, 2005.
- [82] H. Weerasooriya, Y. Ranasinghe, H. M. Lakmal, W. G. C. Bandara, V. Herath, R. Godaliyadda, M. P. Ekanayake, and T. Madhujith, “Data for: Application of multispectral imaging to assess the quality of coconut oil,” Mendeley Data, V1, 2020, [Online]. Accessed: Jul. 02, 2021.
- [83] J. Cohen, “Statistical power analysis,” Current directions in psychological science, vol. 1, no. 3, pp. 98–101, 1992.
- [84] F. Pedregosa, G. Varoquaux, A. Gramfort, V. Michel, B. Thirion, O. Grisel, M. Blondel, P. Prettenhofer, R. Weiss, V. Dubourg, J. Vanderplas, A. Passos, D. Cournapeau, M. Brucher, M. Perrot, and E. Duchesnay, “Scikit-learn: Machine learning in Python,” Journal of Machine Learning Research, vol. 12, pp. 2825–2830, 2011.
- [85] C. Cortes and V. Vapnik, “Support-vector networks,” Machine learning, vol. 20, no. 3, pp. 273–297, 1995. [Online]. Available: https://doi.org/10.1007/BF00994018
- [86] A. Y. Ng, M. I. Jordan, and Y. Weiss, “On spectral clustering: Analysis and an algorithm,” in ADVANCES IN NEURAL INFORMATION PROCESSING SYSTEMS. MIT Press, 2001, pp. 849–856.
- [87] R. Rupasinghe, S. Senanayake, D. Padmasiri, M. Ekanayake, G. Godaliyadda, and J. Wijayakulasooriya, “Modes of clustering for motion pattern analysis in video surveillance,” in 2016 IEEE International Conference on Information and Automation for Sustainability (ICIAfS). IEEE, 2016, pp. 1–6.
- [88] K. Jaarin and Y. Kamisah, “Repeatedly heated vegetable oils and lipid peroxidation,” in Lipid Peroxidation, A. Catala, Ed. Rijeka: IntechOpen, 2012, ch. 10. [Online]. Available: https://doi.org/10.5772/46076
![[Uncaptioned image]](/html/2108.12665/assets/Figures/yasiru.jpg) |
D.Y.L. Ranasinghe received his B.Sc. Engineering degree in Electrical and Electronic Engineering from the University of Peradeniya, Sri Lanka, in 2020. Immediately after, he joined the School of Engineering, Sri Lanka Technological Campus, Padukka, Sri Lanka as a Research Assistant. He is currently working as a research assistance at University of Peradeniya under a research grant from the International Development Research Centre (IDRC), Canada. His research interests include hyperspectral and multispectral imaging, remote sensing, signal and image processing, and deep learning. He has numerous publications in IEEE conferences. |
![[Uncaptioned image]](/html/2108.12665/assets/Figures/kavinga.jpg) |
H.M.H.K. Weerasooriya obtained his degree in Electrical and Electronic Engineering with first-class honours and he currently works as an Instructor in the Department of Electronic and Electrical Engineering. Currently, he is involved in the researches on hyperspectral imaging for remote sensing and agriculture applications, and he has numerous publications in IEEE conferences. His research interests include image processing, signal processing, communication, machine learning and deep learning. |
![[Uncaptioned image]](/html/2108.12665/assets/Figures/sanjaya.jpg) |
S. Herath received his B.Sc. Engineering degree in Electrical and Electronic Engineering from the University of Peradeniya, Sri Lanka, in 2020. Immediately after, he joined the Department of Engineering Mathematics, University of Peradeniya as a Teaching Instructor. He is currently a graduate student at the Department of Electrical and Computer Engineering, University of Maryland, USA. His research interests include computer vision, image and signal processing, pattern recognition, blind source separation, and machine learning. He has numerous publications in IEEE conferences. |
![[Uncaptioned image]](/html/2108.12665/assets/Figures/parakrama.jpg) |
M.P.B. Ekanayake (Senior Member, IEEE) received his B.Sc. Engineering degree in Electrical and Electronic Engineering from University of Peradeniya, Sri Lanka, in 2006, and Ph.D. from Texas Tech University in 2011. Currently, he is attached to the University of Peradeniya as a Senior Lecturer. His current research interests include applications of signal processing and system modeling in remote sensing, hyperspectral imaging, and smart grid. He is a Senior Member of the IEEE. He is a recipient of the Sri Lanka President’s Award for Scientific Publications in 2018 and 2019. He has obtained several grants through the National Science Foundation (NSF) for research projects. His previous works have been published in IEEE-TGRS and several other IEEE-GRSS conferences including WHISPERS and IGARSS. He also has multiple publications in many IEEE transactions, Elsevier and IET journals and has been awarded several best paper awards in international conferences. |
![[Uncaptioned image]](/html/2108.12665/assets/Figures/vijitha.jpg) |
H.M.V.R. Herath (Senior Member, IEEE) received the B.Sc.Eng. degree in electrical and electronic engineering with 1st class honours from the University of Peradeniya, Peradeniya, Sri Lanka, in 1998, M.Sc. degree in electrical and computer engineering with the award of academic merit from the University of Miami, USA in 2002, and Ph.D. degree in electrical engineering from the University of Paderborn, United States in 2009. In 2009, he joined the Department of Electrical and Electronic Engineering, University of Peradeniya, as a Senior Lecturer. His current research interests include hyperspectral imaging for remote sensing, multispectral imaging for food quality assessment, Coherent optical communications and integrated electronics. Dr. Herath was a member of one of the teams that for the first time successfully demonstrated coherent optical transmission with QPSK and polarization multiplexing. He is a member of the Institution of Engineers, Sri Lanka and The Optical Society. He is a Senior Member of the IEEE. He was the General Chair of the IEEE International Conference on Industrial and Information Systems (ICIIS) 2013 held in Kandy, Sri Lanka. His previous works have been published in IEEE-TGRS and several other IEEE-GRSS conferences including WHISPERS and IGARSS. He received the paper award in the ICTer 2017 conference held in Colombo Sri Lanka. Dr. Herath is a recipient of Sri Lanka President’s Award for scientific research in 2013. |
![[Uncaptioned image]](/html/2108.12665/assets/Figures/roshan.jpg) |
G.M.R.I. Godaliyadda (Senior Member, IEEE) obtained his B.Sc. Engineering degree in Electrical and Electronic Engineering from the University of Peradeniya, Sri Lanka, in 2005, and Ph.D. from the National University of Singapore in 2011. Currently, he is attached to the University of Peradeniya, Faculty of Engineering, Department of Electrical and Electronic Engineering as a Senior Lecturer. His current research interests include image and signal processing, pattern recognition, computer vision, machine learning, smart grid, bio-medical and remote sensing applications and algorithms. He is a Senior Member of the IEEE. He is a recipient of the Sri Lanka President’s Award for Scientific Publications for 2018 and 2019. He is the recipient of multiple grants through the National Science Foundation (NSF) for research activities. His previous works have been published in IEEE-TGRS and several other IEEE-GRSS conferences including WHISPERS and IGARSS. He also has numerous publications in many other IEEE transactions, Elsevier and IET journals and is the recipient of multiple best paper awards from international conferences for his work. |
![[Uncaptioned image]](/html/2108.12665/assets/Figures/madhu.jpg) |
Terrence Madujith obtained his B.Sc. (Agriculture) from University of Peradeniya in 1994 and served as a food technologist at Lanka Canneries Ltd for a short period. Subsequently, he joined the Department of Food Science and Technology as a lecturer and proceeded to Canada to pursue higher studies. He received M.Sc. and Ph.D. in Food Science from Memorial University of Newfoundland, Canada. He was promoted to Professor in Food Science and Technology in 2015 and subsequently to the Chair Professor of Food Science and technology in 2019. He also serves as the Director of the Research Council of University of Peradeniya. His research interests include lipid chemistry, food safety and food microbiology. |