GASP XXXV: Characteristics of the diffuse ionised gas in gas-stripped galaxies
Abstract
The diffuse ionized gas (DIG) is an important component of the interstellar medium that can provide insights into the different physical processes affecting the gas in galaxies. We utilise optical IFU observations of 71 gas-stripped and control galaxies from the Gas Stripping Phenomena in galaxies (GASP) survey, to analyze the gas properties of the dense ionized gas and the DIG, such as metallicity, ionization parameter , and the difference between the measured and the value predicted by star-forming models, given the measured (). We compare these properties at different spatial scales, among galaxies at different gas-stripping stages, and between disks and tails of the stripped galaxies. The metallicity is similar between the dense gas and DIG at a given galactocentric radius. The is lower for DIG compared to dense gas. The median values of correlate best with stellar mass, and the most massive galaxies show an increase in toward their galactic centers. The DIG clearly shows higher values compared to the dense gas, with much of the spaxels having LIER/LINER like emission. The DIG regions in the tails of highly stripped galaxies show the highest , exhibit high values of and extend to large projected distances from star-forming areas (up to 10 kpc). We conclude that the DIG in the tails is at least partly ionized by a process other than star-formation, probably by mixing, shocks and accretion of inter-cluster and interstellar medium gas.
1 Introduction
The diffuse ionized gas (DIG) is a crucial but still poorly understood component of the interstellar medium (ISM) of galaxies. This gas phase is distributed across large spatial scales (up to few kpc compared to 50 pc scales of star-forming associations; Levy et al. 2019), with lower gas densities ( cm-3) and higher temperatures ( K) than H II regions111H II regions have temperatures of K and electron densities of (Hummer & Storey 1987, Scaife 2013). (Collins & Rand 2001, Reynolds et al. 2001, Haffner et al. 2009, Barnes et al. 2014 Della Bruna et al. 2020). Other defining characteristics of the DIG include lower surface brightness of the Balmer emission line H, higher [Sii]/H and [Nii]/H line ratios () compared to the HII regions (Reynolds 1984, Reynolds & Cox 1992, Martin 1997, Madsen et al. 2006, Tomičić et al. 2017, Kreckel et al. 2016, Kumari et al. 2019, Levy et al. 2019).
There is no consensus in the literature about what are the main sources of ionization in the DIG. The process is likely manifold, and a number of sources have been proposed. In highly star-forming galaxies, the DIG can be mostly ionized by photons escaping from H II regions (Reynolds & Cox 1992, Minter & Balser 1998, Haffner et al. 2009, Relaño et al. 2012). However, the picture is more complex in early-type galaxies or in the bulges of spirals. In early-type galaxies with detected emission lines, where the DIG usually comprises most of the ISM, photons from hot, low-mass evolved stars (HOLMES; Flores-Fajardo et al. 2011, Singh et al. 2013, Belfiore et al. 2017a, Zhang et al. 2017) can generally account for all of the observed emission (Cid Fernandes et al., 2011), with the rare exception of early-type galaxies undergoing rejuvenation events (Herpich et al., 2018; Werle et al., 2020), where H II regions may contribute to the ionizing field. Using data from the CALIFA survey (Calar Alto Legacy Integral Field Area), Lacerda et al. (2018) found ionization consistent with HOLMES also in spirals, especially at low galactocentric distance. Other possible sources include supernova shocks and turbulence (Slavin et al. 1993, Minter & Spangler 1997, Otte et al. 2002, Hoopes & Walterbos 2003), along with magnetic reconnection (Raymond 1992), collisional excitation from the electrons scattered from dust grains (Weingartner & Draine 2001) and cosmic rays (Barnes et al. 2014). Furthermore, some observations indicate that the emission line ratios and temperature typical of the DIG could be produced by a turbulent mixing of the different hot and cold layers occuring as an aftermath of the interaction of the intra-cluster medium (ICM) and ISM (Cowie & Songaila 1977, Slavin et al. 1993, Binette et al. 2009, Fumagalli et al. 2014, Fossati et al. 2016, Consolandi et al. 2017, Campitiello et al. 2021, Müller et al. 2021).
DIG contributes with a fraction of 20 % to 90 % of the total H flux in galaxy disks, with a mean fraction around (Hoopes & Walterbos 2003, Oey et al. 2007, Sanders et al. 2017, Tomičić et al. 2017, Poetrodjojo et al. 2019, Della Bruna et al. 2020, Tomičić et al. 2021). This large contribution may cause star-formation rates (SFRs) to be overestimated, as H flux from the DIG may be wrongly associated with star-formation. There is a debate about to what extent does the DIG affect measurements of the gas-phase metallicity and its radial slope (Searle 1971, Vila-Costas & Edmunds 1992, Sánchez et al. 2014, Belfiore et al. 2017b, Sanders et al. 2017, Sánchez-Menguiano et al. 2018, Zhang et al. 2017, Vale Asari et al. 2019, Kumari et al. 2019, Poetrodjojo et al. 2019), as some observations indicate lower metallicity (up to 1 dex) in the DIG compared to nearby H II regions. The DIG may also exhibit different values of line ratios and ionizing parameter , further affecting observations and analysis of ISM characteristics, as well as adding scatter in the distribution of galaxy properties measured from unresolved observations (Martin 1997, Flores-Fajardo et al. 2011, Dopita et al. 2014, Zhang et al. 2017, Poetrodjojo et al. 2018, Mingozzi et al. 2020). Furthermore, the detection of gas that shows different line ratios and ionization parameter located at large distances from H II regions — larger than the thickness of a typical galactic disk (1 kpc) — would indicate that sources other than star-forming (SF) regions are ionizing such gas (for example HOLMES, shocks, or mixing of different gas layers; Flores-Fajardo et al. 2011, Zhang et al. 2017, Poetrodjojo et al. 2018, Poggianti et al. 2019a). Different galactic characteristics (like mass, SFR, age, etc.) and external physical processes such as galaxy interactions and gas-stripping caused by ram pressure (Toomre & Toomre 1972, Gunn & Gott 1972), may affect ionization parameter and various line ratios (Nagao et al. 2006, Maier et al. 2006, Flores-Fajardo et al. 2011, Zhang et al. 2017, Sánchez 2020).
Recent developments in observational astrophysics, especially in the field of Integral Field Unit (IFU) spectroscopy, have helped to probe the physics of the ISM and DIG in galaxies with better spatial and spectral resolutions (Slavin et al. 1993, Weingartner & Draine (2001), Hoopes & Walterbos 2003, Binette et al. (2009), Bundy et al. 2015, Lacerda et al. 2018, Sánchez 2020, etc.). In particular, large IFU surveys such as MaNGA (Mapping Nearby Galaxies at Apache Point Observatory, Bundy et al. 2015) and CALIFA have allowed DIG studies in statistical samples that include a variety of galaxy types.
An IFU survey that stands out due to its sample selection is the GASP project (GAs Stripping Phenomena in galaxies with MUSE; Poggianti et al. 2017), based on Multi-Unit Spectroscopic Explorer (MUSE, Bacon et al. 2006) observations. GASP is a multi-wavelength survey that studies gas-stripping processes in 114 galaxies spanning the stellar mass range at redshift in clusters (from the WINGS and OMEGAWINGS surveys; Fasano et al. 2006, Gullieuszik et al. 2015) and the field (from the PM2GC catalog; Calvi et al. 2011). The project targets galaxies in a variety of environments (isolated, in filaments, groups and clusters, in junctions of the cosmic web; Poggianti et al. 2017; Vulcani et al. 2021) that are subject to different levels of ram-pressure stripping, galactic interaction and evolution. All of these characteristics make GASP the ideal dataset for studying star-formation and DIG in ram-pressure stripped tails and provide insights on how (and to what extent) the DIG properties are shaped by the physical processes that drive galaxy evolution.
In Tomičić et al. (2021) (hereafter GASP XXXII), we have focused on measuring the fraction of flux associated with the DIG (hereafter CDIG) in 71 GASP galaxies. In this paper, we aim to further analyze the properties of the dense gas and DIG in this galaxy sample (Sec. 2). First, we will analyze , defined here as the ratio of the hydrogen-ionizing photon density over the local hydrogen gas density, and defined here as the horizontal distance of the values from the BPT- line (Kewley et al. 2006) that separates SF and LINER/LIER regions (Sec. 2). We will use both spaxel-by-spaxel (Sec. 3.2) and integrated data (Sec. 3.5, and 3.6) of the galaxies. Second, following the results by Zhang et al. (2017), we aim to test if the gas-phase metallicity differs between the dense gas and the DIG at a specific galactocentric radius (Sec. 3.4). Third, we will compare the properties of the dense gas and the DIG in the disk and the tails in order to understand whether ram-pressure stripping affects their properties. Furthermore, we will check if the distance from SF regions affects variation in the line ratios, as a result of DIG begin ionised by other sources than SF regions (Sec. 3.3). The discussion of the results and our conclusions are written in Sec. 4 and 5, respectively.
In this paper we adopted standard cosmological constants of H km, , , and the initial mass function (IMF) from Chabrier (2003).
2 Data
2.1 Galaxy sample
For this paper, as in Vulcani et al. 2018a, we consider galaxies with gas-stripping features (hereafter referred to as stripping galaxies) and compare them to undisturbed galaxies that do not show any sign of interactions or gas-stripping on their H maps (referred to as control sample galaxies). Galaxies that are tidally interacting with others, or merging, or lopsided, or cosmic web enhanced, etc. are not included in this paper (Vulcani et al. 2017, Vulcani et al. 2018b, Vulcani et al. 2018c, Vulcani et al. 2019a, Vulcani et al. 2020, Vulcani et al. 2021).
For each galaxy, Poggianti et al. in prep have designated a specific number indicating a stage of stripping, referred here as J stage number (Tab. 1). The J stage numbers classify non-stripped galaxies with 0, galaxies in early stage of stripping with 0.5, clear gas-stripped galaxies and jellyfishes with 1 and 2, respectively, galaxies with a truncated disk are assigned a J stage number of 3. The truncated galaxies are galaxies where the gas disk was mostly stripped, except in the galactic center (Koopmann & Kenney 2004, Fritz et al. 2017). We will use this classification in this paper to compare galaxies at different stripping phases.
| J stage | Explanation | Number of galaxies |
|---|---|---|
| 0 | non-stripped, control galaxies | 30 |
| 0.5 | early stage of stripping | 10 |
| 1 | clear gas-stripped galaxies | 11 |
| 2 | jellyfish galaxies | 16 |
| 3 | truncated galaxies | 4 |
Both, stripping and control samples are drawn from Vulcani et al. (2018a), with some modifications. The stripping sample is composed of 41 galaxies. With respect to Vulcani et al. (2018a), we exclude JO149 and JO95, since we are not able to measure their effective galactocentric radii and orientation (Franchetto et al. 2020). Furthermore, we add JO93 (a member of the control sample in Vulcani et al. 2018a) because its H map indicates an initial phase of stripping.
The control sample includes 30 galaxies, 16 of which are cluster members and 14 are field galaxies. With respect to Vulcani et al. (2018a), we exclude P19482, as Vulcani et al. (2019b) showed that the galaxy is not undisturbed but undergoing cosmic web enhancement. The control sample galaxies by definition have no tails.
2.2 Observations, line maps, and galaxy orientation
The galaxies were observed by MUSE, an IFU at ESO-VLT (the Very Large Telescope of the European Southern Observatory), covering the optical range of Å. The data analysis of the observed cubes follows established procedures described in Poggianti et al. (2017). Briefly, the observed spectrum in each spaxel of the cube was corrected for the effect of foreground dust extinction of the Milky Way, with corresponding values for each galaxy in the line of sight (LOS) on sky measured by Schlegel et al. (1998), considering the recalibration introduced by Schlafly & Finkbeiner (2011), and assuming the extinction curve of Cardelli et al. (1989) with . To account for seeing effects, the data were smoothed and convolved in the spatial dimension using a pixel kernel, which corresponds to 1 arcsec, or kpc, depending on the galaxy’s redshift.
The convolved cubes were analyzed with the spectrophotometric code SINOPSIS (Fritz et al. 2017) to fit the stellar component of the spectra, and then with KUBEVIZ (Fossati et al. 2016) to fit the gas emission lines in the stellar-continuum subtracted spectra. The emission lines used in this work are: , , (referred hereafter as ), , , and (referred hereafter as ).
Maps of surface brightness corrected for attenuation, labeled as , were calculated assuming the intrinsic Balmer line ratio , ionized gas temperature of K and case B recombination (Hummer & Storey 1987, Osterbrock & Martel 1992). We applied a cut in signal-to-noise 4 for all emission lines in our analysis and for our results.
The boundaries of stellar disks were estimated using an isophote in the continuum maps that is 1 above the average sky background noise, and the center of the galaxies is designated to be the centroid of the brightest central region in the continuum map (Gullieuszik et al. 2020). We define the spaxels (with the ionized gas emission) outside the stellar disks as part of galactic tails. The disk inclination with respect to the line of sight and the disk diameter were estimated by Franchetto et al. (2020) from the I-band images obtained by convolving the MUSE datacube spectra.
It is important to note that a clear separation between DIG and H II regions requires a resolution that is not achieved by our observations. Thus we can only probe regions where H II complexes and DIG are mixed together in the line of sight, and measure DIG emission fraction instead. Therefore, in this paper we use the terms “dense gas” and DIG, not H II regions and DIG.
2.3 Metallicity, ionization parameter and
Two of the main quantities of interest in our analysis are the gas-phase metallicity and ionization parameter. These quantities were derived from the emission line ratios, / vs. /, using the PYQZ code (v0.8.2 version, Dopita et al. 2013, Vogt et al. 2015). We assume solar metallicity to be . Details on how we estimate the gas-phase metallicity and for the GASP sample are described by Franchetto et al. (2020). is defined as the logarithm of the ratio of the hydrogen-ionizing photon density (in ) over the local hydrogen gas density (in ) multiplied by the speed of light (Kewley et al. 2006, Nagao et al. 2006, Kewley et al. 2019). Since it measures the ratio of ionization intensity and gas density, it may be used as an indication for the ratio of radiation and gas pressures (Yeh & Matzner 2012). We note that PYQZ uses photo-ionization models of line ratios that assume ionization with photons from SF regions.
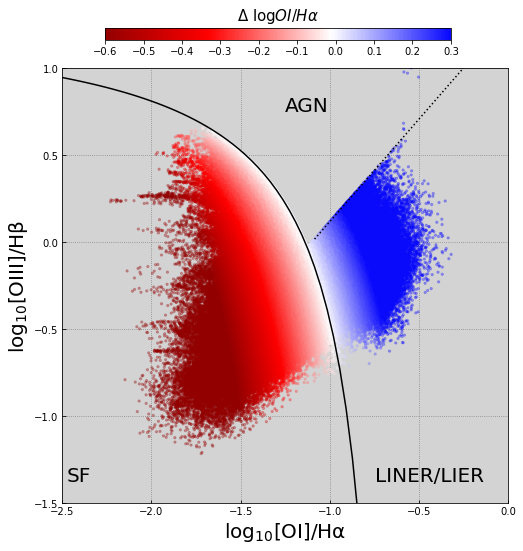
The Baldwin, Phillips & Terlevich diagnostic diagrams (BPT; Baldwin et al. 1981, Kewley et al. 2006) of emission line ratios are used to infer the dominating ionization mechanism, such as SF, AGN, or LINER222Low ionization Nuclear Emission Regions (Heckman & Balick 1980)./LIER333Low ionization Emission Regions (Belfiore et al. 2016).. In this work, we only use the BPT diagram based on line (hereafter BPT-, shown in Fig. 1), and we removed spaxels dominated by AGN ionization. The line ratio is sensitive to the hardness of the ionizing radiation field (Kewley et al. 2006), and LINER/LIER-like spaxels may potentially indicate that the origin of ionization across the galaxy disks and tails can be other than SF regions.
To quantify the difference in ionization source and variation in gas emission among the galaxies, for each spaxel we measure the difference between the measured and the corresponding value on the BPT- line that separates the SF and LINER/LIER region,444This line was computed as an upper limit of the theoretical pure stellar photoionization models in the star-burst case (Kewley et al. 2001, Kewley et al. 2006). at the measured [Oiii]/H. This value is called and is shown in Fig. 1. Negative values represent regions defined as SF, while positive values represent LINER/LIER like regions. We note that negative does not necessarily mean that the ionization is coming only from SF regions, but that these account for the largest fraction. Similarly, LINER/LIER like regions do not exclude a possibility of partial ionization by star-formation. The individual BPT diagrams of spatially resolved data for 16 GASP galaxies were shown by Poggianti et al. (2019b).
2.4 Fraction of the diffuse ionized gas
In GASP XXXII, we estimated the fraction of H emission coming from DIG for all 71 galaxies studied in this work. The initial assumption was that the DIG exhibits lower flux surface density () and higher [Sii]/H line ratio than the dense gas (Blanc et al., 2009; Kaplan et al., 2016). We account for the radial gas-phase metallicity distribution across the galaxy, where we divided the ratio by the gas metallicity value at each given radial bin. Then we fitted the spaxel by spaxel anti-correlation between ratio and the extinction corrected , for each individual galaxy. For this fitting, we designated the spaxels with the highest ratio and lowest to have , while the data with the highest were assumed to have low fraction. We then derived the relation between the DIG fraction and , and created maps of CDIG from the maps. Further details of the method can be found in GASP XXXII.
In principle, considering metallicity as a parameter in our method to estimate CDIG could introduce a bias in our analysis of CDIG vs. metallicity. However, at a given radius, metallicity correction affects [Sii]/H of dense gas and DIG spaxels equally, thus not changing the slope of the spaxel by spaxel anti-correlation in the diagrams. Furthermore, our method uses both [Sii]/H and H, thus mitigating strong effects of metallicity on CDIG and lowering the scatter of the data. Thus, the CDIG values in spaxels at similar radii are not significantly affected by variations in metallicity.
In what follows, to clearly contrast regions whose emission is generated by different mechanisms, we will consider dense gas dominated spaxels those with , DIG dominated spaxels those with , and disregard the spaxels with intermediate values.
3 Results
In this section we will investigate galaxy metallicity, and across our galaxy sample. We will first consider spatially resolved (i.e. spaxel-by-spaxel) scales, and then the values at larger spatial scales (radial trends and integrated values). Furthermore, we will compare i) regions dominated by dense gas emission with those dominated by DIG emission, ii) disks and tails of galaxies, iii) different stages of stripping (J stage) in the stripping sample. Lastly, we will investigate trends of and with integrated values such as stellar mass, SFR, and metallicity measured at the effective radius. Only spaxels ionized by SF processes (according to BPT-[Oi]) are considered when the metallicity and log(q) are analyzed and displayed (spaxel-by-spaxel or integrated values).
3.1 Maps of galaxies
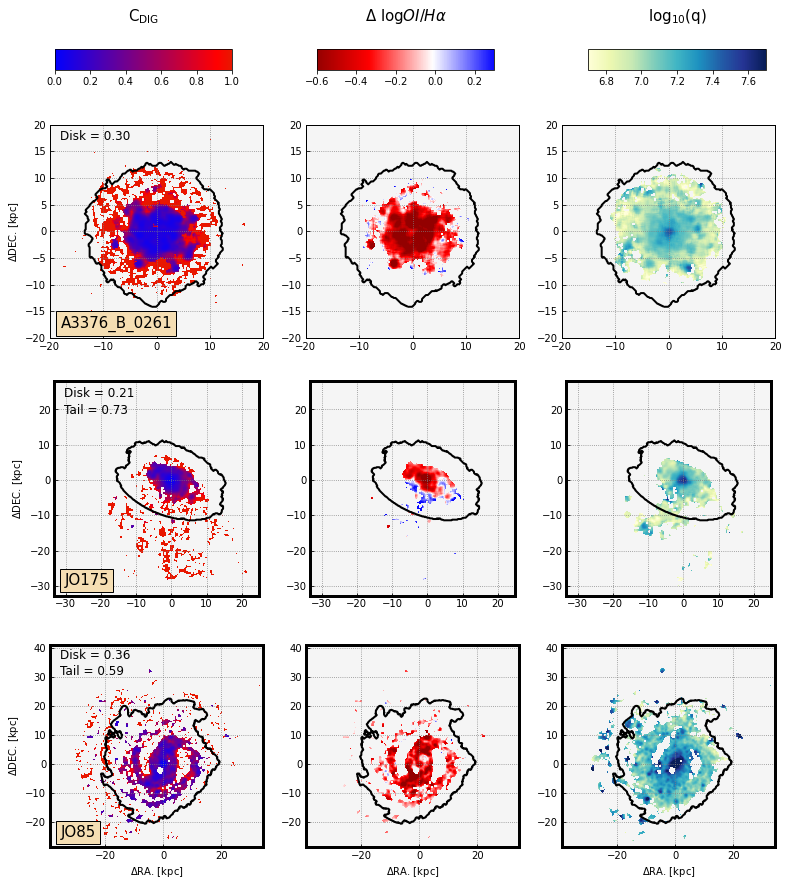
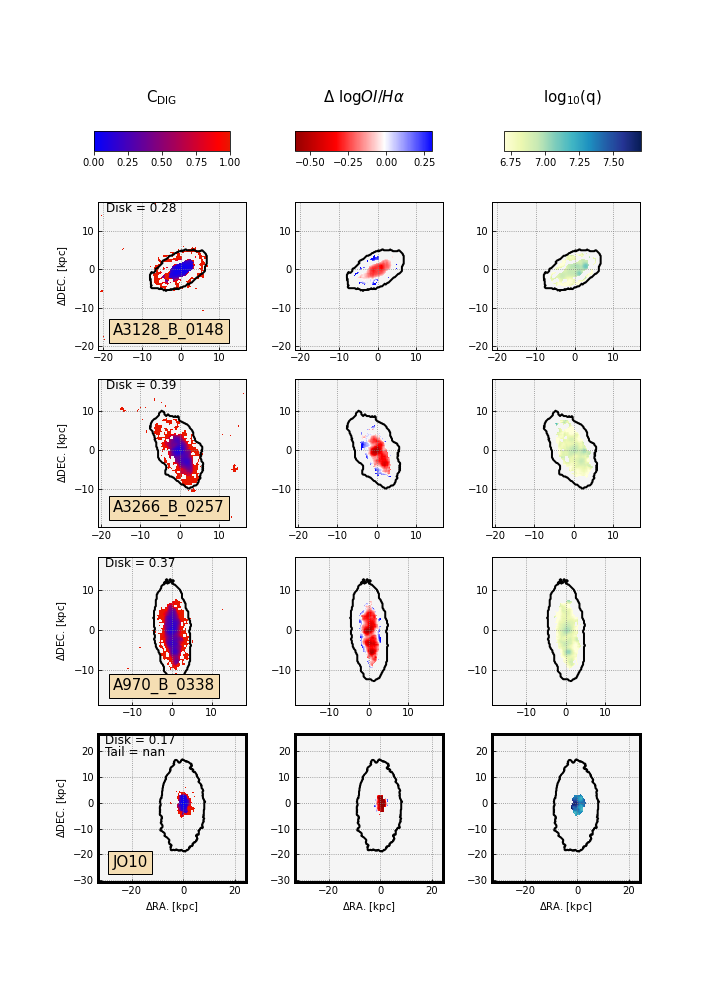
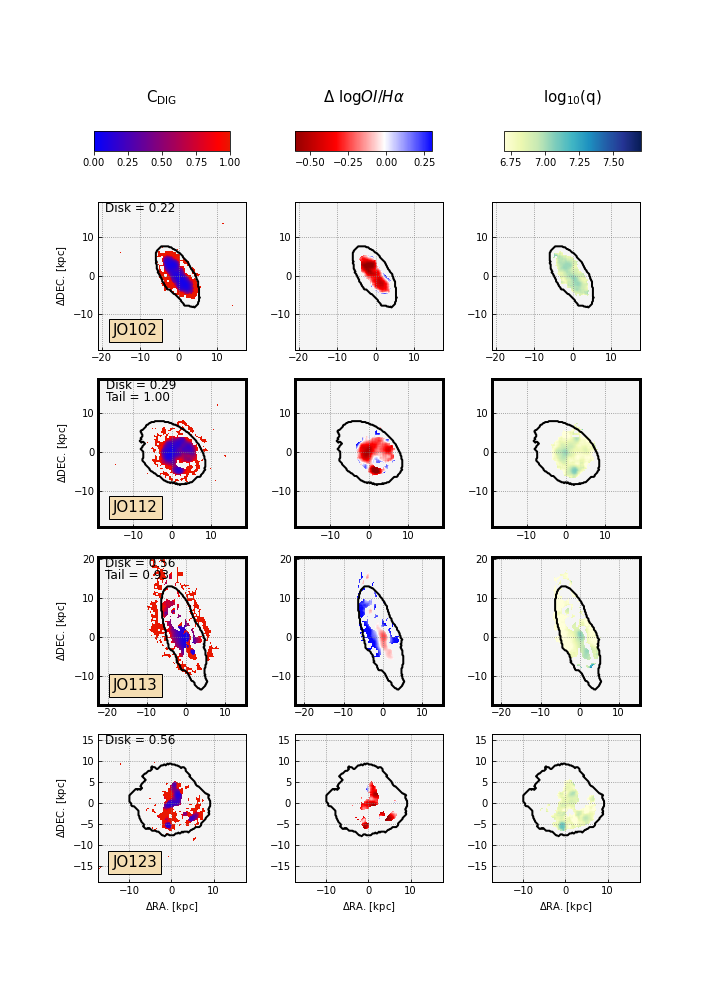
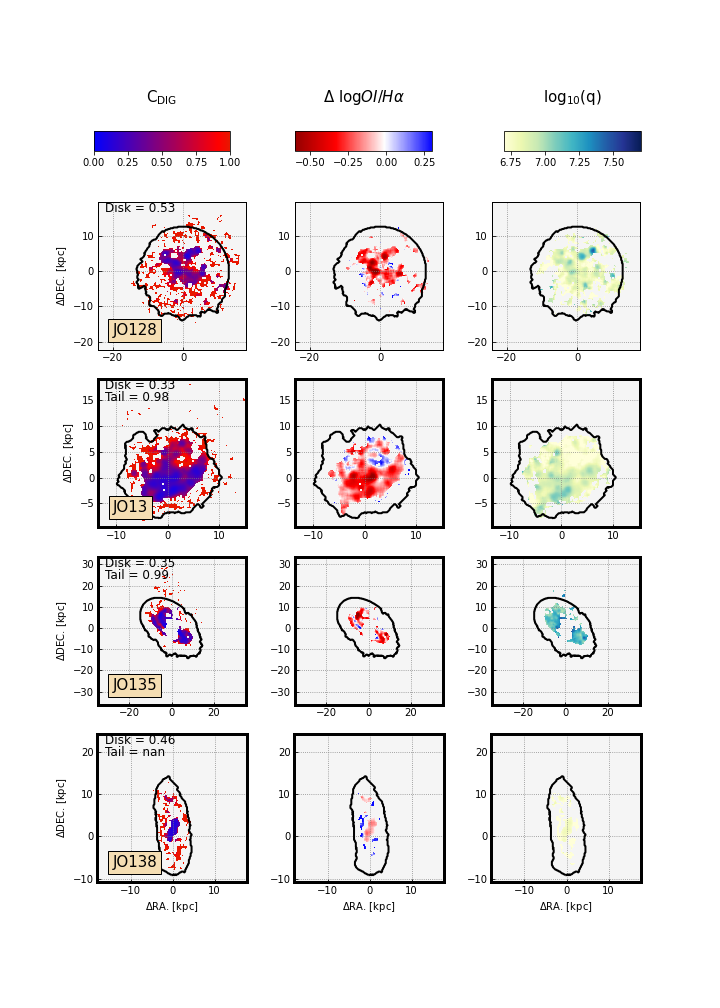
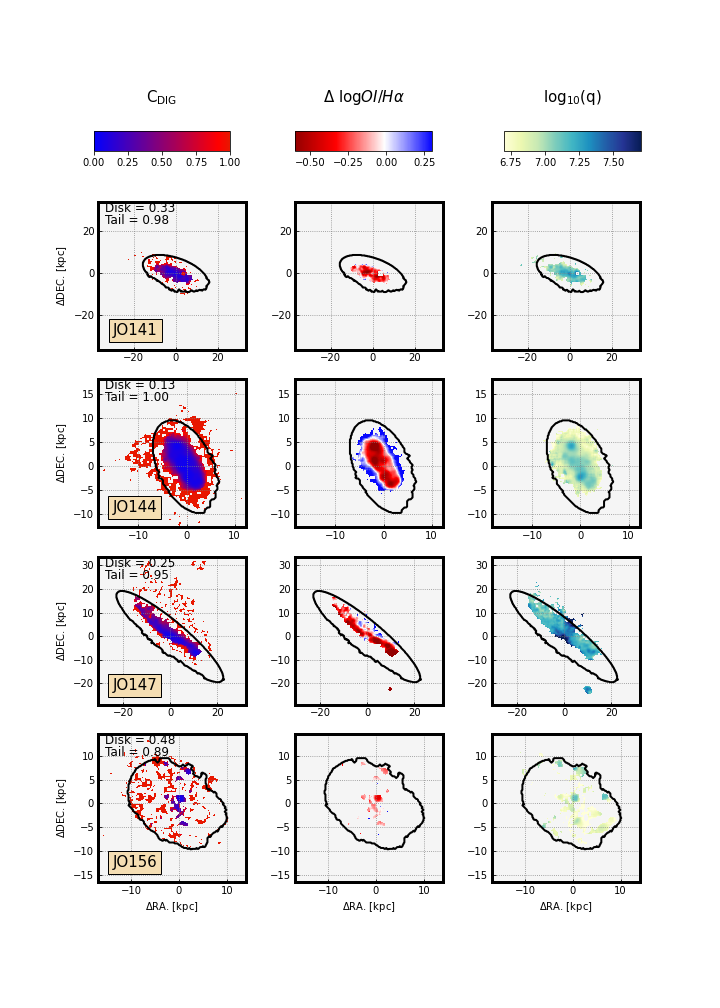
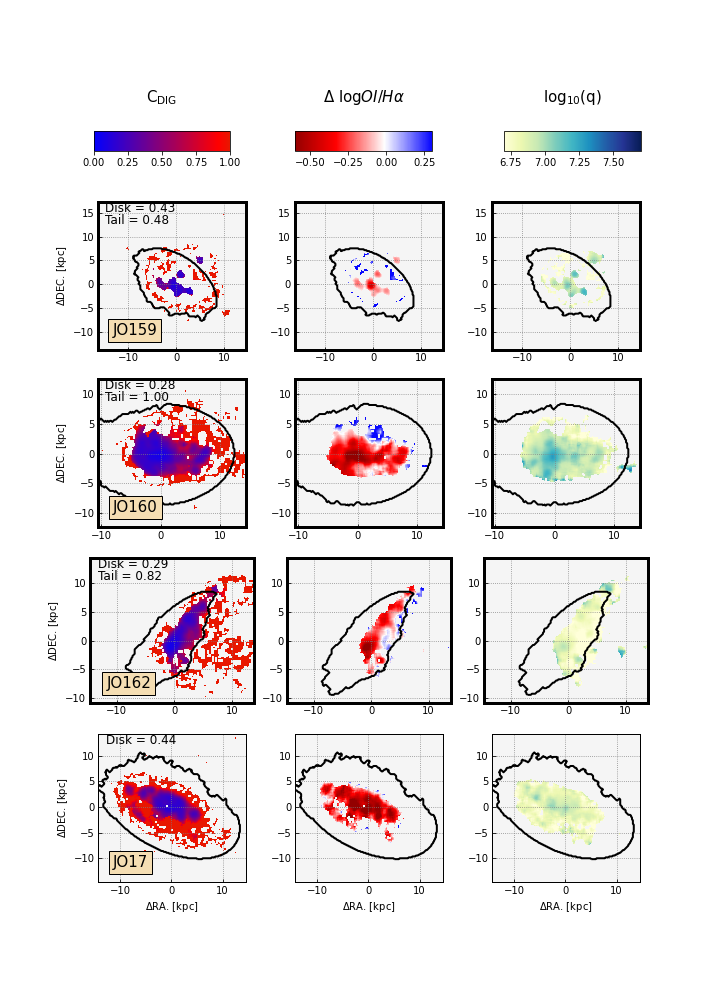
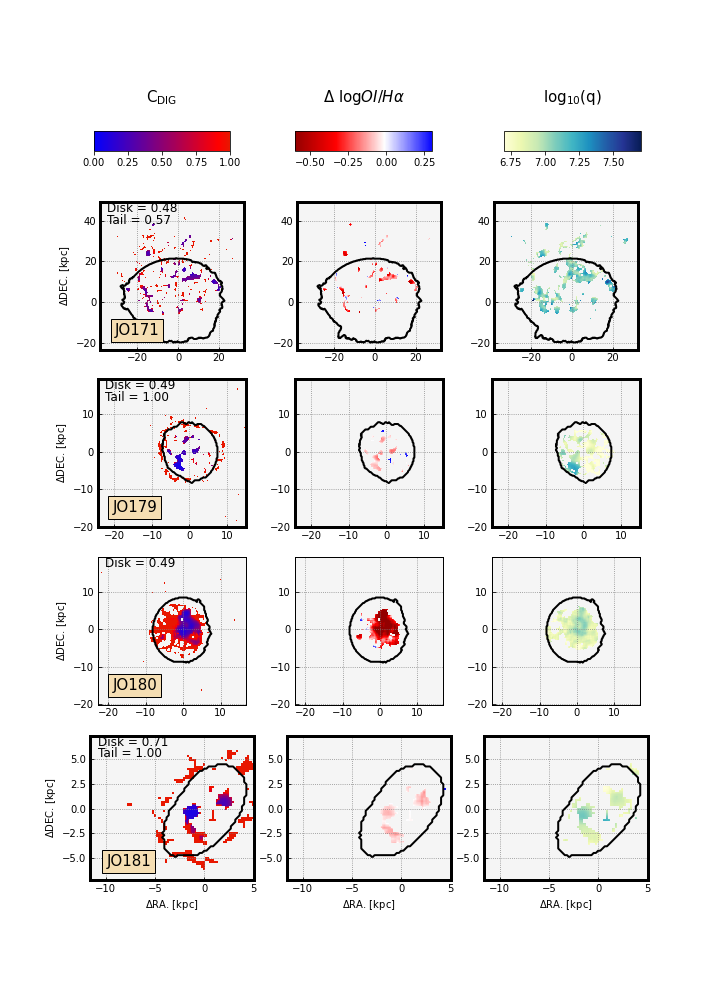
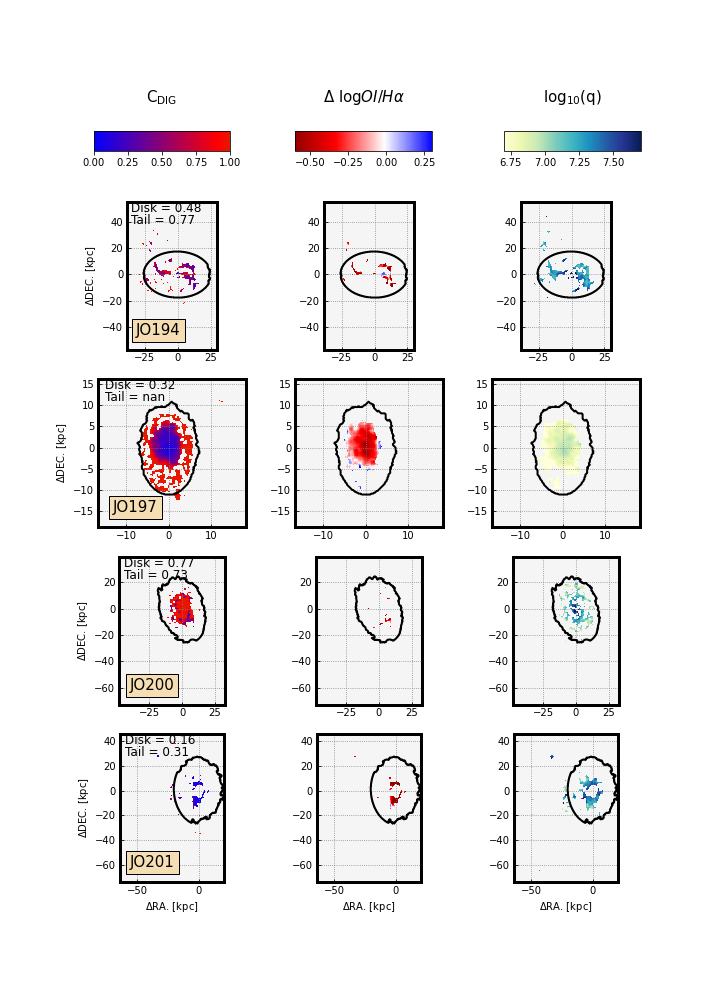
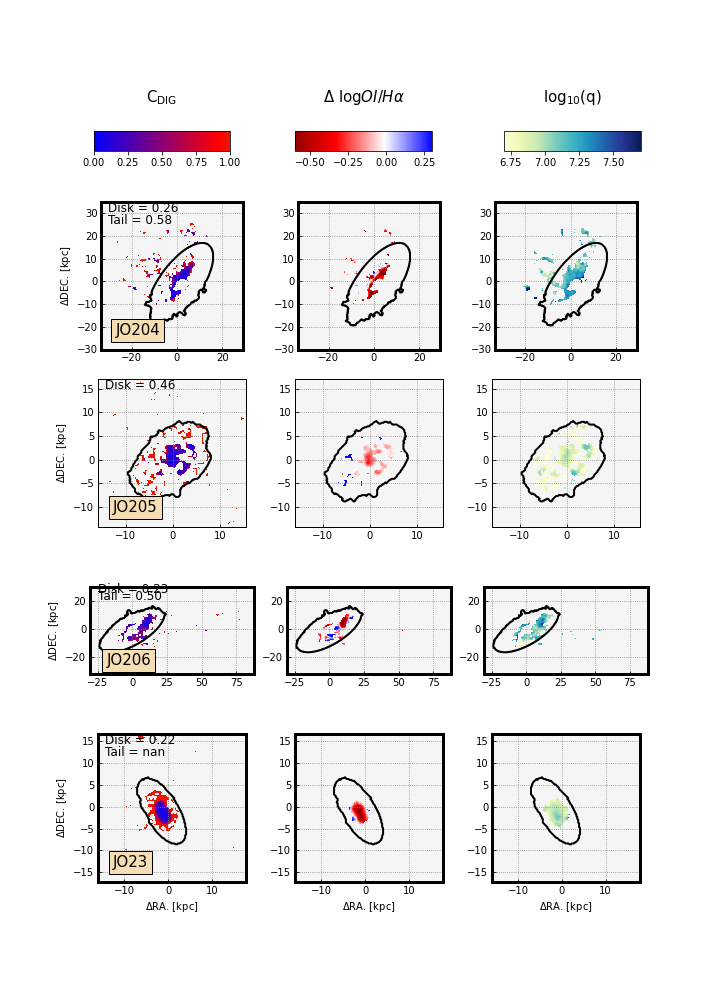
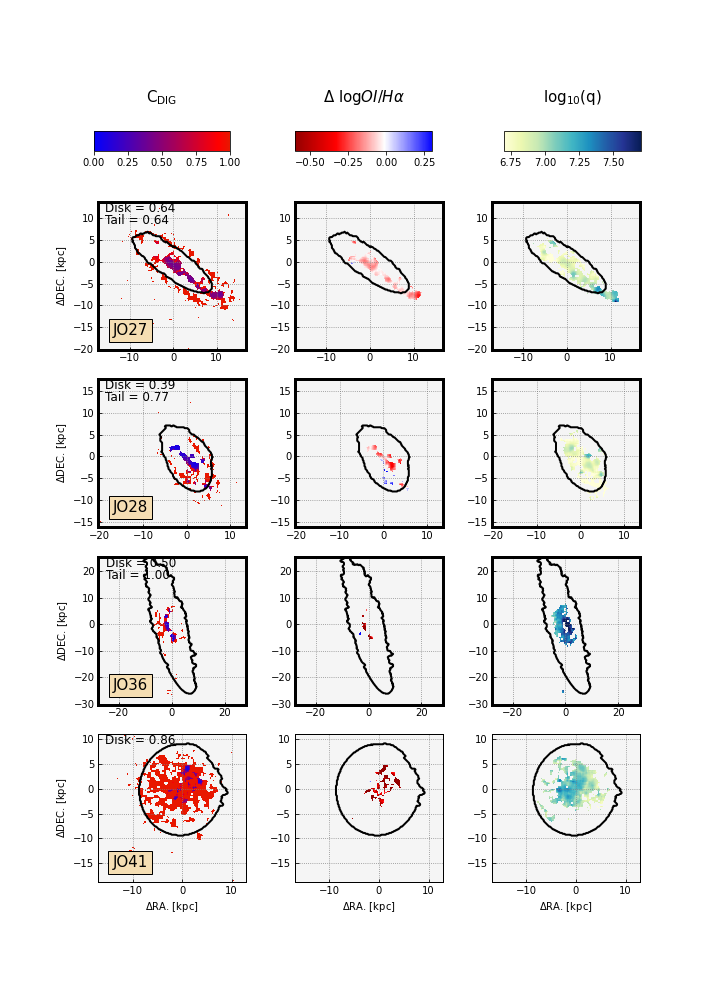
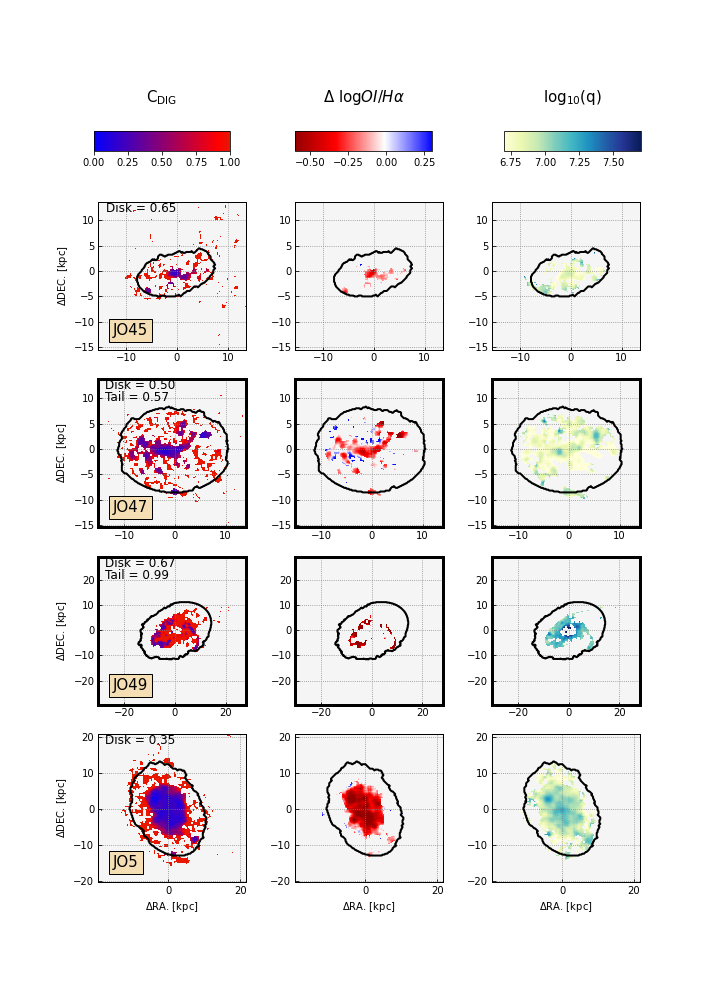
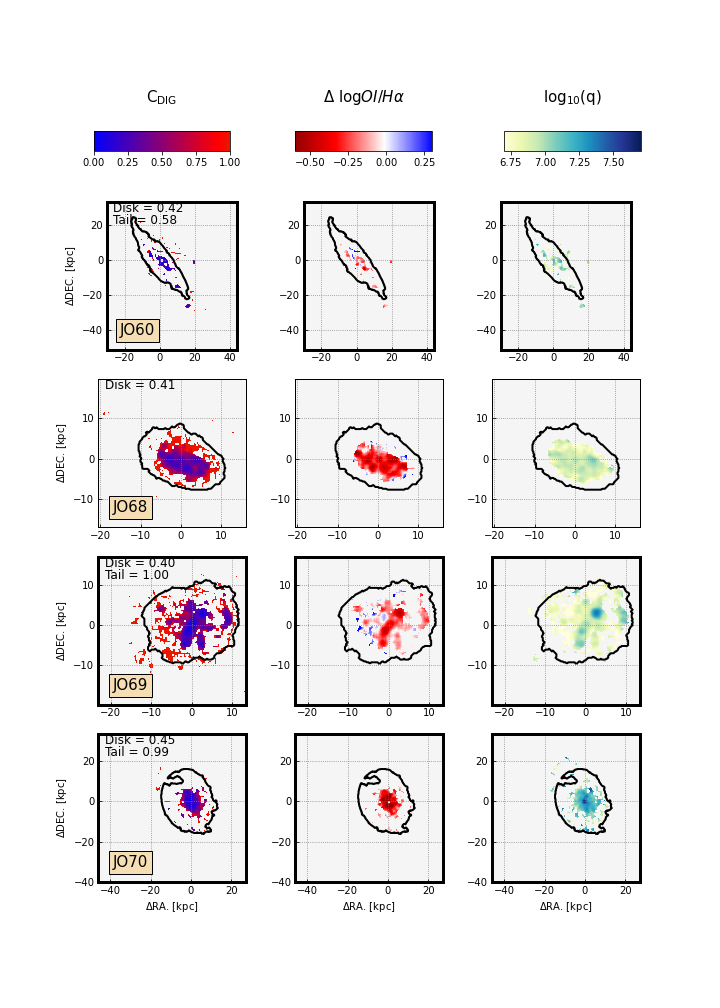
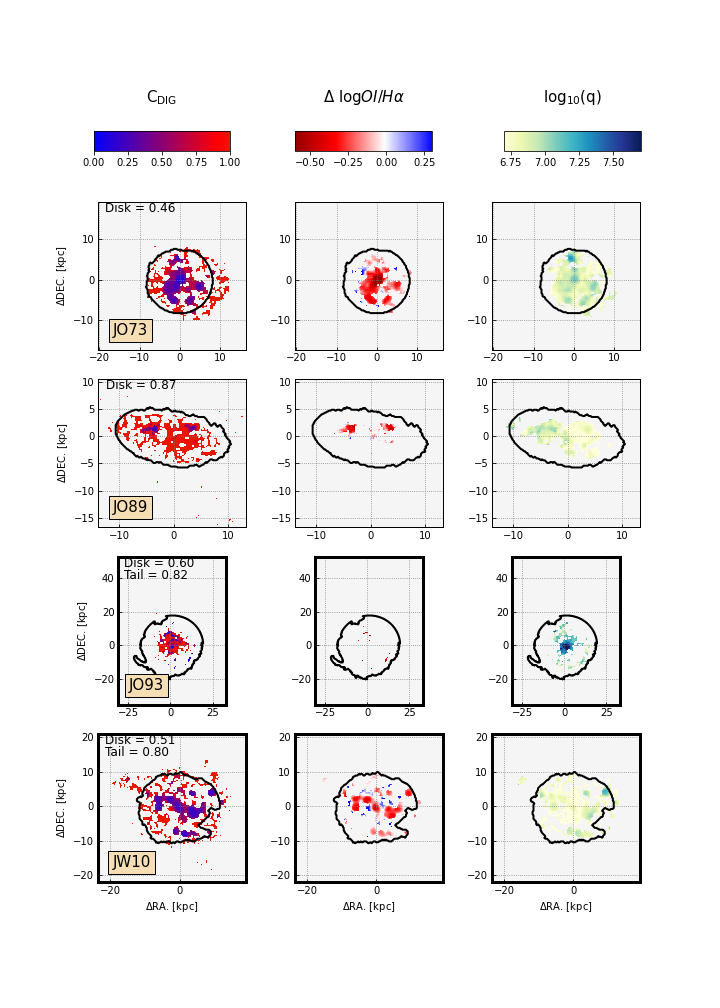
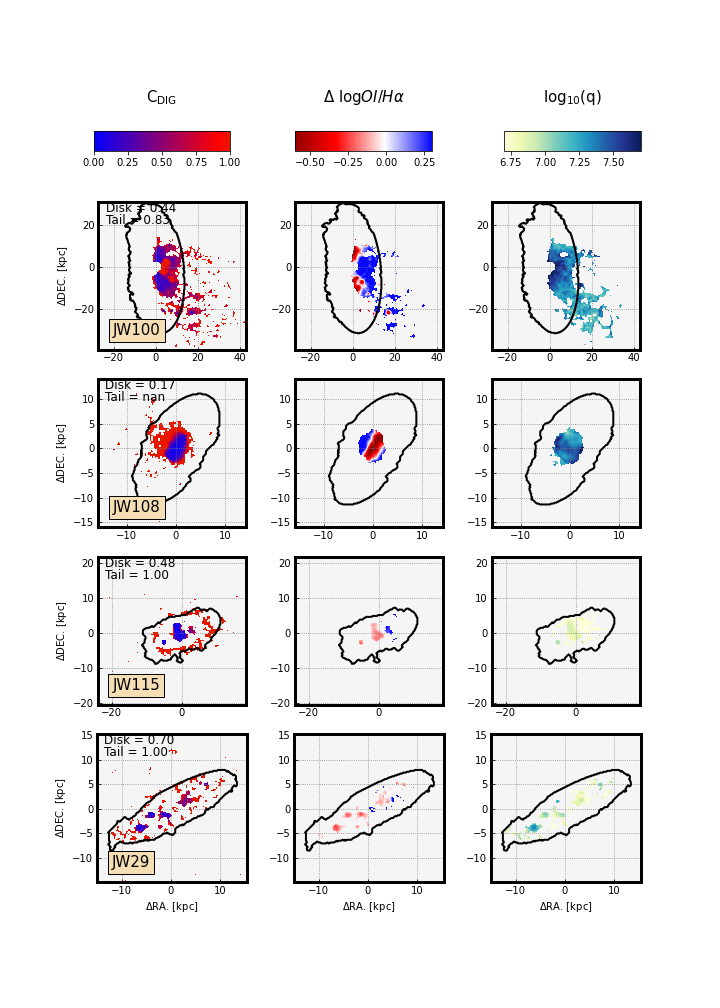
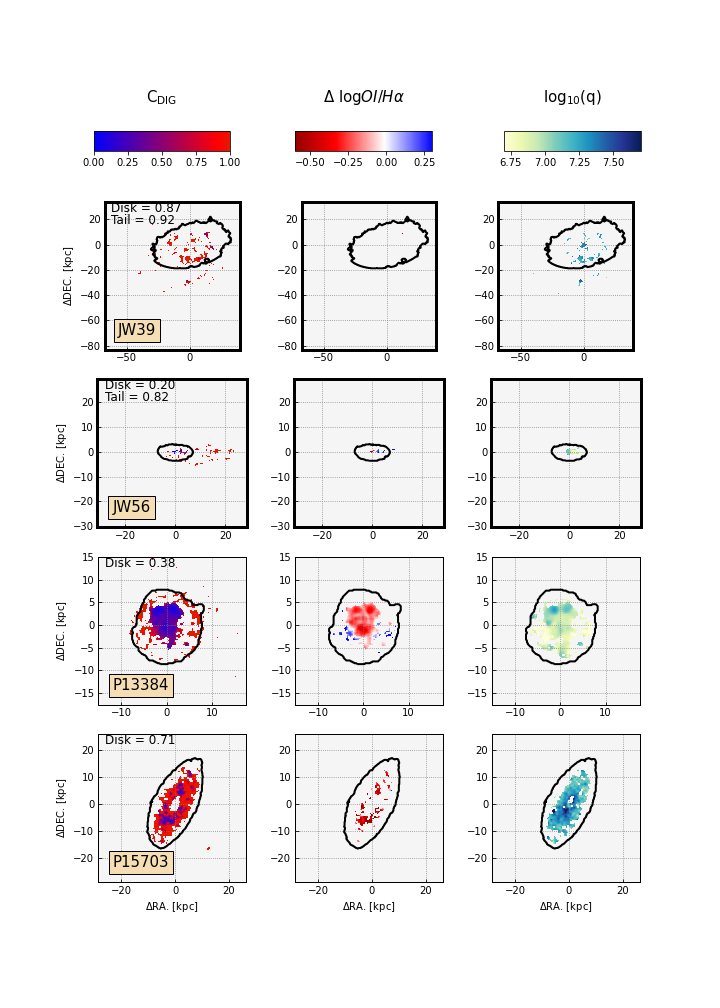
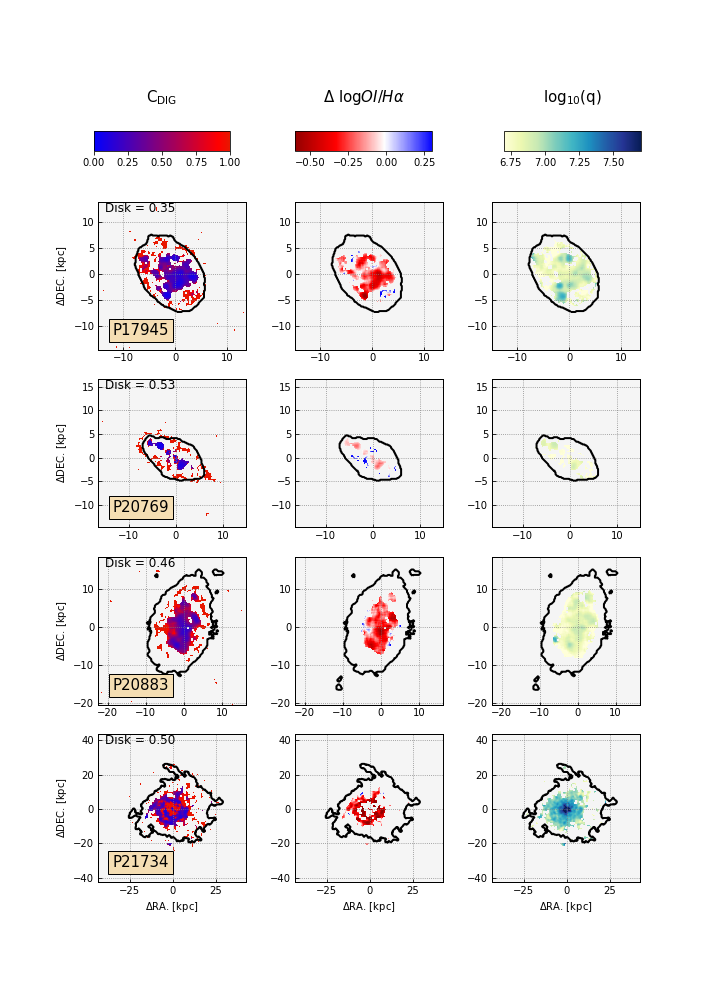
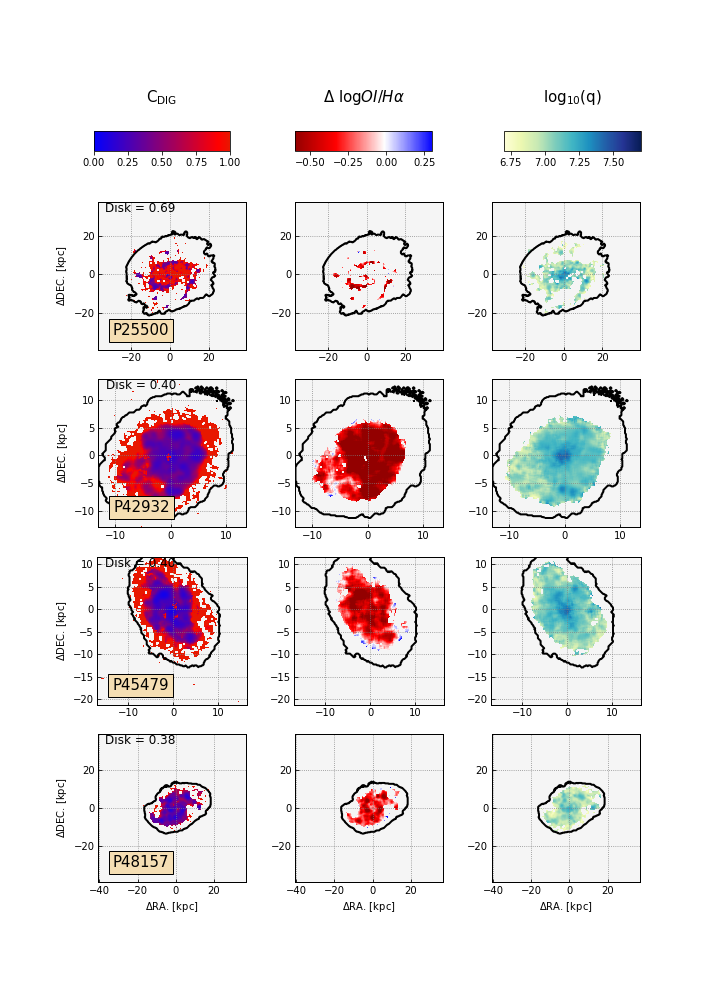
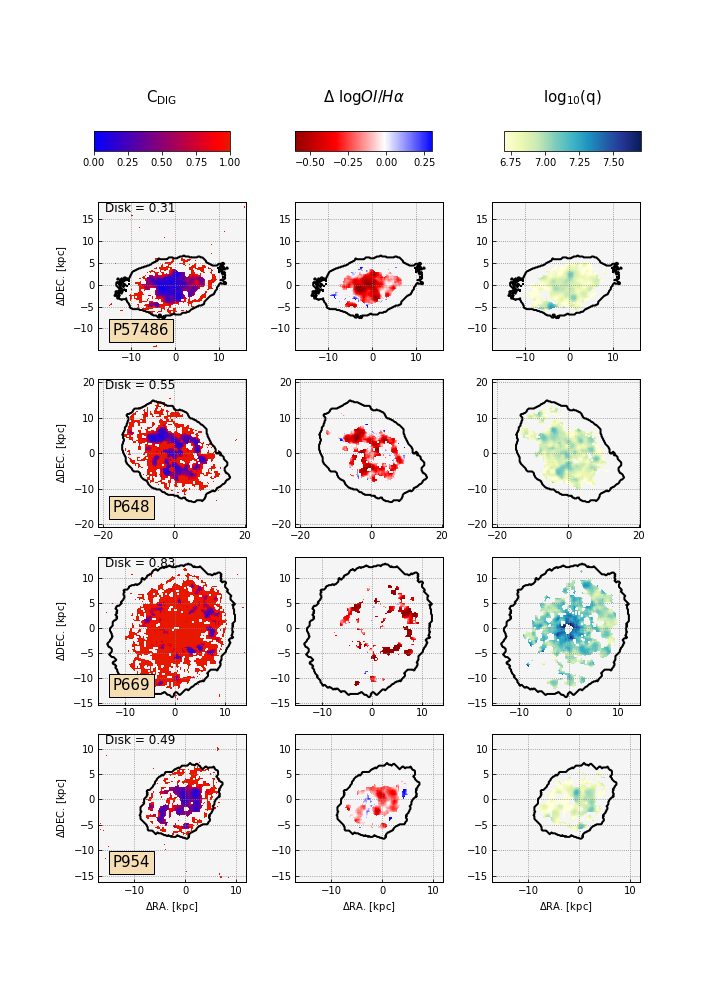
We present the maps of , and values for control () and stripped galaxies (JO175, JO85) in Fig. 2, and all other galaxies in Appendix A. We indicate the control and stripped sample with thin and thick line edges of panels, respectively. We will further quantify the trends of and as a function of galactocentric radius in Sec. 3.4.
The maps of (left panels of Fig. 2 and the figures Appendix) reveal some interesting trends: in most cases, the dense gas is confined to the galaxy’s core and spiral arms, and the DIG emission is preferentially found between the arms, in the galaxy’s outskirts, and tails of stripped galaxies. The maps are lacking values (middle panels) in many spaxels compared to map due to a low of emission line.
Comparing the maps of and those of and , we recover a tendency for the dense gas emission dominated areas to have higher ionization parameter and lower than the DIG dominated areas. Moving from galaxy cores to the outskirts and tails, the incidence of LINER/LIER like spaxels (higher values) increases and decreases.
3.2 Spaxel-by-spaxel comparison
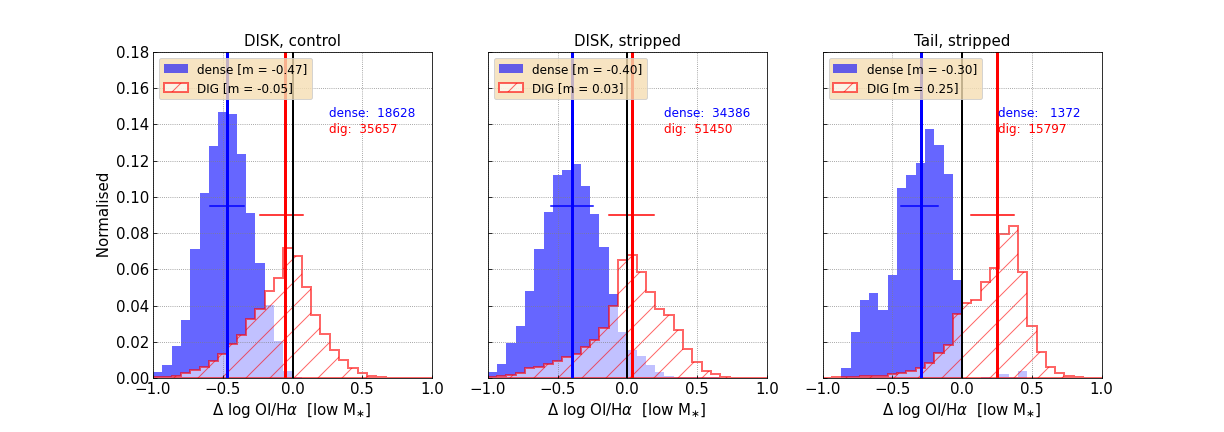
Figure 3 compares the spatially resolved for dense gas dominated spaxels (blue, filled histograms) and DIG dominated spaxels (red, hatched histogram), for different regions (disks and tails) of the control and stripped galaxies. We remind readers that control sample galaxies have no tails by definition. The median values of the corresponding distributions are represented by the blue and red vertical lines for the dense gas and DIG dominated spaxels, respectively.
While the dense gas in disks of the control galaxies shows median , disks and tails of the stripped galaxies have median of and respectively. In general, the DIG dominated spaxels have dex higher median than dense gas areas. The DIG spaxels in the disks show more LINER like spaxels (approximately half of spaxels), while the stripped tails show majority (83%) of spaxels with positive .
3.3 and the distance from SF regions
In star-forming galaxies, the DIG can reach scale-heights of kpc (Reynolds 1984, Haffner et al. 2009, Bocchio et al. 2016, Tomičić et al. 2017), larger than the thickness of their stellar disks (up to a few hundreds of pc), favoring the hypothesis that it could require ionization by sources other than star-formation (i.e. older stellar populations, or mixing of ISM and ICM). Detecting the DIG at large distances from SF regions would validate that hypothesis.
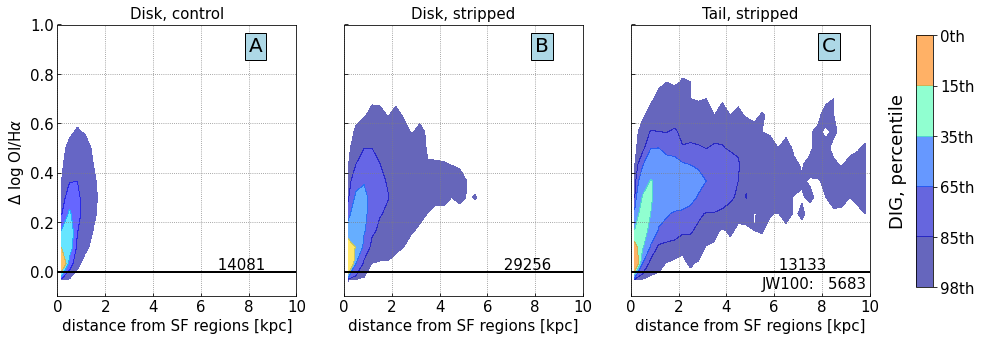
In this section we consider only the DIG dominated spaxels and characterize their projected distance555Due to the uncertainty of projections of lengths, this measured distance is a lower limit. from SF regions (designated by BPT- diagram). For each individual non-SF spaxel, we measure the mean distance from the closest 10 SF spaxels. Fig. 4 presents values of spaxels in all galaxies as a function of the projected distance from the SF spaxels.
As in Fig. 3, we show data for different types of galaxies (control vs. stripped), their different parts (disks vs. tails). In general, we notice a positive trend between and distance. In the stripped tails and in some parts of the stripped galaxies disks, there are regions that span large distances from the SF spaxels (2 kpc, and up to 10 kpc), and which have a mean value of . These spaxels, which exhibit high and are distant from the SF regions, correspond to highly stripped galaxies (JO93, JW100, JO204, JO194, JO147, JO85, JO60, JO27), of which the edge-on JW100 with its long tail contributes the most (approximately half of those spaxels).
From these results, we conclude that the DIG in stripped galaxies extends to very large distances from SF regions, which would make its ionization by SF regions alone less probable.
3.4 Comparing DIG and dense gas properties at different galactocentric radii
Next, we test if regions dominated by the DIG and dense gas emission in disks of both control and stripped galaxies are also characterized by different values of gas-phase metallicity, , and , at each given galactocentric distance.
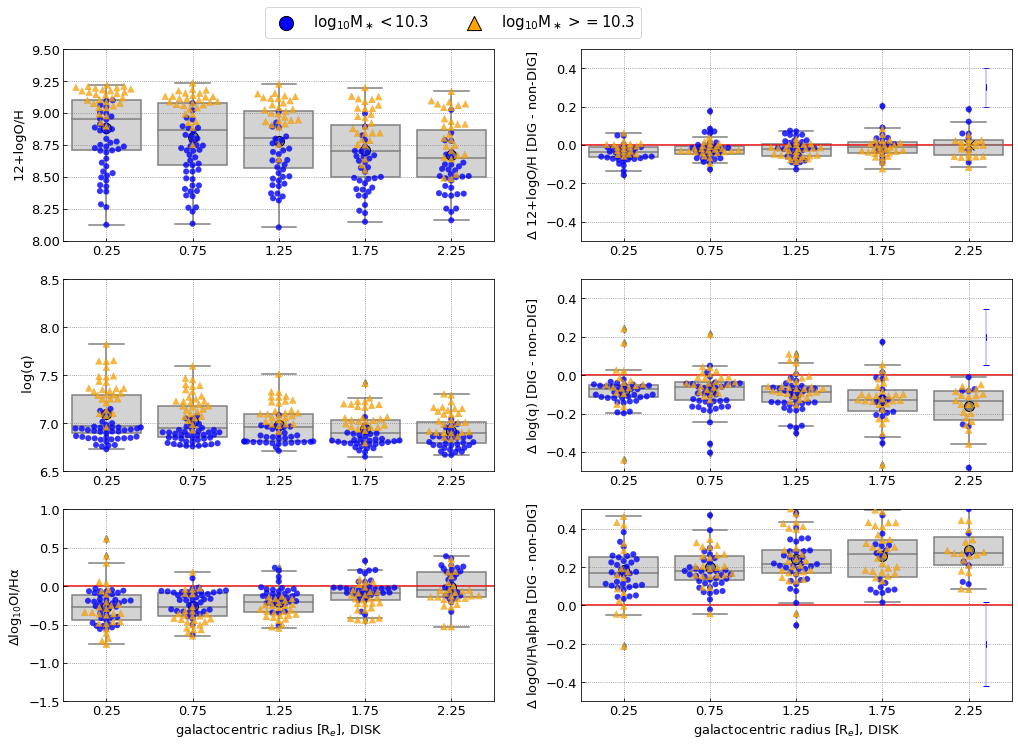
We divided the spaxels into annuli of different deprojected galactocentric radii (normalized by the effective radius of the disk; Franchetto et al. 2020). In each radial annulus, we measured the median of all quantities, as well as differences between median values of the DIG and dense gas dominated spaxels. We present in Fig. 5 the absolute values (left panels) and the differences between median values of dense gas and DIG (right panels) as a function of radial annuli. The figure shows each galaxy separately as a data point, color-coded by its stellar mass (blue for , and orange for ).
For the gas-phase metallicity (upper panels), the absolute values decrease with radius, as expected from the fact that metallicity gradients are negative for the great majority of galaxies (Mingozzi et al. 2020, A. Franchetto et al. submitted). The low-mass galaxies have lower metallicities, following the known mass-metallicity relation (Franchetto et al., 2020). A small difference ( dex) between the DIG and dense gas dominated spaxels is detected, but no variation of this difference with galactocentric radius is found. The scatter of the data ( dex) and the uncertainty of individual data points ( dex) are larger than difference in metallicities between dense gas and DIG.
The ionization parameter (middle panels) does not show a clear trend with radius for the low-mass galaxies, but shows a clear decrease with radius for the high-mass galaxies. The difference in between DIG and dense gas areas shows a negative offset, with DIG data having dex lower values. Furthermore, the offset between DIG and dense gas increases with galactocentric radius.
Mean absolute values of (bottom panels) increase with radius for galaxies of all masses by dex. At a given radius, the high-mass galaxies tend to have slightly lower values compared to the low-mass galaxies. The offset in indicates that the DIG dominated regions have dex higher values compared to the dense gas dominated regions, and the mean value of this difference increases with radius.
These results indicate that metallicity is not affected by the DIG fraction. The median of total gas increases in the centers of high-mass galaxies, with DIG fraction playing a small role on . The median of total gas is increasing toward the edges of all galaxies, with DIG fraction potentially playing an important role.
3.5 Galaxy integrated values
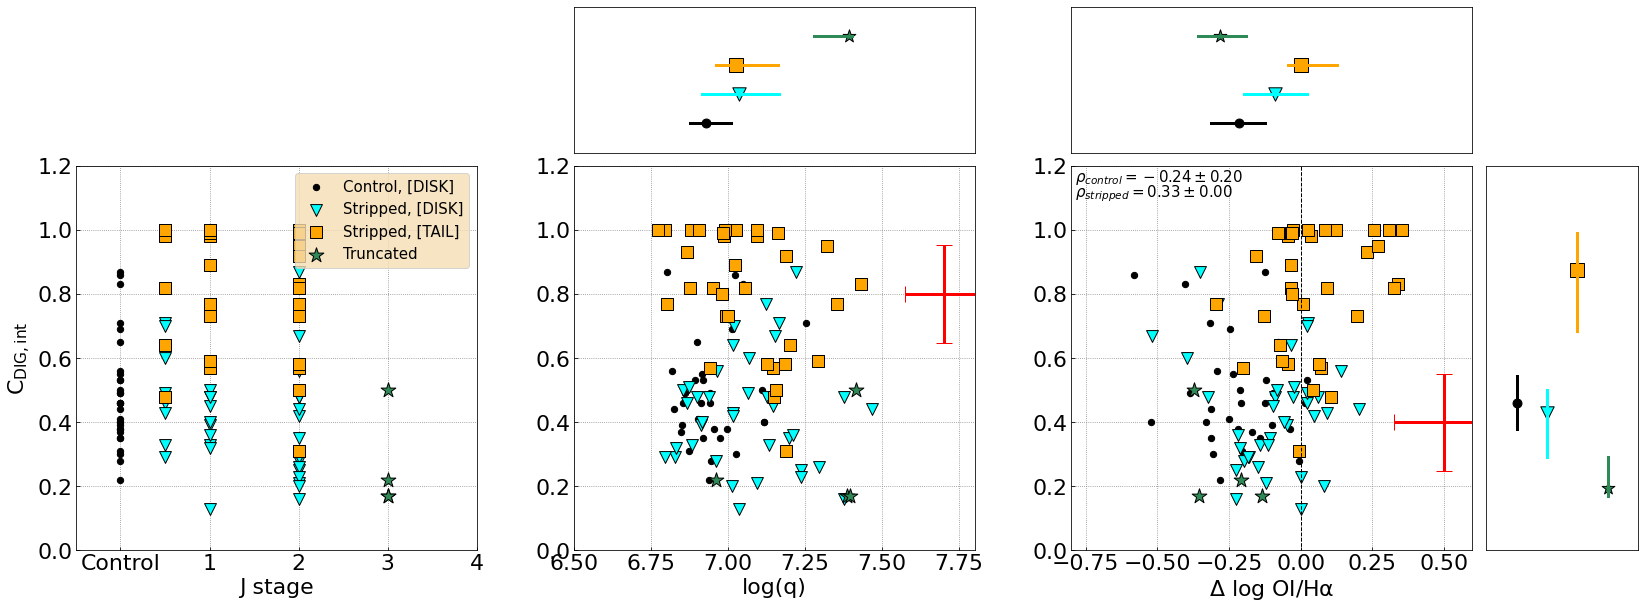
We investigate in Fig. 6 how different physical properties such as the integrated fraction of the DIG emission666The integrated fraction here is defined as the sum of the luminosity from DIG dominated spaxels over the total luminosity of galaxy. (, GASP XXXII) as a function of J stage (left panel), median (middle panel) and (right panel). We estimated the within the disks and tails of all galaxies (control sample and stripped galaxies). In the case of median , we use the median value of only the spaxels designated as SF on the BPT-[Oi] diagram.
As seen in GASP XXXII, the disks of stripped and control sample galaxies cover a similar range in (from 0.1 to 0.9), with a median value777We show median values and first and third quartiles in diagrams above and on the right from the panels. for the entire sample. The tails of stripped galaxies have higher DIG fractions (median ) than the disks.
There is generally no systematic variation of the of the disks with J stage. The truncated disks (J=3) show a low DIG fraction (), probably due to a large fraction of gas being stripped away from the disk, and preservation of only the dense gas, star-forming regions in their centers.
Focusing on the ionization parameter, we find that control galaxies have lower median values () compared to the stripped galaxies (median ). The disks and tails of the stripped sample also show the same median values. We note that the control sample spans a narrower range of than the disks and tails of stripped galaxies.
The gas in disks of control and stripped sample galaxies has mostly negative values (median and , respectively). The tails have higher values in than the disks with more than half of them having positive values (median ).
We also notice a weak correlation between and across stripped galaxies (Pearson coefficient ), while the control galaxies show a slight anti-correlation (). This effect is mostly due to the tails of high , which have slightly higher .
These results show that the gas-stripping process, in general, slightly increases the range, and systematically increases the values of , especially in the tails.
3.6 How do and vary with galaxy properties?
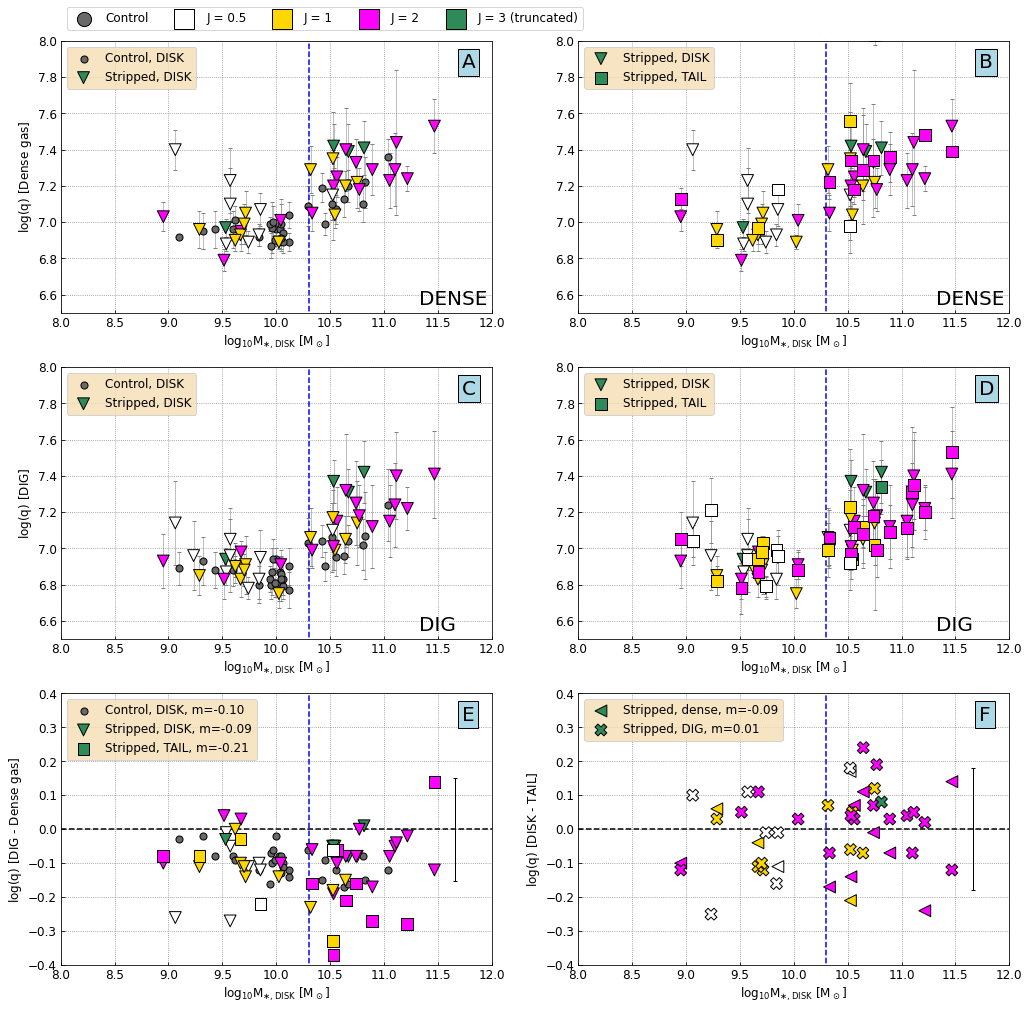
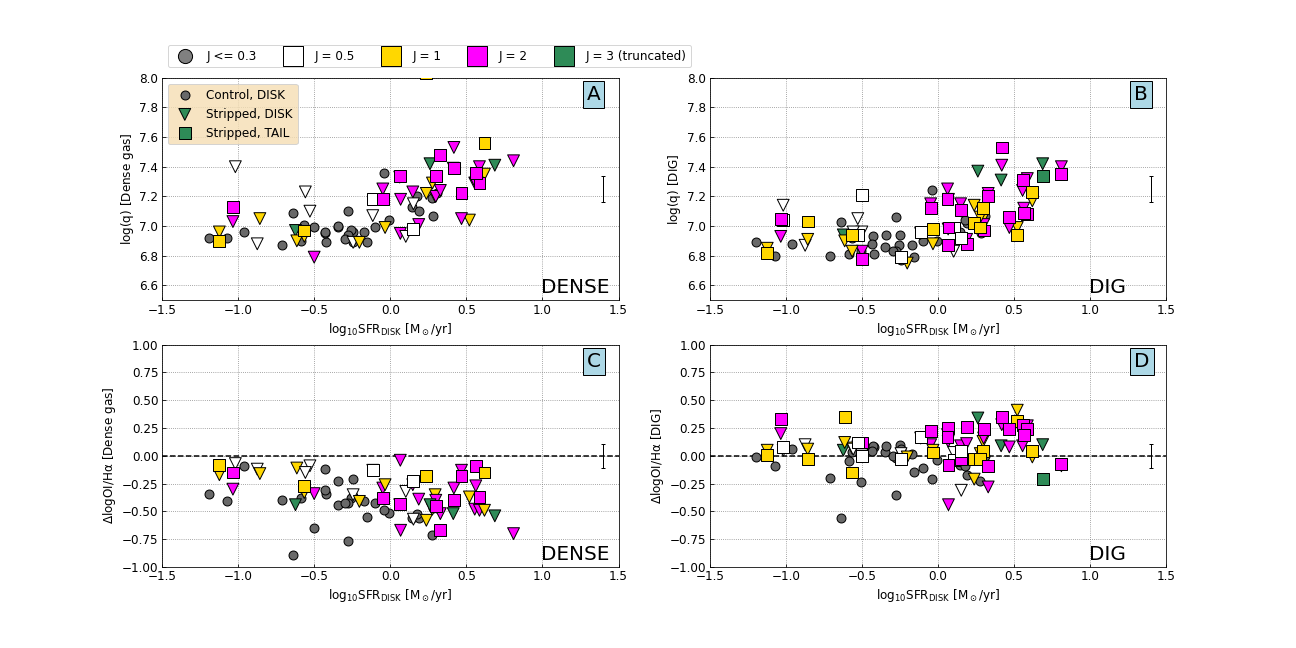
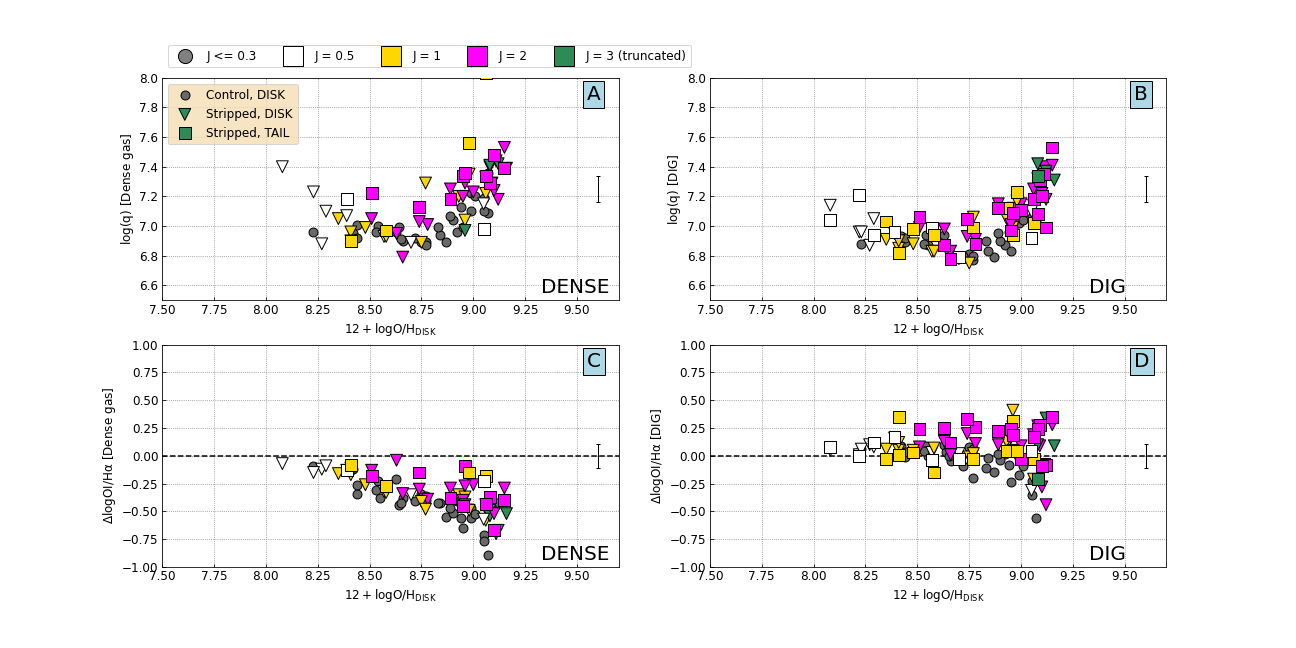
To investigate if and vary with integrated galactic properties, we compare galaxy global values (medians of spaxels) of and as a function of stellar mass, SFR, specific SFR (sSFR=SFR/M⋆), and other overall galaxy properties. The integrated values of and as a function of stellar mass are presented in Figures 7 and 8, respectively. The comparison with other properties (SFR and sSFR of disks, gas-phase metallicity, ratio of area of tails and disks) are shown in Appendix B.
We separate panels and compare the median values of data as follows: 1) disks of control and stripped galaxy samples (panels A and C), 2) disks and tails of the stripped galaxies (panels B and D), and 3) dense gas (panels A and B) and DIG (C and D) dominated areas in the galaxies. We show the difference between DIG and dense gas data in panel E, and the difference between disks and tails of the stripped galaxies in panel F. From these comparisons, we observe a few major results and trends, as follows.
The low-mass galaxies () are characterized by a rather constant value of , while for the high mass galaxies () strongly correlates with stellar mass. DIG in disks and tails has dex lower compared to the dense gas in the same environments. There is no clear difference in the evaluated gas properties in disks of control and stripped galaxies (panel E), and between the tails and disks of the stripped sample (panel F). The large scatter in the measured properties prevents a conclusive analysis of trends with stellar mass in panels E and F.
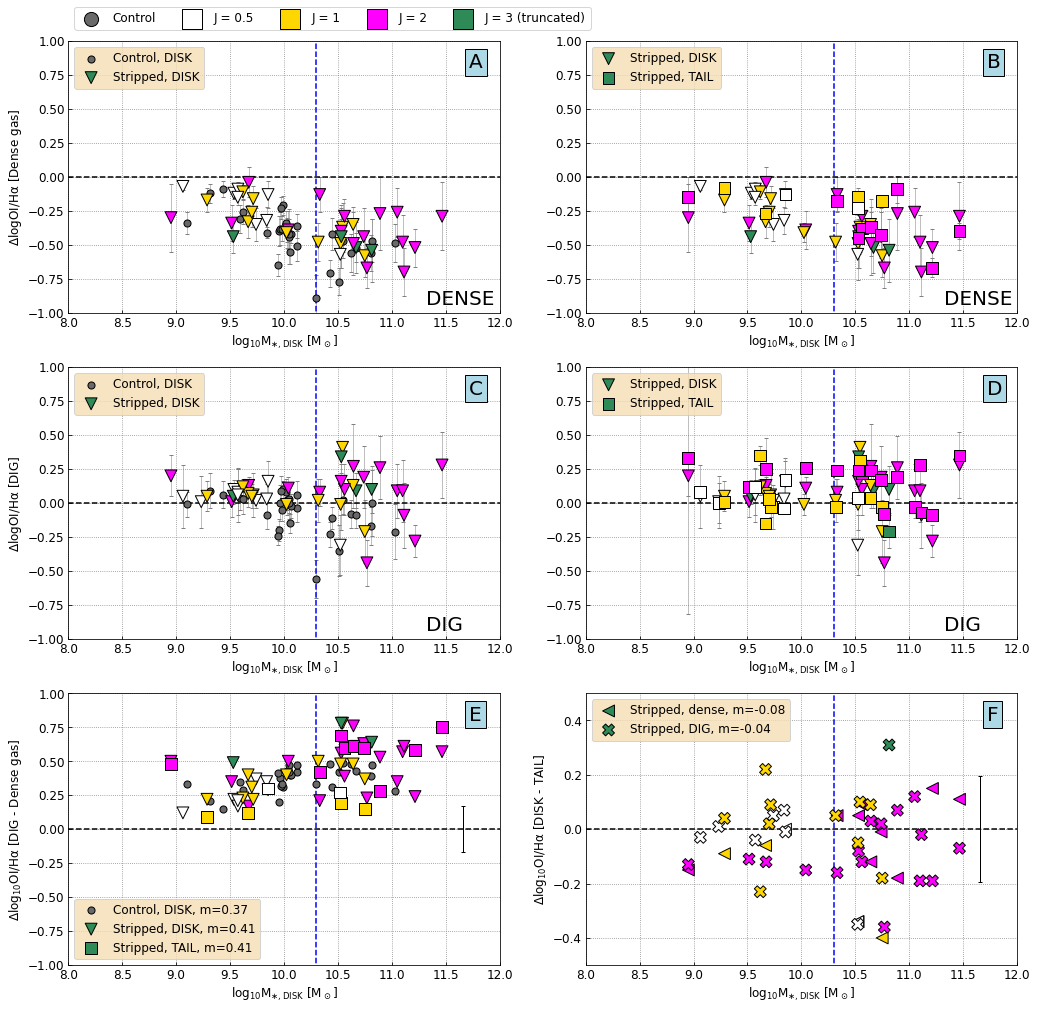
Considering of the dense gas, we observe a weak anti-correlation with the stellar mass (Fig. 8). Furthermore, this anti-correlation is stronger for low mass galaxies than for high mass ones. The DIG areas show higher values ( dex) compared to the dense gas (as clearly seen in panel E), with the tails having larger offsets (by dex) than the disks. We highlight the fact that all dense gas data have values below 0, while most of the DIG show positive values. We also notice in panel D that galaxies of higher J stage number have higher values for DIG designated spaxels in the tails (magenta square symbols), compared to the rest of the data in other panels.
Regarding other galactic values (presented in Appendix B), correlates with SFR and gas-phase metallicity. We explain this as a signature of well known correlations between the stellar mass, metallicity and SFR. The dense gas shows a somewhat strong anti-correlation between and metallicity, and the DIG exhibits a weak correlation between and the spaxel fraction of tails vs. disks. The former relation is most likely an effect of metallicity on increase of ratio.
To conclude, these results indicate that the stellar mass is driving the increase in median across the galaxies more than the fraction of DIG. Moreover, the DIG clearly shows high values compared to the dense gas, especially in the case of the stripped tails.
4 Summary of results and discussion
4.1 Variation with gas-phase metallicity
In the previous section we showed that the gas-phase metallicity at a given galactocentric radius, and at kpc spatial resolution, does not vary with different DIG fractions in disks of all galaxies (Fig. 5). This would indicate two major conclusions about the distribution of the metallicity within the disks. First, the DIG emission should not hinder the measurement of metallicity at a given radius in galaxies. Second, there is no difference in the metallicity radial gradient between areas dominated by dense gas or DIG.
Similar to our conclusions, Kumari et al. (2019) did not found significant differences in metallicities between spatially close-by HII-DIG/LIER pairs, which are expected to be chemically homogeneous. However, their results may be affected by non-SF source of ionisation changing line ratios used for metallicity diagnostics.
On the other hand, Poetrodjojo et al. (2019) found tentative results for different metallicity gradients in DIG and H II dominated spaxels of the M83 galaxy. Analysing IFU data from MaNGA, Zhang et al. (2017) also showed that the DIG can significantly bias the measurement of gas metallicity and metallicity gradients derived using strong emission lines. However, Zhang et al. (2017) used an incomplete method to separate dense gas from DIG, by using only information. Lacerda et al. (2018) note that DIG in galaxy centers can exhibit bright and low equivalent width, which could bias results of Zhang et al. (2017). Using data cubes from MaNGA and fiber spectroscopy from the Sloan Digital Sky Survey Data Release 7, Vale Asari et al. (2019) found that accounting for the DIG contribution leads to a change in metallicity of up to 0.1 dex, but can be negligible depending on the metallicity estimation method.
The major drawback of the methods of separating DIG and H II dominated spaxels, used by Poetrodjojo et al. (2019) and Zhang et al. (2017), is that they did not fully account for effects of radial metallicity gradients on [Sii]/H ratio. On the other hand, a drawback of our method is that the low spatial resolution potentially can dilute the metallicity values of the dense gas spaxels, as discussed by Sánchez et al. (2014), Belfiore et al. (2017b) and Sánchez-Menguiano et al. (2018). This effect can lead to measuring similar metallicities between DIG and dense gas spaxels in our sample.
4.2 Ionization parameter
Our results at small spatial scales ( kpc) conclude that the DIG exhibits lower than the dense gas (Fig. 5 and 7). Similar conclusions have been drawn by Zhang et al. (2017) and Mingozzi et al. (2020) from their spatially resolved observations of in nearby galaxies. This is to be expected, if we assume that the diffuse gas resides further from hot, young stars that are the source of a large number of ionizing photons. Only exception at those spatial scales are DIG dominated spaxels in the edges of disks, and in the tails of gas-stripped galaxies, which show an increase in .
Another interesting aspect of our results is that high-mass galaxies show an anti-correlation between and galactocentric radius (Fig. 5). We ascribe this increase to the ionization due to a large number of HOLMES and evolved stars (Flores-Fajardo et al. 2011, Zhang et al. 2017) at decreasing galactocentric radius. Similarly, Dopita et al. (2014) observed higher values in the center of galaxies, and concluded that it is due to higher and changes in the geometry of the molecular and ionized gas. Simpson et al. (2007) observed an increase in excitation of gas toward the galactic center, probably due to shocks. On the other hand, Mingozzi et al. (2020) observed a correlation between and galactocentric radius, in high-mass galaxies. Similarly, Sánchez et al. (2012) and Sánchez et al. (2015) noted a weak correlation between those parameters.
There is an ongoing discussion about the relation between the ionizing parameter in galaxies and other integrated galactic properties. At galactic scales, we do not observe a strong effect of gas-stripping on , but we do note an increase in the range of the stripped galaxies compared to the control sample (Fig. 6). On the other hand, this is the first study where a strong correlation between and the stellar mass for galaxies with (Fig. 7) is observed. We ascribe this trend to higher fraction of HOLMES and evolved stars within high-mass galaxies, compared to low-mass galaxies. It is interesting that the tails also show an increase in with galaxy stellar mass, which may be a result of an interplay between gas and photon densities of the ISM. Integrated SFR and metallicities yield a positive correlation with probably due to their correlation with stellar mass. Similar to our observations, Dopita et al. (2014) observed a correlation between and SFR, while Poetrodjojo et al. (2018) did not.
4.3 Effects of gas-stripping process and
Our results indicate an increase in toward the edges of galaxy disks (Fig. 5), and a large fraction of DIG dominated spaxels showing positive , designating them as LINER/LIER like regions (Fig. 3). In general, LINER/LIER like feature for DIG dominated spaxels in centers of non-stripped galaxies has been previously observed by Flores-Fajardo et al. (2011) and Zhang et al. (2017). Zhang et al. (2017) speculate that only ionization by evolved stars (older than 125 Myr) as a major ionization source for DIG can lead to LINER/LIER like emission. The evolved stars and HOLMES may contribute to the increase in within the disks of our sample (as seen in Fig. 5 and 3).
The DIG areas in the tails of highly stripped galaxies (higher J stage numbers) systematically exhibit the highest values compared to the galactic disks (Fig. 8). correlates with distance from the SF regions in the disks and most of the tails (Fig. 4). We also found that DIG in stripped tails extends to very large projected distances (Fig. 4), and is spanning kpc and up to 10 kpc scales, which is larger than a typical scale-heights of galactic disks. The DIG at those large distances contributes to the increase in , and is showing LINER/LIER like features. Those features are lacking in the control galaxies. Previously, Poggianti et al. (2019b) observed that the tails of many gas-stripped galaxies in GASP exhibit LINER/LIER like emission in BPT-[Oi] diagrams, while the other diagnostic diagrams (based on NII or SII) suggest star-formation or at least a composite origin for the ionization, which suggests that SF photons are partly the source of ionization.
In light of these results, we hypothesize that the DIG in the edges and tails of stripped galaxies, is ionized by more than one process (of which star-formation may be one). Two competing candidates for that ionization are: 1) older stellar population (older than 125 Myr and younger than 13 Gyr, as proposed by Flores-Fajardo et al. 2011 and Zhang et al. 2017) for ionization of DIG in galactic disks, or 2) mixing of the hot-cold gas layers such as ICM and galactic ISM, as proposed by Slavin et al. 1993, Binette et al. 2009, and Poggianti et al. (2019a). The first option is less likely because the older stellar population would most likely form in SF knots of tails and would cover small distances from those SF regions. Although this candidate of ionizing DIG in tails should not be completely disregarded, we find the mixing of hot-cold gas layers and shocks more probable. This is also backed up by the findings of Poggianti et al. (2019a), Campitiello et al. 2021 and Müller et al. (2021), who found an excess in X-ray emission and existence of magnetic fields in the tails of three of the jellyfish galaxies studied here, JO201, JW100, JO206. This excess in X-ray may be produced by radiative cooling (Müller et al. 2021, Sparre et al. 2020) of the hot and highly magnetised ICM gas during the interplay with the galactic tail’s ISM and accretion of the ICM onto the stripped ISM.
To conclude, we hypothesize that the gas-stripping process is creating the galactic tails that are mixing with the ICM, thus ionizing the DIG at large distances from SF regions, and systematically showing an increase in .
5 Conclusions
In this paper, we utilise the optical IFU (MUSE spectrograph) observations of 71 galaxies (30 control and 41 stripped) from the GASP project to analyze the gas properties of the dense and diffuse ionized gas. The investigated properties are gas-phase metallicity and ionization parameter for SF regions, and values (the distance in the value from the BPT- line that separates SF and LINER/LIER like regions). We compare these properties between control sample and stripped galaxies, as well as between the disks and tails of the stripped galaxies. Our results indicate the following:
-
•
The DIG fraction does not strongly affect the gas-phase metallicity measurement at a given galactocentric radius, and thus does not affect the metallicity radial gradient metallicity across all of the galaxies.
-
•
The DIG dominated areas mostly show lower compared to the dense gas areas, at small spatial scales. This is due to ionization of dense gas, in the disks and most of the tails, coming from close and highly-ionizing, young stars.
-
•
span a wider range in the stripped galaxies compared to the control sample, suggesting a larger spread in ionization parameter.
-
•
The integrated, galactic values correlate best with the total stellar mass, with more massive galaxies showing also an increase in in their galactic centers. We speculate that this increase is due to higher density of ionizing photons from older stellar populations that are dominating the central regions, and whose number is increasing at higher galaxy masses.
-
•
The DIG systematically exhibits higher compared to the dense gas, and all galaxies show an increase in and LINER/LIER like features at their edges.
-
•
Gas-stripping process in galaxies create tails of gas, where mixing of the tail’s ISM and ICM both ionize the DIG, and cause an increase in values. The areas of highest reside in the tails of highly stripped galaxies (highest J stage number), in areas at large distances (up to 10 kpc) from the SF regions. These distances indicate that neither the SF regions alone, nor the older stellar population alone or a combination of both, can explain the ionization of the DIG.
These findings suggest that the gas-stripping process does not affect metallicities, nor has a strong effect on the ionization parameter, but has strong effects of gas-stripping on .
Our results shed additional light on the process of ram-pressure that affects the ionized gas and star-formation in galaxies. In the future, we aim to further investigate the dust and stellar ultraviolet emission of the DIG-dominated regions versus the dense regions, both in normal disks and disks and tails of stripped galaxies.
Appendix A Maps of all galaxies
Appendix B and of integrated data
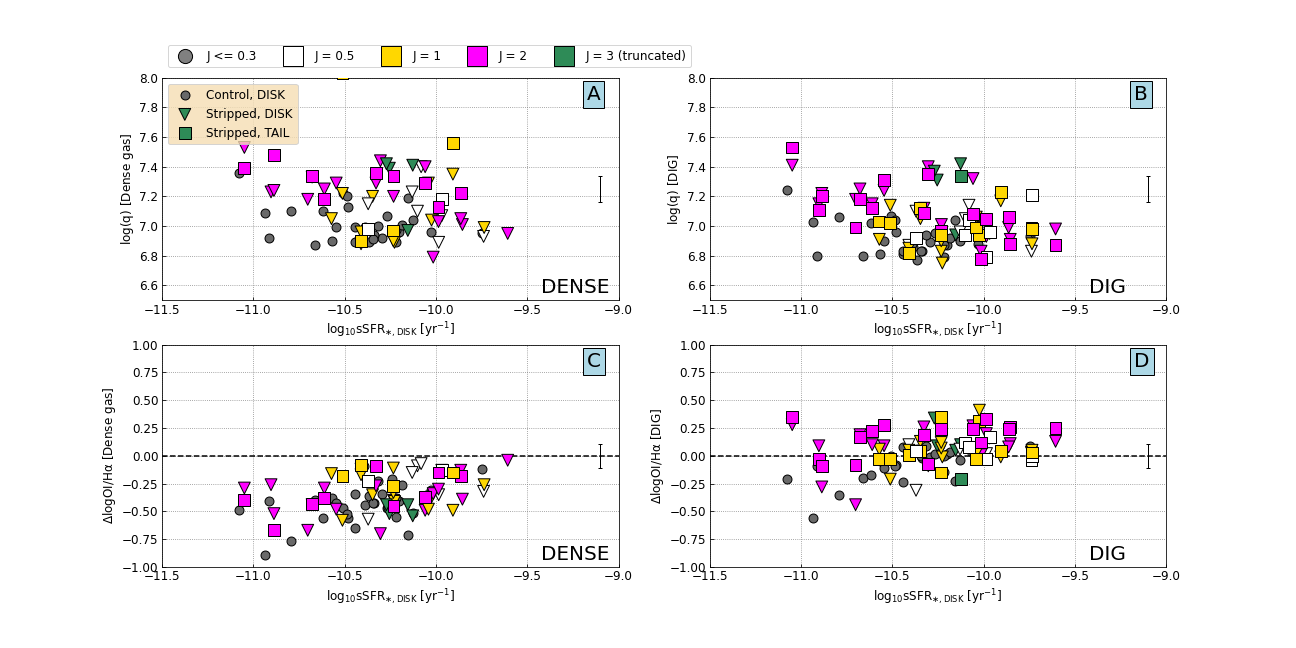
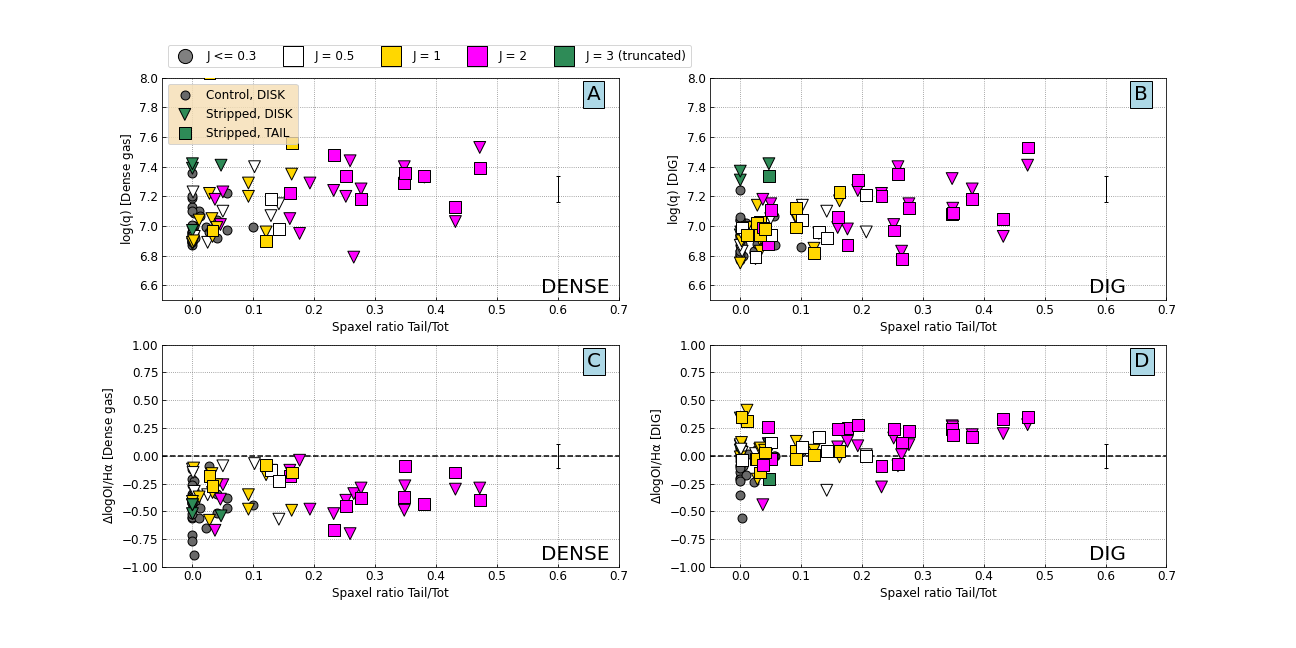
As in Fig. 7 and 8, in this section we compare integrated and as a function of disk’s SFR (Fig. 26), sSFR (Fig. 27), ratio of number of spaxels from tails and disks (Fig. 28), gas-phase metallicity (Fig. 29). We separate the dense gas and DIG dominated data in these figures, and mark the data according to J stage (by color), or by which type or part of galaxies it represent (type of marks).
We hypothesize that the SFR and gas-phase metallicity correlate to the mass of the stellar disk (Franchetto et al. 2020), thus the behavior seen in the figures can be explained by variation in the mass instead of correlation with and . Similar correlations between integrated and SFR and metallicity was also observed by Tremonti et al. (2004) and Dopita et al. (2014). Furthermore, the metallicity values may be affected by measurements, so trends seen in Fig. 29 may yield wrong interpretation. For the sSFR and the spaxel number ratio of tails vs. disks, we do not see a clear correlation in and .
References
- Astropy Collaboration et al. (2013) Astropy Collaboration, Robitaille, T. P., Tollerud, E. J., et al. 2013, A&A, 558, A33, doi: 10.1051/0004-6361/201322068
- Bacon et al. (2006) Bacon, R., Bauer, S., Boehm, P., et al. 2006, in Ground-based and Airborne Instrumentation for Astronomy, ed. I. S. McLean & M. Iye, Vol. 6269, International Society for Optics and Photonics (SPIE), 183 – 191, doi: 10.1117/12.669772
- Baldwin et al. (1981) Baldwin, J. A., Phillips, M. M., & Terlevich, R. 1981, PASP, 93, 5, doi: 10.1086/130766
- Barnes et al. (2014) Barnes, J. E., Wood, K., Hill, A. S., & Haffner, L. M. 2014, MNRAS, 440, 3027, doi: 10.1093/mnras/stu521
- Belfiore et al. (2016) Belfiore, F., Maiolino, R., Maraston, C., et al. 2016, MNRAS, 461, 3111, doi: 10.1093/mnras/stw1234
- Belfiore et al. (2017a) —. 2017a, MNRAS, 466, 2570, doi: 10.1093/mnras/stw3211
- Belfiore et al. (2017b) Belfiore, F., Maiolino, R., Tremonti, C., et al. 2017b, MNRAS, 469, 151, doi: 10.1093/mnras/stx789
- Binette et al. (2009) Binette, L., Drissen, L., Ubeda, L., et al. 2009, A&A, 500, 817, doi: 10.1051/0004-6361/200811132
- Blanc et al. (2009) Blanc, G. A., Heiderman, A., Gebhardt, K., Evans, Neal J., I., & Adams, J. 2009, ApJ, 704, 842, doi: 10.1088/0004-637X/704/1/842
- Bocchio et al. (2016) Bocchio, M., Bianchi, S., Hunt, L. K., & Schneider, R. 2016, A&A, 586, A8, doi: 10.1051/0004-6361/201526950
- Bundy et al. (2015) Bundy, K., Bershady, M. A., Law, D. R., et al. 2015, ApJ, 798, 7, doi: 10.1088/0004-637X/798/1/7
- Calvi et al. (2011) Calvi, R., Poggianti, B. M., & Vulcani, B. 2011, MNRAS, 416, 727, doi: 10.1111/j.1365-2966.2011.19088.x
- Campitiello et al. (2021) Campitiello, M. G., Ignesti, A., Gitti, M., et al. 2021, arXiv e-prints, arXiv:2103.03147. https://arxiv.org/abs/2103.03147
- Cardelli et al. (1989) Cardelli, J. A., Clayton, G. C., & Mathis, J. S. 1989, ApJ, 345, 245, doi: 10.1086/167900
- Chabrier (2003) Chabrier, G. 2003, PASP, 115, 763, doi: 10.1086/376392
- Cid Fernandes et al. (2011) Cid Fernandes, R., Stasińska, G., Mateus, A., & Vale Asari, N. 2011, MNRAS, 413, 1687, doi: 10.1111/j.1365-2966.2011.18244.x
- Collins & Rand (2001) Collins, J. A., & Rand, R. J. 2001, ApJ, 551, 57, doi: 10.1086/320072
- Consolandi et al. (2017) Consolandi, G., Gavazzi, G., Fossati, M., et al. 2017, A&A, 606, A83, doi: 10.1051/0004-6361/201731218
- Cowie & Songaila (1977) Cowie, L. L., & Songaila, A. 1977, Nature, 266, 501, doi: 10.1038/266501a0
- Della Bruna et al. (2020) Della Bruna, L., Adamo, A., Bik, A., et al. 2020, A&A, 635, A134, doi: 10.1051/0004-6361/201937173
- Dopita et al. (2014) Dopita, M. A., Rich, J., Vogt, F. P. A., et al. 2014, Ap&SS, 350, 741, doi: 10.1007/s10509-013-1753-2
- Dopita et al. (2013) Dopita, M. A., Sutherland, R. S., Nicholls, D. C., Kewley, L. J., & Vogt, F. P. A. 2013, ApJS, 208, 10, doi: 10.1088/0067-0049/208/1/10
- Fasano et al. (2006) Fasano, G., Marmo, C., Varela, J., et al. 2006, A&A, 445, 805, doi: 10.1051/0004-6361:20053816
- Flores-Fajardo et al. (2011) Flores-Fajardo, N., Morisset, C., Stasińska, G., & Binette, L. 2011, MNRAS, 415, 2182, doi: 10.1111/j.1365-2966.2011.18848.x
- Fossati et al. (2016) Fossati, M., Fumagalli, M., Boselli, A., et al. 2016, MNRAS, 455, 2028, doi: 10.1093/mnras/stv2400
- Franchetto et al. (2020) Franchetto, A., Vulcani, B., Poggianti, B. M., et al. 2020, ApJ, 895, 106, doi: 10.3847/1538-4357/ab8db9
- Fritz et al. (2017) Fritz, J., Moretti, A., Gullieuszik, M., et al. 2017, ApJ, 848, 132, doi: 10.3847/1538-4357/aa8f51
- Fumagalli et al. (2014) Fumagalli, M., Fossati, M., Hau, G. K. T., et al. 2014, MNRAS, 445, 4335, doi: 10.1093/mnras/stu2092
- Gullieuszik et al. (2015) Gullieuszik, M., Poggianti, B., Fasano, G., et al. 2015, A&A, 581, A41, doi: 10.1051/0004-6361/201526061
- Gullieuszik et al. (2020) Gullieuszik, M., Poggianti, B. M., McGee, S. L., et al. 2020, arXiv e-prints, arXiv:2006.16032. https://arxiv.org/abs/2006.16032
- Gunn & Gott (1972) Gunn, J. E., & Gott, J. Richard, I. 1972, ApJ, 176, 1, doi: 10.1086/151605
- Haffner et al. (2009) Haffner, L. M., Dettmar, R. J., Beckman, J. E., et al. 2009, Reviews of Modern Physics, 81, 969, doi: 10.1103/RevModPhys.81.969
- Heckman & Balick (1980) Heckman, T. M., & Balick, B. 1980, A&A, 83, 100
- Herpich et al. (2018) Herpich, F., Stasińska, G., Mateus, A., Vale Asari, N., & Cid Fernandes, R. 2018, MNRAS, 481, 1774, doi: 10.1093/mnras/sty2391
- Hoopes & Walterbos (2003) Hoopes, C. G., & Walterbos, R. A. M. 2003, ApJ, 586, 902, doi: 10.1086/367954
- Hummer & Storey (1987) Hummer, D. G., & Storey, P. J. 1987, MNRAS, 224, 801, doi: 10.1093/mnras/224.3.801
- Kaplan et al. (2016) Kaplan, K. F., Jogee, S., Kewley, L., et al. 2016, MNRAS, 462, 1642, doi: 10.1093/mnras/stw1422
- Kewley et al. (2001) Kewley, L. J., Dopita, M. A., Sutherland, R. S., Heisler, C. A., & Trevena, J. 2001, ApJ, 556, 121, doi: 10.1086/321545
- Kewley et al. (2006) Kewley, L. J., Groves, B., Kauffmann, G., & Heckman, T. 2006, MNRAS, 372, 961, doi: 10.1111/j.1365-2966.2006.10859.x
- Kewley et al. (2019) Kewley, L. J., Nicholls, D. C., & Sutherland, R. S. 2019, ARA&A, 57, 511, doi: 10.1146/annurev-astro-081817-051832
- Koopmann & Kenney (2004) Koopmann, R. A., & Kenney, J. D. P. 2004, The Astrophysical Journal, 613, 851, doi: 10.1086/423190
- Kreckel et al. (2016) Kreckel, K., Blanc, G. A., Schinnerer, E., et al. 2016, ApJ, 827, 103, doi: 10.3847/0004-637X/827/2/103
- Kumari et al. (2019) Kumari, N., Maiolino, R., Belfiore, F., & Curti, M. 2019, MNRAS, 485, 367, doi: 10.1093/mnras/stz366
- Lacerda et al. (2018) Lacerda, E. A. D., Cid Fernandes, R., Couto, G. S., et al. 2018, MNRAS, 474, 3727, doi: 10.1093/mnras/stx3022
- Levy et al. (2019) Levy, R. C., Bolatto, A. D., Sánchez, S. F., et al. 2019, ApJ, 882, 84, doi: 10.3847/1538-4357/ab2ed4
- Madsen et al. (2006) Madsen, G. J., Reynolds, R. J., & Haffner, L. M. 2006, ApJ, 652, 401, doi: 10.1086/508441
- Maier et al. (2006) Maier, C., Lilly, S. J., Carollo, C. M., et al. 2006, ApJ, 639, 858, doi: 10.1086/499518
- Markwardt (2009a) Markwardt, C. B. 2009a, in Astronomical Society of the Pacific Conference Series, Vol. 411, Astronomical Data Analysis Software and Systems XVIII, ed. D. A. Bohlender, D. Durand, & P. Dowler, 251. https://arxiv.org/abs/0902.2850
- Markwardt (2009b) Markwardt, C. B. 2009b, in Astronomical Society of the Pacific Conference Series, Vol. 411, Astronomical Data Analysis Software and Systems XVIII, ed. D. A. Bohlender, D. Durand, & P. Dowler, 251. https://arxiv.org/abs/0902.2850
- Martin (1997) Martin, C. L. 1997, ApJ, 491, 561, doi: 10.1086/304978
- Mingozzi et al. (2020) Mingozzi, M., Belfiore, F., Cresci, G., et al. 2020, A&A, 636, A42, doi: 10.1051/0004-6361/201937203
- Minter & Balser (1998) Minter, A., & Balser, D. S. 1998, Turbulent Heating in the Galactic Diffuse Ionized Gas, ed. D. Breitschwerdt, M. J. Freyberg, & J. Truemper, Vol. 506, 543–546, doi: 10.1007/BFb0104779
- Minter & Spangler (1997) Minter, A. H., & Spangler, S. R. 1997, ApJ, 485, 182, doi: 10.1086/304396
- Müller et al. (2021) Müller, A., Poggianti, B. M., Pfrommer, C., et al. 2021, Nature Astronomy, 5, 159, doi: 10.1038/s41550-020-01234-7
- Nagao et al. (2006) Nagao, T., Maiolino, R., & Marconi, A. 2006, A&A, 459, 85, doi: 10.1051/0004-6361:20065216
- Oey et al. (2007) Oey, M. S., Meurer, G. R., Yelda, S., et al. 2007, ApJ, 661, 801, doi: 10.1086/517867
- Osterbrock & Martel (1992) Osterbrock, D. E., & Martel, A. 1992, PASP, 104, 76, doi: 10.1086/132961
- Otte et al. (2002) Otte, B., Gallagher, J. S., I., & Reynolds, R. J. 2002, ApJ, 572, 823, doi: 10.1086/340381
- Poetrodjojo et al. (2019) Poetrodjojo, H., D’Agostino, J. J., Groves, B., et al. 2019, MNRAS, 487, 79, doi: 10.1093/mnras/stz1241
- Poetrodjojo et al. (2018) Poetrodjojo, H., Groves, B., Kewley, L. J., et al. 2018, MNRAS, 479, 5235, doi: 10.1093/mnras/sty1782
- Poggianti et al. (2017) Poggianti, B. M., Moretti, A., Gullieuszik, M., et al. 2017, ApJ, 844, 48, doi: 10.3847/1538-4357/aa78ed
- Poggianti et al. (2019a) Poggianti, B. M., Ignesti, A., Gitti, M., et al. 2019a, ApJ, 887, 155, doi: 10.3847/1538-4357/ab5224
- Poggianti et al. (2019b) Poggianti, B. M., Gullieuszik, M., Tonnesen, S., et al. 2019b, MNRAS, 482, 4466, doi: 10.1093/mnras/sty2999
- Raymond (1992) Raymond, J. C. 1992, ApJ, 384, 502, doi: 10.1086/170892
- Relaño et al. (2012) Relaño, M., Kennicutt, R. C., J., Eldridge, J. J., Lee, J. C., & Verley, S. 2012, MNRAS, 423, 2933, doi: 10.1111/j.1365-2966.2012.21107.x
- Reynolds (1984) Reynolds, R. J. 1984, ApJ, 282, 191, doi: 10.1086/162190
- Reynolds & Cox (1992) Reynolds, R. J., & Cox, D. P. 1992, ApJ, 400, L33, doi: 10.1086/186642
- Reynolds et al. (2001) Reynolds, R. J., Sterling, N. C., Haffner, L. M., & Tufte, S. L. 2001, ApJ, 548, L221, doi: 10.1086/319119
- Sánchez (2020) Sánchez, S. F. 2020, ARA&A, 58, 99, doi: 10.1146/annurev-astro-012120-013326
- Sánchez et al. (2012) Sánchez, S. F., Rosales-Ortega, F. F., Marino, R. A., et al. 2012, A&A, 546, A2, doi: 10.1051/0004-6361/201219578
- Sánchez et al. (2014) Sánchez, S. F., Rosales-Ortega, F. F., Iglesias-Páramo, J., et al. 2014, A&A, 563, A49, doi: 10.1051/0004-6361/201322343
- Sánchez et al. (2015) Sánchez, S. F., Galbany, L., Pérez, E., et al. 2015, A&A, 573, A105, doi: 10.1051/0004-6361/201424950
- Sánchez-Menguiano et al. (2018) Sánchez-Menguiano, L., Sánchez, S. F., Pérez, I., et al. 2018, A&A, 609, A119, doi: 10.1051/0004-6361/201731486
- Sanders et al. (2017) Sanders, R. L., Shapley, A. E., Zhang, K., & Yan, R. 2017, ApJ, 850, 136, doi: 10.3847/1538-4357/aa93e4
- Scaife (2013) Scaife, A. M. M. 2013, Advances in Astronomy, 2013, 390287, doi: 10.1155/2013/390287
- Schlafly & Finkbeiner (2011) Schlafly, E. F., & Finkbeiner, D. P. 2011, ApJ, 737, 103, doi: 10.1088/0004-637X/737/2/103
- Schlegel et al. (1998) Schlegel, D. J., Finkbeiner, D. P., & Davis, M. 1998, ApJ, 500, 525, doi: 10.1086/305772
- Searle (1971) Searle, L. 1971, ApJ, 168, 327, doi: 10.1086/151090
- Simpson et al. (2007) Simpson, J. P., Colgan, S. W. J., Cotera, A. S., et al. 2007, ApJ, 670, 1115, doi: 10.1086/522295
- Singh et al. (2013) Singh, R., van de Ven, G., Jahnke, K., et al. 2013, A&A, 558, A43, doi: 10.1051/0004-6361/201322062
- Slavin et al. (1993) Slavin, J. D., Shull, J. M., & Begelman, M. C. 1993, ApJ, 407, 83, doi: 10.1086/172494
- Sparre et al. (2020) Sparre, M., Pfrommer, C., & Ehlert, K. 2020, MNRAS, 499, 4261, doi: 10.1093/mnras/staa3177
- Tomičić et al. (2017) Tomičić, N., Kreckel, K., Groves, B., et al. 2017, ApJ, 844, 155, doi: 10.3847/1538-4357/aa7b30
- Tomičić et al. (2021) Tomičić, N., Vulcani, B., Poggianti, B. M., et al. 2021, ApJ, 907, 22, doi: 10.3847/1538-4357/abca93
- Toomre & Toomre (1972) Toomre, A., & Toomre, J. 1972, ApJ, 178, 623, doi: 10.1086/151823
- Tremonti et al. (2004) Tremonti, C. A., Heckman, T. M., Kauffmann, G., et al. 2004, ApJ, 613, 898, doi: 10.1086/423264
- Vale Asari et al. (2019) Vale Asari, N., Couto, G. S., Cid Fernandes, R., et al. 2019, MNRAS, 489, 4721, doi: 10.1093/mnras/stz2470
- Vila-Costas & Edmunds (1992) Vila-Costas, M. B., & Edmunds, M. G. 1992, MNRAS, 259, 121, doi: 10.1093/mnras/259.1.121
- Vogt et al. (2015) Vogt, F. P. A., Dopita, M. A., Borthakur, S., et al. 2015, MNRAS, 450, 2593, doi: 10.1093/mnras/stv749
- Vulcani et al. (2017) Vulcani, B., Moretti, A., Poggianti, B. M., et al. 2017, ApJ, 850, 163, doi: 10.3847/1538-4357/aa9652
- Vulcani et al. (2018a) Vulcani, B., Poggianti, B. M., Gullieuszik, M., et al. 2018a, ApJ, 866, L25, doi: 10.3847/2041-8213/aae68b
- Vulcani et al. (2018b) Vulcani, B., Poggianti, B. M., Moretti, A., et al. 2018b, ApJ, 852, 94, doi: 10.3847/1538-4357/aa992c
- Vulcani et al. (2018c) Vulcani, B., Poggianti, B. M., Jaffé, Y. L., et al. 2018c, MNRAS, 480, 3152, doi: 10.1093/mnras/sty2095
- Vulcani et al. (2019a) Vulcani, B., Poggianti, B. M., Moretti, A., et al. 2019a, MNRAS, 487, 2278, doi: 10.1093/mnras/stz1399
- Vulcani et al. (2019b) —. 2019b, MNRAS, 488, 1597, doi: 10.1093/mnras/stz1829
- Vulcani et al. (2020) Vulcani, B., Poggianti, B. M., Tonnesen, S., et al. 2020, arXiv e-prints, arXiv:2007.04996. https://arxiv.org/abs/2007.04996
- Vulcani et al. (2021) Vulcani, B., Poggianti, B. M., Moretti, A., et al. 2021, arXiv e-prints, arXiv:2104.02089. https://arxiv.org/abs/2104.02089
- Weingartner & Draine (2001) Weingartner, J. C., & Draine, B. T. 2001, ApJS, 134, 263, doi: 10.1086/320852
- Werle et al. (2020) Werle, A., Cid Fernandes, R., Vale Asari, N., et al. 2020, MNRAS, 497, 3251, doi: 10.1093/mnras/staa2217
- Yeh & Matzner (2012) Yeh, S. C. C., & Matzner, C. D. 2012, The Astrophysical Journal, 757, 108, doi: 10.1088/0004-637x/757/2/108
- Zhang et al. (2017) Zhang, K., Yan, R., Bundy, K., et al. 2017, MNRAS, 466, 3217, doi: 10.1093/mnras/stw3308