Ultrafast Focus Detection for Automated Microscopy
Abstract
Technological advancements in modern scientific instruments, such as scanning electron microscopes (SEMs), have significantly increased data acquisition rates and image resolutions enabling new questions to be explored; however, the resulting data volumes and velocities, combined with automated experiments, are quickly overwhelming scientists as there remain crucial steps that require human intervention, for example reviewing image focus. We present a fast out-of-focus detection algorithm for electron microscopy images collected serially and demonstrate that it can be used to provide near-real-time quality control for neuroscience workflows. Our technique, Multi-scale Histologic Feature Detection, adapts classical computer vision techniques and is based on detecting various fine-grained histologic features. We exploit the inherent parallelism in the technique to employ GPU primitives in order to accelerate characterization. We show that our method can detect of out-of-focus conditions within just 20ms. To make these capabilities generally available, we deploy our feature detector as an on-demand service and show that it can be used to determine the degree of focus in approximately 230ms, enabling near-real-time use.
1 Introduction
A fundamental goal of neuroscience is to map the anatomical relationships of the brain, an approach broadly called connectomics. Electron microscopy, an imaging method traditionally limited to small single 2D images, provides sufficient resolution to directly visualize the connections, or synapses, between neurons. Recently, automated serial electron microscopy (SEM) techniques have been developed where thousands, if not tens of thousands, of individual images are automatically acquired in series and then registered (i.e., aligned) to produce a volumetric dataset. Such datasets allow neuroscientists to follow the tortuous path neurons take through the brain to connect with each other (hence the name connectomics). However, many of the steps that comprise the collection of such datasets for connectomics require manual inspection, causing significant slowdowns in the rate at which datasets can be acquired. Such bottlenecks significantly impact the size of the datasets that can be reasonably acquired and studied. Furthermore, advances in electron microscopes have increased the rate that datasets can be acquired; for example, 10 Tbs/24hr [6], which, when used to map an entire, mouse brain will result in approximately 1 exabyte of data.
Auto-focus technology is a critical component of many imaging systems; from consumer cameras (for purposes of convenience) to industrial inspection tools to scientific instrumentation [27]. Such technology is typically either active or passive; active methods exploit some auxiliary device or mechanism to measure the distance of the optics from the scene, while passive methods analyze the definition or sharpness of an image by virtue of a proxy measure called a criterion function. Many electron microscopes incorporate auto-focus systems that attempt to focus the microscope before image acquisition. Despite such functionality, out-of-focus (OOF) images still occur at high rates (between 1% and 10%), depending on the quality of the tissue sections being imaged. For instance, it is common to experience occasional staining artifacts, and tears or compression artifacts (i.e., section wrinkles) during ultra-thin serial sectioning. These imperfections can cause auto-focus systems to fail if the microscope centers on them. This results in the system failing to find the correct focal plane, thus necessitating post-acquisition evaluation. These OOF error modes prevent effective automation, since a prerequisite of many downstream transformations is that the images collected all have high degree-of-focus (DOF). Without properly focused images, all downstream computational steps (e.g., 2D tile montaging, 3D alignment, automatic segmentation) will fail.
The DOF of images acquired by an electron microscope is also of critical importance with respect to automation. While seemingly a small step in a potential automation pipeline, focus detection is nevertheless an extremely critical step. In general, imaging tissue sections requires loading and unloading sets of 100-200 sections at a time. Failure to detect a single OOF image in situ causes significant delays because the affected sample sets need to be reloaded, desired field of view must be reconfigured, and reacquired images need to be realigned into the image stack. All such remediation steps are time and labor intensive, and effectively stops any downstream automation until the problem is remedied. Under ideal conditions, it is estimated that fixing a single image would take several hours of manual intervention, which increases if multiple images in distinct parts of the series have to be manually reacquired and aligned.
In this work we focus on ensuring images acquired by the electron microscope have high DOF, in order to further progress towards to goal of end-to-end automation. To this end, we propose a new technique, Multi-scale Histologic Feature Detection (MHFD), that involves a second pass over the collected image, after it has been acquired, using a computer vision system to detect a failure to successfully achieve high DOF. Our technique relies on employing feature detection [15] as a criterion function, in accordance with the hypothesis that the quantity of features detected is positively correlated with DOF. Using this insight, we develop a feature detector based on scale-space representations of images (see Section 2.2) but optimized for latency. The design and implementation of our feature detector prioritizes parallelization, specifically in order to target GPU deployments.
Our solution achieves low latency detection of the OOF condition with high accuracy (see Section 5). To provide access to these capabilities, we have deployed them as a service that can be consumed on-demand and integrated in automated workflows. The service leverages Argonne National Laboratory’s Leadership Computing Facility to provide access to A100 GPUs to rapidly analyze images as they are captured. This allows users to detect low quality images and correct their collection while the sample is still in the microscope, effectively eliminating costly delays in reloading, aligning, and imaging the sample. An important caveat in our work: we explicitly aim to augment existing microscopy equipment without the need for costly and complex retrofitting. This precludes mere improvements to existing auto-focus systems as they are, in essence, proprietary black boxes from the perspective of the end user of an electron microscope.
The rest of this article is organized as follows: Section 2 reviews background information on connectomics and scale-space feature detectors. Section 3 describes our focus detection method, in particular optimizations made in order to achieve near-real-time performance. Section 4 describes how we deliver MHFD as a service. Section 5 presents evaluation results. Section 6 discusses related work. Finally, we conclude in Section 7.
2 Background
We briefly review a common connectomics workflow and then describe scale-space representations.
2.1 Connectomics
Connectomics is defined as the study of comprehensive maps of connections within an organism’s nervous system (called connectomes). The data acquisition pipeline for connectomics consists of the following steps:
-
1.
A piece of nervous system (e.g., brain), ranging from 1mm3 to 1 cm3 is stained with heavy metals (e.g., osmium tetroxide, uranyl acetate, lead) in order to provide contrast in resulting images [11];
-
2.
After staining, the section is dehydrated and embedded in a plastic resin to stabilize the tissue for serial sectioning, which is performed with an Automated Serial Sections to Tape (ATUM) device [12] (where ultrathin sections are automatically sectioned and collected on polyimide tape);
-
3.
The sections are mounted to a silicon wafer, with each wafer containing 200-300 sections;
-
4.
The wafer is loaded into a SEM, where the user marks a region of interest (ROI) within the sections for the microscope to image;
-
5.
The SEM initiates a protocol to automatically image the ROI over all the sections at a desired resolution;
-
6.
For each section, the SEM attempts to auto-focus before imaging by sampling different focal planes over a set range of focal depths
The series of collected images are then algorithmically aligned to each other to produce a 3D volumetric image stack where biological features are segmented either manually or by automatic segmentation techniques.
Since the imaging and post-acquisition process (e.g., retakes of blurry images, 3D alignment, segmentation) is slow, connectomics is practically constrained to small volumes ( 100 µm3), but technologies are rapidly advancing, with near future goals of mapping an entire mouse brain [1]. Even with 100 µm3 volumes, the scope of the biological problem is large. For instance, a single mouse neuron is estimated to receive 5000-7000 connections [25] and the cell density of the mouse cortex is cells/mm3 [10]. A 100 µm3 volume will therefore contain 150 neurons receiving 7.55 synapses, all of which neuroscientists seek to automatically segment and study. For an entire mouse brain, there are neurons and connections. Ensuring that automatic segmentation algorithms accurately segment neurons depends on having the highest possible quality images and any error in image quality is very likely to produce segmentation errors that propagate in a non-linear fashion. For instance, if the connection between two neurons is improperly assigned, the other neurons that those pair of neurons connect to will also be improperly connected, and so on. Not only is the biological scope of the problem large, but datasets are also large, both in terms of the number of images and data size. Again, using the range of 100 µm3 to 1 cm3 datasets, these volumes will equate to 2,500 to 250,000 sections and 0.7 terabytes or 1 exabyte of data, respectively. Thus, the scope of the data both in terms of the biological goal and data management demands automation in the connectomic pipeline, in order to minimize errors and the need for manual OOF detection and correction.
2.2 Scale-space representations
We base our multi-scale histologic feature detection technique on classical scale-space representations of signals and images. We give a brief overview (see [15] for a more comprehensive review). The fundamental principle of scale-space feature detection is that natural images possess structural features at multiple scales and features at a particular scale are isolated from features at other scales. Thus, any image can be transformed into a scale-space representation , where represents the pixel intensity at pixel coordinates and scale . How to construct the representation of the image at each scale is discussed below. More importantly, such a representation lends itself readily to scale sensitive feature detection, owing to the fact that features at a particular scale are decoupled from features at other scales, thereby eliminating confounding detections. Examples of structural features that can be detected and characterized using scale-space representations include edges, corners, ridges, and so called blobs (roughly circular regions of uniform intensity).
A scale-space representation at a particular scale is constructed by convolution of the image with a filter that satisfies the following constraints: non-enhancement of local extrema, scale invariance, and rotational invariance. Other relevant constraints are discussed in [9]. One such filter is the symmetric, mean zero, two dimensional, Gaussian filter [13]:
The scale-space representation of an image is defined to be the convolution of that image with a mean zero Gaussian filter:
where determines the scale. has the interpretation that image structures of scale smaller than have been removed due to blurring. This is due to the fact that the variance of the Gaussian filter is and features of this scale are therefore “beneath the noise floor” of the filter or, in effect, suppressed by filtering procedure. A corollary is that features with approximate length scale will have maximal response upon being filtered by . That is to say, for a scale feature at pixel coordinates and for scales we have
This is due to the fact that for scales , small scale features will dominate the response and for , as already mentioned, the feature will have been suppressed.
Note that the aforementioned presumes having identified the pixel coordinates as the locus of the feature. Hence, in order to detect features across both scale and space dimensions, maximal responses in spatial dimensions need to also be characterized. For such characterization one generally employs standard calculus, in order to identify critical points of the second derivatives of . Hence, we can construct scale-sensitive feature detectors by considering critical points of linear and non-linear combinations of spatial derivatives and derivatives in scale . For example the scale derivative of the Laplacian
| (1) |
effectively detects regions of uniform pixel intensity (i.e., blobs).
Equation (1) permits a discretization called Difference of Gaussians (DoG) [18]:
Therefore, we define the following parameters: , which determines the granularity of the scales detected; , the minimum scale detected; , the maximum scale detected; ; , the discrete scales detected. We then define the discretized DoG filter:
| (2) |
This produces a sequence of filtered and scaled images (called a Gaussian pyramid [8]). Note that there are alternative conventions for how each difference in the definition of should be scaled (including partitioning into so called octaves [5]); we observe that linear scaling is sufficient, in terms of accuracy and complexity, for the purposes of detecting OOF conditions.
3 Multi-scale Histologic Feature Detection
We propose to use histologic feature detection at multiple scales as a criterion function, reasoning that the absolute quantity of features detected at multiple scales is positively correlated with DOF (see Figure 1). For our particular use case, this is tantamount to detecting histologic structures ranging from cell walls to whole organelles. The key insight is that the ability to resolve structure across the range of feature scales is highly correlated with a high-definition image. To this end, we develop a feature detector based on Equation (1) but optimized for latency (rather than accuracy).
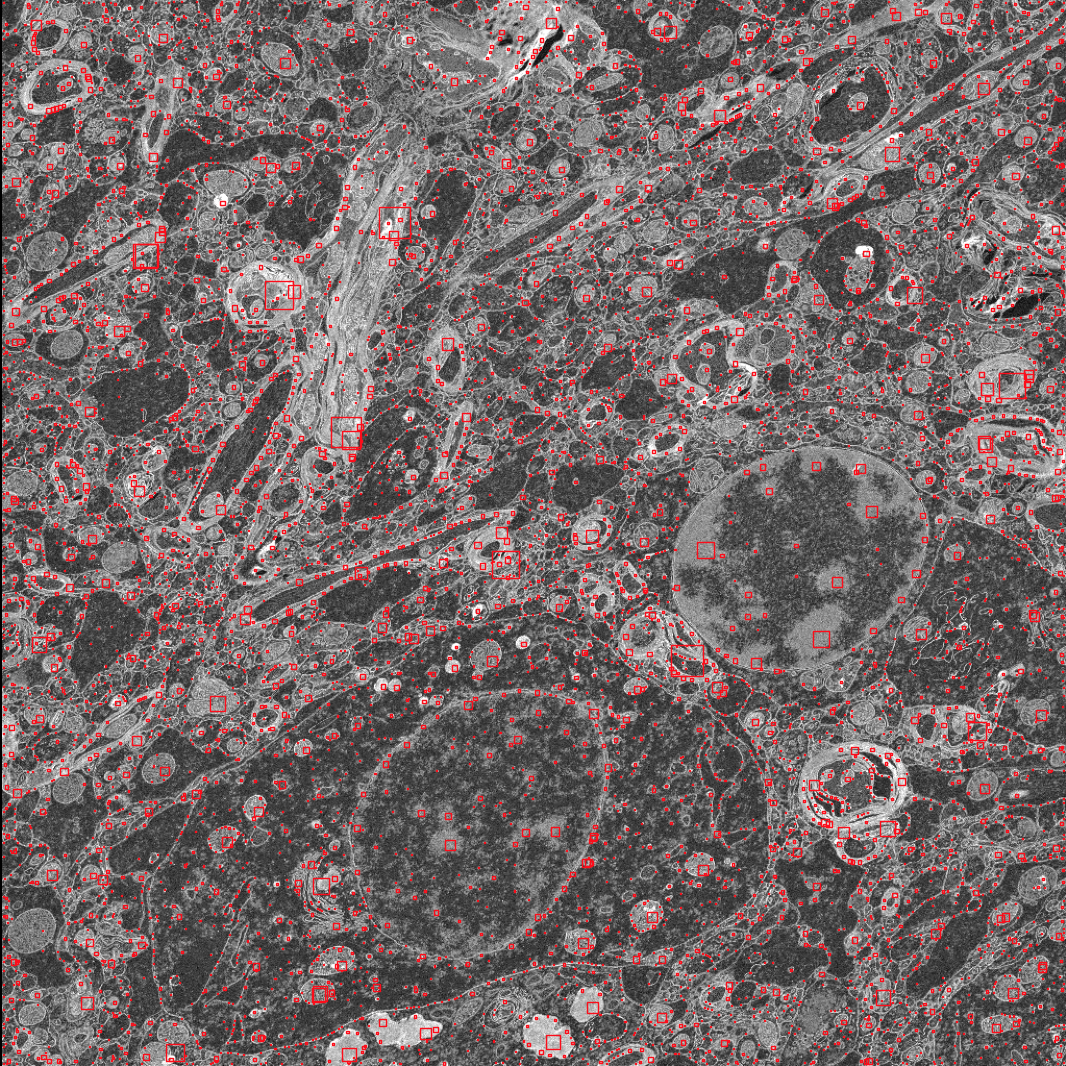
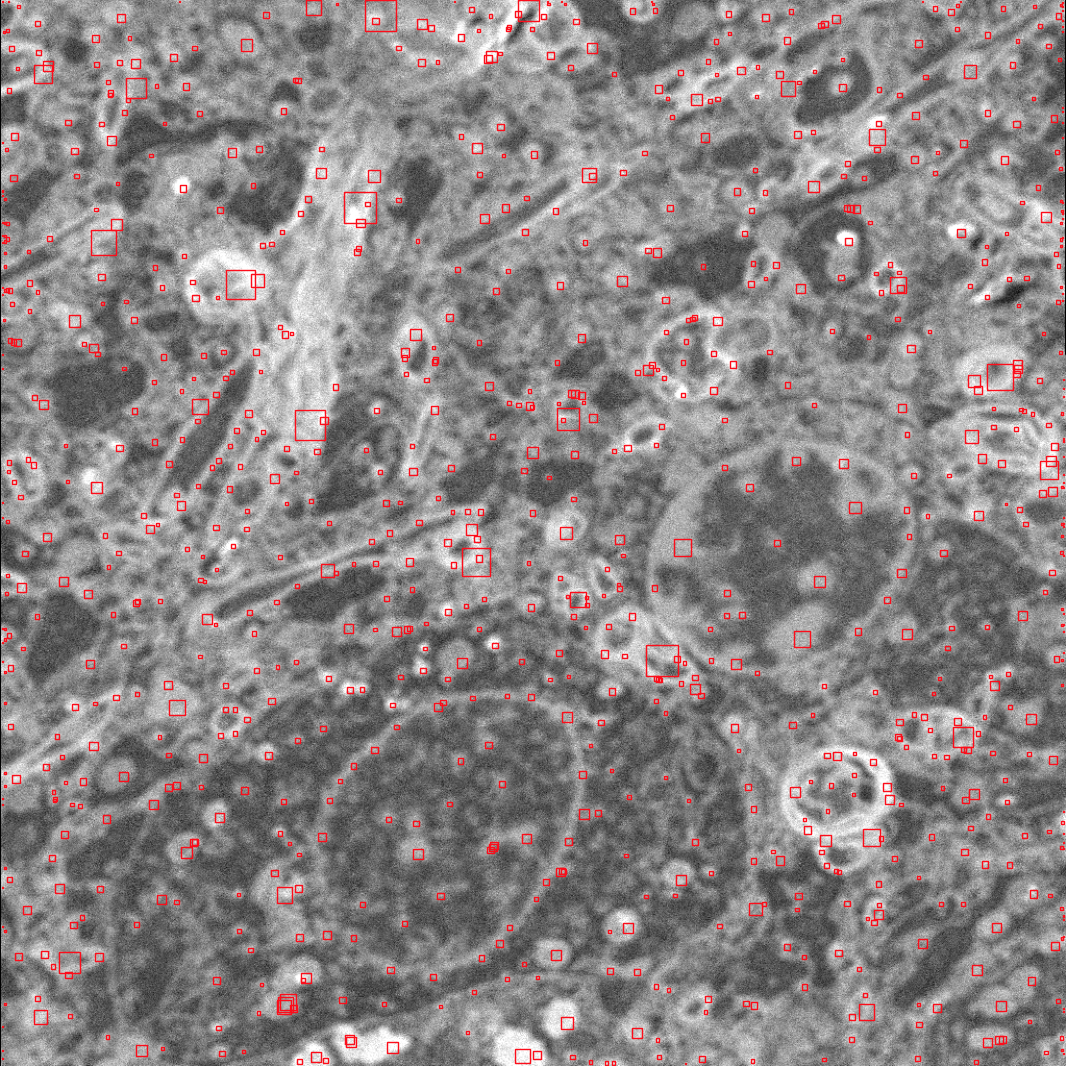
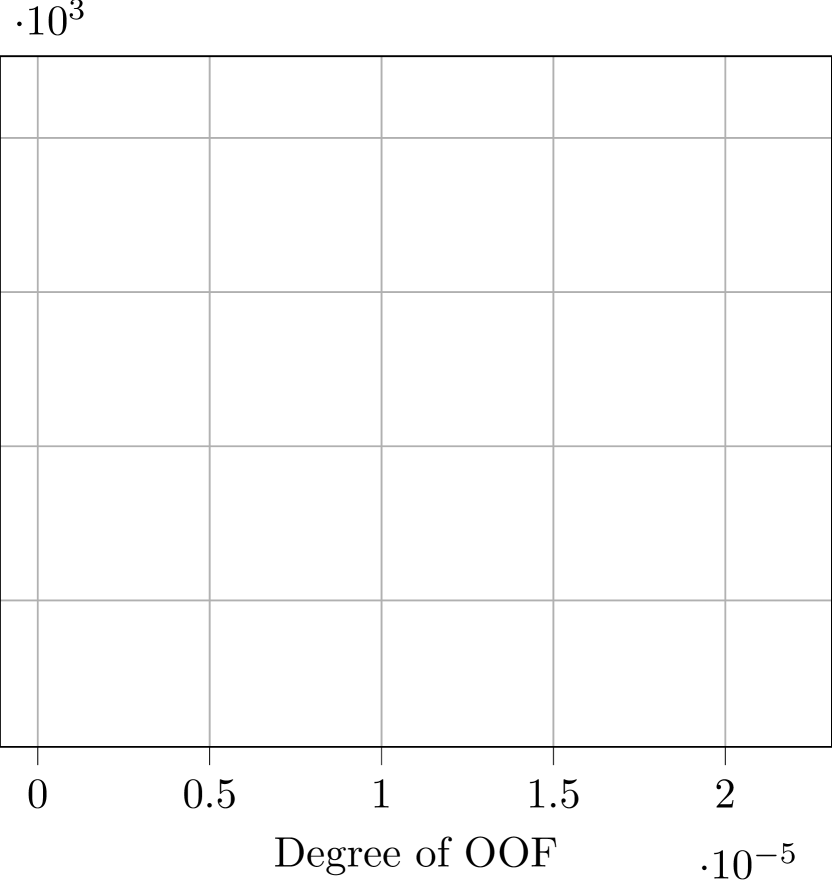
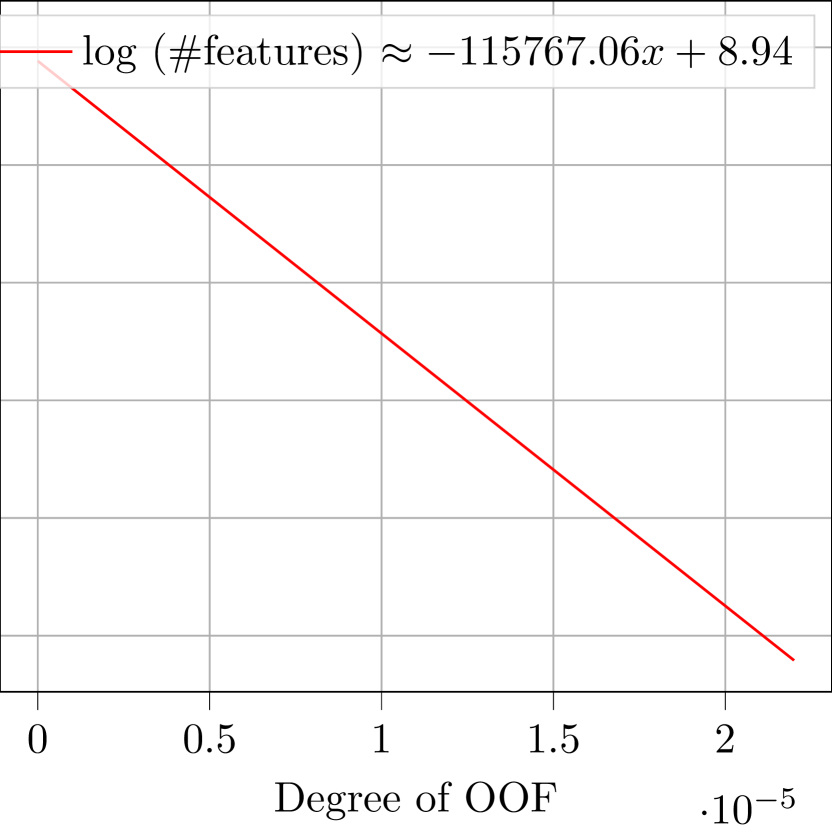
In order to verify our hypothesis, that detecting features across a range of scales is correlated with DOF, we compare the number of histologic features detected as a function of absolute deviation from in-focus ( where is the correct focal depth) for a series of sections with known focal depth (see Figure 2(a)). We observe a strong log-linear relationship (see Figure 2(b)). Fitting a log-linear relationship produces a line with , confirming our hypothesis that quantity of histologic features detected is a good proxy measure for DOF. Note that the log-linear relationship corresponds to a roughly quadratic decrease in the number of histologic features detected. This is to be expected since, intuitively, a twice improved DOF of a two dimensional image yields improved detection along both spatial dimensions and thus a four times increased quantity of histologic features detected.
Recall, we aim to achieve near-real-time quality control of SEM images to facilitate error detection and correction while data are being collected. We therefore require low-latency multi-scale histologic feature detection. Here we present the design and implementation of our system that leverages GPUs to rapidly classify images by determining their degree of focus. Our starting point is Equation (2) for possible optimizations. Computing maxima of in the scale dimension (equivalently critical points of Equation (1)) necessarily entails computing maxima in a small pixel neighborhood at every scale. We first make the heuristic assumption that, in each pixel neighborhood that corresponds to a feature, there is a single unique and maximal response at some scale . This response corresponds to the scale at which the variance of the Gaussian filter most closely corresponds to the scale of the feature (see Section 2.2). We therefore search for local maxima in spatial dimensions but global maxima in the scale dimension:
| (3) |
where the subscript indexes over the features detected. Once all such maxima are identified it suffices to compute and report the cardinality, , as the criterion function value.
It is readily apparent that our histologic feature detector is parallelizable: for each scale we can compute independently of all other (for ). A further parallelization is possible for the operation, since the maxima are computed independently across distinct neighborhoods of pixels. In order to maximally exploit this, we first perform the inner in Equation (3) on a block of columns of in parallel, thereby effectively reducing the Gaussian pyramid to a single image. Note that when GPU memory is sufficient we can compute the across all columns simultaneously (and otherwise within a constant number of steps). We then perform the outer on disjoint pixel neighborhoods of the flattened image in parallel as well.
Note that the implementation of the inner is “free”, since the primitive is implemented in exactly this way in most GPGPU libraries [19], and thus our substitution of for yields a moderate latency improvement. The outer is implemented using a comparison against (with ) (see [9307788] for details on this technique). Employing in this way has the added benefit of effectively performing non-maximum suppression [20], since it rejects spurious candidate maxima within a neighborhood of a true maximum.
Typically one would compute in the conventional way (by linearly convolving and ) but prior work has shown that performing the convolution in the Fourier domain is much more efficient [9307788]; namely
where are the Fourier transform and inverse Fourier transform, respectively. This approach has the additional advantage that we can make use of highly optimized Fast Fourier Transform (FFT) routines made available by GPGPU libraries.
One remaining detail is histogram stretching of the images. Due to the dynamic range (i.e., variable bit depth) of the microscope, we need to normalize the histogram of pixel values. We implement this normalization by saturating of the darkest pixels, saturating of the lightest pixels, and mapping the entire range to . We find this gives us consistently robust results with respect to noise and anomalous features. This histogram normalization is also parallelized using GPU primitives. We present our technique in Algorithm (1).
4 Histologic Feature Detection as a Service
A key challenge to using our histologic feature detector is that it requires powerful GPUs with large quantities of RAM, something that many commodity GPUs and edge devices lack. To make our detector generally accessible we have deployed it as an on-demand service using the funcX platform [7]. funcX is a high performance function-as-a-service platform designed to provide secure, fire-and-forget remote execution. funcX federates access to remote research cyberinfrastructure via a single, multi-tenant cloud service. Users submit a function invocation request to funcX which then routes the request to the desired endpoint for execution. Endpoints may be deployed by users on remote computing resources, including clouds, clusters, and edge devices.
We registered our MHFD tool as a funcX function, configuring it such that it requires as input arguments only the location of the input image. The function executes the MHFD tool on an accessible GPU and the resulting feature count and DOF is returned asynchronously via the funcX service. Registration as a funcX function allows others to execute the tool on their own funcX endpoints.
We enable automated invocation of the MHFD via Globus Flows [2]—a research automation platform. funcX is accessible as a Flows Action Provider, enabling users to deploy a flow that detects data creation, transfers data from instrument to analysis cluster, executes the MHFD, and returns results to users.
5 Evaluation
We evaluate our optimized histologic feature detector in terms of runtime performance (in order to assess its fitness a realtime OOF detector). Data used herein were collected using brains prepared in the same manner and as previously described [11]. Using a commercial ultramicrotome (Powertome, RMC), the cured block was trimmed to a ~1.0mm x 1.5 mm rectangle and ~2,000, 40nm thick sections were collected on polyimide tape (Kapton) using an automated tape collecting device (ATUM, RMC) and assembled on silicon wafers as previously described [12]. Images at different focal distances were acquired using backscattered electron detection with a Gemini 300 scanning electron microscope (Carl Zeiss), equipped with ATLAS software for automated imaging. Dwell times for all datasets were 1.0 microsecond.
| CPU | Dual AMD Rome 7742 @ 2.25GHz |
| GPU | 8x NVIDIA A100-40GB |
| HD | 4x 3.84 U.2 NVMe SSD |
| RAM | 1TB |
| Software | CuPy-8.3.0, CUDA-11.0, NVIDIA-450.51.05 |
We perform runtime experiments across a range of parameters of interest (section resolution, number of feature scales). Our test platform is a NVIDIA DGX A100 (see Table 1). Experiments consist of computing the DOF of a sample section for a given configuration. All experiments are repeated times (with ) and all metrics reported are median statistics, where we discard the first execution as it is an outlier due to various initializations (e.g,. pinning CUDA memory).
For a section resolution of pixels we achieve approximately a 50Hz runtime in the single GPU configuration; this is near-real-time. We observe that, as expected, runtime grows linearly with the number of feature scales and quadratically with the resolution of the section; naturally, this is owing to the parallel architecture of the GPU. The principle defect of our technique is that it is highly dependent on the available RAM of the GPU on which it is deployed. In practice, most GPUs available at the edge, i.e., proximal to microscopy instruments, will have insufficient RAM to accommodate large section resolutions and wide feature scale ranges. In fact, even the 40GB of the DGX’s A100 is exhausted at resolutions above for more than approximately 20 feature scales.
Therefore, we further investigate parallelizing MHFD across multiple GPUs. Our implementation parallelizes MHFD in a straightforward fashion: we partition the set of filters across the GPUs, perform the “lighter” FFT-IFFT pair on each constituent GPU, and then gather the results to the root GPU (arbitrarily chosen). That is to say we actually carry out
where for the set indexes the scales allocated to a node . By partitioning the set of Gaussian filters across nodes, we effectively perform distributed filtering. We use CUDA-aware OpenMPI to implement the distribution. Note that for such multi-GPU configurations the range of feature scales was chosen to be a multiple of the number of GPUs (hence the proportionally increasing sparsity of data in Figure 3(a)).
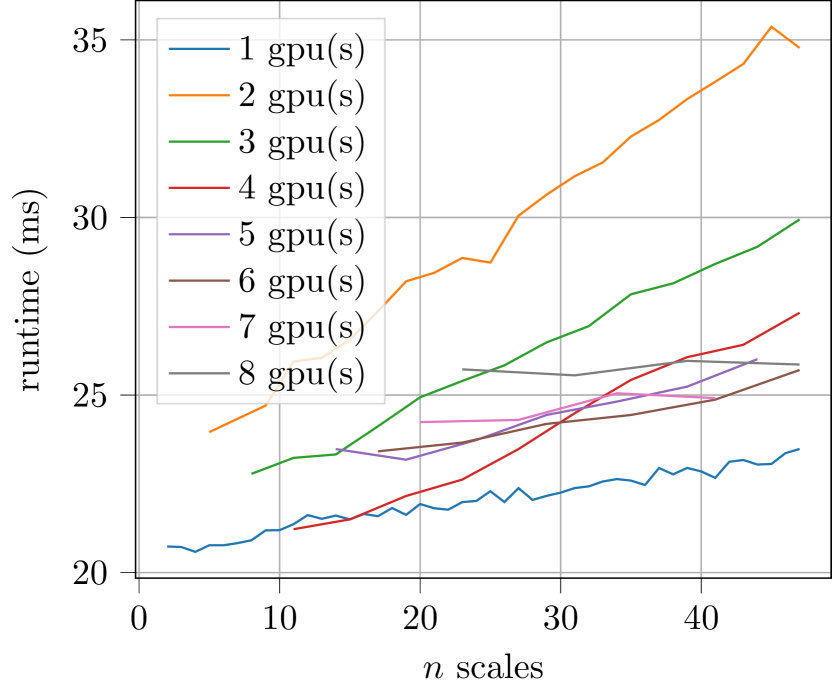

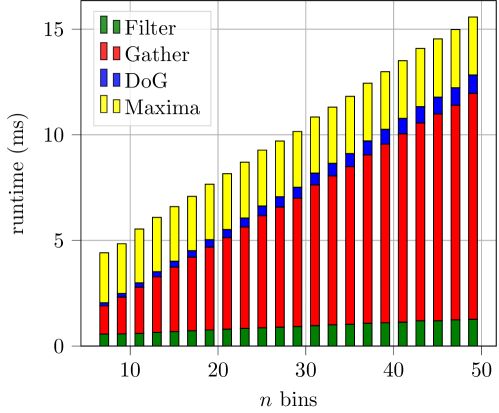
We observe that, as one would expect, runtime is inversely proportional to number of GPUs (see Figure 3(b)) but for instances where a single GPU configuration is sufficient it is also optimal. More precise timing reveals that parallelization across multiple GPUs incurs high network copy costs during the gather phase (see Figure 4). Note that this latency persists even after taking advantage of CUDA IPC [22]. In effect, this is a fairly obvious demonstration of Amdahl’s law. Therefore, parallelization across multiple GPUs should be considered in instances where full resolution section images are necessary (e.g., when feature scale ranges are very wide, with detection at the lower end of the scale being critical). In all other cases, preprocessing by downsampling, by bilinear interpolation, in order to satisfy GPU RAM constraints yields a more than reasonable tradeoff between accuracy and latency.
To evaluate the on-demand use of MHFD we deployed a funcX endpoint on the ThetaGPU cluster (Table 1). We registered our MHFD tool as a funcX function and passed the path to the test dataset as input. It is important to note that the SEM imagery is not passed through the funcX platform in these tests but instead is assumed data to be resident on the shared file system. We performed over 1000 invocations of the function after first executing a task to initialize the environment. The tests use a single GPU and a dataset with section resolution of pixels to be comparable to earlier results. Our findings show that the mean time to perform the feature detection was ms, with a standard deviation of ms, which is similar to the previous result for the same dataset when not using funcX. The mean time taken to submit the request to the funcX service and retrieve the result was ms, with a standard deviation of ms, meaning the funcX platform introduces an overhead of approximately ms. While this overhead is roughly greater than the MHFD analysis itself, the total time required to determine the focus of a dataset is suitable to classify images and report errors as data is collected. In practice, data must also be moved to the ThetaGPU cluster’s filesystem before it can be analyzed. When evaluating the time to transfer the single 23MB image from Argonne’s Structural Biology Center (where the SEM resides) to the ThetaGPU cluster, we found it was moved at over 200MB/s and took roughly ms. This is due to the two 40Gb/s connections between the SBC and computing facility.
6 Related work
Automating the control and optimization of scientific instruments is a common area of research that spans a diverse collection of devices and applies an equally diverse set of techniques, including HPC analysis, ML-in-the-loop [21], and edge-accelerated processing [16]. Laszewski et al. [14] and Bicer et al. [4] demonstrate two approaches to perform real-time processing of synchrotron light source data in order to steer experiments. Both of these cases employ HPC systems to rapidly analyze and reconstruct data to guide instruments toward areas of interest. Others have also used FPGAs to act on streams of instrument imagery [24].
There is also much work in developing and improving auto-focus algorithms and their applications to microscopy. Yeo et al. [26] was one of the first investigations of applying auto-focus to microscopy. They compare several criterion functions and conclude that the so-called Tenengrad criterion function is most accurate and most robust to noise. The crucial difference between their evaluation criteria and ours is they select for criterion functions that are suited for optical microscopy, i.e., criterion functions that are robust to staining/coloring (whereas all of our samples are grayscale). Redondo et al. [23] reviews sixteen criterion functions and their computational cost in the context of automated microscopy. Bian et al. [3] address the same issues that motivate us in that they aim to support automated processes in the face of topographic variance in the samples (which leads to comparing OOF rates). Their solutions distinguish themselves in that they employ active devices (such as low-coherence interferometry). Interestingly, seemingly contemporaneously with our project Luo et al. [17] proposed a deep learning architecture that auto-focuses in a “single-shot” manner. Such a solution is appealing given the affinity with our own application of GPGPU to the problem and we intend to experiment with applying it to our data.
7 Conclusions
We presented an OOF detection technique designed to augment existing microscopy instrumentation. Rather than focusing the microscope, as auto-focusing algorithms would, our algorithm operates downstream of image acquisition to report out-of-focus events to the user. This enables the user to intervene and initiate reacquisition protocols (on the microscope) before unknowingly proceeding with collecting the next series of images or proceeding with downstream image processing and analysis. Our technique is effective and operates at near-real-time latencies. Thus, this human-in-the-loop remediation protocol already saves the user much wasted collection time triaging defective collection runs.
Acknowledgements
This work was supported by the U.S. Department of Energy, Office of Science, under contract DE-AC02-06CH11357.
References
- [1] Abbott, L.F., Bock, D.D., Callaway, E.M., Denk, W., Dulac, C., Fairhall, A.L., Fiete, I., et al.: The mind of a mouse. Cell 182(6), 1372–1376 (2020)
- [2] Ananthakrishnan, R., Blaiszik, B., Chard, K., Chard, R., McCollam, B., Pruyne, J., Rosen, S., Tuecke, S., Foster, I.: Globus platform services for data publication. In: Practice and Experience on Advanced Research Computing. pp. 14:1–14:7 (2018)
- [3] Bian, Z., Guo, C., Jiang, S., Zhu, J., Wang, R., Song, P., Zhang, Z., Hoshino, K., Zheng, G.: Autofocusing technologies for whole slide imaging and automated microscopy. Journal of Biophotonics 13(12), e202000227 (2020)
- [4] Bicer, T., Gursoy, D., Kettimuthu, R., Foster, I.T., Ren, B., De Andrede, V., De Carlo, F.: Real-time data analysis and autonomous steering of synchrotron light source experiments. In: 13th International Conference on e-Science (e-Science). pp. 59–68. IEEE (2017)
- [5] Burt, P., Adelson, E.: The laplacian pyramid as a compact image code. IEEE Transactions on Communications 31(4), 532–540 (1983)
- [6] Carl Zeiss AG: ZEISS MultiSEM Research Partner Program (10 2018), the World’s Fastest Scanning Electron Microscopes
- [7] Chard, R., Babuji, Y., Li, Z., Skluzacek, T., Woodard, A., Blaiszik, B., Foster, I., Chard, K.: FuncX: A federated function serving fabric for science. In: Proceedings of the 29th International symposium on high-performance parallel and distributed computing. pp. 65–76 (2020)
- [8] Derpanis, K.G.: The gaussian pyramid (2005)
- [9] Duits, R., Florack, L., De Graaf, J., ter Haar Romeny, B.: On the axioms of scale space theory. Journal of Mathematical Imaging and Vision 20(3), 267–298 (2004)
- [10] Herculano-Houzel Suzana, Watson Charles, P.G.: Distribution of neurons in functional areas of the mouse cerebral cortex reveals quantitatively different cortical zones. Frontiers in Neuroanatomy 7 (2013)
- [11] Hua, Y., Laserstein, P., Helmstaedter, M.: Large-volume en-bloc staining for electron microscopy-based connectomics. Nature communications 6(1), 1–7 (2015)
- [12] Kasthuri, N., Hayworth, K.J., Berger, D.R., Schalek, R.L., Conchello, J.A., Knowles-Barley, S., Lee, D., Vázquez-Reina, A., Kaynig, V., Jones, T.R., et al.: Saturated reconstruction of a volume of neocortex. Cell 162(3), 648–661 (2015)
- [13] Koenderink, J.J.: The structure of images. Biological cybernetics 50(5), 363–370 (1984)
- [14] von Laszeski, G., Insley, J.A., Foster, I., Bresnahan, J., Kesselman, C., Su, M., Thiebaux, M., et al.: Real-time analysis, visualization, and steering of microtomography experiments at photon sources. Tech. rep., Argonne National Lab. (2000)
- [15] Lindeberg, T.: Feature detection with automatic scale selection. International Journal of Computer Vision 30, 79–116 (2004)
- [16] Liu, Z., Ali, A., Kenesei, P., Miceli, A., Sharma, H., Schwarz, N., Trujillo, D., Yoo, H., Coffee, R., Layad, N., et al.: Bridging data center ai systems with edge computing for actionable information retrieval. In: 3rd Annual Workshop on Extreme-scale Experiment-in-the-Loop Computing (XLOOP). pp. 15–23. IEEE (2021)
- [17] Luo, Y., Huang, L., Rivenson, Y., Ozcan, A.: Single-shot autofocusing of microscopy images using deep learning. ACS Photonics 8(2), 625–638 (2021)
- [18] Marr, D., Hildreth, E.: Theory of edge detection. Proceedings of the Royal Society of London. Series B. Biological Sciences 207(1167), 187–217 (1980)
- [19] Merrill, D.: Cuda unbound (cub). https://github.com/NVIDIA/cub (2021)
- [20] Neubeck, A., Van Gool, L.: Efficient non-maximum suppression. In: 18th International Conference on Pattern Recognition. vol. 3, pp. 850–855. IEEE (2006)
- [21] Pan, J., Libera, J.A., Paulson, N.H., Stan, M.: Flame stability analysis of flame spray pyrolysis by artificial intelligence. The International Journal of Advanced Manufacturing Technology 114(7), 2215–2228 (2021)
- [22] Potluri, S., Wang, H., Bureddy, D., Singh, A.K., Rosales, C., Panda, D.K.: Optimizing mpi communication on multi-gpu systems using cuda inter-process communication. In: 26th International Parallel and Distributed Processing Symposium Workshops PhD Forum. pp. 1848–1857 (2012)
- [23] Redondo, R., Cristóbal, G., Garcia, G.B., Deniz, O., Salido, J., del Milagro Fernandez, M., Vidal, J., Valdiviezo, J.C., Nava, R., Escalante-Ramírez, B., Garcia-Rojo, M.: Autofocus evaluation for brightfield microscopy pathology. Journal of Biomedical Optics 17(3), 1 – 9 (2012)
- [24] Stevanovic, U., Caselle, M., Cecilia, A., Chilingaryan, S., Farago, T., Gasilov, S., Herth, A., Kopmann, A., Vogelgesang, M., Balzer, M., et al.: A control system and streaming daq platform with image-based trigger for x-ray imaging. IEEE Transactions on Nuclear Science 62(3), 911–918 (2015)
- [25] Wildenberg, G.A., Rosen, M.R., Lundell, J., Paukner, D., Freedman, D.J., Kasthuri, N.: Primate neuronal connections are sparse in cortex as compared to mouse. Cell Reports 36(11), 109709 (2021)
- [26] Yeo, T., Ong, S., Jayasooriah, Sinniah, R.: Autofocusing for tissue microscopy. Image and Vision Computing 11(10), 629–639 (1993)
- [27] Yu Sun, Duthaler, S., Nelson, B.J.: Autofocusing algorithm selection in computer microscopy. In: International Conference on Intelligent Robots and Systems. pp. 70–76 (2005)