Classification of Emotions and Evaluation of Customer Satisfaction from Speech in Real World Acoustic Environments
Abstract
This paper focuses on finding suitable features to robustly recognize emotions and evaluate customer satisfaction from speech in real acoustic scenarios. The classification of emotions is based on standard and well-known corpora and the evaluation of customer satisfaction is based on recordings of real opinions given by customers about the received service during phone calls with call-center agents. The feature sets considered in this study include two speaker models, namely x-vectors and i-vectors, and also the well known feature set introduced in the Interspeech 2010 Paralinguistics Challenge (I2010PC). Additionally, we introduce the use of phonation, articulation and prosody features extracted with the DisVoice framework as alternative feature sets to robustly model emotions and customer satisfaction from speech. The results indicate that the I2010PC feature set is the best approach to classify emotions in the standard databases typically used in the literature. When considering the recordings collected in the call-center, without any control over the acoustic conditions, the best results are obtained with our articulation features. The I2010PC feature set includes 1584 measures while the articulation approach only includes 488 measures. We think that the proposed approach is more suitable for real-world applications where the acoustic conditions are not controlled and also it is potentially more convenient for industrial applications.
keywords:
Speech Emotion Recognition, Speech Processing, Customer SatisfactionMSC:
[2010] 00-01, 99-001 Introduction
A common practice in call-centers consists of recording and storing customer calls for posterior analyses. Those calls are listened to and evaluated with the aim of improving the quality of service (QoS). This procedure is usually hand made by randomly taking small samples from the total set of calls. During the QoS evaluation several aspects are rated including whether the call-center agent resolved the customer’s problem or need, whether the agent’s service was efficient and timely, whether the tone and volume of the agent’s voice was not offensive, whether the answer was provided calmly, whether customer got angry, among others [1]. This analysis procedure has two main disadvantages: (1) There is a double cost for rating the calls: answering the calls and evaluating them; and (2) only a very little number of call among the total set is evaluated. These aspects limit the effectiveness in the QoS evaluation and improvement process [1].
Automatic speech emotion recognition (SER) systems were introduced several years ago and have evolved a lot since then. The main drawback in this topic relies on the fact that there are almost no databases with real (non-acted) emotions appropriately rated by experts. Even though this main limitation, it has been shown that SER systems are suitable to help call-center managers in monitoring and optimizing the QoS provided by their agents [2]. These systems can potentially detect the emotional state of agents and/or customers and hence provide a QoS index. Abnormal changes in service patterns like increasing number of angry customers can be detected [3]. SER systems can efficiently and timely evaluate the total incoming calls. In spite of the relevance of these systems to assure and improve QoS, the research community is still working on the way to find better corpora appropriately labeled and systems that are robust against non-controlled acoustic conditions, which are the real-world scenarios in which the technology is actually useful.
The aim of this work is to evaluate different approaches typically used when developing automatic SER systems, and also to introduce a novel approach with features that focus on modeling phonation, articulation and prosody aspects that may vary when the emotional state of the speaker is altered. The approaches are tested upon well-known corpora typically used to evaluate automatic SER systems and also upon a new corpus that consists of recordings where customers give their opinion about the service provided by call-center agents. The recordings are labeled by experts in QoS according to whether the service requested by the customer was satisfactorily provided or not. The main differences between the typical speech emotional databases and the one introduced here include: (1) The first group of corpora includes labels about specific emotions produced by the speakers, while the call-center corpus only includes labels about customer satisfaction, and (2) most of the emotional speech databases consists of acted emotions and are recorded under controlled-acoustic conditions, while the call-center database comprises recordings of real conversations of customers and service agents that are collected without any control over the recording process or the channel. Additionally, these conversations are labeled by experts in customer service, which is the real way of evaluating these kinds of interactions in real industrial applications.
An exhaustive search of feature extraction techniques was carried out to find the most effective ones to detect emotional states in different acoustic environments. Since different investigations in SER have shown that x-vector, i-vector, and I2010PC features can efficiently represent emotions from speech [4, 5, 6, 7, 8, 9], we considered those sets in this study along with the articulation, phonation, and prosody features extracted with the DisVoice framework [10]. The classification of emotions is performed with a support vector machine (SVM) classifier, which is a standard method, well-known and has shown to be the among the most robust methods in different scenarios[11, 4, 12].
In order for our results to be comparable with other studies, three “standard” databases are considered for the classification of emotions in speech: (1) Interactive Emotional Dyadic Motion Capture (IEMOCAP), (2) Emotional database (EMODB), and (3) Ryerson Audio-Visual Database of Emotional Speech and Song (RAVDESS). To evaluate the robustness of the system to accurately evaluate customer satisfaction in real acoustic conditions, experiments with a call-center database, namely KONECTADB are included.
The rest of the paper is distributed as follows: Section 2 presents an overview of related works. Section 3 presents the main contributions. Section 4 describes the databases considered in this study. Section 5 introduces details of the methodology followed in this work. Section 6 presents the experiments and results, and finally, Section 7 includes the conclusions derived from the study and future work.
2 Related works
Many techniques have been studied to develop SER systems. In [11], the authors proposed to recognize different emotions included in the German database EMODB (happiness, boredom, neural, sadness, anger, and anxiety). The recordings were modelled with a set of 120 harmonic features along with their and . Their minimum, maximum, mean, median, and standard deviation were also computed at an utterance level, producing 1800-dimensional feature vectors per sample. Speaker-independent multi-class classification was performed using SVMs and the authors reported average recall values of 92.%, 71.48%, 87.46%, 91.42%, 98,29%, and 91.92% for the aforementioned emotions, respectively. For the multi-class classification scenario, the authors report an average accuracy of 79.51%, which is a relatively high and optimistic accuracy because the validation strategy reported by the authors was a k-fold cross-validation, which does not guarantee unbiased results. The authors in [12] worked also with the EMODB corpus and modeled the emotions with temporal, spectral and cepstral features. Statistical functionals were computed per feature vector at an utterance level. The authors reported a maximum accuracy of 80% in the multi-class classification of the different emotions included in the dataset. Note that all of the experiments were speaker-dependent, which leads to optimistic and biased results. Another relevant work in the topic of automatic emotion recognition was presented in [4]. The authors proposed a feature set that included frequency, energy/amplitude, and spectral parameters to model the speech signals. Mean, standard deviation, 20th, 50th and 80th percentiles, range between 20th and 80th percentile were the functionals computed per feature vector. The authors used a wide variate of datasets (TUM AVIC, GEMEP, EMODB, SING, FAU AIBO, and Vera-am-Mittag) to map information from the affective speech domain to the binary arousal and valence representation. An SVM classifier was trained following a leave-one-speaker-out cross-validation strategy to classify between high vs. low arousal and between positive vs. negative valence. The accuracy reported in the first scenario was 79.71% and 66.44% for the second one. Other approaches typically used to create SER systems are based on speaker representation models. For instance, the authors in [6] used i-vectors to classify emotions in two different datasets: (1) USC AudioVisual data [13] and (2) IEMOCAP [14], which are acted and spontaneous, respectively. The authors trained an SVM for the classification experiments and compared their approach w.r.t. the feature set introduced in the INTERSPEECH 2010 Paralinguistic Challenge [15]. According to their results, the system based on i-vectors yielded better performance (91.1% for USC and 71.3% for IEMOCAP). It is important to highlight that these results were achieved on speaker-dependent experiments and the hyper-parameter optimization procedure was not explained in detail, so it is not possible to known whether these results are optimistic and possibly biased.
More robust SER systems have been developed using deep learning techniques in the recent years. In [16], the authors compared 3 different network architectures: (1) Convolutional Neural Network (CNN); (2) Artificial Neural Network (ANN); and (3) Long Short Term Memory (LSTM). The IEMOCAP dataset was used to evaluate the approaches following an eight-fold-leave-two-speakers-out cross-validation scheme in all experiments. Log-Fourier transform -based filter-bank with coefficients distributed on the Mel scale were extracted. Because the authors performed a multi-class classification at a frame level, they assumed that frames belonging to a given utterance convey the same emotion as the parent utterance. Silence class was added using the labels generated by a voice activity detection system. The method was compared with prior works in the literature related to multi-class emotion classification that used the same database. Given that most works reported results at an utterance level, the posterior class probabilities computed for each frame in an utterance were averaged across all frames and an utterance-based label was selected based on the maximum average class probabilities. The authors reported that their system outperformed all the other methods in up to 2% of accuracy. In [9], the authors explored possible dependencies between speaker recognition and emotion recognition topics. They first applied the transfer learning technique to transfer information from a Resnet-based pre-trained speaker-identity-based model to an emotion classification task. They also explored how the performance of a speaker recognition model is affected by different emotions. The authors evaluated their experiments on three different datasets: IEMOCAP, MSP-Podcast, and Crema-D. Two approaches were explored: x-vectors extraction and replacement of the speaker-discriminative output layer with an emotion classification layer and then fine-tune the hyper-parameters. A total of 23 MFCCs with 25ms frame-size and 10ms frame-shift were extracted. The model was validated on a speaker-independent scenario. The best results were obtained with the transfer learning approach with accuracies of up to 70.3%, 58.46%, and 81.84 for IEMOCAP, MSP-Podcast, and Crema-D, respectively. In the same year, the authors in [17] proposed a one-dimensional CNN architecture to model emotions from speech. The input to the architecture was based on MFCCs, chromagram, Mel-scale spectrogram, Tonnetz representation, and spectral contrast features extracted from the audio files. The authors performed speaker-independent experiments with 4 classes of the IEMOCAP corpus and reported accuracies 64.3%. The experiments with RAVDESS and EMODB were speaker-dependent and the reported accuracies were 71.61% and 81.1%, respectively. Also in 2020, a novel technique was introduced in [18]. The authors proposed a method where key segments are selected based on a radial basis function network (RBFN) similarity measurement. The segments were grouped following the k-means algorithm as follows: The audios were divided into multiple chunks of 500ms and the RBFN similarity was computed. If consecutive segments did not exceed a given threshold, the number of clusters was increased by one. Thus, the number of clusters dynamically changed. Once the segments were clustered, the nearest segment with respect to the centroid was selected for each cluster to generate a new sequence, which was then converted into a spectrogram. The spectrogram was passed through a CNN network (pre-trained ResNet101) to extract high-level features. These features were normalized and used as inputs to a deep bi-directional long short term memory (BiLSTM), which made the final decision about which emotions were present in a given recording. The authors considered the three “standard” databases IEMOCAP, EMODB, and RAVDESS and reported speaker-independent accuracies of 72.25%, 85,57%, and 77.02% for IEMOCAP, EMODB, and RAVDESS, respectively.
From the literature review presented above it can be observed that most of the studies in SER classify emotions using the EMODB, IEMOCAP, and RAVDESS databases. Although these are considered as standard in the topic of SER, there is still a gap between the development of these systems and their application in real-world scenarios, where acoustic conditions are not controlled and the emotions are not acted.
3 Contributions of this work
With the aim to address the problem of automatic SER and also the problem of modeling customer satisfaction from speech recordings collected under non-controlled conditions, this study introduces the use of phonation, articulation and prosody features extracted with the DisVoice framework. The feature sets are also used in different emotional speech corpora typically considered in the literature. The results obtained with the introduced feature sets are compared with respect to three different approaches: two speaker models namely, i-vectors and x-vectors, and the Interspeech 2010 Paralinguistics Challenge (I2010PC) feature set [15]. The results show that our approach is competitive when considering the “standard” emotional speech databases and it is the better one when considering the recordings with the opinions of customers of the call-center, which were collected under non-controlled acoustic conditions.
4 Data
This work considers three speech emotional databases commonly used in the literature of SER: (1) IEMOCAP, (2) RAVDESS, and (3) EMODB. Each corpus contains audio recordings with emotional content. They constitute the standard databases for the training and evaluation of SER models. Besides these well-known corpora, we introduce here the KONECTADB corpus, which was created with audio recordings of a call-center. This corpus was collected by Konecta Group S.A.S in Medellín, Colombia an it is used in this work to evaluate the proposed approach in real-world acoustic conditions. All datasets are down-sampled to 8kHz. Further details of each corpus are presented below.
4.1 IEMOCAP
This is an audio-visual database that consists of approximately 12 hours of recordings including video, speech, motion capture of the face, and the transliterations corresponding to a total of 10039 recordings [14]. The audios were originally sampled at 16kHz with 16-bit resolution. The database is divided into five recording sessions. Two actors (one male and one female) performed scripted and improvised scenes. The database was annotated by multiple annotators into four emotional labels: anger, happiness, sadness, neutral, and frustration. There are about 10000 samples per class and the annotations are based on the average of the labels assigned by the four labelers.
4.2 RAVDESS
This is a multimodal database with emotional speech and songs [19]. Speech recordings of 24 actors (12 male and 12 female) are included. Each actor produced two lexically-matched statements in neutral north American English accent. Seven expressions with different emotional content were produced by the actors: calm, happy, sad, angry, fearful, surprise, and disgust. Besides one expression produced with neutral emotional content, the other expressions were produced twice, with normal and strong level of emotional intensity. There is a total of 1440 recordings sampled at 16kHz with 16-bit resolution. Each class contains 192 samples except the neutral one with only 96 samples.
4.3 EMODB
This database contains recordings of 10 German actors (5 male and 5 female) who produced 10 utterances [20]. Seven emotions are labeled in the recordings: anger, boredom, disgust, anxiety, happiness, sadness, and neutral. The recording process was performed in ideal acoustic conditions and using a professional audio setting. The distribution of samples among the emotions is not even, i.e., there are emotions with much less recordings than others.
4.4 KONECTADB
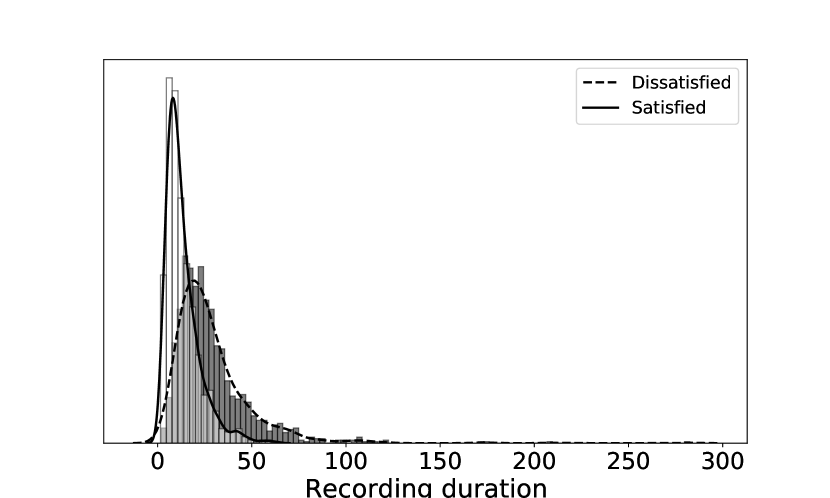
This database contains voicemails which are recorded at the end of phone-calls between customers and service-agents. In those voicemails the customers give spontaneous evaluations of the service provided by the agent. The customers were informed that their speech was going to be recorded. Due to the nature of the service, it is assumed that the speakers in these recordings are all adults. The audios were recorded at a sampling frequency of kHz and 16-bit resolution. The corpus contains 2364 recordings annotated by experts in QoS (i.e., the labelers listed to each audio file and evaluated whether the customer was satisfied or not). The experts labeled the audios as satisfied, dissatisfied, or neutral according to the degree of satisfaction expressed by the customer in the voice-mail. We only considered satisfied and dissatisfied categories in this study. There is a significant difference in the length of satisfied and dissatisfied recordings (-test with ). This can also be observed in Figure 1. Note that the dissatisfied class contains longer recordings and higher length variability than the other class. Besides, gender-balance is validated through a chi-square test (). Additional information of the database is provided in Table 1.
| Dissatisfied | Satisfied | |
| Number of samples | 1259 | 1105 |
| Duration () | 3423 s | 16 11 s |
| Number of male | 711 | 532 |
| Number of female | 548 | 573 |
5 Methodology
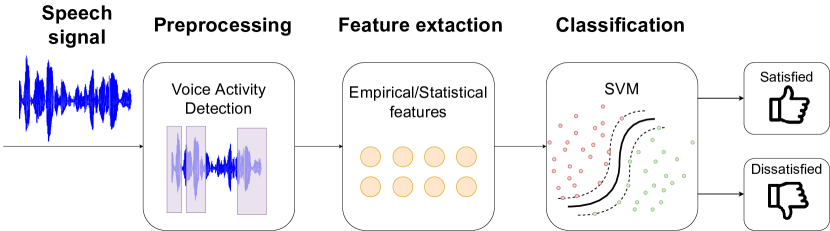
Figure 2 illustrates the overall methodology followed in this work which includes pre-processing, feature extraction, and classification.
5.1 Preprocessing
Voice activity detection (VAD) was applied to the recordings of the KONECTADB to remove long silence segments. The VAD algorithm consists of a pre-trained model based on time-delay neural networks. It was trained using the Kaldi toolkit111http://kaldi-asr.org/models.html [21].
5.2 Feature extraction
Three different approaches are considered in this study: two speaker models, the I2010PC feature set and the feature sets extracted with DisVoice, which include phonation, articulation, and prosody measures. Each feature set is described below.
5.2.1 i-vectors
Earlier studies on speaker recognition methods to model speaker traits through high-dimensional super-vectors were based on Gaussian Mixture Models (GMMs) adapted from an Universal Background Model (UBM) [22, 23, 24]. That approach produces a big set of parameters, which requires a large dataset to be trained. To solve this problem, the authors in [25] proposed a low-dimensional vector representation called identity vector (i-vector). The low-dimensional space is defined by a matrix called the total variability matrix , which models both speaker and channel variability. The new model is represented as follows:
| (1) |
where is the GMM super-vector of a speaker, is the speaker- and channel-independent super-vector (taken from an UBM super-vector), is a rectangular matrix of low rank (the total variability matrix) and is the i-vector, which is a random vector with a standard normal distribution . The concept behind this is that a low-dimensional latent vector () exists and represents the characteristics of the speaker. Equation 1 can be resolved through joint factor analysis, where represents the factor of the total variability matrix ().
In this work we consider a total of 1000 recordings with an average duration of 22 seconds per recording to train the UBM and the matrix. These recording were provided by Konecta Group S.A.S.®. The recordings were randomly selected and do not come from the same speakers of the KONECTADB. The implementation of this approach was performed with the Kaldi toolkit [21].
5.2.2 x-vectors
These are Deep Neural Network (DNN) embedding features, which were trained for speaker recognition and verification. Table 2 shows details of the architecture of the DNN to extract the x-vectors.
| Layer | Layer Context | Total Context | Input x output |
|---|---|---|---|
| Frame1 | 5 | 120x512 | |
| Frame2 | 9 | 1536x512 | |
| Frame3 | 15 | 1536x512 | |
| Frame4 | 15 | 512x512 | |
| Frame5 | 15 | 512x1500 | |
| Stats pooling | 1500Tx3000 | ||
| Segment6 | 3000x512 | ||
| Segment7 | 512x512 | ||
| Softmax | 512x |
The input features are MFCCs extracted from 24-dimensional filter banks with a frame-length of 25ms and a step-size of 10ms. The spectrogram is mean-normalized over a sliding window of up to 3 seconds. The first five layers operate at a frame level and build their context according to the previous layer. The stats pooling computes the mean and standard deviation from the output of the Frame5 layer using all frames of the signal. The mean and standard deviation are concatenated and propagated through the segment-level layers. Finally, the softmax layer predicts the speaker. The output of the segment6 layer is extracted to create the x-vector. The implementation of this approach was also performed with the Kaldi toolkit [21].
5.2.3 The I2010PC feature set
The I2010PC feature set is extracted by following three steps: (1) The 38 low-level descriptors show in Table 3 are computed with a step-size of 10ms and a Hanning window with 25ms of length (except pitch related features, which are extracted from Gaussian windows of 60ms); all instances are smoothed using a moving average filter of 3 frames. (2) Besides the low-level descriptors, 38 first-order regression coefficients are included. (3) A total of 21 statistical functionals shown in Table 3 are computed per feature vector. More information and details about how to extract these features can be found in [15].
| Descriptors | Functionals |
|---|---|
| PCM loudness | Position max./min. |
| MFCC [0-14] | arith. mean, std. desviation |
| log Mel Freq. Band [0-7] | skewness, kurtosis |
| LSP Frequency [0-7] | lin. regression coeff. 1/2 |
| F0 | lin. regression error Q/A |
| F0 Envelope | quartile 1/2/3 |
| Voicing Prob. | quartile range 2-1/3-2/3-1 |
| Jitter local | percentile 1/99 |
| Jitter consec. frame pairs | percentile range 99-1 |
| Shimmer local | up-level time 75/90 |
5.2.4 Phonation, articulation and prosody features
These features are extracted with the DisVoice framework [10], which was originally developed to model neurological disorders and now we want to evaluate its suitability to model emotional speech signals and customer satisfaction. The source code to extract the features presented in this subsection can be found in [10].
Phonation:
The phonatory characteristics of a speaker have been typically analyzed in terms of features related to perturbation measures such as jitter (temporal changes in the fundamental frequency), shimmer (amplitude changes in the signal), amplitude perturbation quotient (APQ), and pitch perturbation quotient (PPQ). APQ and PPQ are long-term perturbation measures of the amplitude and the fundamental frequency of the signal, respectively. Fuller et al. found that perturbation measures like jitter are a reliable indicator of stressor-provoked anxiety [27]. Additionally, the results reported in [28] show that jitter and shimmer are useful to model emotion and stress patterns in speech. The phonation features considered in this work include the first and second derivative of the fundamental frequency, jitter, shimmer, APQ, PPQ, and logarithmic energy. These measures are computed upon voiced segments. The global representation per speaker consists of the mean, standard deviation, skewness, and kurtosis of the resulting feature vector.
Articulation: This feature set is inspired in the fact that the transition between voiced and unvoiced segments encodes relevant information about the capability of the speaker to produce well-articulated utterances. In previous studies we have shown that this approach is valid for neurological disorders where speech production is affected [29, 10]. Now we want to evaluate its suitability to model emotional speech and customer satisfaction. The main hypothesis is that people under stress due to a bad quality of service or simply due to the need for a quick solution, are prone to produce more hesitations while speaking. This phenomenon could be associated to abnormal energy patterns in the vicinity of the border between voiced and unvoiced sounds, i.e., around the time when vocal fold vibration starts and/or finishes.
Besides the aforementioned hypothesis, the use of the Teager Energy Operator (TEO) is introduced. The authors in [30] show that the source of speech production is not actually a laminar airflow. Instead, it consists of vortex-flow interactions with the vocal tract boundaries. There is evidence that shows these air vortices to be generated during the early opening phase and the latter closing phase of the vocal fold, as occurred during the transitions between voiced and unvoiced segments [31]. In addition, it is believed that changes in vocal system physiology induced by stressful and/or fearful conditions such as muscle tension affect the vortex-flow interaction patterns in the vocal tract [32]. These changes directly affect the spectrum of the speech signal. Thus, feature sensitive to the presence of these additional vortices between the transitions could help to detect the emotional state of the speaker. In this case the main assumption is that if the speaker’s speech is altered due to changes in the emotional state, then such changes will produce abnormal articulation patterns during speech production.
The complete articulation feature set includes the first two formants with their first and second derivatives extracted from the voiced segments. The energy in the transitions between voiced and unvoiced segments which is computed and distributed according to the Bark bands, and MFCCs with their first and second derivatives are also measured in the aforementioned transitions.
Prosody: Two types of prosodic features can be found in the literature: basic and compound. Basic prosody attributes include loudness, pitch, voice quality, duration, speaking rate, and pauses. Variations of these measures over time constitute the compound prosodic attributes, which are intonation, accentuation, prosodic phrases, rhythm, and hesitation [33]. Human beings typically use prosody features to identify emotions present in daily conversations [34]. For instance, in active emotions like anger, pitch and energy are high while they are relatively low in passive emotions like sadness. This paper considers prosodic features based on duration, fundamental frequency, and energy to model emotional patterns in speech. Several statistical functionals are computed per feature vector including mean value, standard deviation, skewness, kurtosis, maximum, and minimum. Details of the methods and algorithms to extract these features can be found in [10].
5.3 Classification and Evaluation
The classification process is performed with a soft-margin SVM with a Gaussian kernel. This classifier has two parameters, complexity and the kernel bandwidth . These two parameters are optimized in a grid-search up to powers of ten where and . To avoid biased or optimistic results, a nested cross-validation strategy is followed [35]. We considered 5 folds for outer and also for inner cross-validation. Both scenarios, speaker-independent and speaker-dependent, are considered in the experiments about emotion classification.
6 Experiments and results
Different experiments are performed with the different datasets considered in this study. Experiments with IEMOCAP, EMODB, and RAVDESS are all multi-class, i.e., all emotions included in these corpora are considered. The experiments with the KONECTADB corpus are bi-class, where the aim is to discriminate between satisfied vs. dissatisfied customers. The results are reported in terms of Unweighted Average Recall (UAR) and Accuracy (ACC). Optimal hyper-parameters found for each classification experiment are also reported to allow direct comparisons in future studies. The symbol in the feature representation means fusion with other feature sets, while art, pro, and pho are articulation, prosody, and phonation, respectively.
6.1 Experiments with IEMOCAP
Table 4 shows the performance of the classifier on the IEMOCAP database. Note that, for both speaker-independent and speaker-dependent scenarios, the best results are obtained with the I2010PC feature set with UARs of 58.9% and 68.1%, respectively. The second best approach is the one based on x-vectors which yields UARs of 57.6% and 65.4%, respectively. The third best model is the combination ‘art+pro+pho’ which achieved 57.0% and 61.3% of UAR, respectively. It is important to highlight that the third best model is very close to I2010PC in the speaker-independent scenario, which is the most realistic and unbiased one. Additionally, note that the proposed approach uses much less features in comparison to the I2010PC feature set which extracts a total of 1582 features.
| Feature set | Speaker independent | Speaker dependent | ||||||
|---|---|---|---|---|---|---|---|---|
| UAR | ACC | UAR | ACC | |||||
| I2010PC | 10 | 0.001 | 58.9 | 57.4 | 1 | 0.001 | 68.1 | 67.2 |
| i-vector | 1 | 0.01 | 53.5 | 51.1 | 1 | 0.01 | 60.2 | 57.5 |
| x-vector | 1 | 0.001 | 57.6 | 55.9 | 1 | 0.001 | 65.4 | 63.9 |
| articulation | 1 | 0.001 | 54.0 | 51.9 | 1 | 0.001 | 59.5 | 57.2 |
| prosody | 1 | 0.0001 | 44.5 | 41.2 | 100 | 0.0001 | 48.1 | 45.2 |
| phonation | 1 | 0.001 | 46.0 | 43.0 | 100 | 0.001 | 48.5 | 45.4 |
| art+pro | 1 | 0.001 | 56.1 | 54.2 | 1 | 0.001 | 60.7 | 58.5 |
| art+pho | 1 | 0.001 | 56.0 | 53.6 | 1 | 0.001 | 59.9 | 57.6 |
| pro+pho | 1 | 1e-5 | 47.5 | 44.9 | 10 | 0.0001 | 50.4 | 47.6 |
| art+pro-pho | 1 | 0.001 | 57.0 | 54.7 | 1 | 0.001 | 61.3 | 59.3 |
6.2 Experiments with EMODB
The results obtained with the EMODB corpus are shown in Table 5. In the speaker-independent scenario the best UAR is 74% which is obtained with the I2010PC feature set. The second and the third best models are ‘art+pro’ and ‘art+pho’ with UARs of 64% and 61.5%, respectively. In the speaker-dependent scenario the best three models are x-vectors, I2010PC, and i-vectors, respectively. These results confirm the capability of the x-vectors to model speaker characteristics [36].
Although some studies reviewed in Section 2 reported better results, those were optimistic because they considered the same set to train and evaluate the classifier. For example, the authors in [4, 11] used an SVM to do the classification and reported accuracies above 79% on the speaker-independent scenario. However, these results were achieved on the same set that was used to optimize the classifier. Instead, we followed a nested cross-validation strategy, where the test set is unseen by the optimal parameters, leading to more realistic and unbiased results.
| Feature set | Speaker independent | Speaker dependent | ||||||
|---|---|---|---|---|---|---|---|---|
| UAR | ACC | UAR | ACC | |||||
| I2010PC | 10 | 0.0001 | 74.0 | 73.3 | 10 | 0.001 | 84.6 | 85.6 |
| i-vector | 10 | 0.01 | 59.6 | 60.7 | 10 | 0.01 | 73.6 | 74.2 |
| x-vector | 10 | 0.0001 | 60.9 | 61.4 | 10 | 0.0001 | 86.0 | 86.0 |
| articulation | 1 | 0.001 | 58.9 | 62.7 | 10 | 0.001 | 69.3 | 71.2 |
| prosody | 10 | 0.01 | 56.4 | 58.8 | 10 | 0.01 | 54.7 | 56.9 |
| phonation | 1000 | 0.001 | 50.3 | 52.2 | 10 | 0.01 | 52.5 | 53.9 |
| art+pro | 10 | 0.001 | 64.0 | 67.6 | 1 | 0.001 | 59.3 | 61.2 |
| art+pho | 10 | 0.0001 | 61.5 | 65.0 | 1 | 0.001 | 60.7 | 63.5 |
| pro+pho | 1 | 0.001 | 53.9 | 55.1 | 1 | 0.01 | 58.9 | 62.7 |
| art+pro+pho | 10 | 0.0001 | 55.1 | 57.7 | 1 | 0.001 | 50.5 | 50.7 |
6.3 Experiments with RAVDESS
Table 6 shows the results obtained with the RAVDESS database. Similar to the results obtained in the previous experiments, in the speaker-independent scenario the best three models are I2010PC, x-vectors, and ‘art+pro+pho’, with UARs of 58.7%, 58.6%, and 47.1%, respectively. In the speaker-dependent scenario the best model is the one based on x-vectors with an UAR of 83.4%, while the second and third best models are I2010PC and i-vectors with UARs of 70.9% and 64.6%, respectively.
There are several works, most of them based on deep learning, that achieve accuracies of up to 70.0% in the speaker-independent scenario using the RAVDESS database [17, 18, 7]. However, it is not possible to know whether those results are based on unseen data. In the speaker-dependent scenario, x-vector achieved better performance (83.4% ACC) than those obtained by the authors in [18] (82.41% ACC), where a more complex model was proposed.
| Feature set | Speaker independent | Speaker dependent | ||||||
|---|---|---|---|---|---|---|---|---|
| UAR | ACC | UAR | ACC | |||||
| I2010PC | 10 | 1e-5 | 58.7 | 57.6 | 10 | 1e-4 | 70.9 | 70.5 |
| i-vector | 1 | 0.01 | 44.7 | 45.3 | 10 | 0.01 | 64.6 | 64.1 |
| x-vector | 10 | 0.001 | 58.6 | 58.7 | 10 | 0.001 | 83.4 | 83.5 |
| articulation | 10 | 0.001 | 43.6 | 44.4 | 1 | 0.001 | 46.4 | 46.6 |
| prosody | 1 | 0.01 | 37.0 | 36.5 | 10 | 0.01 | 39.1 | 38.8 |
| phonation | 1e5 | 1e-4 | 34.1 | 33.5 | 100 | 0.001 | 37.8 | 36.8 |
| art+pro | 10 | 0.001 | 46.9 | 48.1 | 10 | 0.001 | 53.8 | 54.5 |
| art+pho | 1 | 0.001 | 46.9 | 47.2 | 10 | 0.001 | 46.9 | 47.4 |
| pro+pho | 10 | 0.01 | 39.0 | 39.0 | 10 | 0.001 | 40.0 | 39.9 |
| art+pro+pho | 10 | 0.001 | 47.1 | 47.8 | 10 | 0.001 | 53.9 | 54.4 |
6.4 KONECTADB experiment
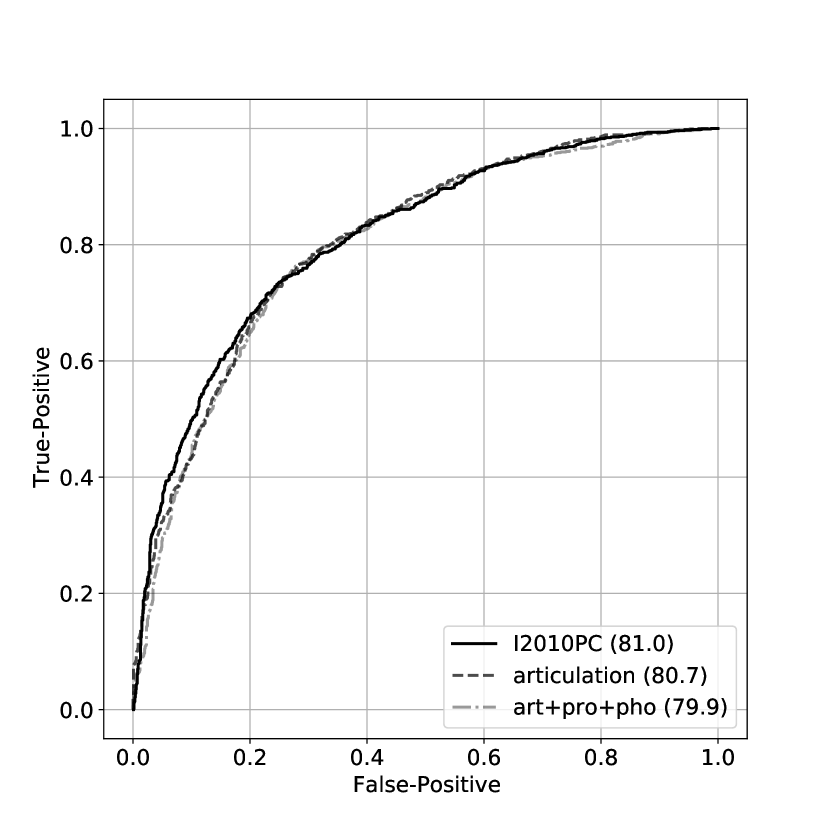
All recordings in the KONECTADB corpus were collected from different customers and only the speaker-independent scenario was addressed. Table 7 shows the results obtained when classifying between satisfied and dissatisfied customers. Note that the best performance is achieved with the ‘articulation’ feature set with an accuracy of 74.3%. The second best ACC is obtained with the ‘art+pro+pho’ model (73.8%), and the third best result is observed with the I2010PC feature set (73.6%). It is important to highlight that in these experiments, which are based on recordings collected under non-controlled acoustic conditions and considering non-acted opinions of the received service, speaker models -based approaches do not show good performances, which is opposite to what we observed in some of the previous results where the x-vector approach seemed to be competitive. Besides numerical results, ROC curves are included in Figure 3 with the aim to show the results more compactly. Note that the overall performance of the top three methods is similar.
| Feature set | UAR | ACC | SEN | SPE | ||
|---|---|---|---|---|---|---|
| I2010PC | 10 | 1e-4 | 72.8 | 73.6 | 62.8 | 82.9 |
| i-vector | 100 | 0.001 | 59.6 | 61.2 | 60.8 | 62.8 |
| x-vector | 10 | 1e-4 | 67.3 | 67.6 | 62.0 | 72.5 |
| prosody | 1 | 1e-4 | 66.0 | 66.4 | 60.7 | 71.2 |
| articulation | 0.1 | 0.001 | 74.2 | 74.3 | 72.4 | 76.0 |
| phonation | 100 | 0.001 | 67.0 | 67.4 | 60.6 | 73.4 |
| art+pro | 0.1 | 0.001 | 68.9 | 69.7 | 57.7 | 80.1 |
| art+pho | 0.1 | 0.001 | 68.8 | 69.0 | 66.2 | 71.4 |
| pro+pho | 2000 | 1e-5 | 64.1 | 63.2 | 77.0 | 51.3 |
| art+pro+pho | 1 | 0.01 | 73.6 | 73.8 | 69.9 | 77.3 |
The results presented above likely indicate that the introduced approach is more robust against non-controlled acoustic conditions, which are realistic and may include channel distortions, microphone imperfections, and highly variable acoustic conditions.
7 Conclusions and discussion
This work evaluates different “standard’ feature sets typically used to classify emotions in speech, and also presents a novel approach based on modeling phonation, articulation and prosody aspects that may vary when the emotional state of the speaker is changed. The methods are also evaluated in the problem of classifying customer satisfaction based on speech recordings where customers give their opinion about the received service. The databases with emotional speech recordings are those typically used in the literature, which consider acted emotions, limited number of speakers, and relatively controlled acoustic conditions. Conversely, the database recorded in the call-center was collected without any control over the communication channel or microphone, and considers recordings of real opinions (i.e., non-acted) of the customers about the received service.
The results show that the I2010PC features achieved the best results when classifying emotional speech. In this scenario, features included in our proposed approach were in the top-three of the best feature sets. For the case of customer satisfaction evaluation, our approach based on articulation features yields the best results, followed by the combination of articulation, phonation, and prosody features. The third best feature set is I2010PC. Regarding the speaker models, x-vectors outperformed the rest of approaches in two of the three databases where the speaker-dependent scenario was considered. This was expected since this method has shown excellent results in modeling speaker-specific information.
We believe that our approach is highly competitive considering for instance, the reduced number of features extracted with the articulation approach (488) compared to the 1584-dimensional feature vector extracted with the I2010PC toolkit. Additionally, the results when considering non-controlled acoustic conditions and non-acted opinions about a received service make us to think that the proposed approach is more convenient for industrial applications.
Acknowledgements
This work received funding from CODI from the University of Antioquia grant # PRG2020-34068.
References
- [1] G. Zweig, O. Siohan, G. Saon, B. Ramabhadran, D. Povey, L. Mangu, B. Kingsbury, Automated quality monitoring in the call center with ASR and maximum entropy, in: Proceedings of the IEEE International Conference on Acoustics, Speech and Signal Processing, 2006, pp. 589–592.
- [2] G. Mishne, D. Carmel, R. Hoory, A. Roytman, A. Soffer, Automatic analysis of call-center conversations, in: Proceedings of the ACM International Conference on Information and Knowledge Management, 2005, pp. 453–459.
- [3] B. Schuller, S. Steidl, A. Batliner, F. Burkhardt, L. Devillers, C. MüLler, S. Narayanan, Paralinguistics in speech and language –state-of-the-art and the challenge, Computer Speech & Language 27 (2013) 4–39.
- [4] F. Eyben, K. Scherer, B. Schuller, J. Sundberg, E. André, C. Busso, L. Devillers, J. Epps, P. Laukka, S. Narayanan, et al., The Geneva minimalistic acoustic parameter set (GeMAPS) for voice research and affective computing, IEEE Transactions on Affective Computing 7 (2015) 190–202.
- [5] L. Guo, L. Wang, J. Dang, Z. Liu, H. Guan, Exploration of complementary features for speech emotion recognition based on kernel extreme learning machine, IEEE Access 7 (2019) 75798–75809.
- [6] R. Xia, Y. Liu, Using i-vector space model for emotion recognition, in: Proceedings of the Annual Conference of the International Speech Communication Association, 2012, pp. 2230–2233.
- [7] M. Jalal, E. Loweimi, R. Moore, T. Hain, Learning temporal clusters using capsule routing for speech emotion recognition., in: Proceedings of the Annual Conference of the International Speech Communication Association, 2019, pp. 1701–1705.
- [8] H. Khaki, E. Erzin, Continuous emotion tracking using total variability space, in: Proceedings of the Annual Conference of the International Speech Communication Association, 2015, pp. 1299–1303.
- [9] R. Pappagari, T. Wang, J. Villalba, N. Chen, N. Dehak, x-vectors meet emotions: A study on dependencies between emotion and speaker recognition, in: Proceedings of the IEEE International Conference on Acoustics, Speech and Signal Processing, 2020, pp. 7169–7173.
- [10] J. Orozco-Arroyave, J. Vásquez-Correa, J. Vargas-Bonilla, R. Arora, N. Dehak, P. Nidadavolu, H. Christensen, F. Rudzicz, M. Yancheva, H. Chinaei, et al., Neurospeech: An open-source software for parkinson’s speech analysis, Digital Signal Processing 77 (2018) 207–221.
- [11] K. Wang, N. An, B. N. Li, Y. Zhang, L. Li, Speech emotion recognition using fourier parameters, IEEE Transactions on Affective Computing 6 (2015) 69–75.
- [12] N. Semwal, A. Kumar, S. Narayanan, Automatic speech emotion detection system using multi-domain acoustic feature selection and classification models, in: Proceedings of the IEEE International Conference on Identity, Security and Behavior Analysis, 2017, pp. 1–6.
- [13] C. Busso, Z. Deng, S. Yildirim, M. Bulut, C. Lee, A. Kazemzadeh, S. Lee, U. Neumann, S. Narayanan, Analysis of emotion recognition using facial expressions, speech and multimodal information, in: Proceedings of the International Conference on Multimodal Interfaces, 2004, pp. 205–211.
- [14] C. Busso, M. Bulut, C. Lee, A. Kazemzadeh, E. Mower, S. Kim, J. Chang, S. Lee, S. Narayanan, IEMOCAP: Interactive Emotional Dyadic Motion Capture Database, Language Resources and Evaluation 42 (4) (2008) 335.
- [15] B. Schuller, S. Steidl, A. Batliner, F. Burkhardt, L. Devillers, C. Müller, S. Narayanan, The INTERSPEECH 2010 paralinguistic challenge, in: Proceedings of the Annual Conference of the International Speech Communication Association, 2010, pp. 2794–2797.
- [16] H. Fayek, M. Lech, L. Cavedon, Evaluating deep learning architectures for speech emotion recognition, Neural Networks 92 (2017) 60–68.
- [17] D. Issa, M. Demirci, A. Yazici, Speech emotion recognition with deep convolutional neural networks, Biomedical Signal Processing and Control 59.
- [18] M. Sajjad, S. Kwon, et al., Clustering-based speech emotion recognition by incorporating learned features and deep bilstm, IEEE Access 8 (2020) 79861–79875.
- [19] S. R. Livingstone, F. A. Russo, The Ryerson Audio-Visual Database of Emotional Speech and Song (RAVDESS): A dynamic, multimodal set of facial and vocal expressions in north american english, PloS one 13.
- [20] F. Burkhardt, A. Paeschke, M. Rolfes, W. F. Sendlmeier, B. Weiss, A database of german emotional speech, in: Ninth european conference on speech communication and technology, 2005.
- [21] D. Povey, A. Ghoshal, G. Boulianne, L. Burget, O. Glembek, N. Goel, M. Hannemann, P. Motlicek, Y. Qian, P. Schwarz, J. Silovsky, G. Stemmer, K. Vesely, The Kaldi Speech Recognition Toolkit, in: Proceedings of the IEEE Workshop on Automatic Speech Recognition and Understanding, 2011.
- [22] W. Campbell, D. Sturim, D. Reynolds, Support Vector Machines using GMM supervectors for speaker verification, IEEE Signal Processing Letters 13 (2006) 308–311.
- [23] W. Campbell, D. Sturim, D. Reynolds, A. Solomonoff, SVM based speaker verification using a GMM supervector kernel and NAP variability compensation, in: Proceedings of the IEEE International Conference on Acoustics, Speech and Signal processing, 2006, pp. 97–100.
- [24] C. You, K. Lee, H. Li, An SVM kernel with GMM-supervector based on the Bhattacharyya distance for speaker recognition, IEEE Signal Processing Letters 16 (1) (2008) 49–52.
- [25] N. Dehak, R. Dehak, P. Kenny, N. Brümmer, P. Ouellet, P. Dumouchel, Support Vector Machines versus fast scoring in the low-dimensional total variability space for speaker verification, in: Proceedings of the Annual Conference of the International Speech Communication Association, 2009, pp. 1559–1562.
- [26] D. Snyder, D. Garcia-Romero, G. Sell, D. Povey, S. Khudanpur, x-vectors: Robust DNN embeddings for speaker recognition, in: Proceedings of the IEEE International Conference on Acoustics, Speech and Signal Processing, 2018, pp. 5329–5333.
- [27] B. Fuller, Y. Horii, D. Conner, Validity and reliability of nonverbal voice measures as indicators of stressor-provoked anxiety, Research in Nursing & Health 15 (1992) 379–389.
- [28] X. Li, J. Tao, M. Johnson, J. Soltis, A. Savage, K. Leong, J. Newman, Stress and emotion classification using jitter and shimmer features, in: Proceedings of the IEEE International Conference on Acoustics, Speech and Signal Processing, 2007, pp. 1081–1084.
- [29] J. Orozco-Arroyave, Analysis of speech of people with parkinson’s disease, Vol. 41, Logos-Verlag, 2016.
- [30] H. Teager, Some observations on oral air flow during phonation, IEEE Transactions on Acoustics, Speech, and Signal Processing 28 (1980) 599–601.
- [31] L. He, Stress and emotion recognition in natural speech in the work and family environments, PhD, Rmit University (2010) 1–218.
- [32] G. Zhou, J. Hansen, J. Kaiser, Nonlinear feature based classification of speech under stress, IEEE Transactions on Speech and Audio Processing 9 (2001) 201–216.
- [33] R. Kompe, R. Kompe, Prosody in speech understanding systems, Vol. 1307, Springer, 1997.
- [34] K. Rao, S. Koolagudi, R. Vempada, Emotion recognition from speech using global and local prosodic features, International Journal of Speech Technology 16 (2013) 143–160.
- [35] S. Parvandeh, H. Yeh, M. Paulus, B. McKinney, Consensus features nested cross-validation, Bioinformatics 36 (2020) 3093–3098.
- [36] D. Raj, D. Snyder, D. Povey, S. Khudanpur, Probing the information encoded in x-vectors, in: Proceedings of the IEEE Automatic Speech Recognition and Understanding Workshop, 2019, pp. 726–733.