A Near-Infrared Search for Molecular Gas in the Fermi Bubbles
Abstract
We present Gemini/NIFS near-IR integral field spectroscopy of the fields-of-view around two AGNs behind the Fermi Bubbles (PDS 456 (catalog ) and 1H1613-097 (catalog )) to search for molecular gas in the Milky Way’s nuclear wind. These two AGN sightlines were selected by the presence of high-velocity neutral and ionized gas seen in UV absorption. We do not detect any extended emission from the H2 ro-vibrational S(0) and S(1) lines at 2.224 and 2.122 m in either direction. For the H2 1-0 S(1) line, the 3 surface brightness limits derived from spectra extracted across the full NIFS field-of-view are 2.410-17 erg cm-2 s-1 Å-1 arcsec-2 for PDS 456 (catalog ) and 4.910-18 erg cm-2 s-1 Å-1 arcsec-2 for 1H1613-097 (catalog ). Given these non-detections, we conclude that CO emission studies and H2 UV absorption studies are more promising approaches for characterizing molecular gas in the Fermi Bubbles.
August 26, 2021
1 Introduction
Extending for 10 kpc on either side of the Galactic Center, the Fermi Bubbles trace an explosive event from the heart of the Milky Way (Su et al., 2010). The bubbles are filled with hot plasma at K (Crocker et al., 2015) but contain a population of cool embedded high-velocity clouds (HVCs). These Fermi Bubble HVCs have been detected at many wavelengths, including H I 21 cm emission (Di Teodoro et al., 2018), ultraviolet (UV) metal absorption (Fox et al., 2015; Ashley et al., 2020), H emission (Krishnarao et al., 2020), and sub-mm CO emission (Di Teodoro et al., 2020).
In this research note we explore the Fermi Bubble HVCs in a new wavelength regime: near-IR spectroscopy. The near-IR contains the strong H2 1-0 S(0) and S(1) lines at 2.224 m and 2.122 m, which trace warm molecular gas ( K), and H I Br at 2.166 m, a tracer of warm ionized gas.
2 Observations and Data Reduction
We obtained Gemini-North Near-Infrared Integral Field Spectrometer (NIFS) observations of the PDS 456 (catalog ) and 1H1613-097 (catalog ) fields in April–May 2019 under Program ID GN-2019A-Q-323 (PI=A. Fox) using Natural Guide-Star mode.
The targets PDS 456 (catalog ) (=10.4, 11.2, 0.185) and 1H1613-097 (catalog ) (=3.4, 28.5, 0.06496) both lie behind the northern Fermi Bubble. They were selected by their strong high-velocity UV absorption in Si III 1206, Si II 1260 and C II 1334 (Fox et al., 2015; Bordoloi et al., 2017), which ensures that high-velocity ionized and neutral gas is present, increasing the chances for an IR emission-line detection.
The NIFS observations used the K-band grating covering the bandpass 1.99–2.44 m. NIFS has a field-of-view (FoV), a pixel size, and a K-band spectral resolution of =5290, which allows for the separation of high-velocity GC emission ( km s-1) from foreground ISM emission ( km s-1). We reduced the data using the NIFS Python data reduction pipeline (Lemoine-Busserolle et al., 2019). We determined the spatial offsets between different exposures for each target outside the pipeline and created a master data cube for each target by combining the spatially-aligned data cubes.
To conduct the sky subtraction, we used an dither pattern with a separation between 39–105′′ for PDS 456 (catalog ) and 53–98′′ for 1H1613-097 (catalog ), with the sky frames taken within 300–600 s of the science frames. We used 2MASS near-IR images (Skrutskie et al., 2006) to choose off-source directions with no detected emission.
3 Molecular Hydrogen
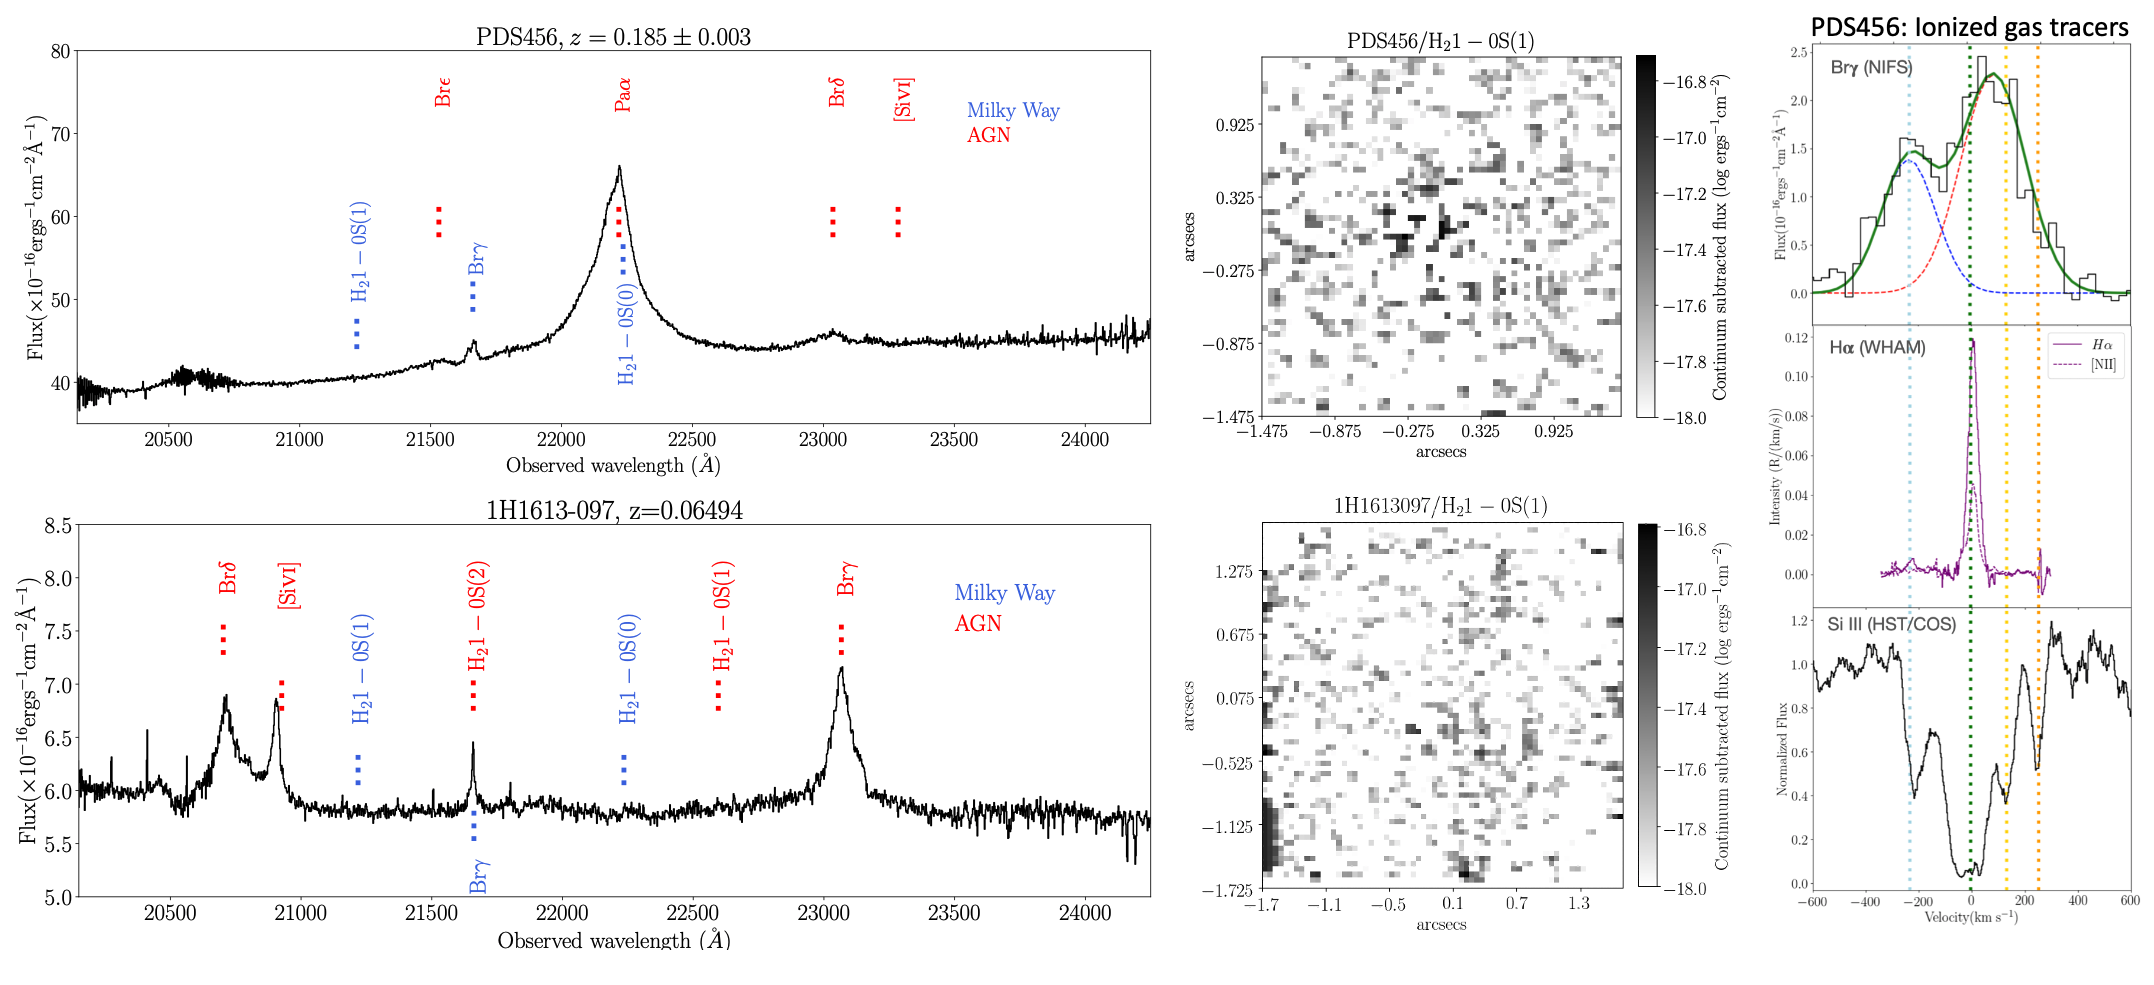
To search for extended emission in the H2 1-0 S(0) and H2 1-0 S(1) emission lines, the bright central point source must be removed. We extracted the AGN spectrum using a circular aperture of radius 0.35′′, chosen to match the median seeing of 0.7′′. The resulting spectra are shown for both PDS 456 (catalog ) and 1H1613-097 (catalog ) in the left panels of Figure 1. The AGN spectra consist of power-law continua plus several discrete redshifted emission lines. We subtracted the continuum on a spaxel-by-spaxel basis by performing a linear fit to the AGN continuum around each line of interest. We created continuum-subtracted emission-line maps, which are shown on the central panels of Figure 1.
For both the PDS 456 (catalog ) and 1H1613-097 (catalog ) directions, we find no detections of Galactic (=0) emission in either H2 1-0 S(1) or S(0): the continuum-subtracted images show no signal in either direction. We determined 3 upper limits on the flux density () and surface brightness density () by measuring the r.m.s. flux in the interval km s-1 in the continuum-subtracted spectra extracted over the full FoV ().
Toward PDS 456 (catalog ), the derived limits are:
erg cm-2 s-1 Å-1 (2.2 mJy) and
erg cm-2 s-1 Å-1 (3.1 mJy), i.e.
erg cm-2 s-1 Å-1 arcsec-2 and
erg cm-2 s-1 Å-1 arcsec-2.
Toward 1H1613-097 (catalog ), the limits are:
erg cm-2 s-1 Å-1 (1.2 mJy) and
erg cm-2 s-1 Å-1, (0.9 mJy), i.e.
erg cm-2 s-1 Å-1 arcsec-2 and
erg cm-2 s-1 Å-1 arcsec-2.
The detection of CO emission in two Fermi Bubble clouds reported by Di Teodoro et al. (2020) indicates that cold molecular gas is present in the nuclear wind at . Our near-IR non-detections of warm H2 in the Fermi Bubbles at latitudes of 11.2 and 28.5 suggest a low covering fraction of warm molecular gas, especially given our pre-selection for high-velocity ionized and neutral gas, which should have maximized the chances of detecting molecular gas. We conclude that observations at other wavelengths, particularly sub-mm CO emission-line studies and UV H2 absorption-line studies, are more promising approaches for characterizing molecular gas in the Fermi Bubbles.
4 Emission at Br
Our NIFS data cubes cover Galactic Br at 2.166 microns. Toward PDS 456 (catalog ), a double-peaked emission component is seen at this wavelength (right panel of Figure 1), with components near 235 km s-1 and 0 km s-1. This velocity structure closely mirrors the UV metal-line absorption profile (Fox et al., 2015) and H emission profile (Krishnarao et al., 2020) in the PDS 456 (catalog ) direction, suggesting the emission is a genuine detection of Galactic Br. However, the emission is spatially unresolved and centered exactly on top of the QSO, with a radial profile that matches the continuum, an unlikely arrangement if the emission traces a random foreground cloud. The emission could be a redshifted QSO emission line; the closest candidate line is H2 1-0 S(5) at =0.180, but this identification is uncertain owing to a 1500 km s-1 offset from the CO emission redshift of =0.18500.0001 (Bischetti et al., 2019) and a lack of corresponding emission in the H2 1-0 S(3) line, which is typically stronger. The origin of the emission is therefore uncertain.
Toward 1H1613-097 (catalog ), narrow emission at Galactic Br is again detected, also unresolved and centered exactly on top of the QSO. This emission could be due to H2 1-0 S(2) emission at =0.06494, but there is no corresponding emission in H2 1-0 S(1), which should be stronger, so this identification is unconfirmed.
Given the contamination issues present in both sightlines, we do not present upper limits on the Galactic Br emission. Further Br observations in unblended Fermi Bubble directions are needed to resolve the emission’s origin.
References
- Ashley et al. (2020) Ashley, T., et al. 2020, ApJ, 898, 128
- Bischetti et al. (2019) Bischetti, M., et al. 2019, A&A, 628, A118
- Bordoloi et al. (2017) Bordoloi, R., et al. 2017, ApJ, 834, 191
- Crocker et al. (2015) Crocker, R. et al. 2015, ApJ, 808, 107
- Di Teodoro et al. (2018) Di Teodoro, E. et al. 2018, ApJ, 855, 33
- Di Teodoro et al. (2020) Di Teodoro, E. et al. 2020, Nature, 584, 364
- Fox et al. (2015) Fox, A. et al. 2015, ApJ, 799, L7
- Krishnarao et al. (2020) Krishnarao, D. et al. 2020, ApJ, 899, L11
- Lemoine-Busserolle et al. (2019) Lemoine-Busserolle, M. et al. 2019, AJ, 158, 153
- Skrutskie et al. (2006) Skrutskie, M. et al. 2006, AJ, 131, 1163
- Su et al. (2010) Su, M. et al. 2010, ApJ, 724, 1044