Probabilistic modeling of asteroid diameters from Gaia DR2 errors
Abstract
The Gaia Data Release 2 provides precise astrometry for nearly 1.5 billion sources across the entire sky, including several thousand asteroids. In this work, we provide evidence that reasonably large asteroids (diameter 20 km) have high correlations with Gaia relative flux uncertainties and systematic right ascension errors. We further capture these correlations using a logistic Bayesian additive regression tree model. We compile a small list of probable large asteroids that can be targeted for direct diameter measurements and shape reconstruction.
1 Introduction
Obtaining direct size measurements of asteroids is a challenging task. Thanks to the ESA/Gaia space mission (Gaia Collaboration et al., 2016), such measurements are expected for asteroids (dell’Oro & Cellino, 2005). Moreover, Gaia will detect hundreds of thousands of minor planets by its final data release (Mignard et al., 2007; de Bruijne et al., 2015) providing orbital and physical characterization for these objects. However, the most recent Gaia Data releases do not contain detailed characterization of solar system objects. The Early Data Release 3 (Gaia Collaboration et al., 2021) does not include minor planets, although these objects will be part of the upcoming Data Release 3. On the other hand, Gaia Data Release 2 (Gaia Collaboration et al., 2018a) contains epoch data for 14,099 pre-selected asteroids (Gaia Collaboration et al., 2018b), but no characterization. This research note examines one of the side-effects of Gaia astrometric and photometric properties: asteroid sizes can leave an imprint on the systematic errors of certain catalog quantities.
Gaia observations are diffraction-limited since they are not affected by the atmosphere. Thus, asteroids with angular diameters larger than the instrumental point spread function require detailed physical modeling to avoid astrometric and photometric systematic errors. Although this is planned for future data releases, such modeling was not yet performed for the sample published in the Gaia Data Release 2 (Gaia Collaboration et al., 2018b), and accordingly, we can hypothesize that a family of relations should exist between the catalog systematic errors and the object diameters. We employed a probabilistic model that unravels and quantifies one of these relations.
We keep the model simple, focusing on two properties that can be directly derived from the time series of Gaia epoch data: mean relative flux uncertainties and the mean systematic component of the right ascension error. However, more elaborate models can be constructed based on other measured properties, and also considering the relative orbits of the object and Gaia. Finally, we use the model to derive a small list of objects for which the diameters could be directly probed from the ground or that will be inferred in future Gaia Data Releases.
2 Analysis and Discussion
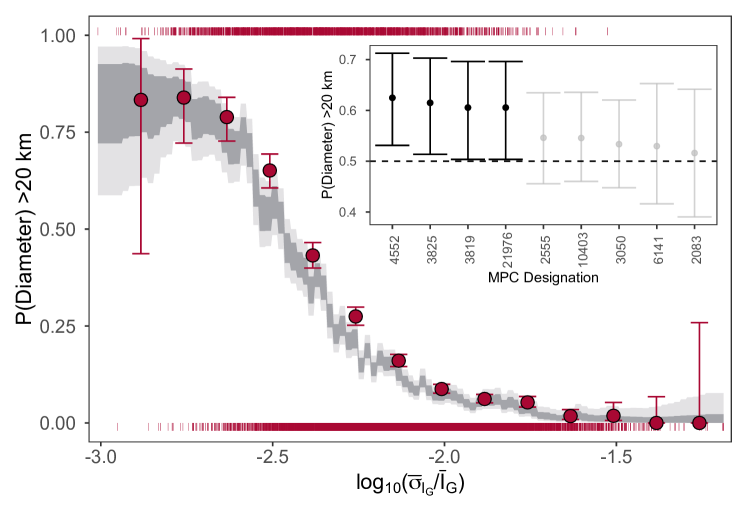
Based on early mission simulations, dell’Oro & Cellino (2005) estimated a 20 km diameter as a threshold for Gaia to be able to obtain a direct measure of the asteroid diameter. Accordingly, we adopt a similar threshold in this work. This decision is further justified since, with the notable exception of 3200 Phaethon, a 5.3(8) km diameter Apollo asteroid measured by interferometry, 20 km is only smaller than the smallest diameters that have been directly measured using adaptive optics and interferometry ( km). We model the likelihood of a given asteroid to be higher than 20 km in terms of the ratio of its mean G-band flux error () and the mean G-band flux (), and the mean systematic uncertainty in right ascension (). These are included in a Bayesian additive regression tree model (BART; Hill et al., 2020). We choose BART because it enables uncovering complex relations without fine-tuning and provides uncertainty quantification via probable intervals. Before applying the BART model, we transform the asteroids’ diameters into a vector of 0’s and 1’s applying a cut at 20 km. BART creates a partition in the space of covariates, = and fit a series of trees in each of them assuming that is given by a Bernoulli process, , where . The probability vector connects to through a series of trees, for which we choose , and a logit link: . Here, is a step function and the - tree.
We fed the model with the 11,095 Gaia asteroids from Gaia EDR2 for which previous diameter measurements are available from the literature. The list of diameters was compiled from the works of Drummond (2000); Hanuš et al. (2013); Nugent et al. (2016); Viikinkoski et al. (2017); Alí-Lagoa et al. (2018); Sanchez et al. (2019); Hanuš et al. (2020); Herald et al. (2020); Podlewska-Gaca et al. (2020). Once the relation between the asteroid diameter and , and is learned via the logistic BART model, we applied it to the list of 2,886 Gaia DR2 asteroids for which we did not find any diameter information. The fitted model and the top-ranked most probable candidates are shown in Figure 1. Among the nine candidates, there are four of them above the 50% threshold to be larger than 20 km with 95% probability, namely 4552 (Nabelek), 3825 (Nürnberg), 3819 (Robinson), and 21976 (1999 XV2). The model indicates that these objects are possibly larger than 20 km, and can be considered as bona fide candidates for subsequent direct diameter measurements and shape reconstruction.
This work showcase that it is possible to create simple statistical models to derive physical information from precise astrometric catalogs by exploiting its random and systematic uncertainties. We show an example of one such model, linking GAIA statistical and systematic uncertainties to asteroid diameters. Other relations likely exist and are waiting to be unveiled for other physical properties and astrophysical objects.
acknowledgments
We thank Xuenan Cao (Yale) for carefully revising this note. This work has made use of data from the European Space Agency mission Gaia, processed by the Gaia Data Processing and Analysis Consortium (DPAC), and data products from the Wide-field Infrared Survey Explorer. This research has made use of the VizieR catalogue access tool, CDS, Strasbourg, France. RSS thanks the National Natural Science Foundation of China, grant E045191001. AKM thanks the Portuguese Fundação para a Ciência e a Tecnologia grants UID/FIS/00099/2019 and PTDC/FIS-AST/31546/2017. VC thanks the Brazilian National Research Council (CNPq, grant 301577/2017-0). RD thanks the São Paulo Research foundation, grant 2016/024561-0. SA thanks CAPES, grant 88887.374148/2019-00. WB thanks PIBIC program of CNPq, grant 121889/2020-3.
References
- Alí-Lagoa et al. (2018) Alí-Lagoa, V., Müller, T. G., Usui, F., & Hasegawa, S. 2018, A&A, 612, A85, doi: 10.1051/0004-6361/201731806
- de Bruijne et al. (2015) de Bruijne, J. H. J., Allen, M., Azaz, S., et al. 2015, A&A, 576, A74, doi: 10.1051/0004-6361/201424018
- dell’Oro & Cellino (2005) dell’Oro, A., & Cellino, A. 2005, in ESA Special Publication, Vol. 576, The Three-Dimensional Universe with Gaia, ed. C. Turon, K. S. O’Flaherty, & M. A. C. Perryman, 289
- Drummond (2000) Drummond, J. D. 2000, Measuring Asteroids with Adaptive Optics (Dordrecht: Springer Netherlands), 243–262, doi: 10.1007/978-94-015-9624-4_12
- Gaia Collaboration et al. (2016) Gaia Collaboration, Prusti, T., de Bruijne, J. H. J., et al. 2016, A&A, 595, A1, doi: 10.1051/0004-6361/201629272
- Gaia Collaboration et al. (2018a) Gaia Collaboration, Brown, A. G. A., Vallenari, A., et al. 2018a, A&A, 616, A1, doi: 10.1051/0004-6361/201833051
- Gaia Collaboration et al. (2018b) Gaia Collaboration, Spoto, F., Tanga, P., et al. 2018b, A&A, 616, A13, doi: 10.1051/0004-6361/201832900
- Gaia Collaboration et al. (2021) Gaia Collaboration, Brown, A. G. A., Vallenari, A., et al. 2021, A&A, 649, A1, doi: 10.1051/0004-6361/202039657
- Hanuš et al. (2020) Hanuš, J., Vernazza, P., Viikinkoski, M., et al. 2020, A&A, 633, A65, doi: 10.1051/0004-6361/201936639
- Hanuš et al. (2013) Hanuš, J., Marchis, F., & Ďurech, J. 2013, Icarus, 226, 1045, doi: https://doi.org/10.1016/j.icarus.2013.07.023
- Herald et al. (2020) Herald, D., Gault, D., Anderson, R., et al. 2020, MNRAS, 499, 4570, doi: 10.1093/mnras/staa3077
- Hill et al. (2020) Hill, J., Linero, A., & Murray, J. 2020, Annual Review of Statistics and Its Application, 7, 251, doi: 10.1146/annurev-statistics-031219-041110
- Mignard et al. (2007) Mignard, F., Cellino, A., Muinonen, K., et al. 2007, Earth Moon and Planets, 101, 97, doi: 10.1007/s11038-007-9221-z
- Nugent et al. (2016) Nugent, C. R., Mainzer, A., Bauer, J., et al. 2016, AJ, 152, 63, doi: 10.3847/0004-6256/152/3/63
- Podlewska-Gaca et al. (2020) Podlewska-Gaca, E., Marciniak, A., Alí-Lagoa, V., et al. 2020, A&A, 638, A11, doi: 10.1051/0004-6361/201936380
- Sanchez et al. (2019) Sanchez, J. A., Reddy, V., Thirouin, A., et al. 2019, The Astrophysical Journal, 881, L6, doi: 10.3847/2041-8213/ab31ac
- Viikinkoski et al. (2017) Viikinkoski, M., Hanuš, J., Kaasalainen, M., Marchis, F., & Ďurech, J. 2017, A&A, 607, A117, doi: 10.1051/0004-6361/201731456