Self-induced ultrafast electron-hole plasma temperature oscillations in nanowire lasers
Abstract
Nanowire lasers can be monolithically and site-selectively integrated onto silicon photonic circuits. To assess their full potential for ultrafast opto-electronic devices, a detailed understanding of their lasing dynamics is crucial. However, the roles played by their resonator geometry and the microscopic processes that mediate energy exchange between the photonic, electronic, and phononic subsystems are largely unexplored. Here, we study the dynamics of GaAs-AlGaAs core-shell nanowire lasers at cryogenic temperatures using a combined experimental and theoretical approach. Our results indicate that these NW lasers exhibit sustained intensity oscillations with frequencies ranging from to . As the underlying physical mechanism, we identified self-induced electron-hole plasma temperature oscillations resulting from a dynamic competition between photoinduced carrier heating and cooling via phonon scattering. These dynamics are intimately linked to the strong interaction between the lasing mode and the gain material, which arises from the wavelength-scale dimensions of these lasers. We anticipate that our results could lead to new approaches for ultrafast intensity and phase modulation of chip-integrated nanoscale semiconductor lasers.
I Introduction
Nanowires (NW) provide a unique approach to site-selectively and epitaxially integrate direct gap semiconductors onto silicon Chen2011_NanopillarsOnSilicon ; Sun2014_RTLaserOnSilicon ; Mayer2016_GaAsLaserOnSilicon ; Stettner2017_WaveguidePaper . Optically pumped lasing has been demonstrated at room temperature using III-V and II-VI compound semiconductors Mayer2013_RTLaserGaAs ; Saxena2013_RTLaserGaAs ; Zimmler2008_FirstZnORTSingleNWLasing , and group-III nitrides Johnson2002_RTLaserGaN , with emission wavelengths that can be tuned from the ultraviolet to the near infrared spectral range Huang2001_RTLaserZnO ; Johnson2002_RTLaserGaN ; Duan2003_RTLaserCdSElectricallyDriven ; chin_near-infrared_2006 ; Zimmler2008_FirstZnORTSingleNWLasing ; Geburt2012_CdSRTOpticallyPumped ; Mayer2013_RTLaserGaAs ; Saxena2013_RTLaserGaAs ; Stettner2016_RTGaAs/AlGaAsMQW ; Saxena2016_RTLaserGaAs/AlGaAsMQW ; Stettner2018_RTGaAs/InGaAsMQW ; Schmiedeke2021_TelecomLasingNW . Thus, they are promising candidates for on-chip lasers in photonic integrated circuits. To further their development, a detailed understanding of their lasing dynamics is essential. Previous studies laid the groundwork by investigating several aspects of carrier relaxation, gain dynamics, plasmonic and coherent phenomena, and the role of lattice defects in a number of different material systems Sidiropoulos2014_PumpProbePlasmonicLaser ; Roder2015_PumpProbeNWLaserCdSZnOGaN ; Wille2016_SingleLasingZnOStreakCamera ; Blake2016_SingleZnOOKGMicroscope ; Hollinger2017_EnsembleZnOSFG ; Blake2020_SingleZnOOKGRelaxationOscillation ; Mayer2017_PumpProbeGaAsNWLaser . Despite these advances, however, the microscopic mechanisms and dynamic processes that ultimately determine, and possibly limit, their potential for ultrafast opto-electronic devices remained largely unexplored.
Here, we investigate the microscopic lasing dynamics of GaAs-AlGaAs core-shell NW lasers Mayer2013_RTLaserGaAs ; Mayer2016_GaAsLaserOnSilicon ; Mayer2017_PumpProbeGaAsNWLaser and present evidence for ultrafast intensity and phase oscillations, which do not stem from coherent effects as previously suggested Mayer2017_PumpProbeGaAsNWLaser , but instead correspond to an exceptionally strong non-equilibrium analog of relaxation oscillations Schneider1997_UltrafastDynamicsOfVCSELs , with frequencies ranging from to . We show that these unique dynamics are enabled by the miniaturized dimensions of these lasers and the resulting competition between carrier heating and cooling during lasing operation. Our results are supported by complementary microscopic simulations based on a quantum statistical Jahnke1995_QuantumStatisticalTheoryPaper and a semiconductor Bloch model Chow1994_SemiconductorLaserPhysicsBook (Methods).
II Results
II.1 Pump-probe measurement and simulation.
Femtosecond pump-probe spectroscopy was performed on single NWs with a carefully timed pair of pump and probe pulses, separated by a time delay . Details on the optical characterization and growth of the NWs are summarized in the Methods section.
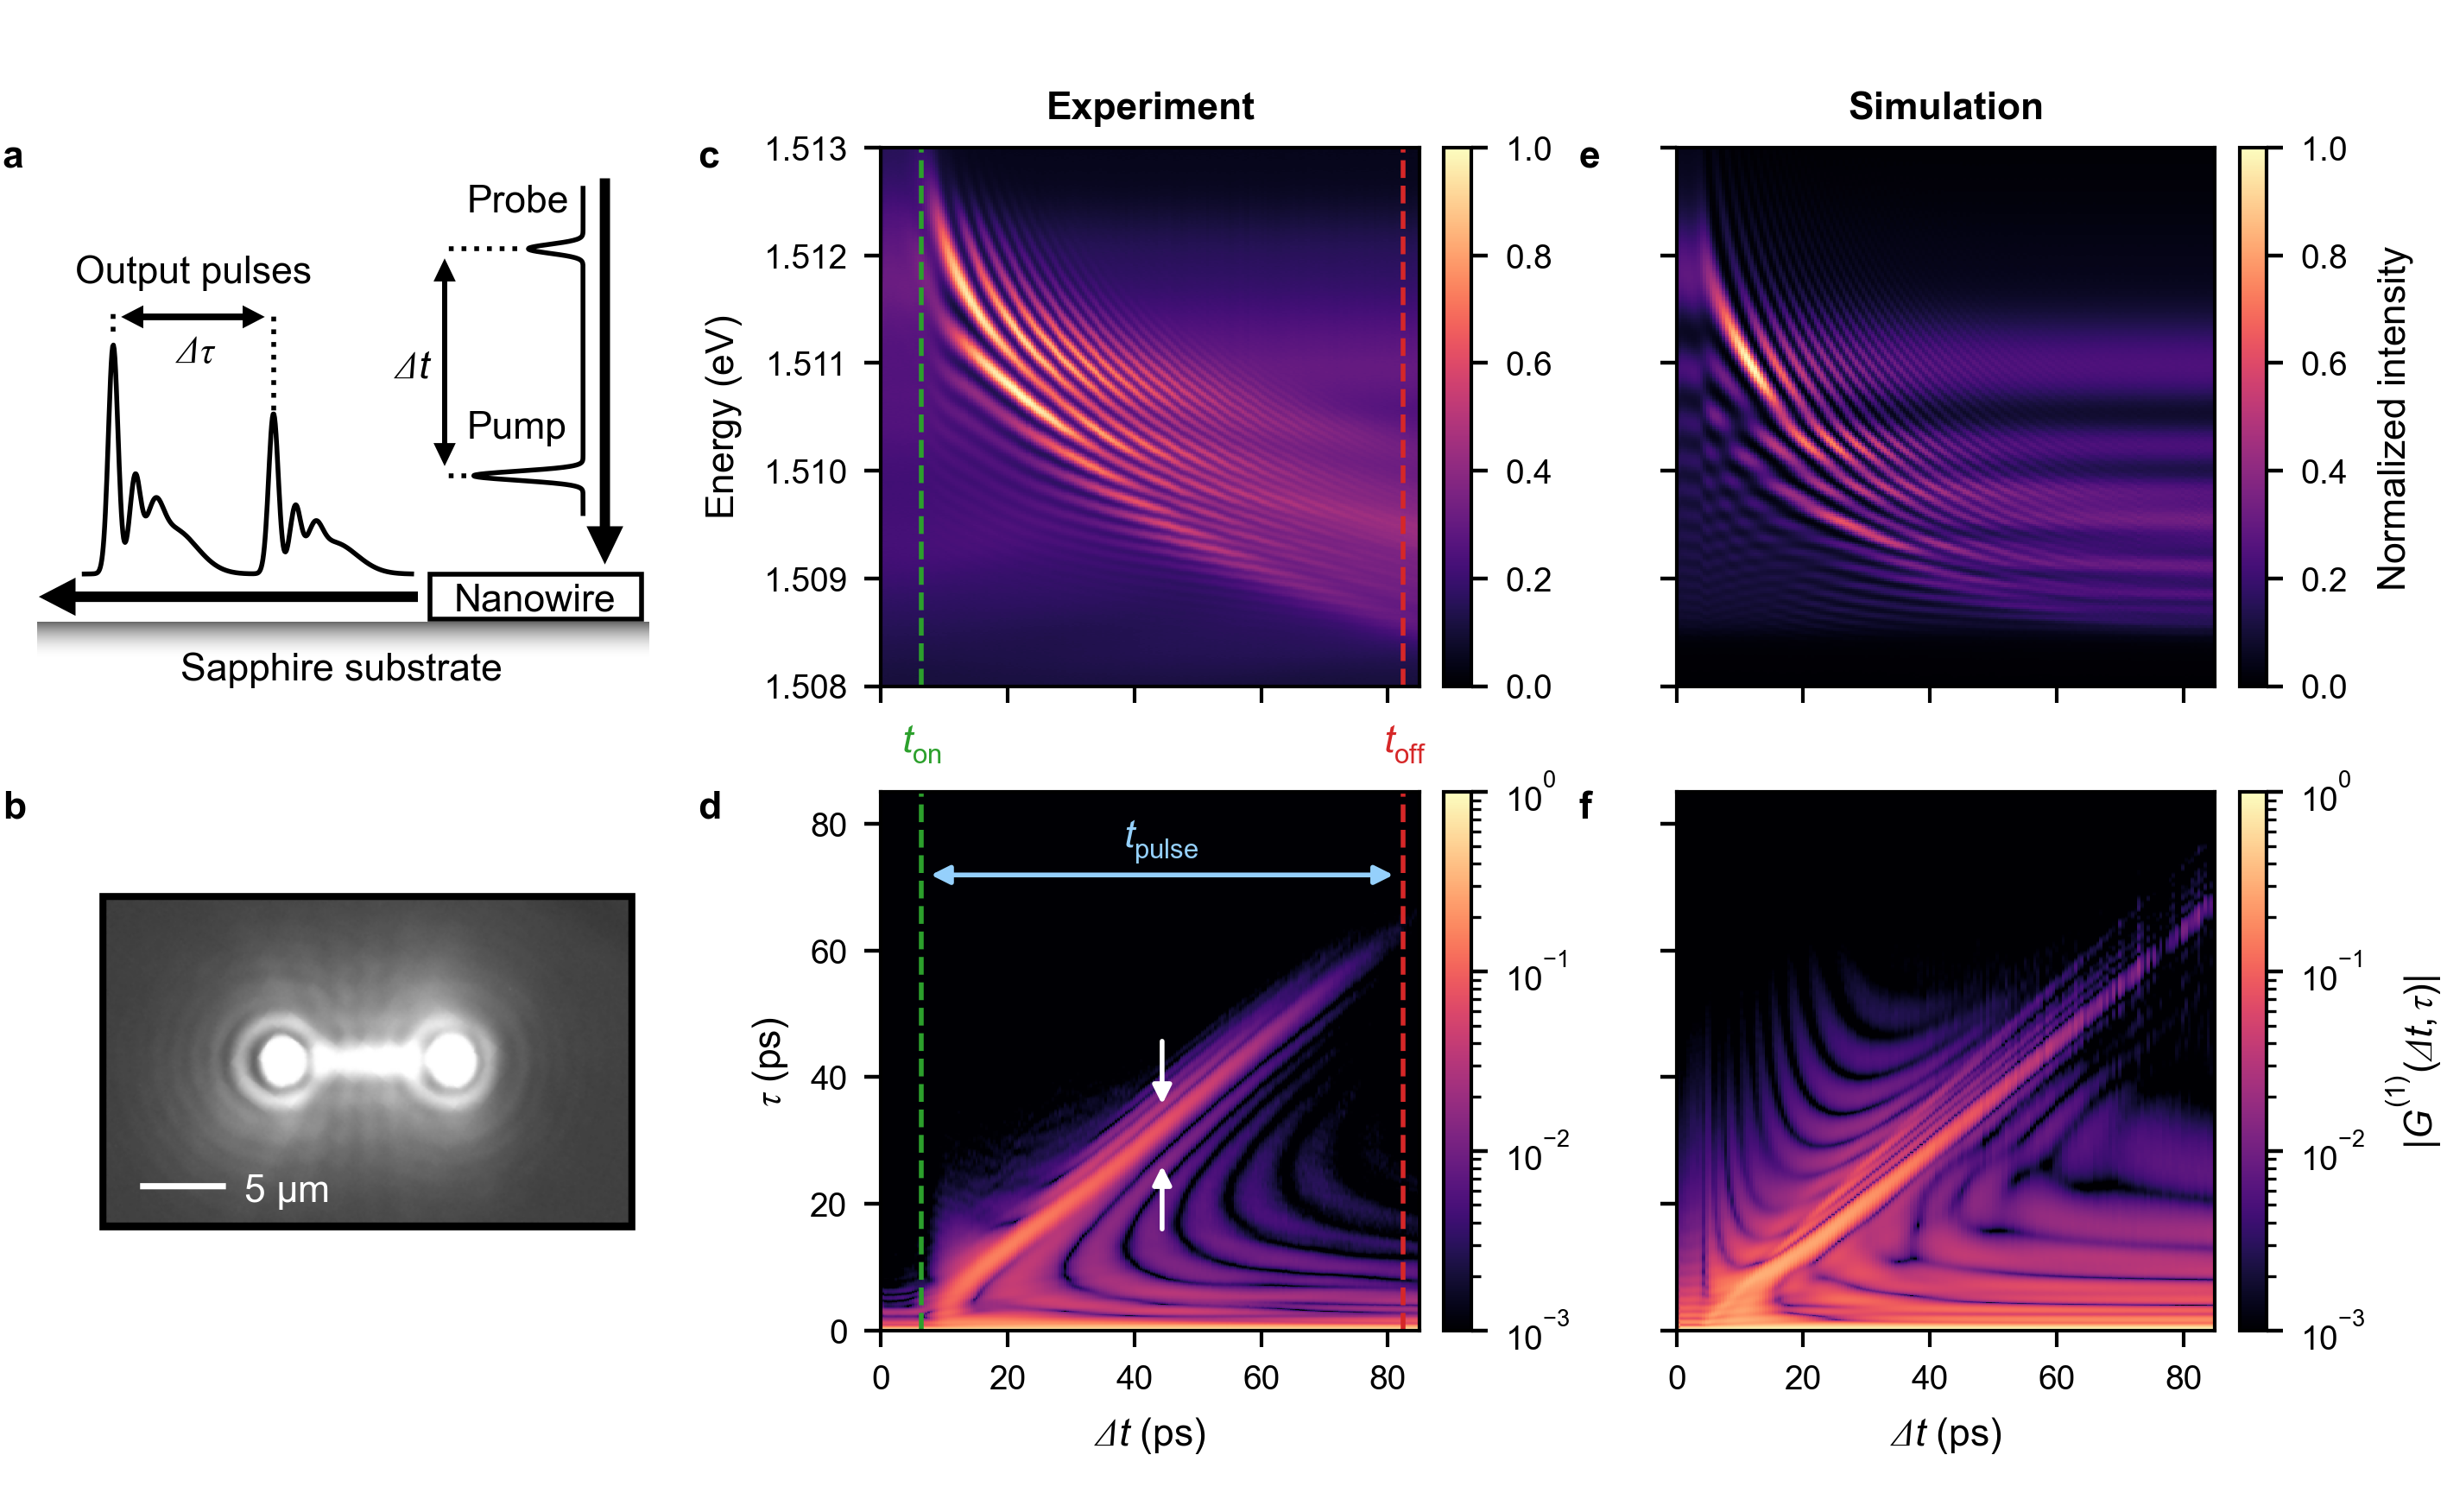
Figure 1a illustrates our pump-probe excitation scheme. The pump pulse power () and probe pulse power () are above and below the threshold () of the NW laser, respectively. After excitation, the NW laser emits two modulated output pulses, separated by a time delay . Figure 1b shows an optical microscope image of the NW laser studied in this work (length ) during lasing operation. Its emission is dominated by a single mode at an energy of (Supplementary Note I) and is clearly visible from both end-facets. All measurements and simulations were performed at a lattice temperature of and with an electron excess energy of , unless specified otherwise.
Figure 1c presents typical results of a pump-probe measurement as a function of . Here, we normalized the spectra to their maximum value and set the excitation power to and , such that the probe pulse alone cannot induce lasing. We observe a delayed onset of two-pulse interference fringes, reflecting the turn-on time () of the laser, which depends on both the excitation conditions and the initial relaxation of the photoexcited carriers Sidiropoulos2014_PumpProbePlasmonicLaser ; Roder2015_PumpProbeNWLaserCdSZnOGaN ; Mayer2017_PumpProbeGaAsNWLaser ; Roder2018b_ReviewUltrafastNWDynamics . Experimentally, was determined from the dependence of the spectrally integrated mode intensity (Supplementary Note II), using the transient depletion of the probe absorption Sidiropoulos2014_PumpProbePlasmonicLaser . For increasing , the interference fringes increase linearly in frequency. Their existence further shows that the weak probe pulse restarts lasing, whereby the probe-induced output pulse partially adopts the phase of the residual electric field in the cavity defined by the previous output pulse Mayer2017_PumpProbeGaAsNWLaser . Hence, the strong pump pulse leaves considerable excitation for an extended period of time, which decays with increasing . This, in turn, leads to a change in refractive index and, thus, to a pronounced redshift of the interference pattern. Meanwhile, the fringes become weaker and finally disappear at a delay .
For ease of interpretation, we move to the time domain by Fourier transforming the energy axis in Fig. 1c. This yields the electric field autocorrelation as a function of and time shift Sidiropoulos2014_PumpProbePlasmonicLaser ; Loudon2000_TheQuantumTheoryOfLight . Its normalized magnitude is presented in Fig. 1d on a logarithmic scale. For normalization, we used the respective maximum value at for each to facilitate comparison with theory. The fringes in Fig. 1c lead to a linear sideband, with a full width at half maximum (FWHM) of , that sets on at a delay and disappears at . We quantified as the delay time where the main sideband amplitude decreased to of its maximum value. Since the photon lifetime of the resonator is Mayer2013_RTLaserGaAs , the disappearance of the main sideband marks the termination of the first NW laser output pulse. Thus, is a measure for the overall output pulse duration. However, in addition to the main sideband, we also observe pronounced oscillations above and below, as indicated by white arrows in Fig. 1d. These reflect the beating patterns in the spectral interference fringes in Fig. 1c. Weak indications of these oscillations can be found in previous work Sidiropoulos2014_PumpProbePlasmonicLaser ; Mayer2017_PumpProbeGaAsNWLaser , but their significance has not been scrutinized until now. Together, the long , the short FWHM of the main sideband, and the oscillations indicate that the NW output pulses are strongly asymmetric and modulated in time.
To understand the origin of the oscillating features in Fig. 1d, we first used the semiconductor Bloch model to simulate the experimental data. For these and all following simulations, we used an end-facet reflectivity of and a spontaneous emission coupling factor of . Both values were obtained using a quantum statistical simulation of the measured continuous-wave lasing characteristics of the NW under investigation (Supplementary Note III) and are in full accord with literature Mayer2013_RTLaserGaAs ; Saxena2013_RTLaserGaAs ; Saxena2015ModeProfiling ; Mayer2016_GaAsLaserOnSilicon . The result of this semiconductor Bloch approach is presented in Fig. 1e,f, whereby we used the same excitation powers as in the experiment. The simulation exhibits excellent qualitative agreement with all observed features of the experimental data in Fig. 1c,d. It reproduces the delayed onset of interference fringes, the temporal asymmetry of the output pulses and the oscillations both above and below the main sideband. Moreover, the model reveals that these originate from carrier temperature oscillations (Supplementary Note IV).
II.2 Quantum statistical simulation.
However, to uncover the full significance of these oscillations and to enable a theoretical description of measurement series within which scattering rates vary, it is necessary to go beyond the relaxation rate approximation used in the semiconductor Bloch model. For this purpose, we used a quantum statistical model that self-consistently calculates the rates for carrier-carrier and carrier-phonon scattering.
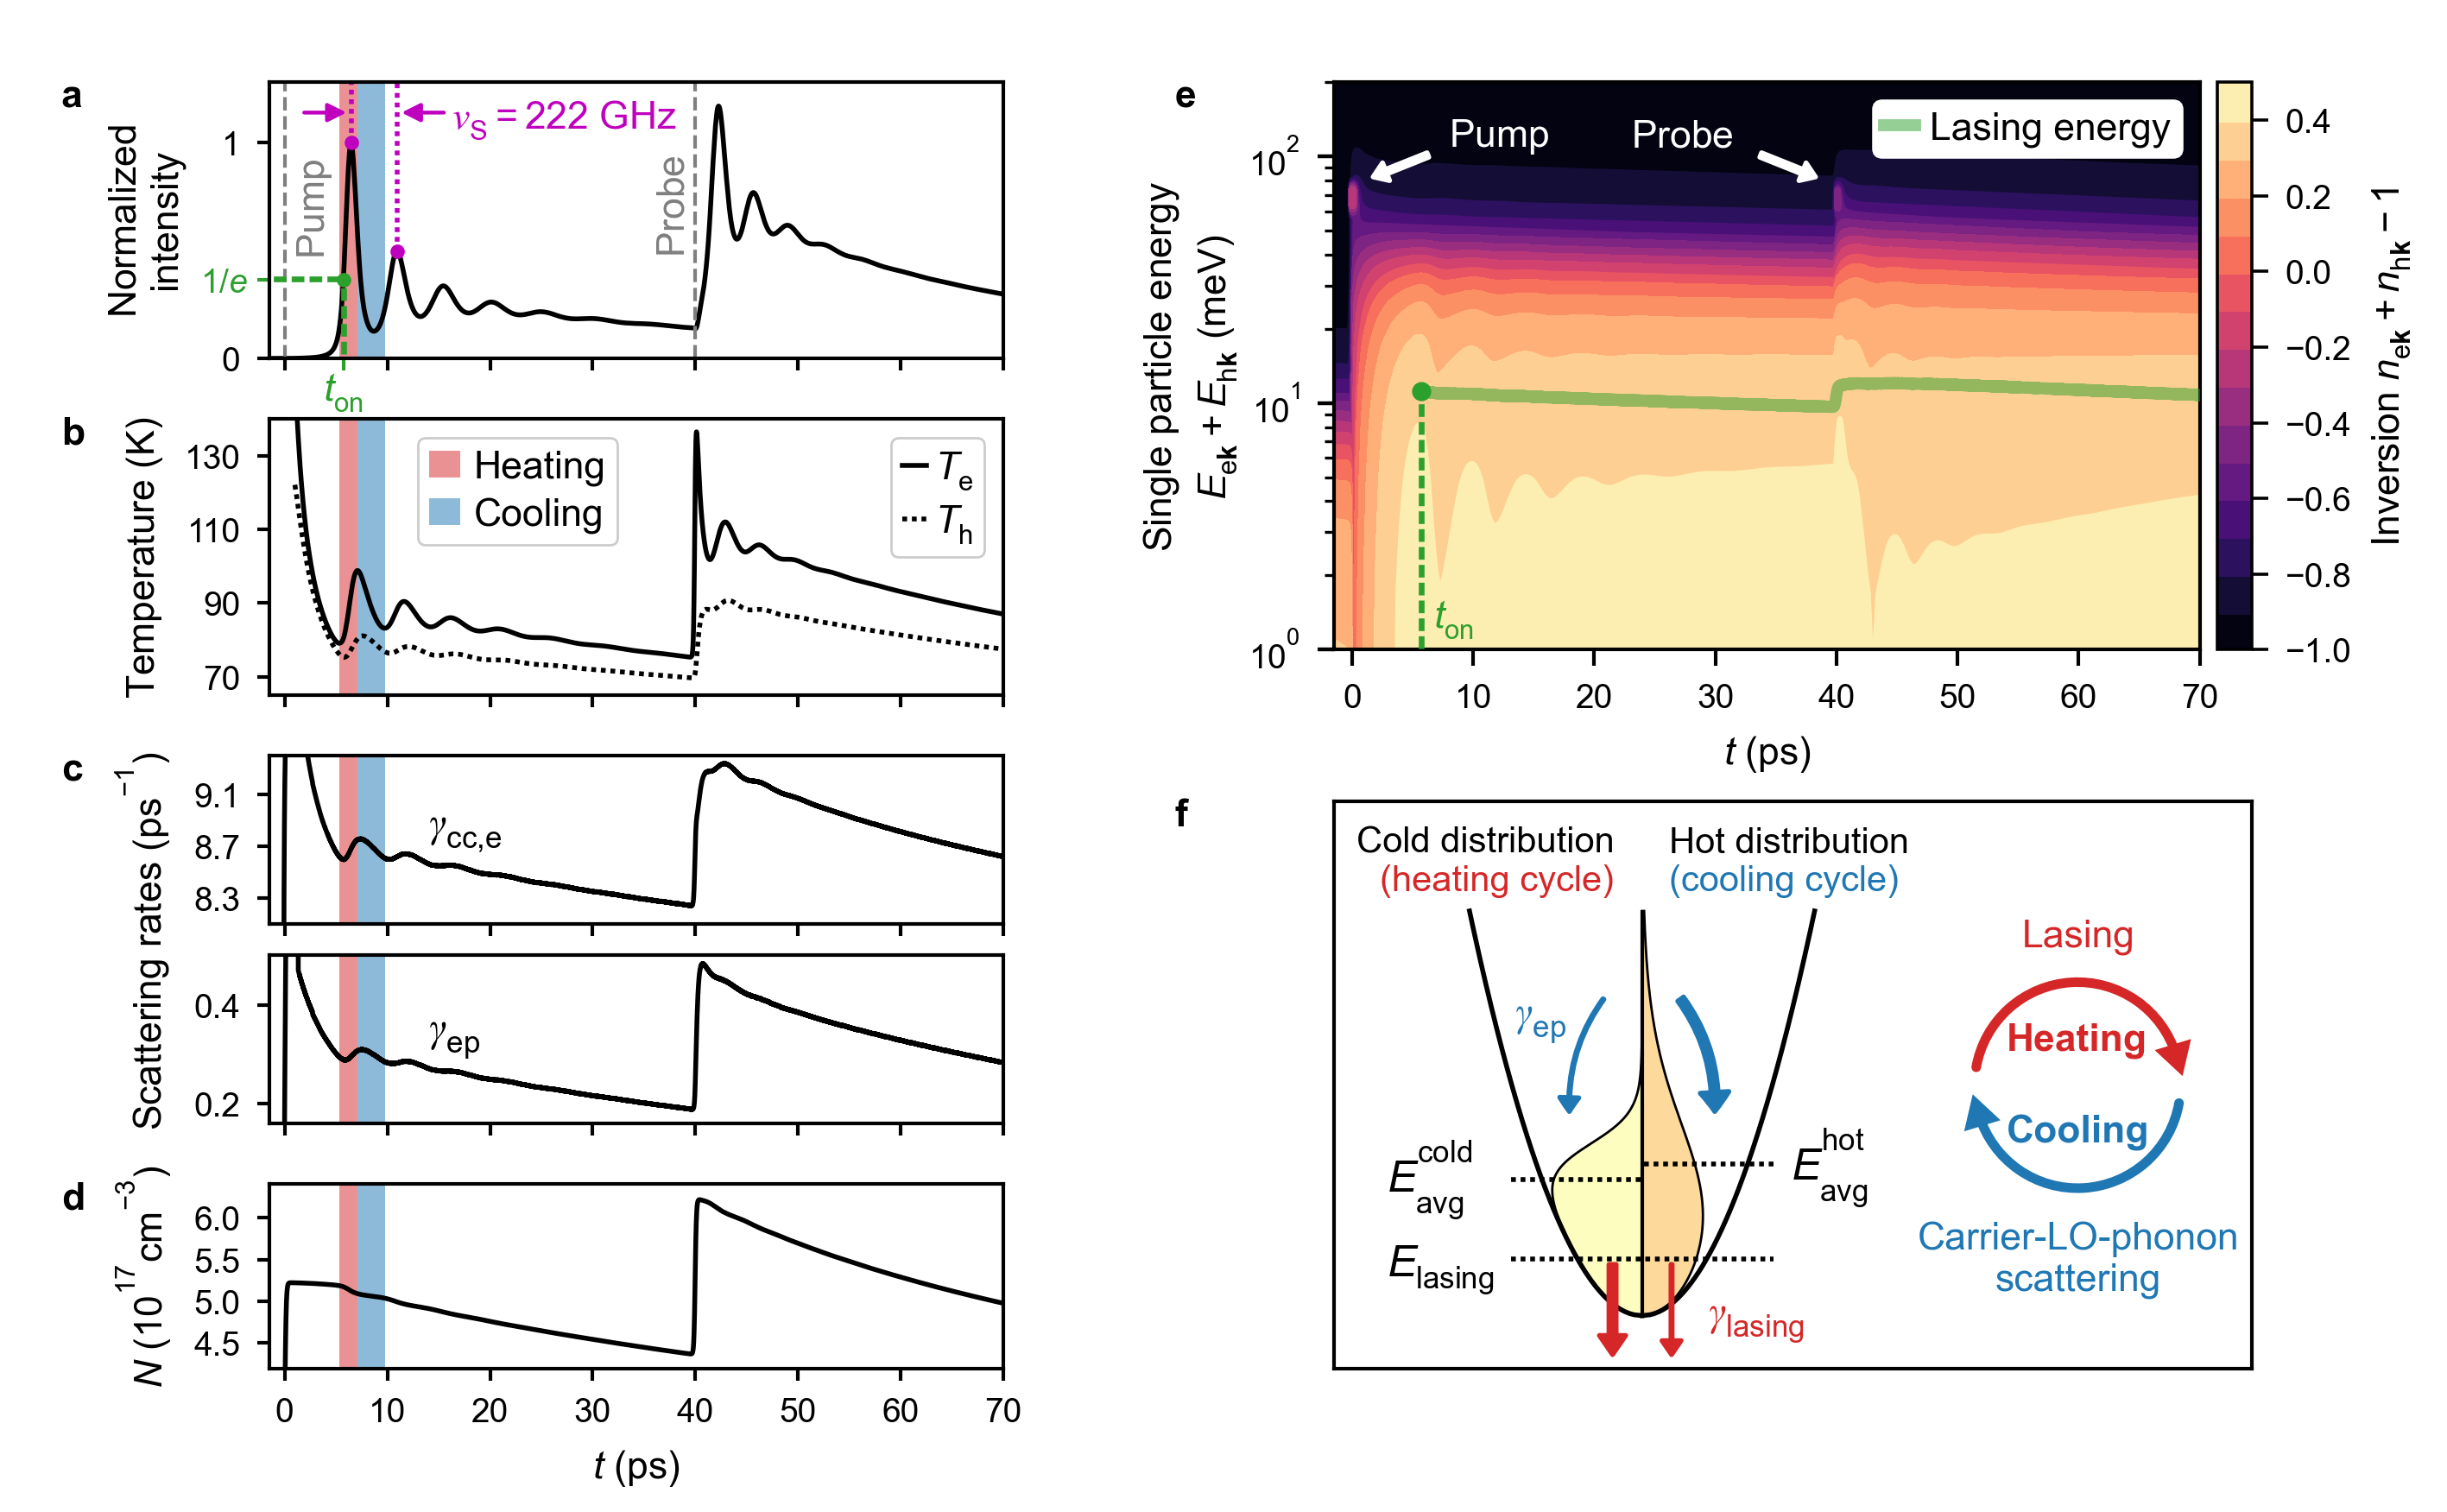
Figure 2 displays the results of this approach for a pump-probe excitation with . The excitation powers used were the same as in Fig. 1. In Fig. 2a, we present the laser intensity as a function of time and determine as the time it takes to reach of the first output pulse maximum. After turn-on, the NW pulses are observed to be strongly asymmetric in time with a pronounced initial peak (), following oscillations with a frequency of and a long tail. This is in qualitative agreement with both the experiment and the simulation in Fig. 1. Following up on the results of the semiconductor Bloch model, we investigated the temporal evolution of the carrier distributions by determining the instantaneous electron () and hole () temperatures for each time step (Supplementary Note V). Figure 2b shows that the carrier temperatures cool to and after , shortly before the laser turns on, which is in full accord with literature Leheny1979c_CoolingCurves ; Leo1987a_CoolingCurvesBulkGaAs . This cooling primarily takes place via scattering of carriers with longitudinal optical (LO) phonons Shah1969a_LOPhononScatteringDominant ; Shah1978a_CarrierRelaxationReview ; Shah1999_UltrafastSpectroscopyBook . After the first temperature minimum at and during turn-on, we observe a pronounced initial increase of the carrier temperatures by and for electrons and holes, respectively. Subsequently, the carrier temperatures show clear oscillations with a frequency of , mirrored by the laser intensity in Fig. 2a. Since changes the most, we highlight in Fig. 2a-d its first heating and cooling cycle in red and blue, respectively. As is observed in Fig. 2c, the carrier temperature dynamics are also mirrored in the time dependence of the electron scattering rates near the lasing energy. While these time variations in the scattering rates are not necessary for the existence of the oscillations in Fig. 2a,b, they likely do increase their strength (Supplementary Note IV). Near , the carrier-carrier scattering rate of electrons is , while the electron-LO-phonon scattering rate is . In contrast to the oscillations in Fig. 2a-c, the carrier density in Fig. 2d shows a monotonic, step-like decrease starting from an initial value of , besides the injection of additional carriers at .
To visualize the carrier dynamics in the parabolic bands, Fig. 2e shows the energy-dependent carrier inversion as a function of time in a semi-logarithmic contour plot. The optical pump-probe excitation is indicated by white arrows. Within a few picoseconds, relaxation of the injected carriers (Supplementary Note VI) leads to build up of inversion at the lasing energy (solid green line). After the onset of lasing (, green point), clear oscillations of the inversion are visible, which are directly connected to the carrier temperature oscillations in Fig. 2b. From Fig. 2e, we further observe no signs of spectral hole burning. This results from the fast carrier-carrier scattering, that continuously thermalizes the electron-hole plasma, and the low end-facet reflectivity , which reduces the stimulated emission rate ().
To explain the origin of these oscillations, Fig. 2f shows a schematic representation of two electron distributions having similar densities in the conduction band; one characterized by a colder (yellow) than the other (orange). The lasing energy () is below the respective average kinetic energy (, ). Thus, stimulated emission at a rate heats the remaining electron distribution Kesler1987_UltrafastTemperatureDynamicsLaser ; Stix1986_GainStrongFunctionOfTemperature ; Gomatam1990_ExtensionOfBimbergPaperToStimEm ; Jahnke1993a_CWSwitchOnVCSEL_Theoryof ; Pompe1995_TransientResponseOfVCSELs ; Jahnke1996_UltrafastDynamicsOfQWVCSELs . In case this heating via is sufficiently strong to overcome the cooling via , rises. Consequently, increases, whereas decreases due to the reduction in material gain () Stix1986_GainStrongFunctionOfTemperature ; Kesler1987_UltrafastTemperatureDynamicsLaser . Partial recovery of via then restarts the cycle. A similar discussion applies to holes.
However, in previous investigations of microcavity and nanoscale lasers this intuitive effect of ultrafast self-induced temperature oscillations was strongly damped, preventing the observation of sustained oscillations Michler1995_TransientPulseResponse ; Michler1996_EmissionDynamicsOfVCSELs ; Jahnke1996_UltrafastDynamicsOfQWVCSELs ; Schneider1997_UltrafastDynamicsOfVCSELs ; Pompe1995_TransientResponseOfVCSELs . We explain the observations in Fig. 2a-e for NW lasers by noting that the modal gain () and are linked by , where is the modal confinement factor Coldren2012 . The corresponding differential gains with respect to carrier temperature (, with ) are, therefore, to a good approximation related by . Thus, large leads to enhanced interactions between the lasing mode and the gain material. For NW lasers, this effect is especially pronounced due to their wavelength-scale dimensions and unique resonator geometry, that allows exceptionally strong mode confinement with maslov_modal_2004 ; Saxena2013_RTLaserGaAs ; Ning2010a_ConfinementFactor . We further note that the large of NW lasers is, in part, due to the strong lateral optical confinement and the resulting strongly non-paraxial mode propagation maslov_modal_2004 ; Ning2010a_ConfinementFactor . Moreover, here, there exists a balanced interplay between the rates of stimulated emission, carrier-carrier scattering, and carrier-LO-phonon scattering. As mentioned above, carrier-carrier scattering is sufficiently fast to maintain Fermi-Dirac distributions, and heating via stimulated emission strong enough to compete with cooling via carrier-LO-phonon scattering, such that light-matter coupling is manifested as a strongly oscillating carrier temperature. In our NW lasers, it is precisely this combination of large with these carrier dynamics that leads to the observed sustained oscillations. The important role of was confirmed by a comparison of the simulated laser dynamics with (used here) and , that clearly demonstrates that the oscillations disappear for weaker mode confinement (Supplementary Note VII).
II.3 Excitation power and lattice temperature dependence.
To test the above hypothesis for the origin of the observed ultrafast oscillations, we experimentally studied the excitation power and dependence of the NW laser dynamics and compared with the predictions of the quantum statistical model.
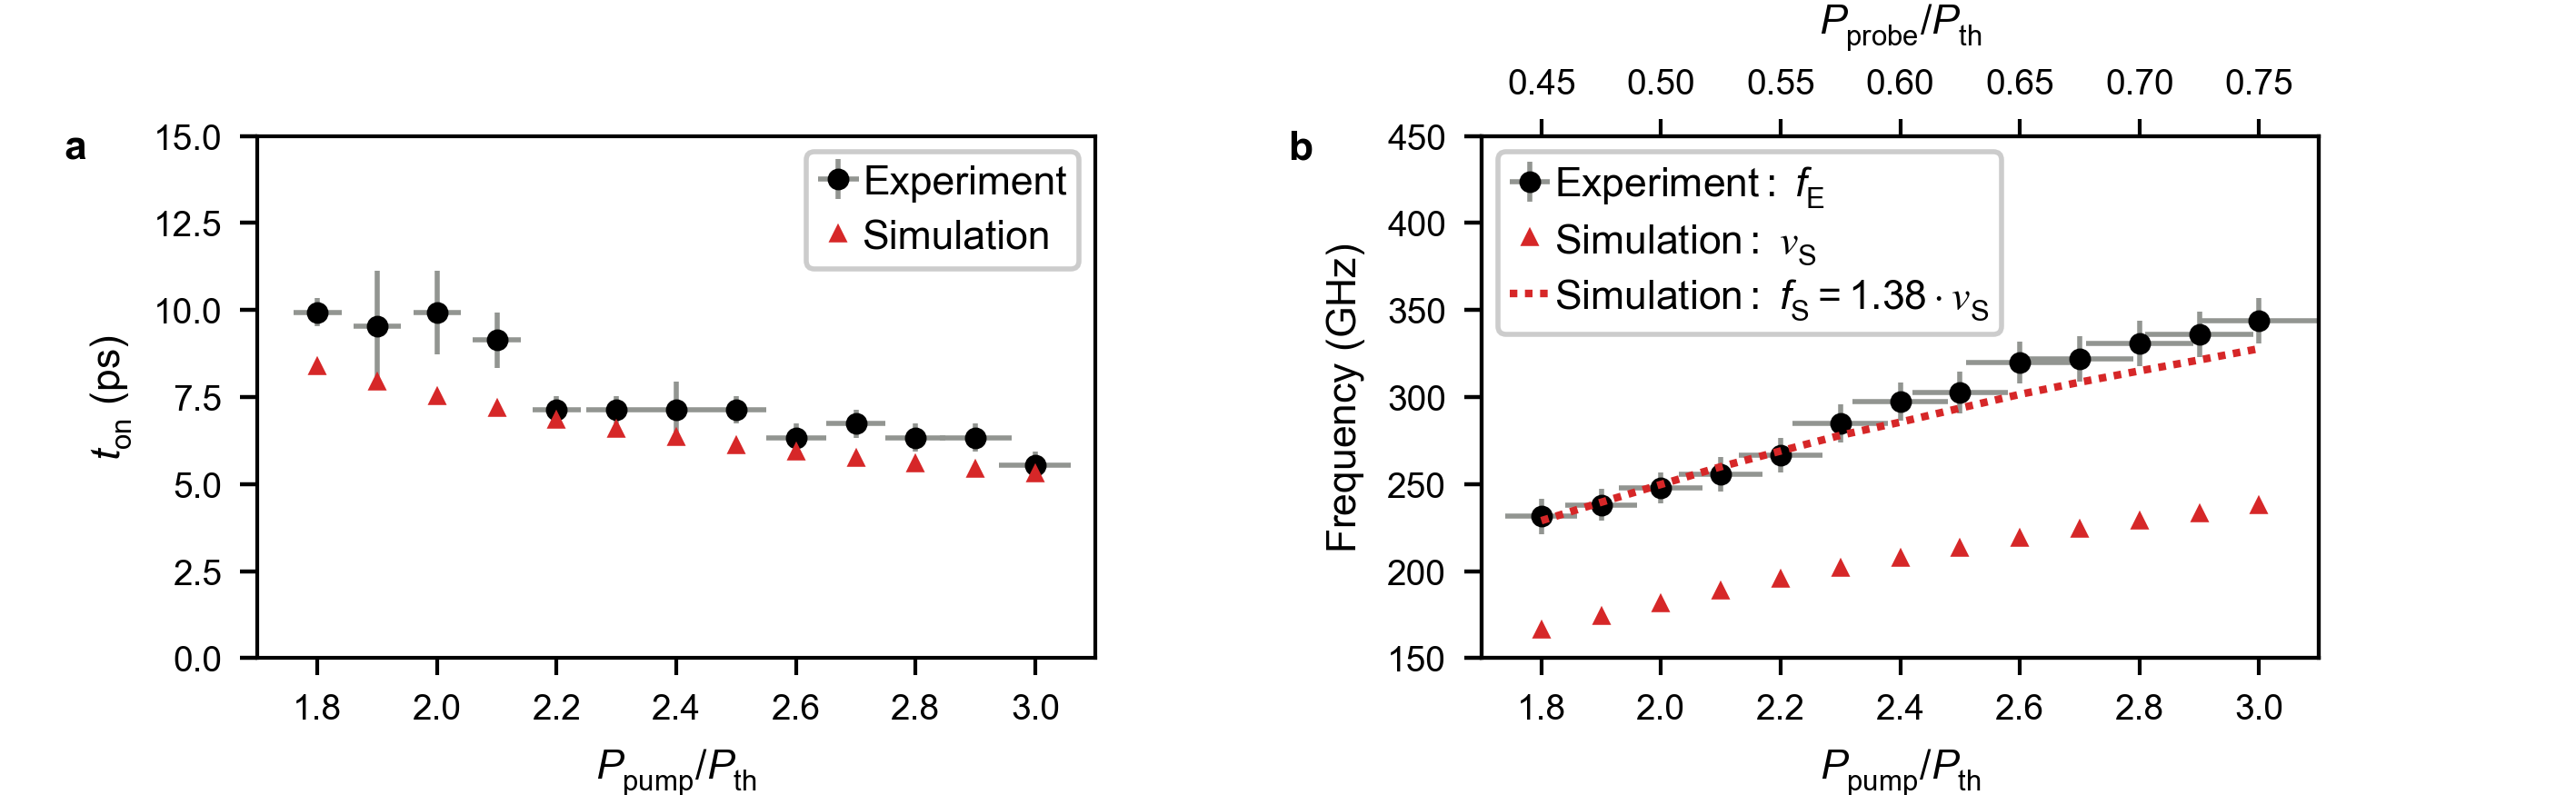
Figure 3 presents the results of the excitation power dependent measurement, with which we investigated in detail how the lasing dynamics depend on and . As shown in Fig. 3a, decreases from to as the pumping level increases from to . This decrease is in excellent quantitative agreement with theory. It results from the increase in with increasing , allowing the laser to turn on at higher carrier temperatures.
To estimate the frequency () of the oscillations in from our measurements, we determined the time interval between the main sideband and the first oscillation above (Supplementary Note VIII). As shown in Fig. 3b, increases with stronger excitation power from to . Since and, thus, the simulated oscillation frequency () cannot be directly obtained from the quantum statistical model, we computed the oscillation frequency . Here, we observe an increase from to , over the same range of excitation powers. Nonetheless, an approximate relationship between and can be established using the semiconductor Bloch model. In the present case, is related to by (Supplementary Note IX). Applying this relationship to the frequencies in Fig. 3b leads to remarkable quantitative agreement between and over the entire range of excitation powers. The increase of the oscillation frequencies with stronger excitation power results from the complex interplay of various effects. As the main reason, we identified the increased , leading to enhanced carrier temperature oscillations and, hence, shorter heating and cooling cycles.
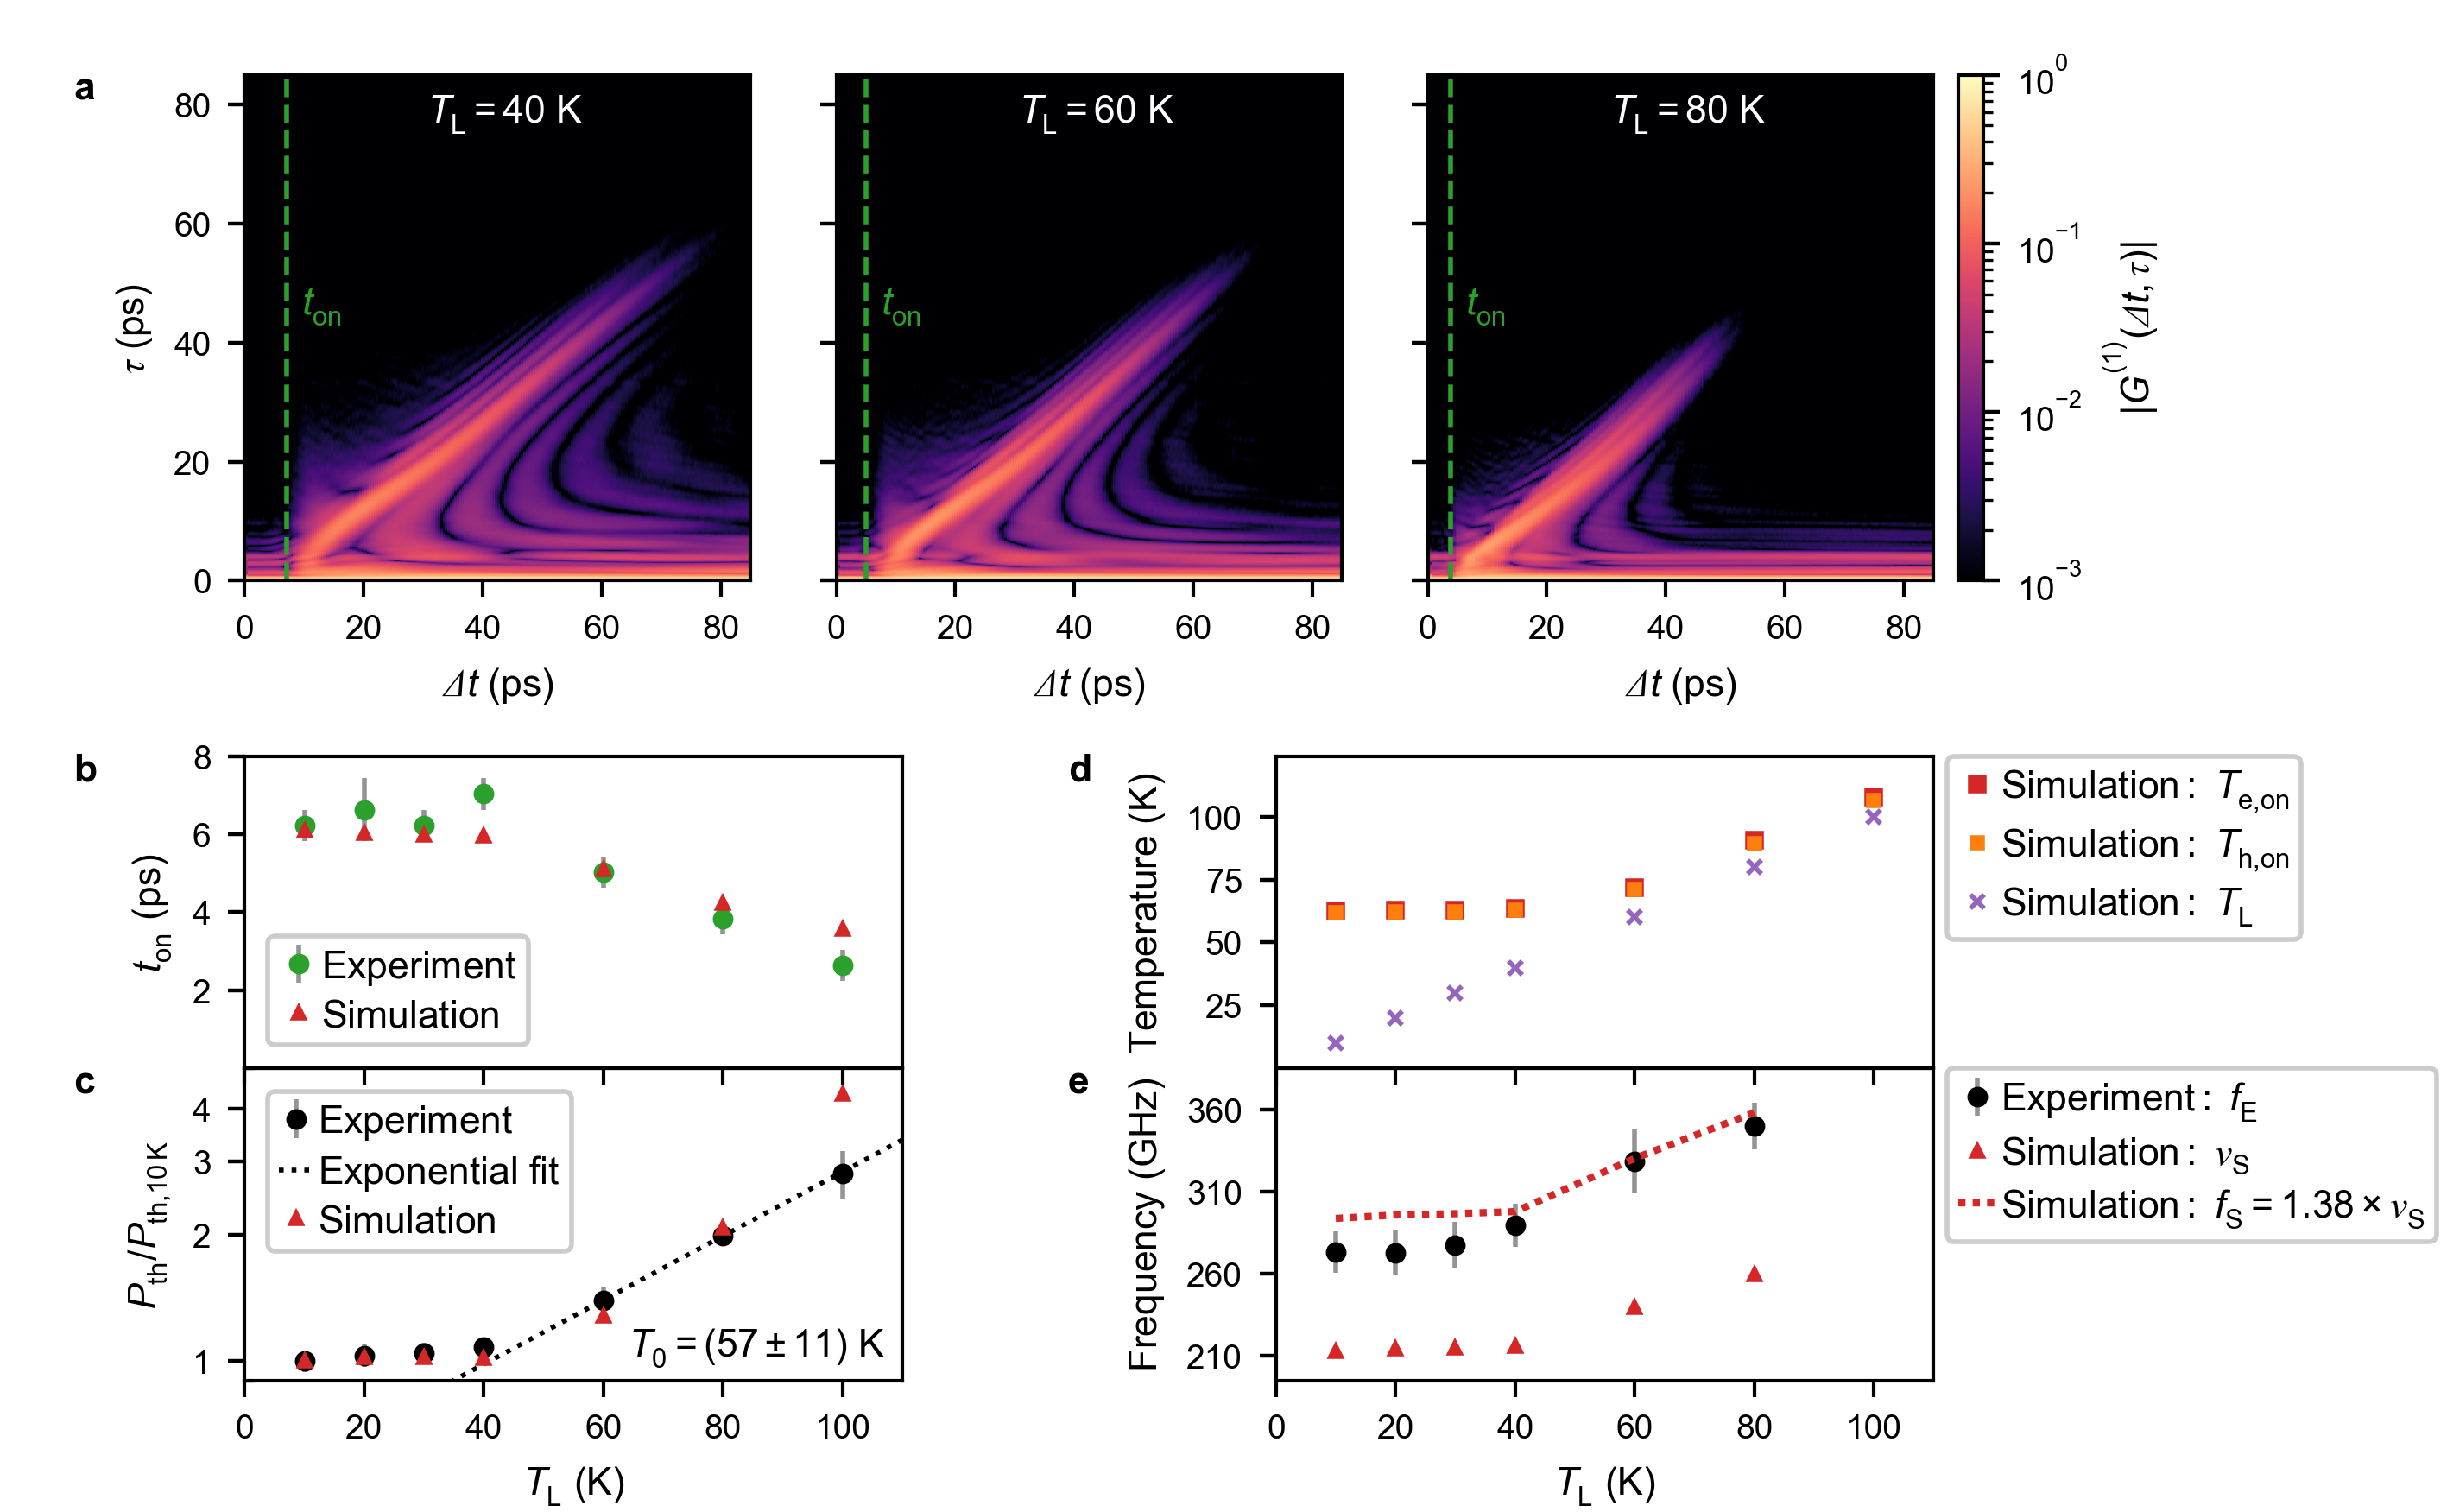
Complementary to the excitation power series, varying allowed to tune , and to shift the operating point of the laser towards higher carrier temperatures. All experimental data in Fig. 4 were measured with and . For illustration, Fig. 4a presents the measured for and . As increases, the data show that decreases, increases and decreases (Supplementary Note X).
As shown by the data in Fig. 4b, remains approximately constant at up to and then decreases to as further increases to . This behaviour can be understood on the basis of the dependence of , shown in Fig. 4c. For , remains almost constant, whereas at higher it increases exponentially with a characteristic temperature . Since the pumping level is fixed relative to , this increase leads to a larger initial . Consequently, decreases, as observed in Fig. 4b. The simulations presented in Fig. 4b,c quantitatively reproduce the experimental data and, thus, confirm our interpretation.
The dependence of is, in turn, accounted for by the variation of the electron () and hole () temperatures at laser turn-on, as shown in Fig. 4d. For increasing , they are initially constant at , reflecting the fact that the cooling rate due to carrier-LO-phonon scattering decreases rapidly for low carrier temperatures () Shah1969a_LOPhononScatteringDominant ; Leheny1979c_CoolingCurves . Both and only rise as becomes comparable, shifting the operating point of the laser towards higher carrier temperatures. The carrier distributions therefore spread out towards higher energies, which reduces at the lasing energy for a given . Hence, increases, explaining the observed trend in Fig. 4c.
We are now in a position to explain the dependence of the oscillation frequencies in Fig. 4e. Up to , remains approximately constant at and then increases to at . Similarly, increases from to . We again calculated from , using the proportionality factor 1.38 stated above, and obtained remarkable agreement with . The trend of the oscillation frequencies is strongly influenced by the dependence of in Fig. 4c. As increases, the correspondingly larger initial blueshifts the lasing mode due to the associated change in refractive index, and broadens the gain spectrum as a result of band gap renormalization and band filling. Simultaneously, the band gap and the lasing mode redshift with increasing , whereby the redshift of the lasing mode is smaller than the other effects. In combination, these processes effectively shift the lasing mode towards the high-energy side of the gain spectrum, where is larger. This leads to the observed increase in oscillation frequencies. No oscillations were observed for , which coincided with the laser becoming multimodal. In addition, as shown in Fig. 4d, the carrier temperatures increase for higher , which reduces Li2000_UltrafastThzModulationLaser . This counteracts the increases due to the shift of the lasing mode towards the high-energy side of the gain spectrum and at some point will compensate them. The oscillations are therefore expected to disappear at sufficiently high , here .
III Discussion
In summary, we investigated the microscopic lasing dynamics of GaAs-AlGaAs core-shell NW lasers. Thereby, we demonstrated how a large , and the consequently large , can lead to exceptionally strong non-equilibrium laser dynamics. These manifest themselves as carrier temperature oscillations through a dynamic competition between carrier heating via stimulated emission and carrier cooling via carrier-LO-phonon scattering. The results of our combined experimental and theoretical approach are consistent with oscillation frequencies ranging from to .
Following the promising results of this work, one possible next step would be to directly time-resolve the emission of a single GaAs-AlGaAs core-shell NW laser. Here, the main challenge is to obtain a sufficient signal-to-noise ratio, since the volume and thus the output emission intensity of NW lasers is relatively small Roder2018b_ReviewUltrafastNWDynamics . Such a measurement would allow a direct experimental validation of the simulated data shown in Fig. 2a.
Since the described dynamics involve oscillations of the carrier temperature and not the carrier density, they circumvent the speed limitations inherent in conventional relaxation oscillations Li2000_UltrafastThzModulationLaser . For direct laser modulation based on changing the carrier density, the relaxation oscillation frequency determines the maximum modulation speed, which is currently limited to without photonic feedback effects Yamaoka2021DirectModulation108GHz . Similarly, we believe that the oscillation frequencies described here determine the ultimate speed limit for laser intensity or phase modulation based on changing the carrier temperature. We therefore anticipate that NW lasers could substantially improve previously proposed laser modulation schemes based on terahertz heating fields Li2000_UltrafastThzModulationLaser . This is because their large makes them highly susceptible to applied electric fields. In such a scheme, an externally applied terahertz heating field modulates the carrier temperature and thus the laser output, avoiding the speed bottleneck of interband modulation Li2000_UltrafastThzModulationLaser . This also creates new opportunities for ultrafast pulse shaping of nanoscale semiconductor lasers and, provided the modulation depth is sufficient, would allow the generation of picosecond pulse trains with extremely high repetition rates . In perspective, further research could achieve ultrafast modulation of NW lasers integrated into silicon photonic circuits Stettner2017_WaveguidePaper .
The dynamics described above are substantially different from the expected class B dynamics that are typical for semiconductor lasers and usually described by a standard rate equation approach Coldren2012 . In our case, however, such an approach is insufficient. Firstly, the predicted overall output pulse length and shape well above threshold would not correspond well to our experimental observations Saxena2013_RTLaserGaAs ; Mayer2016_GaAsLaserOnSilicon . Secondly, relaxation oscillations would be too slow to explain the observed dynamics Yamaoka2021DirectModulation108GHz and, thirdly, not expected following excitation with femtosecond pulses Saxena2013_RTLaserGaAs ; Mayer2016_GaAsLaserOnSilicon . This made it necessary to go beyond such a rate equation approach and the corresponding small-signal response theory to be able to describe our experimentally observed dynamics. It is, nevertheless, important to note that the rate equation approach can be augmented to include temperature effects. This can either be done, for example, by introducing a gain saturation parameter Coldren2012 , or by including the carrier temperature directly as a dynamical variable ning_self-consistent_1995 . However, this requires the introduction of additional phenomenological parameters and would still need a self-consistent inclusion of many-body effects in order to yield predictions that can be quantitatively compared with experiments. Microscopic models, such as those used in the present work Jahnke1993c_CWSwitchOnVCSEL_Transient ; Chow1994_SemiconductorLaserPhysicsBook , solve these issues and allow a detailed description of nanoscale lasers on picosecond timescales while minimizing the number of free phenomenological parameters.
We note that our theoretical models Jahnke1993c_CWSwitchOnVCSEL_Transient ; Chow1994_SemiconductorLaserPhysicsBook are general and thus allow our findings to be applied to other types of semiconductor lasers as well. There are several points to consider in the development of semiconductor lasers, that are intended to be highly susceptible to externally applied terahertz fields. According to the key insight of this work, such a laser should have a large . This can be achieved by an optimized spatial overlap of the lasing mode and the gain material, which simultaneously also decreases the threshold maslov_modal_2004 ; Ning2010a_ConfinementFactor . The choice of the gain material is crucial as well, as it directly affects the cooling rate of the carriers via carrier-LO-phonon scattering which is mediated by the Fröhlich interaction. Moreover, the operating point of the carrier density and temperature should be chosen such that is maximized. According to a previous theoretical investigation, this is the case when both the carrier density and temperature are as low as possible Li2000_UltrafastThzModulationLaser . The differential modal gain can further be optimized by tuning the cavity length to place the lasing mode on the high energy side of the gain spectrum Michler1995_TransientPulseResponse ; Michler1996_EmissionDynamicsOfVCSELs ; Grabmaier1991_DiffGainIncreasesWithIncreasingEnergy . Lastly, the laser must have a large enough resonator bandwidth and should preferentially be single mode. Both points can be achieved by making the laser as short as possible, which of course, must be balanced with the simultaneously increasing threshold. Taken together, our work thus opens up new approaches to how the miniaturization of semiconductor lasers can be used to design their ultrafast dynamical properties.
This is complementary to previous research that investigated accelerated laser dynamics based on Purcell enhancement Altug2006_UltrafastPhCLaser ; romeira_purcell_2018 and plasmonic effects Sidiropoulos2014_PumpProbePlasmonicLaser ; khurgin_comparative_2014 . We note that no Purcell enhancement is expected for our NW lasers since their effective mode volume is times larger than that of the photonic crystal laser studied in Ref. Altug2006_UltrafastPhCLaser . Other approaches to ultrafast laser modulation, that typically require larger device structures, include the use of photonic feedback effects Yamaoka2021DirectModulation108GHz and mode field switching pellegrino_mode-field_2020 . It is noteworthy that with both photonic feedback on a silicon carbide substrate Yamaoka2021DirectModulation108GHz and Purcell enhancement in a GaAs material system Altug2006_UltrafastPhCLaser modulation frequencies of up to have been demonstrated, although the latter could not be confirmed theoretically suhr_modulation_2010 ; gregersen_quantum-dot_2012 .
Practical applications of course would ultimately require ultrafast modulation of nanolasers at room temperature. The current drawback of the dynamics described in our work is the limitation to . However, this could be overcome by using a low-dimensional gain medium, such as multi-quantum wells Stettner2016_RTGaAs/AlGaAsMQW , simultaneously allowing emission wavelength tuning towards the technologically relevant telecom bands Stettner2018_RTGaAs/InGaAsMQW ; Schmiedeke2021_TelecomLasingNW .
IV Materials and methods
IV.1 Growth
The investigated NW lasers were grown in a two-step axial and radial growth process on silicon using molecular beam epitaxy Mayer2013_RTLaserGaAs ; Mayer2016_GaAsLaserOnSilicon . These NWs have a length in the range of and a diameter of Mayer2013_RTLaserGaAs .
IV.2 Optical characterization.
For optical investigations the NWs were transferred onto a sapphire substrate, providing excellent heat conductivity at cryogenic temperatures and sufficient refractive index contrast to achieve lasing. The samples were mounted inside a liquid helium flow cryostat and all experiments reported in this work were performed within a temperature range of . Single NWs were excited using optical pulses (repetition frequency ), delivered by a mode-locked laser, which were focused to a spot diameter of , covering the entire NW. The detection spot was centered on one of the endfacets of the NW and had a diameter of . We determined the threshold () of the NWs using single pulse excitation (Supplementary Note I). To study their ultrafast dynamics we performed non-resonant degenerate pump-probe spectroscopy and measured the spectrally resolved and time-integrated NW laser emission. The spectra were recorded as a function of pump-probe delay using a double spectrometer and a CCD, whereby the delay was adjusted using an optical delay line with a bi-directional precision . With a spectral resolution of , interference fringes resulting from pulse separations could be resolved.
IV.3 Numerical Modelling.
With our modelling approach, we reproduced the characteristic features of the experiments and, thereby, made deductions about the underlying carrier and carrier-field interaction dynamics. In a complete semi-classical description, the light-matter interaction is governed by the semiconductor Maxwell-Bloch equations, whereby the carrier-carrier and carrier-phonon interactions are described by the proper collision integrals in the Boltzmann equation framework. However, the direct simulation of the experiment at hand turns out to be too computationally expensive, when using this complete approach. We therefore conducted two different model simplifications, depending on the physical feature that was to be investigated. To study the dynamics of the emitted electric field, we used a relaxation rate approximation for the scattering dynamics, using precalculated values (Supplementary Note IV), while keeping the full semiconductor Maxwell-Bloch equation Chow1994_SemiconductorLaserPhysicsBook . We refer to this as the semiconductor Bloch model (Supplementary Note XI). In contrast, to study the carrier dynamics in detail, we eliminated the polarization dynamics and resorted to the field intensity for the light-matter interaction. While this approach cannot describe the dynamics of the electric field or potential coherent transients, it did allow to keep the full Boltzmann-equation framework for the carrier dynamics with reasonable computational effort Henneberger1992_SpectralHoleBurning ; Henneberger1992_ManyBodyEffects ; Jahnke1993a_CWSwitchOnVCSEL_Theoryof ; Jahnke1993b_CWSwitchOnVCSEL_DynamicResponse ; Jahnke1993c_CWSwitchOnVCSEL_Transient ; Jahnke1995_QuantumStatisticalTheoryPaper ; Schneider1997_UltrafastDynamicsOfVCSELs ; Chow1994_SemiconductorLaserPhysicsBook . We refer to this as the quantum statistical model (Supplementary Note XII). Both models use the same set of simulation parameters, tabulated in Supplementary Note III.
Acknowledgements
We would like to thank B. Lingnau for contributions towards code used in the semiconductor Bloch model and D. Rudolph for growing the NWs. We gratefully acknowledge the DFG for funding via the project FI 947/4-1, and via the clusters of excellence Munich Center for Quantum Science and Technology (MCQST, EXC 2111) and e-conversion (EXC 2089). Further financial support was provided by the FETOPEN project SiLAS (H2020-FETOPEN 735008), and the ERC project QUANtIC (ID:771747) funded by the European Research Council, and by the European Regional Development Fund (ERDF) via the Welsh Government (80762-CU145 (East)). In addition, we gratefully acknowledge funding via the U.S. Department of Energy’s National Nuclear Security Administration contract DE-NA0003525. This work was performed, in part, at the Center for Integrated Nanotechnologies, an Office of Science User Facility operated for the U.S. Department of Energy (DOE) Office of Science.
References
- (1) Chen, R. et al. Nanolasers grown on silicon. Nat. Photonics 5, 170–175 (2011).
- (2) Sun, H. et al. Nanopillar Lasers Directly Grown on Silicon with Heterostructure Surface Passivation. ACS Nano 8, 6833–6839 (2014).
- (3) Mayer, B. et al. Monolithically Integrated High- Nanowire Lasers on Silicon. Nano Lett. 16, 152–156 (2016).
- (4) Stettner, T. et al. Direct Coupling of Coherent Emission from Site-Selectively Grown III–V Nanowire Lasers into Proximal Silicon Waveguides. ACS Photonics 4, 2537–2543 (2017).
- (5) Mayer, B. et al. Lasing from individual GaAs-AlGaAs core-shell nanowires up to room temperature. Nat. Commun. 4 (2013).
- (6) Saxena, D. et al. Optically pumped room-temperature GaAs nanowire lasers. Nat. Photonics 7, 963–968 (2013).
- (7) Zimmler, M. A., Bao, J., Capasso, F., Müller, S. & Ronning, C. Laser action in nanowires: Observation of the transition from amplified spontaneous emission to laser oscillation. Appl. Phys. Lett. 93, 051101 (2008).
- (8) Johnson, J. C. et al. Single gallium nitride nanowire lasers. Nat. Mater. 1, 106–110 (2002).
- (9) Huang, M. H. et al. Room-Temperature Ultraviolet Nanowire Nanolasers. Science 292, 1897–1899 (2001).
- (10) Duan, X., Huang, Y., Agarwal, R. & Lieber, C. M. Single-nanowire electrically driven lasers. Nature 421, 241–245 (2003).
- (11) Chin, A. H. et al. Near-infrared semiconductor subwavelength-wire lasers. Appl. Phys. Lett. 88, 163115 (2006).
- (12) Geburt, S. et al. Low threshold room-temperature lasing of CdS nanowires. Nanotechnology 23, 365204 (2012).
- (13) Stettner, T. et al. Coaxial GaAs-AlGaAs core-multishell nanowire lasers with epitaxial gain control. Appl. Phys. Lett. 108, 011108 (2016).
- (14) Saxena, D. et al. Design and Room-Temperature Operation of GaAs/AlGaAs Multiple Quantum Well Nanowire Lasers. Nano Lett. 16, 5080–5086 (2016).
- (15) Stettner, T. et al. Tuning Lasing Emission toward Long Wavelengths in GaAs-(In,Al)GaAs Core–Multishell Nanowires. Nano Lett. 18, 6292–6300 (2018).
- (16) Schmiedeke, P. et al. Low-threshold strain-compensated InGaAs/(In,Al)GaAs multi-quantum well nanowire lasers emitting near 1.3 at room temperature. Appl. Phys. Lett. 118, 221103 (2021).
- (17) Sidiropoulos, T. P. H. et al. Ultrafast plasmonic nanowire lasers near the surface plasmon frequency. Nat. Phys. 10, 870–876 (2014).
- (18) Röder, R. et al. Ultrafast Dynamics of Lasing Semiconductor Nanowires. Nano Lett. 15, 4637–4643 (2015).
- (19) Wille, M. et al. Carrier density driven lasing dynamics in ZnO nanowires. Nanotechnology 27, 225702 (2016).
- (20) Blake, J. C., Nieto-Pescador, J., Li, Z. & Gundlach, L. Ultraviolet femtosecond Kerr-gated wide-field fluorescence microscopy. Opt. Lett. 41, 2462 (2016).
- (21) Hollinger, R. et al. Enhanced absorption and cavity effects of three-photon pumped ZnO nanowires. Appl. Phys. Lett. 111, 213106 (2017).
- (22) Blake, J. C., Nieto-Pescador, J., Li, Z. & Gundlach, L. Femtosecond Luminescence Imaging for Single Nanoparticle Characterization. J. Phys. Chem. A 124, 4583–4593 (2020).
- (23) Mayer, B. et al. Long-term mutual phase locking of picosecond pulse pairs generated by a semiconductor nanowire laser. Nat. Commun. 8, 15521 (2017).
- (24) Schneider, H. C., Jahnke, F. & Koch, S. W. Microscopic theory of non-equilibrium microcavity laser dynamics. Quantum Semiclass. Opt. 9, 693–711 (1997).
- (25) Jahnke, F. & Koch, S. W. Many-body theory for semiconductor microcavity lasers. Phys. Rev. A 52, 1712–1727 (1995).
- (26) Chow, W. W., Koch, S. W. & Sargent, M. Semiconductor-Laser Physics (Springer, Berlin, 1994).
- (27) Röder, R. & Ronning, C. Review on the dynamics of semiconductor nanowire lasers. Semicond. Sci. Technol. 33, 033001 (2018).
- (28) Loudon, R. The Quantum Theory of Light (Oxford University Press, Oxford, 2000).
- (29) Saxena, D. et al. Mode Profiling of Semiconductor Nanowire Lasers. Nano Lett. 15, 5342–5348 (2015).
- (30) Leheny, R., Shah, J., Fork, R., Shank, C. & Migus, A. Dynamics of hot carrier cooling in photo-excited GaAs. Solid State Commun. 31, 809–813 (1979).
- (31) Leo, K. & Rühle, W. Influence of carrier lifetime on the cooling of a hot electron-hole plasma in GaAs. Solid State Commun. 62, 659–662 (1987).
- (32) Shah, J. & Leite, R. C. C. Radiative Recombination from Photoexcited Hot Carriers in GaAs. Phys. Rev. Lett. 22, 1304–1307 (1969).
- (33) Shah, J. Hot electrons and phonons under high intensity photoexcitation of semiconductors. Solid-State Electron. 21, 43–50 (1978).
- (34) Shah, J. Ultrafast Spectroscopy of Semiconductors and Semiconductor Nanostructures, vol. 115 of Springer Series in Solid-State Sciences (Springer, Berlin, 1999).
- (35) Kesler, M. P. & Ippen, E. P. Subpicosecond gain dynamics in GaAlAs laser diodes. Appl. Phys. Lett. 51, 1765–1767 (1987).
- (36) Stix, M. S., Kesler, M. P. & Ippen, E. P. Observations of subpicosecond dynamics in GaAlAs laser diodes. Appl. Phys. Lett. 48, 1722–1724 (1986).
- (37) Gomatam, B. & DeFonzo, A. Theory of Hot Carrier Effects on Nonlinear Gain in GaAs-GaAlAs Lasers and Amplifiers. IEEE J. Quantum Electron. 26, 1689–1704 (1990).
- (38) Jahnke, F. & Koch, S. W. Theory of carrier heating through injection pumping and lasing in semiconductor microcavity lasers. Opt. Lett. 18, 1438 (1993).
- (39) Pompe, G., Rappen, T. & Wegener, M. Transient response of an optically pumped short-cavity semiconductor laser. Phys. Rev. B 51, 7005–7009 (1995).
- (40) Jahnke, F., Schneider, H. C. & Koch, S. W. Combined influence of design and carrier scattering on the ultrafast emission dynamics of quantum well microcavity lasers. Appl. Phys. Lett. 69, 1185–1187 (1996).
- (41) Michler, P., Lohner, A., Rühle, W. W. & Reiner, G. Transient pulse response of microcavity lasers. Appl. Phys. Lett. 66, 1599–1601 (1995).
- (42) Michler, P. et al. Emission dynamics of and 2 microcavity lasers. Appl. Phys. Lett. 68, 156–158 (1996).
- (43) Coldren, L. A., Corzine, S. W. & Mašanović, M. L. Diode Lasers and Photonic Integrated Circuits (Wiley, Hoboken, 2012).
- (44) Maslov, A. & Ning, C. Modal gain in a semiconductor nanowire laser with anisotropic bandstructure. IEEE J. Quantum Electron. 40, 1389–1397 (2004).
- (45) Ning, C. Z. Semiconductor nanolasers. Phys. Status Solidi B 247, 774–788 (2010).
- (46) Li, J. & Ning, C. Z. Plasma heating and ultrafast semiconductor laser modulation through a terahertz heating field. J. Appl. Phys. 88, 4933–4940 (2000).
- (47) Yamaoka, S. et al. Directly modulated membrane lasers with 108 GHz bandwidth on a high-thermal-conductivity silicon carbide substrate. Nat. Photonics 15, 28–35 (2021).
- (48) Ning, C. Z., Indik, R. A. & Moloney, J. V. Self-consistent approach to thermal effects in vertical-cavity surface-emitting lasers. J. Opt. Soc. Am. B 12, 1993–2004 (1995).
- (49) Jahnke, F., Henneberger, K., Schäfer, W. & Koch, S. W. Transient nonequilibrium and many-body effects in semiconductor microcavity lasers. J. Opt. Soc. Am. B 10, 2394 (1993).
- (50) Grabmaier, A. et al. Linewidth enhancement factor and carrier-induced differential index in InGaAs separate confinement multi-quantum-well lasers. J. Appl. Phys. 70, 2467–2469 (1991).
- (51) Altug, H., Englund, D. & Vučković, J. Ultrafast photonic crystal nanocavity laser. Nat. Phys. 2, 484–488 (2006).
- (52) Romeira, B. & Fiore, A. Purcell Effect in the Stimulated and Spontaneous Emission Rates of Nanoscale Semiconductor Lasers. IEEE J. Quantum Electron. 54, 1–12 (2018).
- (53) Khurgin, J. B. & Sun, G. Comparative analysis of spasers, vertical-cavity surface-emitting lasers and surface-plasmon-emitting diodes. Nat. Photonics 8, 468–473 (2014).
- (54) Pellegrino, D. et al. Mode-field switching of nanolasers. APL Photonics 5, 066109 (2020).
- (55) Suhr, T., Gregersen, N., Yvind, K. & Mørk, J. Modulation response of nanoLEDs and nanolasers exploiting Purcell enhanced spontaneous emission. Opt. Express 18, 11230–11241 (2010).
- (56) Gregersen, N., Suhr, T., Lorke, M. & Mørk, J. Quantum-dot nano-cavity lasers with Purcell-enhanced stimulated emission. Appl. Phys. Lett. 100, 131107 (2012).
- (57) Henneberger, K. et al. Spectral hole burning and gain saturation in short-cavity semiconductor lasers. Phys. Rev. A 45, 1853–1859 (1992).
- (58) Henneberger, K., Jahnke, F. & Herzel, F. Many-Body Effects and Multi-Mode Behaviour in Semiconductor Lasers. Phys. Status Solidi B 173, 423–439 (1992).
- (59) Jahnke, F., Koch, S. W. & Henneberger, K. Dynamic response of short-cavity semiconductor lasers. Appl. Phys. Lett. 62, 2313–2315 (1993).