Çakmak et al
*Hikmet Çakmak
Astrophysical Parameters and Dynamical Evolution of Open Clusters: NGC 2587, Col 268, Mel 72, Pismis 7
Abstract
We determined astrophysical and dynamical parameters of the open clusters (OCs) NGC 2587, Collinder 268 (Col 268), Melotte 72 (Mel 72), and Pismis 7 from Gaia DR2 photometric/astrometric data and a new technique, fitCMD.
fitCMD provides (Z, Age(Gyr)) as (0.025, 0.45) for NGC 2587, (0.0025, 0.5) for Col. 268, (0.011, 1.25) for Mel 72, and (0.008, 1.00) for Pismis 7, respectively. As compared to Gaia DR2 distances , the obtained photometric distances from fitCMD provide somewhat close distances. For NGC 2587 and Mel. 72, both distances are in good concordance.
Except for NGC 2587, the ages of the remaining OCs are higher than their relaxation times, which suggests that they are dynamically relaxed. NGC 2587 did not undergo dynamical evolution. Mel 72 and Pismis 7 with relatively flat MF slopes indicate signs of a somewhat advanced dynamical evolution, in the sense that they appear to have lost a significant fraction of their low-mass stars to the field. Pismis 7’s negative/flat MFs indicates that its high mass stars slightly outnumber its low mass ones. Given its mild dynamical evolution, the high mass stars move towards the central region, while low-mass stars are continually being lost to the field. Col 268 presents small dimensions which suggest a primordial origin. The outer parts of Mel 72 and Pismis 7 - with large cluster radii expand with time, while Mel 72’s core contracts because of dynamical relaxation (Figs. 10e–f).
keywords:
open clusters and associations: individual NGC 2587, open clusters and associations: individual Col 268, open clusters and associations: individual Mel 72, open clusters and associations: individual Pismis 7, , , and (\cyearXXXX), \ctitleRevealing Dynamical Properties of Open Clusters: NGC 2587, Col 268, Mel 72, Pismis 7, \cjournalAN, \cvolXXX;XX:X–X.
1 Introduction
Astrophysical parameters (reddening, distance, age), structural parameters (core and cluster radii, and ), and overall masses, mass function slopes (, MF slopes), relaxation times and evolutionary parameters of the open clusters (OCs) are needed for the interpretation of the dynamical evolution. The stars inside the OCs undergo internal and external perturbations such as stellar evolution, mass segregation, and encounters with the disk and Giant Molecular Clouds (GMCs) (Lamers & Gieles, 2006), (Gieles et al., 2007). All these process produce a varying degree of mass loss that may lead to the cluster dissolution into the field. Mass segregation preferentially drives the low mass stars to the outer parts of the clusters.
Our sample OCs, NGC 2587, Col. 268, Mel. 72, and Pismis 7 were studied in 2MASS by Bukowiecki et al. (2011, hereafter, B11) and Kharchenko et al. (2013, hereafter, K13). Tadross (2011) published the astrophysical parameters of NGC 2587 in 2MASS. The astrophysical parameters of Mel 72 were derived in photometry by Hasegawa et al. (2008) and Piatti et al. (2009). B11 published their astrophysical/structural parameters, and their masses/MF slopes, except for Pismis 7. K13 also gave their astrophysical parameters together with their core radii (Tables 6–7).
The likely members of four OCs have been determined from Gaia DR2 astrometric/photometric data (Brown et al., 2018; Lindegren et al., 2018). To study the issues above, the well-determined cluster parameters (heavy element abundance, colour excess, distance modulus/distance, age and mass) are needed. For this, we employ an approach fitCMD, designed by Bonatto (2019). fitCMD uses the isochrones of Bressan et al. (2012) (hereafter B12) and , , filters.
This paper is organized as follows. The cluster membership technique is presented in Section 2. The derivation of reddenings, distance moduli/distances, ages of four OCs from fitCMD algorithm is explained in Section 3. The obtained cluster dimensions, masses/mass function slopes, relaxation times/ evolutionary parameters of four OCs are given in Sections 4–5. A Discussion/Conclusion is presented in Section 6 together with the sub-sections; a comparison with the literature and the dynamical evolution.
| Cluster | ||||
|---|---|---|---|---|
| (h m s) | ||||
| NGC 2587 | 08 23 22.9 | -29 31 02.1 | 249.46 | 4.46 |
| Col 268 | 13 18 11.4 | -67 05 00.0 | 305.54 | -4.35 |
| Mel 72 | 07 38 31.3 | -10 41 51.4 | 227.84 | 5.38 |
| Pismis 7 | 08 41 08.0 | -38 42 08.6 | 259.05 | 1.99 |
| Cluster | (mas/yr) | (mas/yr) | (mas/yr) | (mas) | |
|---|---|---|---|---|---|
| NGC 2587 | -4.270.08 | 3.570.08 | 0.21 | 0.310.03 | 3.250.08 |
| Col 268 | -5.480.08 | -0.400.07 | 0.19 | 0.370.06 | 2.670.13 |
| Mel 72 | -4.180.08 | 3.660.07 | 0.21 | 0.380.05 | 2.610.08 |
| Pismis 7 | -3.310.09 | 2.770.10 | 0.15 | 0.190.04 | 4.820.35 |
| NGC 2587 | -4.260.09 | 3.590.11 | 0.300.05 | 3.390.59 | |
| Col 268 | -5.480.09 | -0.400.08 | 0.360.04 | 2.800.30 | |
| Mel 72 | -4.160.11 | 3.680.09 | 0.370.06 | 2.710.40 | |
| Pismis 7 | -3.310.09 | 2.790.13 | 0.150.06 | 6.672.44 |


2 Separation of the Cluster Members
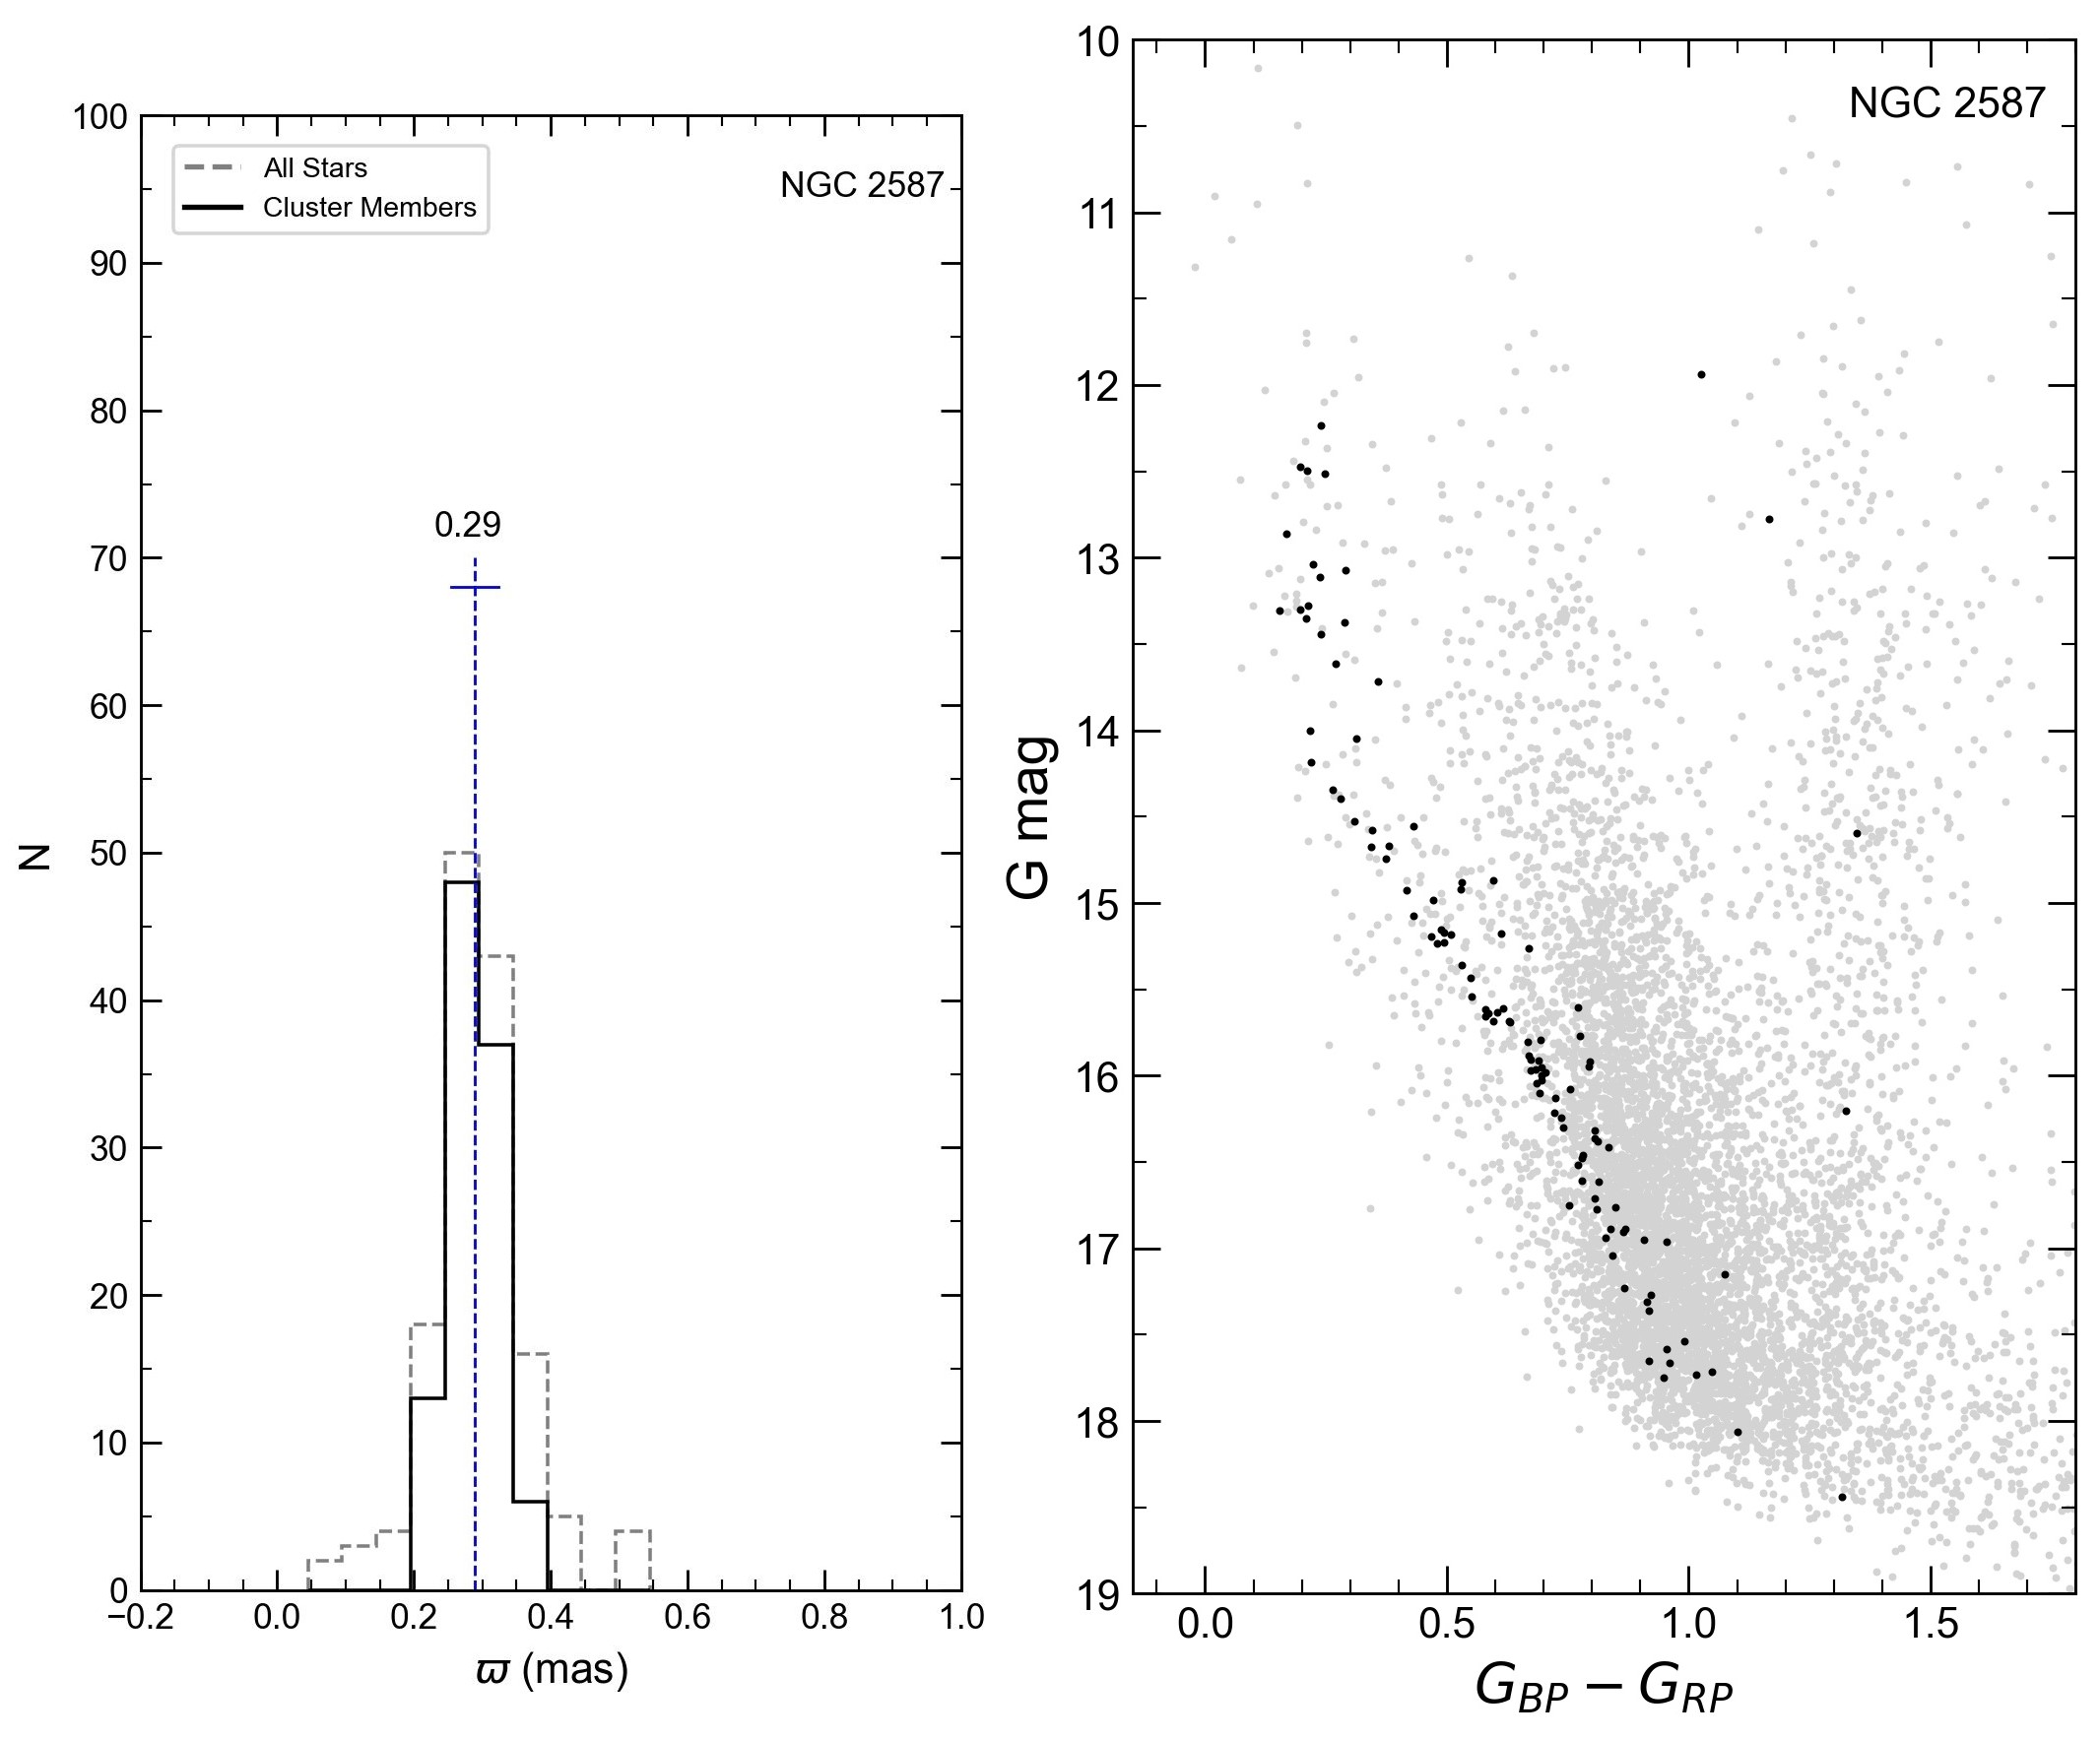
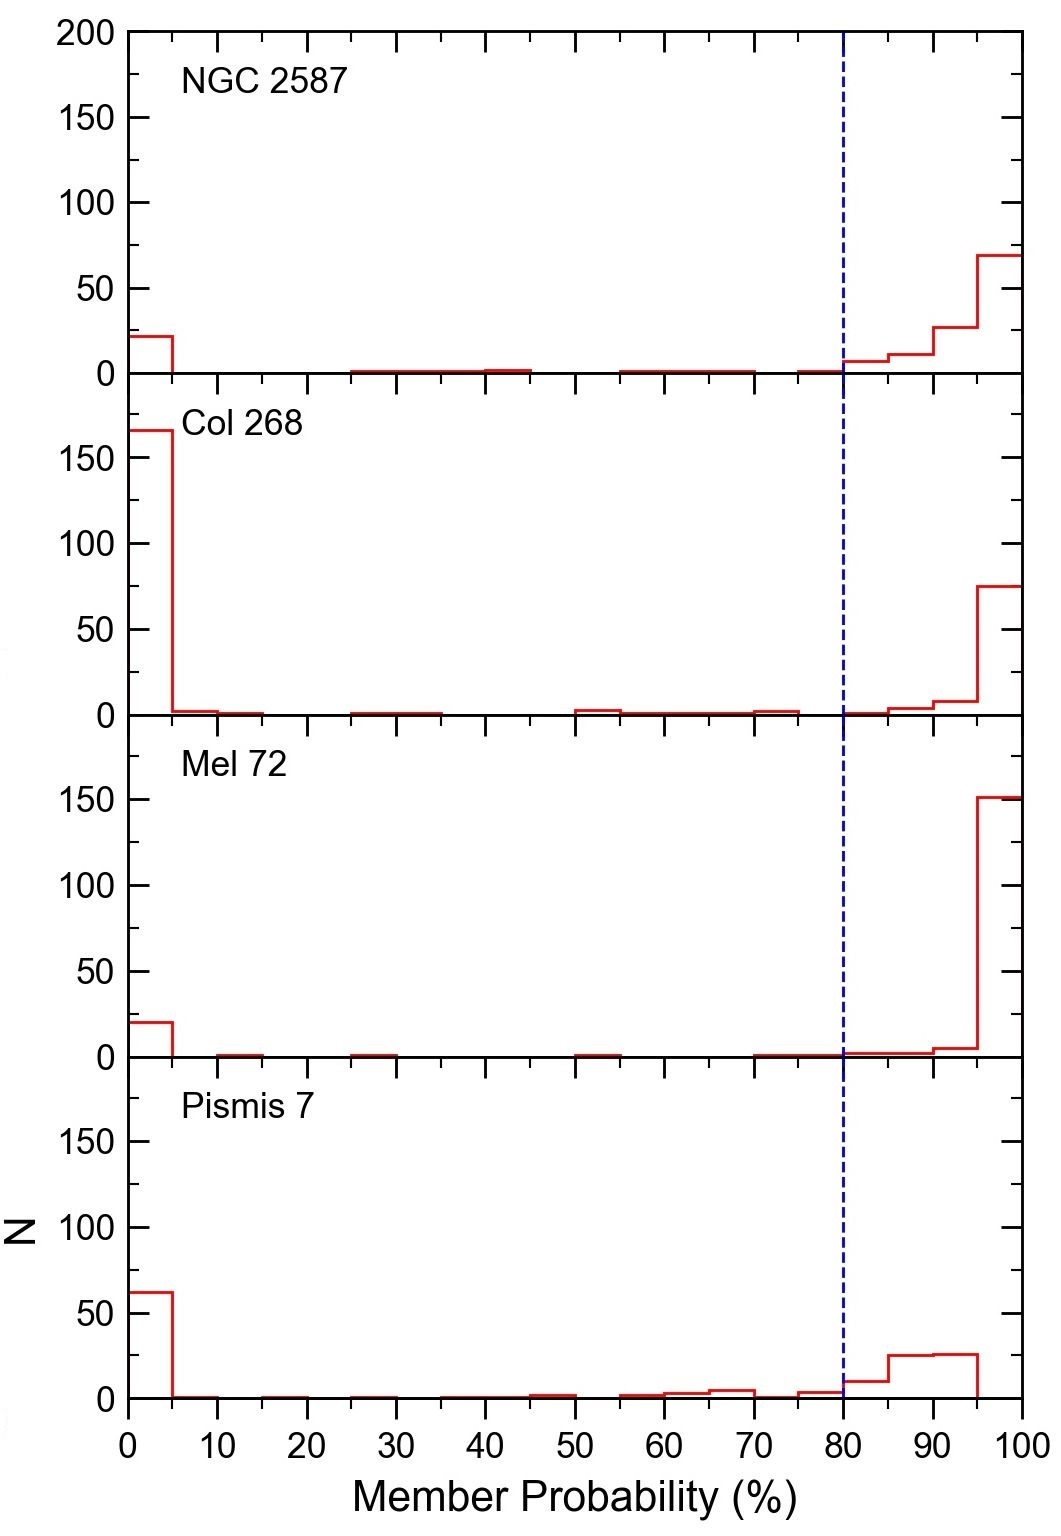
In order to separate the cluster members of NGC 2587, Col 268, Mel 72 and Pismis 7, we have obtained their Gaia DR2 astrometric/photometric data (Brown et al., 2018) for a large-area (15 arcmin) from VizieR111http://vizier.u-strasbg.fr/viz-bin/VizieR?-source=II/246.. Their cluster stars are shown on the (, ) diagrams (hereafter, VPD) (Figs. 1–2). The potential cluster members show a more concentrated structure, whereas field stars have a more scattered distribution. The eye-fitted proper motion radii (red circles) represent the cluster region. They have been constructed via the mathematical equations, and . Here, (x0, y0) are the median values of (, ) (mas yr-1), the radius mas yr-1, and = to . These propor motion radii are listed in Col. 4 of Table 2, and they are a good compromise for the likely cluster members. The median values of the proper motion histograms on top/right of the VPDs (vertical/horizontal blue lines) make it easier to determine the proper motion value of the cluster’s center. The median values () of the parallax histograms (bottom-left panels) for the cluster stars inside the red circles classify the probable members. By applying Gaussian Mixture Model (GMM) Pedregosa et al. (2011) to the probable members inside mas, their membership probabilities, P() have also been determined in order to check. They have greater than 80 (vertical dashed lines of Fig. 3). The GMM 222 is defined /. Here is the total probability distribution. c and f subscripts for cluster and field parameters, respectively. The used parameters for estimation of and are , , , , , . model considers that the distribution of proper motions of the stars in a cluster’s region can be represented by two elliptical bivariate Gaussians. The expressions used can be found in the papers of Balaguer-Nunez et al. (1998), Wu et al. (2002), Sariya et al. (2012) and Dias et al. (2018). These probable members provide good single stellar sequence on the Gaia DR2 colour–magnitude diagrams (CMDs) (bottom-right panels of Figs. 1–2), and thus they are considered for determining the astrophysical parameters. Note that the scatter of the members on the of Pismis 7 is similiar to Fig. 2 of Ahumada (2005). The estimated median equatorial coordinates from the likely members of our OCs are listed in Table 1. These coordinates are similar to those of WEBDA (Mermilliod, 1992).
Instead of the inverse of Gaia-DR2 parallaxes, the distances of four OCs are obtained from the posterior probability density functions (PDFs)333https://www2.mpia-hd.mpg.de/ calj/gedr3-distances/main.html given by Bailer-Jones et al. (2018) and Bailer-Jones et al. (2021). For this, we use the global zero point of 0.017 mas (Lindegren et al., 2021). The median proper motion components/the proper motion radii and the median parallaxes/distances of four OCs are listed in Table 2. Within the errors, their median values are in compatible with those of Cantat-Gaudin et al. (2018) and Cantat-Gaudin et al. (2020) (bottom panel of Table 2). However, note that both median parallaxes of Pismis 7 are somewhat different.
3 Derivation of Reddening, Distance, Age and Mass
In order to obtain the astrophysical parameters from Gaia DR2 for the probable members of four OCs, an approach (fitCMD), improved by Bonatto (2019) is utilised. fitCMD is to transpose theoretical initial mass function properties for the isochrones of given age and metallicity to their observational CMDs. Based on initial mass function (IMF) properties of the B12 PARSEC isochrones444http://stev.oapd.inaf.it/cgi-bin/cmd., fitCMD searches for the values of cluster stellar mass , , global metallicity (), foreground reddening , distance modulus , and magnitude-dependent photometric completeness that produce the artificial and observational CMDs. The adopted parameter ranges are presented in Table 3. The photometric completeness limits which are estimated from Fermi function are given in row 9 of Table 3.
For the members, a Gaia DR2 CMD with the IMF is built for each isochrone (at and no reddening). By CMD cell- containing stars with mass in the range , the following parameters are obtained, the number of stars per cluster mass and the average mass (), which basically involves integrating the mass function () between : . Each CMD cell contains the respective relative density (number per cluster mass) of occurrence of stars, which is equivalent to the classical Hess diagram, . The parameter search consists on finding the absolute minimum of the residual hyper-surface defined as , where is the observed Hess diagram and is the simulated one. Here, , , , mean the colour excess, distance modulus, the steepness of the descent, and turn-off magnitude, respectively. The adopted thresholds/Hess cell numbers/Hess widths for Gaia colours/magnitudes are listed in rows 7–8 of Table 3. The values for seven parameters at the absolute minimum are assumed to represent those of the star cluster. In practical terms, locating the minima of is equivalent to finding the parameters that minimize the quantity . Here, on the colour/magnitude plane. The sum runs over all Hess cells and is the statistical weight of each cell. corresponds to the inverse of the observed Hess density computed at the respective magnitude of each cell, i.e. . Residual minimization between observed and synthetic CMDs – by means of the global optimization algorithm – then leads to the best-fitting parameters. (Simulated Annealing) is an iterative and statistical technique. For any given step , it randomly selects a new set of parameters (, , , , , , ) from the respective ranges. thus, concentrates on smaller parameter ranges, centred around the most promising values, and a new step is taken. Iterations stop when meets the convergence criterion: five consecutive repetitions of the same value of . However, for the statistical nature of , fitCMD should be repeated a few times to minimize the probability of getting stuck into a deep, but secondary minimum.
| Cluster | NGC 2587 | Col 268 | Mel 72 | Pismis 7 |
|---|---|---|---|---|
| Cluster (stellar) mass (m⊙) | 100-1000 | 10-10000 | 100-1000 | 10-10000 |
| (mag) | 10.0-15.0 | 10.8-15.1 | 10.0-15.0 | 12.0-17.0 |
| (mag) | 0.00-1.00 | 0.0074-1.76 | 0.00-1.00 | 0.00-2.00 |
| Age (Myr) | 100 - 1000 | 100-1000 | 100-10000 | 120-13500 |
| 0.0001 - 0.03 | 0.0001-0.03 | 0.0001-0.03 | 0.0001-0.03 | |
| (mag) | 3.1 | 3.1 | 3.1 | 3.1 |
| threshold/Hess Cell/Cell width (mag) | (0.08-1.41)/67/0.020 | (0.37-2.20)/92/0.020 | (0.19-1.64)/73/0.020 | (0.63-2.58)/98/0.020 |
| threshold/Hess Cell/Cell width (mag) | (11.75-18.06)/64/0.100 | (11.15-17.58)/65/0.100 | (12.31-19.40)/71/0.101 | (12.00-18.83)/69/0.101 |
| Photometric completeness (mag) | ||||
| Usable members | 118 | 128 | 273 | 204 |
show the likely members which are greater than 80 inside mas.
The efficiency of fitCMD for input parameters is tested with simulated CMDs, built with pre-defined values of seven parameters. Individual stellar masses are attributed according to Kroupa’s IMF (Kroupa, 2001) - for masses larger than - until the sum matches ; the respective magnitudes are taken from the PARSEC isochrone corresponding to and . Typical photometric uncertainties are added for each Gaia DR2 filters and their uncertainties . If the age, metallicity, distance modulus and colour excess are reasonably well determined, the ratio observed/artificial Hess cells content corresponds to .
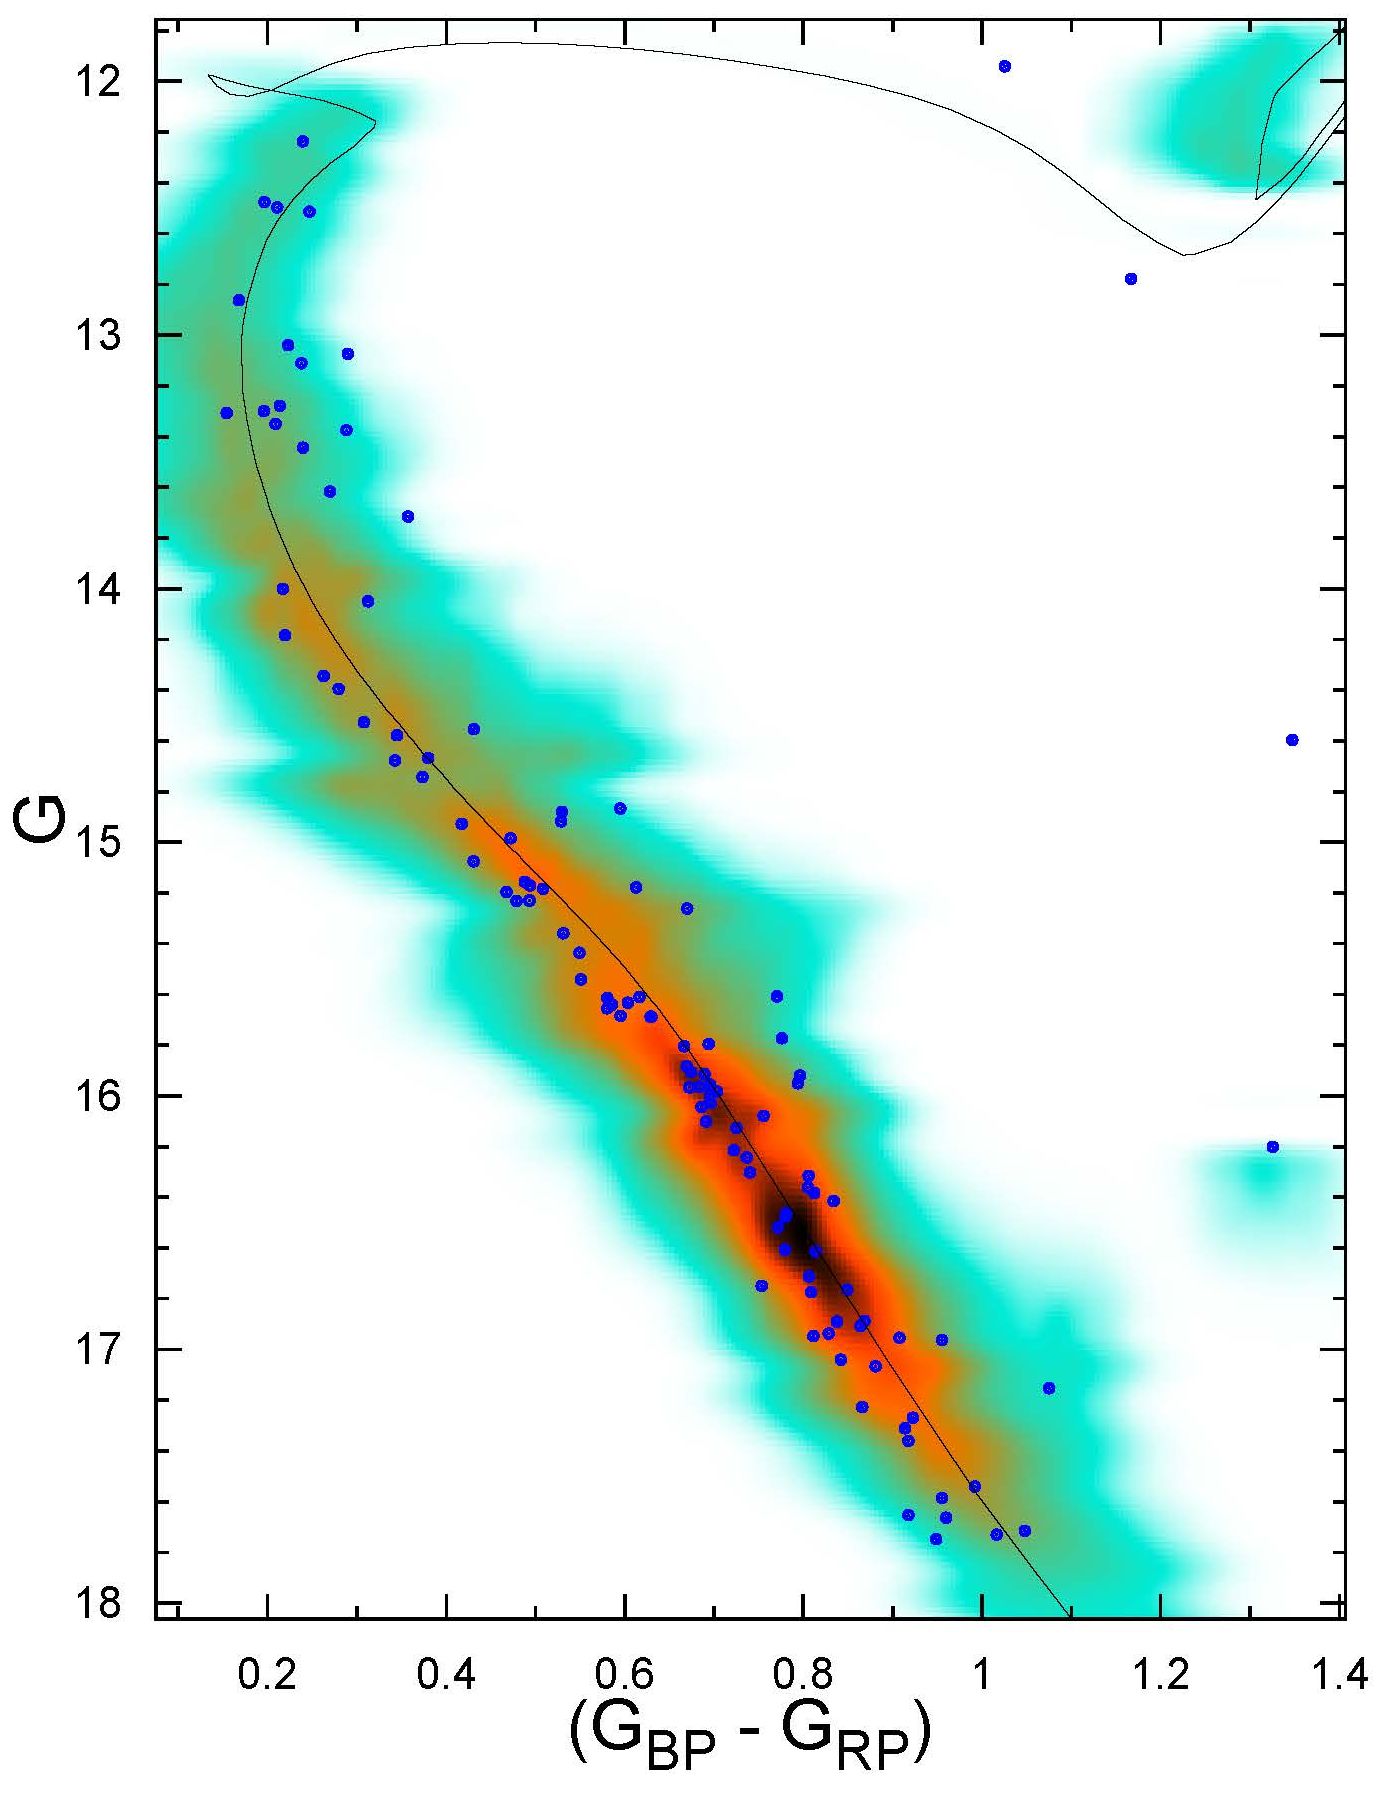
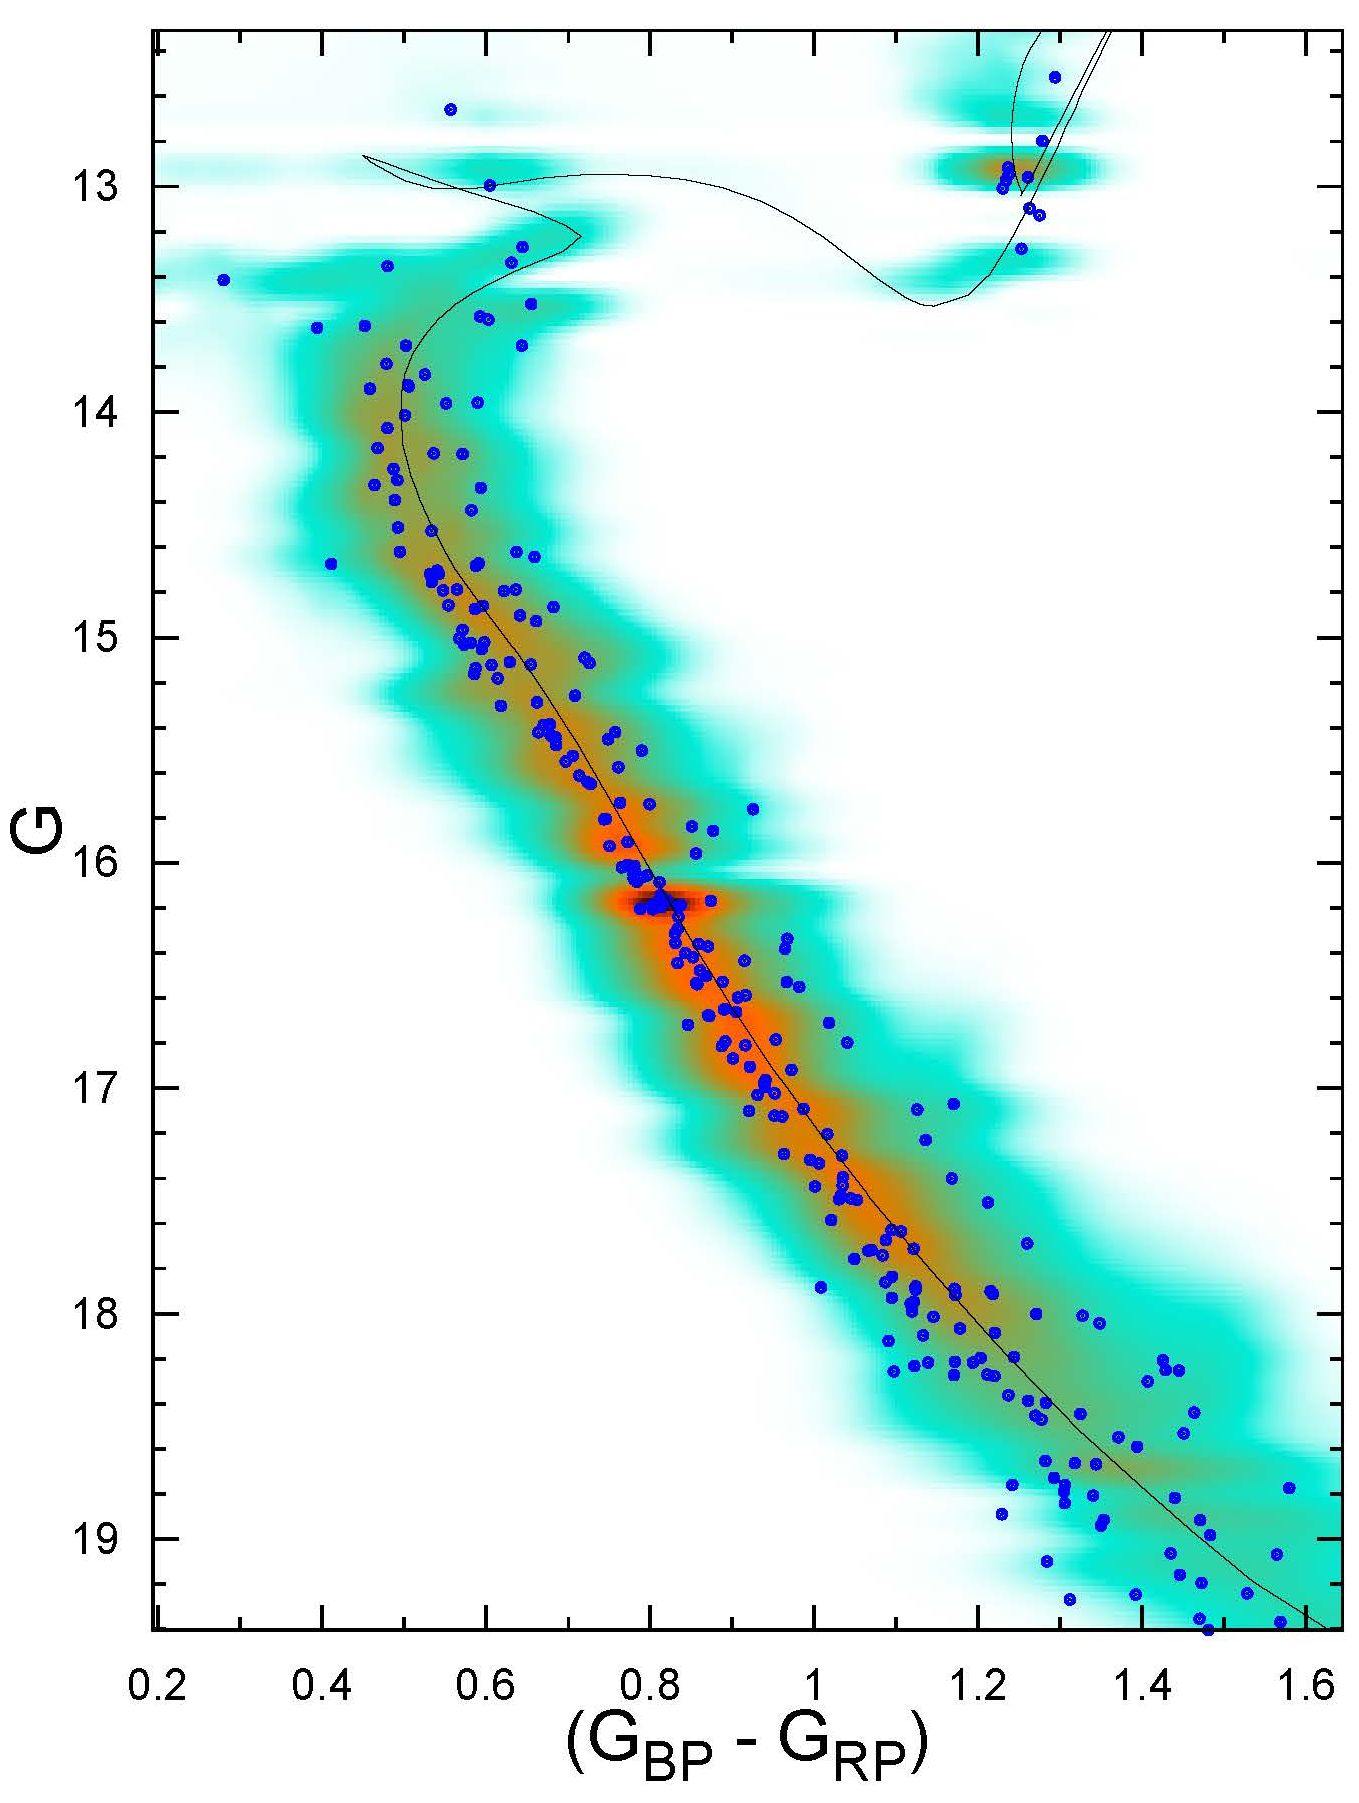
The obtained best-fitting astrophysical parameters , , , , d (pc) and Age (Gyr) are given in Table 6. The observed CMDs (Hess diagrams) are shown in Figs. 4–5. The B12 isochrones (solid red lines) fit well the main sequence (MS), turnoff (TO) and Red Giant/Red Clump (RG/RC) regions.


4 Dimension and Mass Function
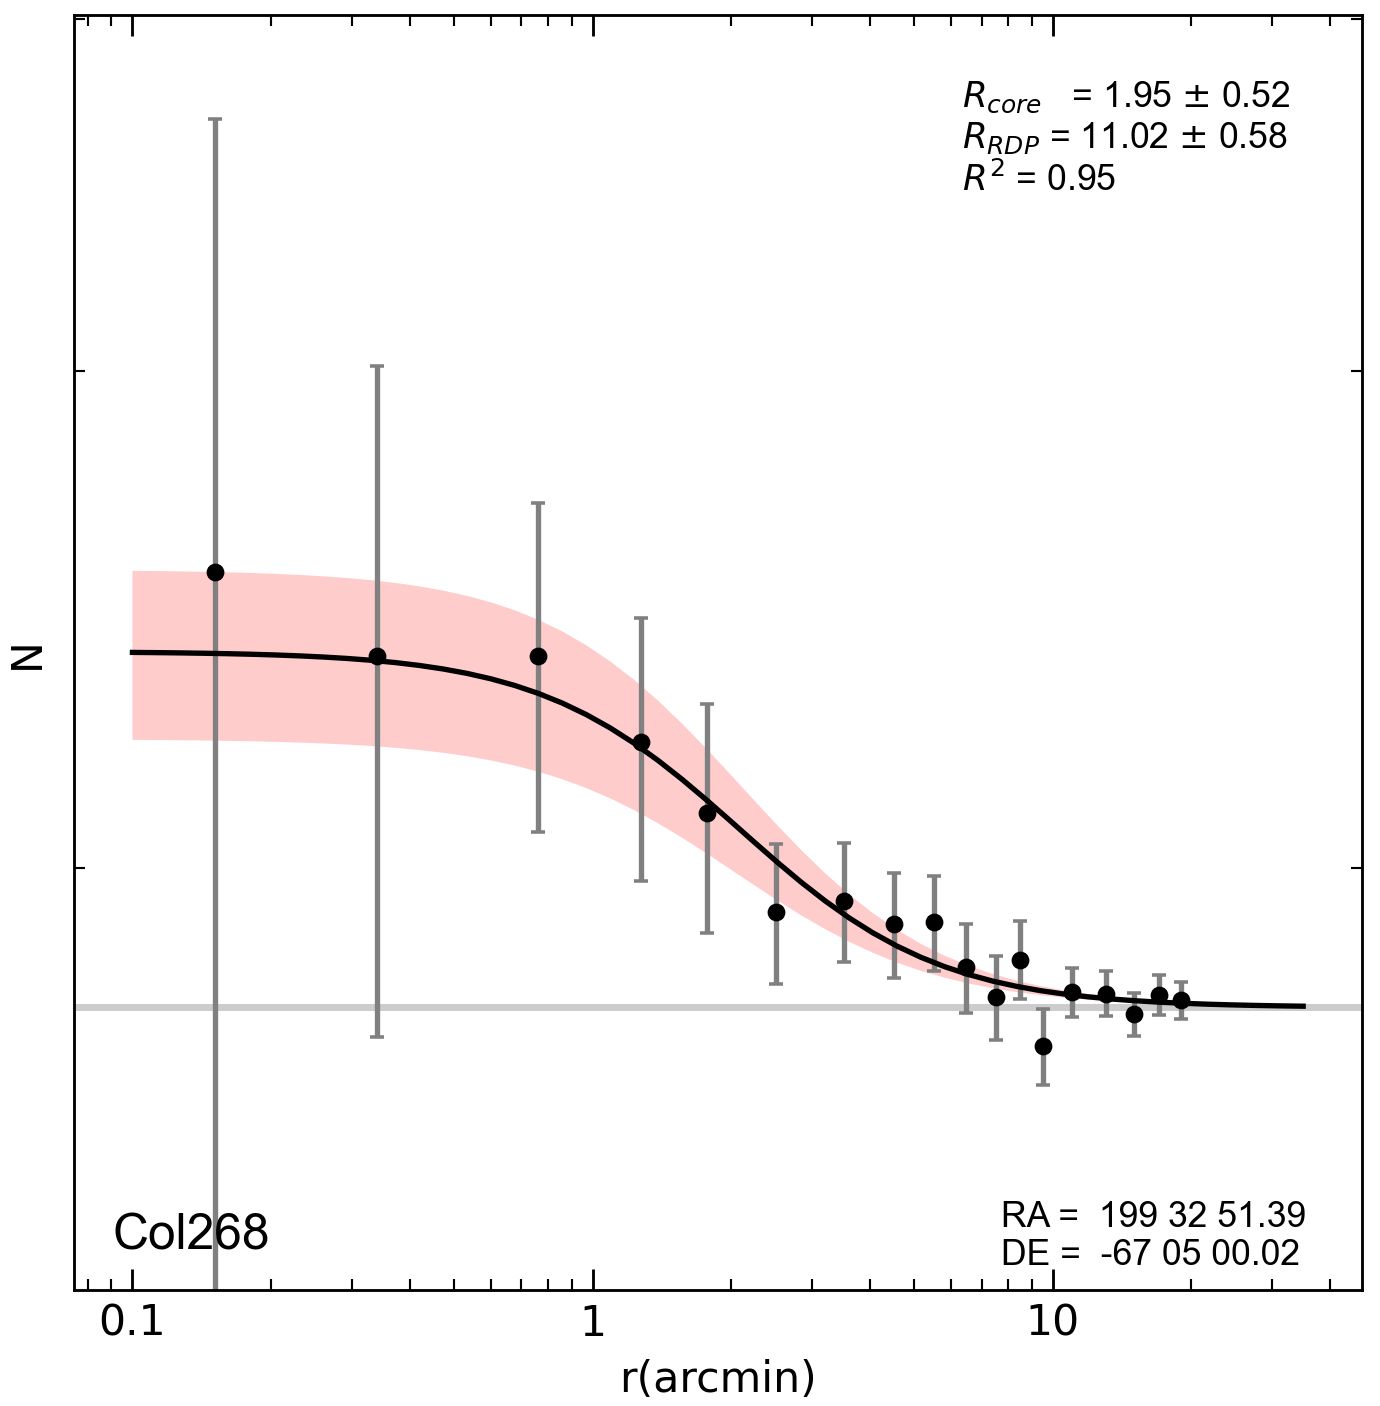
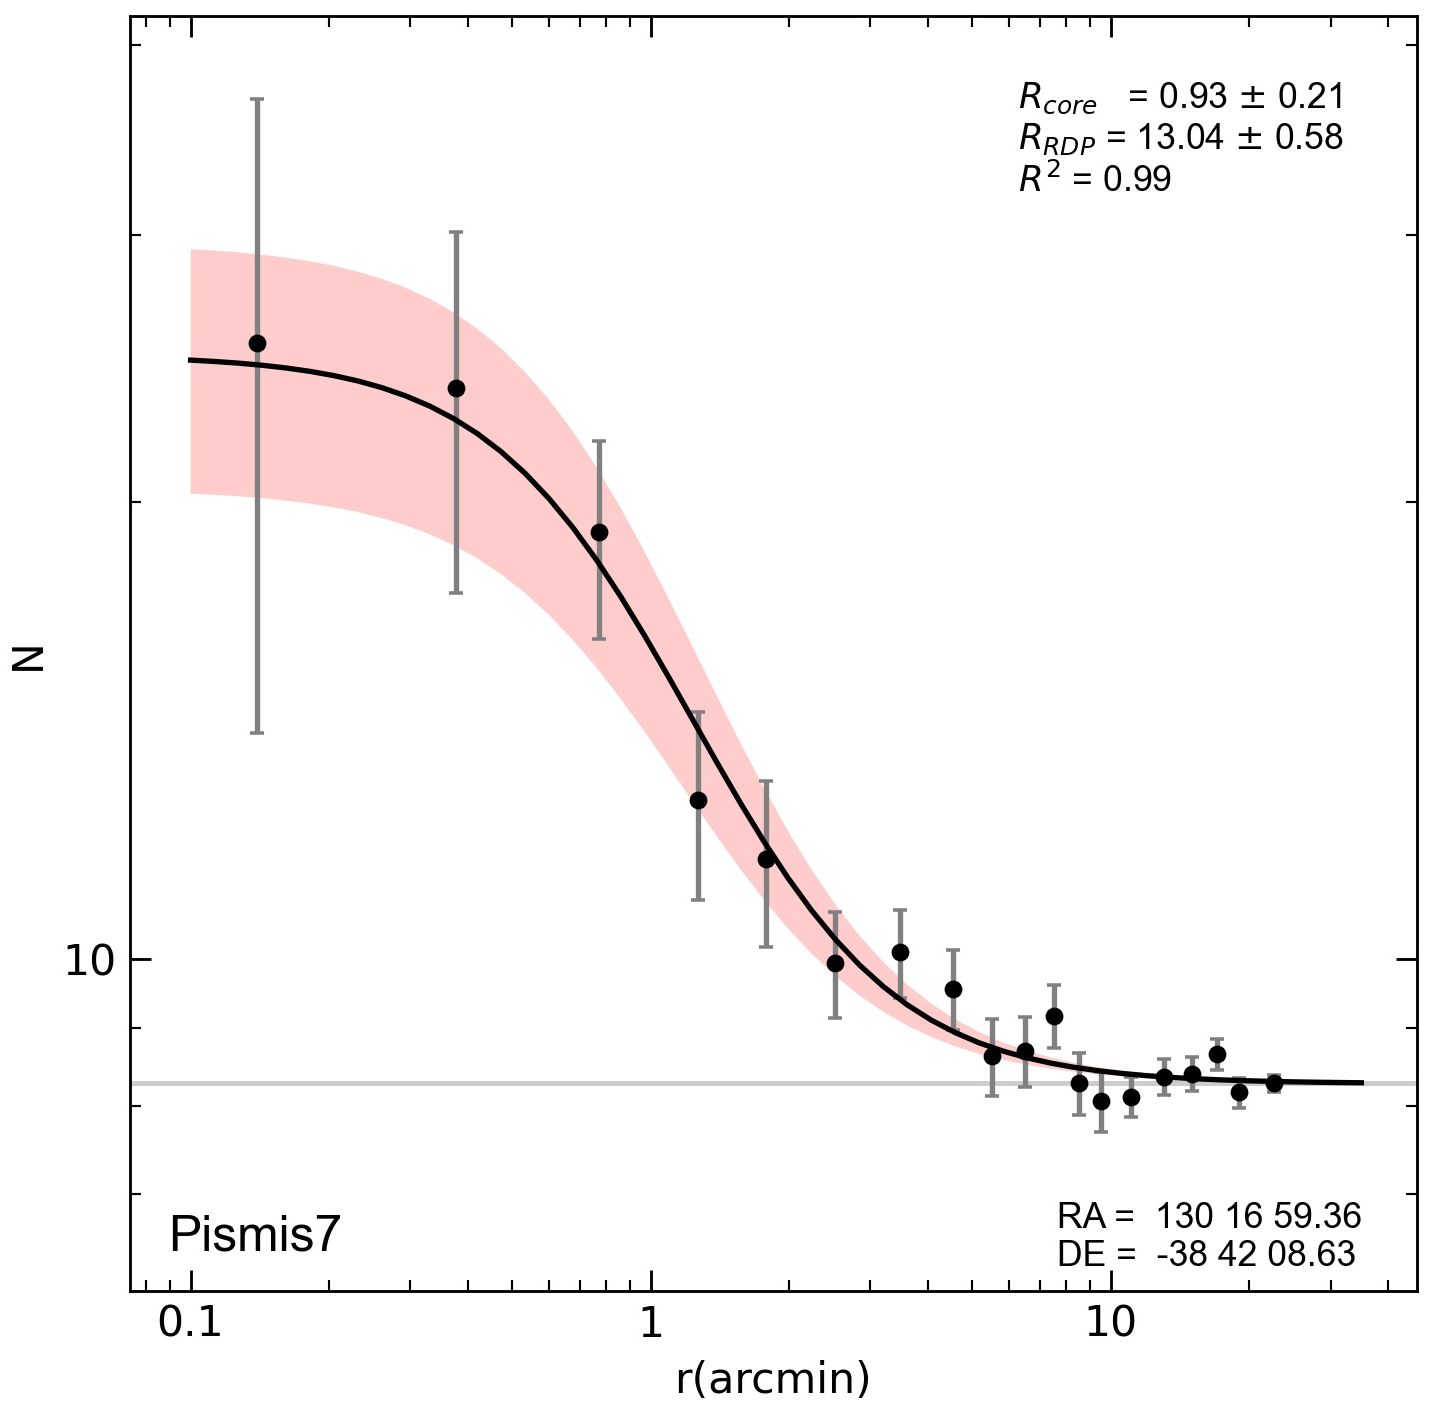
By utilising the stellar radial density profiles (RDPs), we have derived structural parameters of four OCs. The fitted RDPs of four OCs to the relation of King (1966) have been displayed in Fig. 6. For this, the three-parameter function, , given by King (1966) is considered. For this equation, is the residual background density. and are the central density of stars and the core radius, respectively. The meanings of solid line, horizontal bar and the shaded area are mentioned in caption of Fig. 6. We obtained the cluster radii by comparing the RDP level with background and by measuring the distance from the centre. The , , and of four OCs have been derived from the fitted King profile to the observational RDPs (Fig. 6). The large uncertainties within in the RDPs are due to their low star contents in their central parts. These structural parameters are listed in Cols. 3-10 of Table 7.
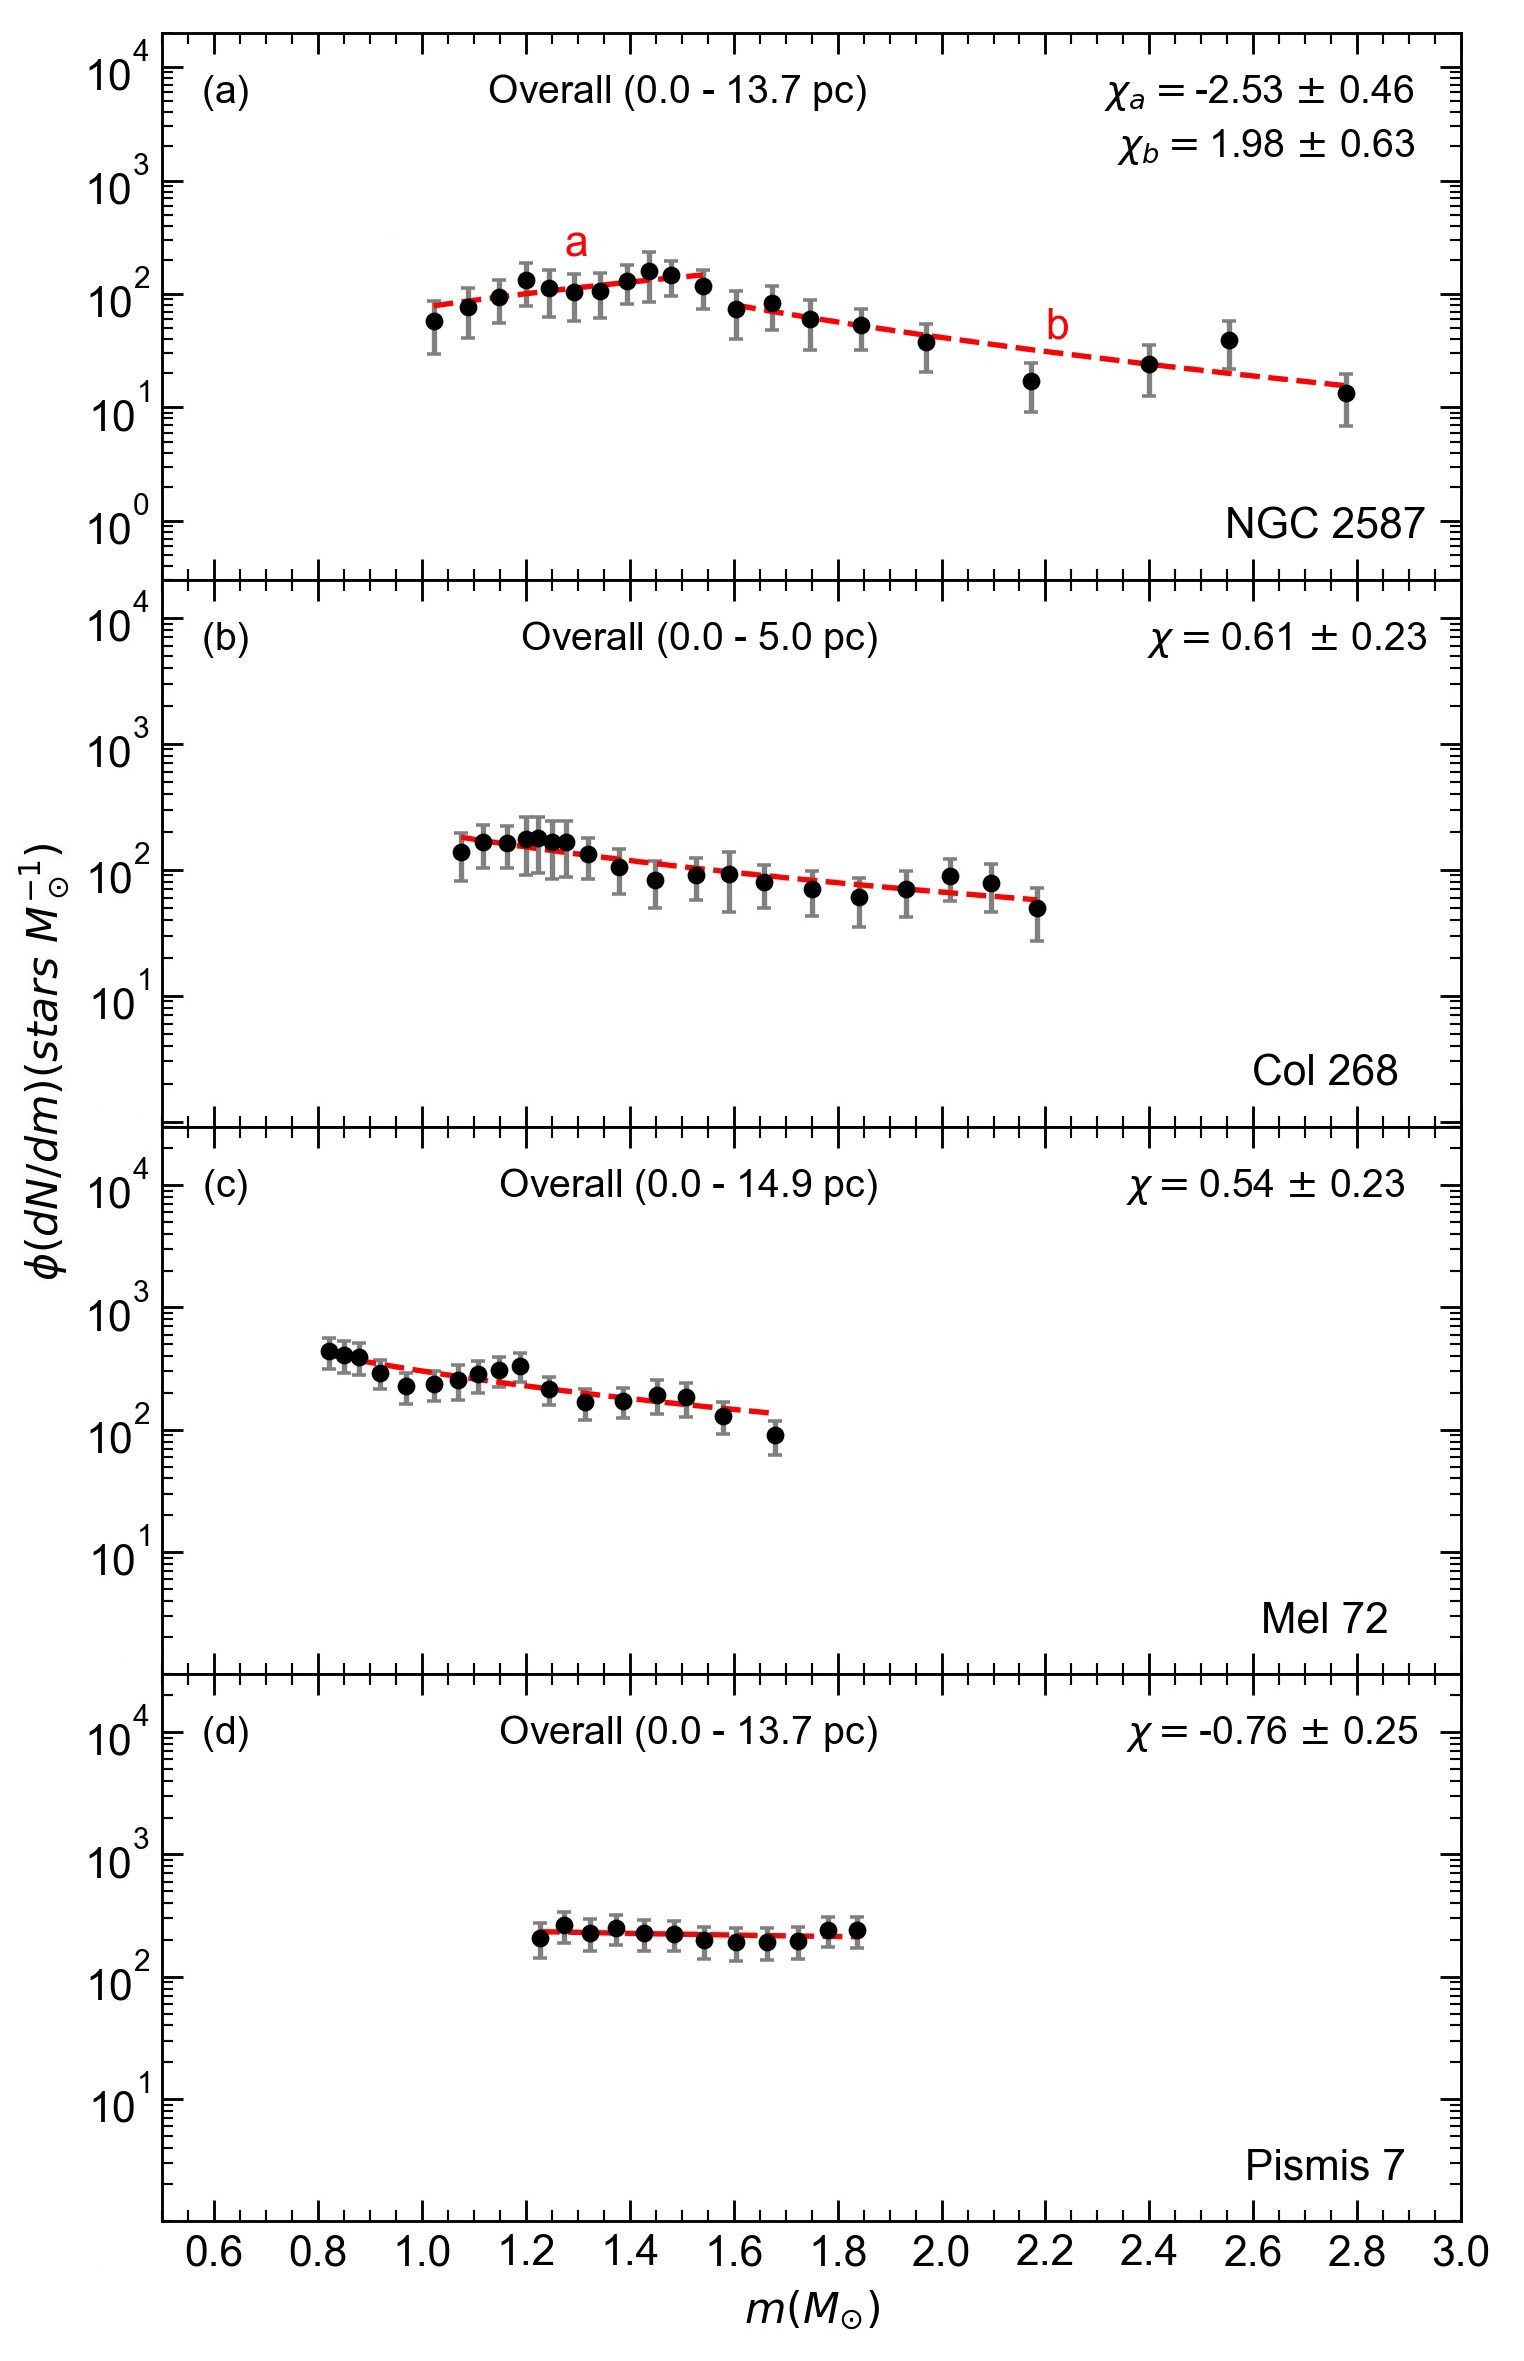
From the obtained masses from fitCMD (Sect. 3), the mass function relation of versus m() is displayed in Fig. 7 for the overall parts of four OCs. Table 4 provides the mass information. The observed number of stars and the corresponding total mass (obviously, the mass is computed by the simulation) are listed in Cols. 4-5. The mass range (Col 3) refers to the mass which is actually present in the observed CMDs, while and star number (Cols. 6-7) refer to fitCMD’s full simulation (including stars with ). Ideally, the simulated number of stars should be exactly the same as the observed, but sometimes there are residual field stars. The full simulation corresponds to the whole mass range assumed to be present in the cluster. For instance, in the case of NGC 2587, the observed CMD contains 118 stars with in the mass range: 0.96–3.09 ; if we had access to the full range, the stars would have masses between 0.08 to 3.09 . Therefore, fitCMD computes the values for this full range as 1621 stars storing 681 .
The MF slopes shown in the plots are the observed ones, i.e., those computed directly from the observed CMDs. The theoretical IMF is used only for the purpose of estimating the completeness-corrected mass (by estimating the difference in the number of stars actually detected at a given magnitude with respect to the expected one). Therefore, all the other parameters are unaffected by this procedure.
The MFs of NGC 2587 (Fig. 7) presents a break followed by slope flattening for masses in the range , which is noticeable particularly in the overall region. Up to , its overall MFs is very steep negative . After , this MFs becomes very steep positive . Since the break occurs at , it is not the same as that implied by Kroupa’s mass function . This break is due to completeness affecting masses lower than . We use the MFs for as representative of the overall cluster. This mass range does not seem to be critically affected by completeness. The overall MF slopes of Col 268 and Mel 72 are quite positive/flat and , respectively. Pismis 7’s overall MFs is negative/flat .
| Cluster | r (pc) | mass range- | N | N | ||
|---|---|---|---|---|---|---|
| NGC 2587 | 0.0–13.7 | 0.96-3.09 | 118 | 180 | 1621 | 681 |
| Col. 268 | 0.0–5.0 | 0.84-2.52 | 128 | 170 | 1901 | 748 |
| Mel. 72 | 0.0–14.9 | 0.66-2.06 | 273 | 310 | 2546 | 950 |
| Pismis. 7 | 0.0–13.7 | 1.06-2.18 | 204 | 230 | 2575 | 973 |
5 Relaxation time and Evolutionary parameter
The relaxation times, (Myr) of four OCs are obtained from a relation, . Here N is the number of stars located inside the cluster radius, . As an indicator of dynamical evolution, the evolutionary parameters are estimated from the relation of . The relations of these time scales can be found in the works of Bonatto et al. (2005), Bonatto & Bica (2006) and Bonatto & Bica (2007). By adopting as an upper value explicitly (Bonatto & Bica, 2011), instead of of Binney et al. (1998), these time scales are estimated and listed in Table 5.
gives the time required for the stars in the core/halo to travel from one end of these regions to the other (Stars move at ). Mass segregation (known as migrating from the cores to halo) is directly related to and . also depends on both age and . There is a negative relationship between and . Large and small correspond to advanced mass segregation, accordingly, small and large mean small scale mass segregation.
From the propagating the errors in Age (Col. 5 of Table 6), radii and N (Col.6 of Table 4) into and , the uncertainties of the evolutionary parameters are estimated. The errors in ages and radii are at a similar () level. If the uncertainties in the number of stars (N) become to be larger, this is responsible for a large uncertainty in (Table 5) and, consequently, a large uncertainty in the evolutionary parameter. Here, and are considered simply as an order of magnitude estimate.
| Cluster | ||
|---|---|---|
| NGC 2587 | 1120.7814.0 | 0.40.3 |
| Col 268 | 250.0142.5 | 2.01.2 |
| Mel 72 | 592.7341.0 | 2.11.2 |
| Pismis 7 | 148.8 105.0 | 6.74.8 |
| Cluster | & | [M/H] Z | & (pc) | Isochrone . | Phot. | Reference | |||||
| NGC 2587 | Bressan et al.(2012) | Gaia DR2 | This paper | ||||||||
| - | Bonatto et al.(2004) | 2MASS | 5 | ||||||||
| Lejuene&Schaerer (2001) | UBVI | 6 | |||||||||
| solar | Girardi et al.(2002) | 2MASS | 3 | ||||||||
| solar | Marigo et al.(2008) | 2MASS | 4 | ||||||||
| solar | Bressan et al.(2012) | Gaia DR2 | 10 | ||||||||
| Col 268 | Bressan et al.(2012) | Gaia DR2 | This paper | ||||||||
| - | - | - | 8 | ||||||||
| solar | Girardi et al.(2002) | 2MASS | 9 | ||||||||
| solar | Girardi et al.(2002) | 2MASS | 3 | ||||||||
| solar | Marigo et al.(2008) | 2MASS | 4 | ||||||||
| solar | Bressan et al.(2012) | Gaia DR2 | 10 | ||||||||
| Mel 72 | Bressan et al.(2012) | Gaia DR2 | This paper | ||||||||
| solar | MAI | 1 | |||||||||
| Bertelli et al.(2004) | BVI | 2 | |||||||||
| solar | Girardi et al.(2002) | 2MASS | 3 | ||||||||
| solar | Marigo et al.(2008) | 2MASS | 4 | ||||||||
| solar | Marigo et al.(2017) | Gaia DR2 | 11 | ||||||||
| solar | Bressan et al.(2012) | Gaia DR2 | 10 | ||||||||
| Pismis 7 | Bressan et al.(2012) | Gaia DR2 | This paper | ||||||||
| solar | Girardi et al.(2000) | BVRI | 7 | ||||||||
| solar | Girardi et al.(2002) | 2MASS | 3 | ||||||||
| solar | Marigo et al.(2008) | 2MASS | 4 | ||||||||
| solar | Bressan et al.(2012) | Gaia DR2 | 10 | ||||||||
-
(1):Piatti et al. (2010), (2):Hasegawa et al. (2008); (3): Bukowiecki et al.(2011); (4): Kharchenko et al. (2013); (5): Tadross (2011); (6):Piatti et al. (2009); (7): Ahumada (2005);(8): Moffat et al. (1975), (9) :Bica et al. (2008), (10): Cantat-Gaudin et al. (2020). (11): Hendy and Tadross (2021). MAI (Col. 6) means the morphologic age index.
| Cluster | CC | MFs | N | Reference | |||||||||
| NGC 2587 | 0.91 | 1.400.60 | 13.700.50 | 1.50.7 | 15.100.60 | 3.92.1 | 6.630.05 | 16-25 | 0.69 | 681 | 1.980.63 | 1621 | This paper |
| 0.690.10 | 5.530.79 | 174 | -1.13 | 105135 | 1 | ||||||||
| 1.710.49 | 2 | ||||||||||||
| Col 268 | 0.45 | 0.900.2 | 5.00.30 | 2.00.5 | 11.00.6 | 6.01.6 | 17.840.09 | 12-31 | 0.95 | 748 | 0.610.23 | 1901 | This paper |
| 0.970.14 | 5.620.72 | 478 | 2.05 | 13691230 | 1 | ||||||||
| 0.750.27 | 2 | ||||||||||||
| 0.600.20 | 3.700.30 | 3 | |||||||||||
| Mel 72 | 0.66 | 1.100.20 | 15.000.90 | 1.70.3 | 22.61.4 | 9.51.3 | 5.630.05 | 23-31 | 0.99 | 950 | 0.540.23 | 2546 | This paper |
| 0.800.10 | 8.21.00 | 647 | 0.70 | 7279616 | 1 | ||||||||
| 2.210.38 | 2 | ||||||||||||
| 0.310.06 | 3.410.10 | 0.450.09 | 5.00.15 | 223 | -2.200.10 | 168 | 4 | ||||||
| Pismis 7 | 1.05 | 0.900.20 | 13.700.60 | 0.90.2 | 13.00.6 | 16.74.6 | 8.270.06 | 14-21 | 0.99 | 973 | -0.760.25 | 2575 | This paper |
| 1.500.18 | 14.052.05 | 1 | |||||||||||
| 2.100.95 | 2 |
-
(1): Bukowiecki et al.(2011); (2): Kharchenko et al. (2013); (3):Bica et al. (2008); (4): Hendey and Tadross (2021).


6 Discussion and Conclusion
6.1 Comparison with the literature
The astrophysical parameters of four OCs have been determined from fitCMD algorithm. A comparison of , , , , and (Gyr) values of four OCs with the literature is presented in In Table 6/Fig. 8. The reddening comparison has been given in , which is converted from Gaia/2MASS. The small/large differences between our values and the literature can be seen from Table 6/Fig. 8. We leave the detail comparison to the reader.
Reddenings and the photometric distances which are found from fitCMD for NGC 2587 and Mel 72 are in good agreement with the ones of Cantat-Gaudin et al. (2020). Differences of the reddenings and distances for Col 268 and Pismis 7 are up to 0.16–0.18 mag and kpc, respectively. This stems from the usage of values of fitCMD, instead of solar abundance. For Mel 72, our reddenings/distances/ages are in good agreement with Hendey & Tadross (2021). The obtained photometric distances from fitCMD provide somewhat close distances, as compared to Gaia DR2 distances (Col.6 of Table 2). For NGC 2587 and Mel 72, both distances are in good concordance. The differences of both distances are at a level of kpc for Col 268 and Pismis 7.
The results for Pismis 7 are neccessarily rather tentative. It is the most distant and the most heavily reddened cluster and clearly shows that its stars are differentially reddened.
As emphasized by Paunzen & Netopil (2006) and Moitinho (2010), the small/large discrepancies in ages and distance moduli/distances (Table 6) result from the adopted isochrones and the reddening values, which are found from CMDs. Although the B12 Padova isochrones are used for this paper and the papers of B11 and K13, large/small differences in ages can be explained by the derived reddenings.
The dimensions, total masses, MF slopes and star numbers of four OCs are presented in Table 7 together with the literature values. The inconsistency of these parameters with the literature may be partly explained by the detected star numbers (Col. 13 of Table 7).
6.2 Dynamical Evolution of Four OCs
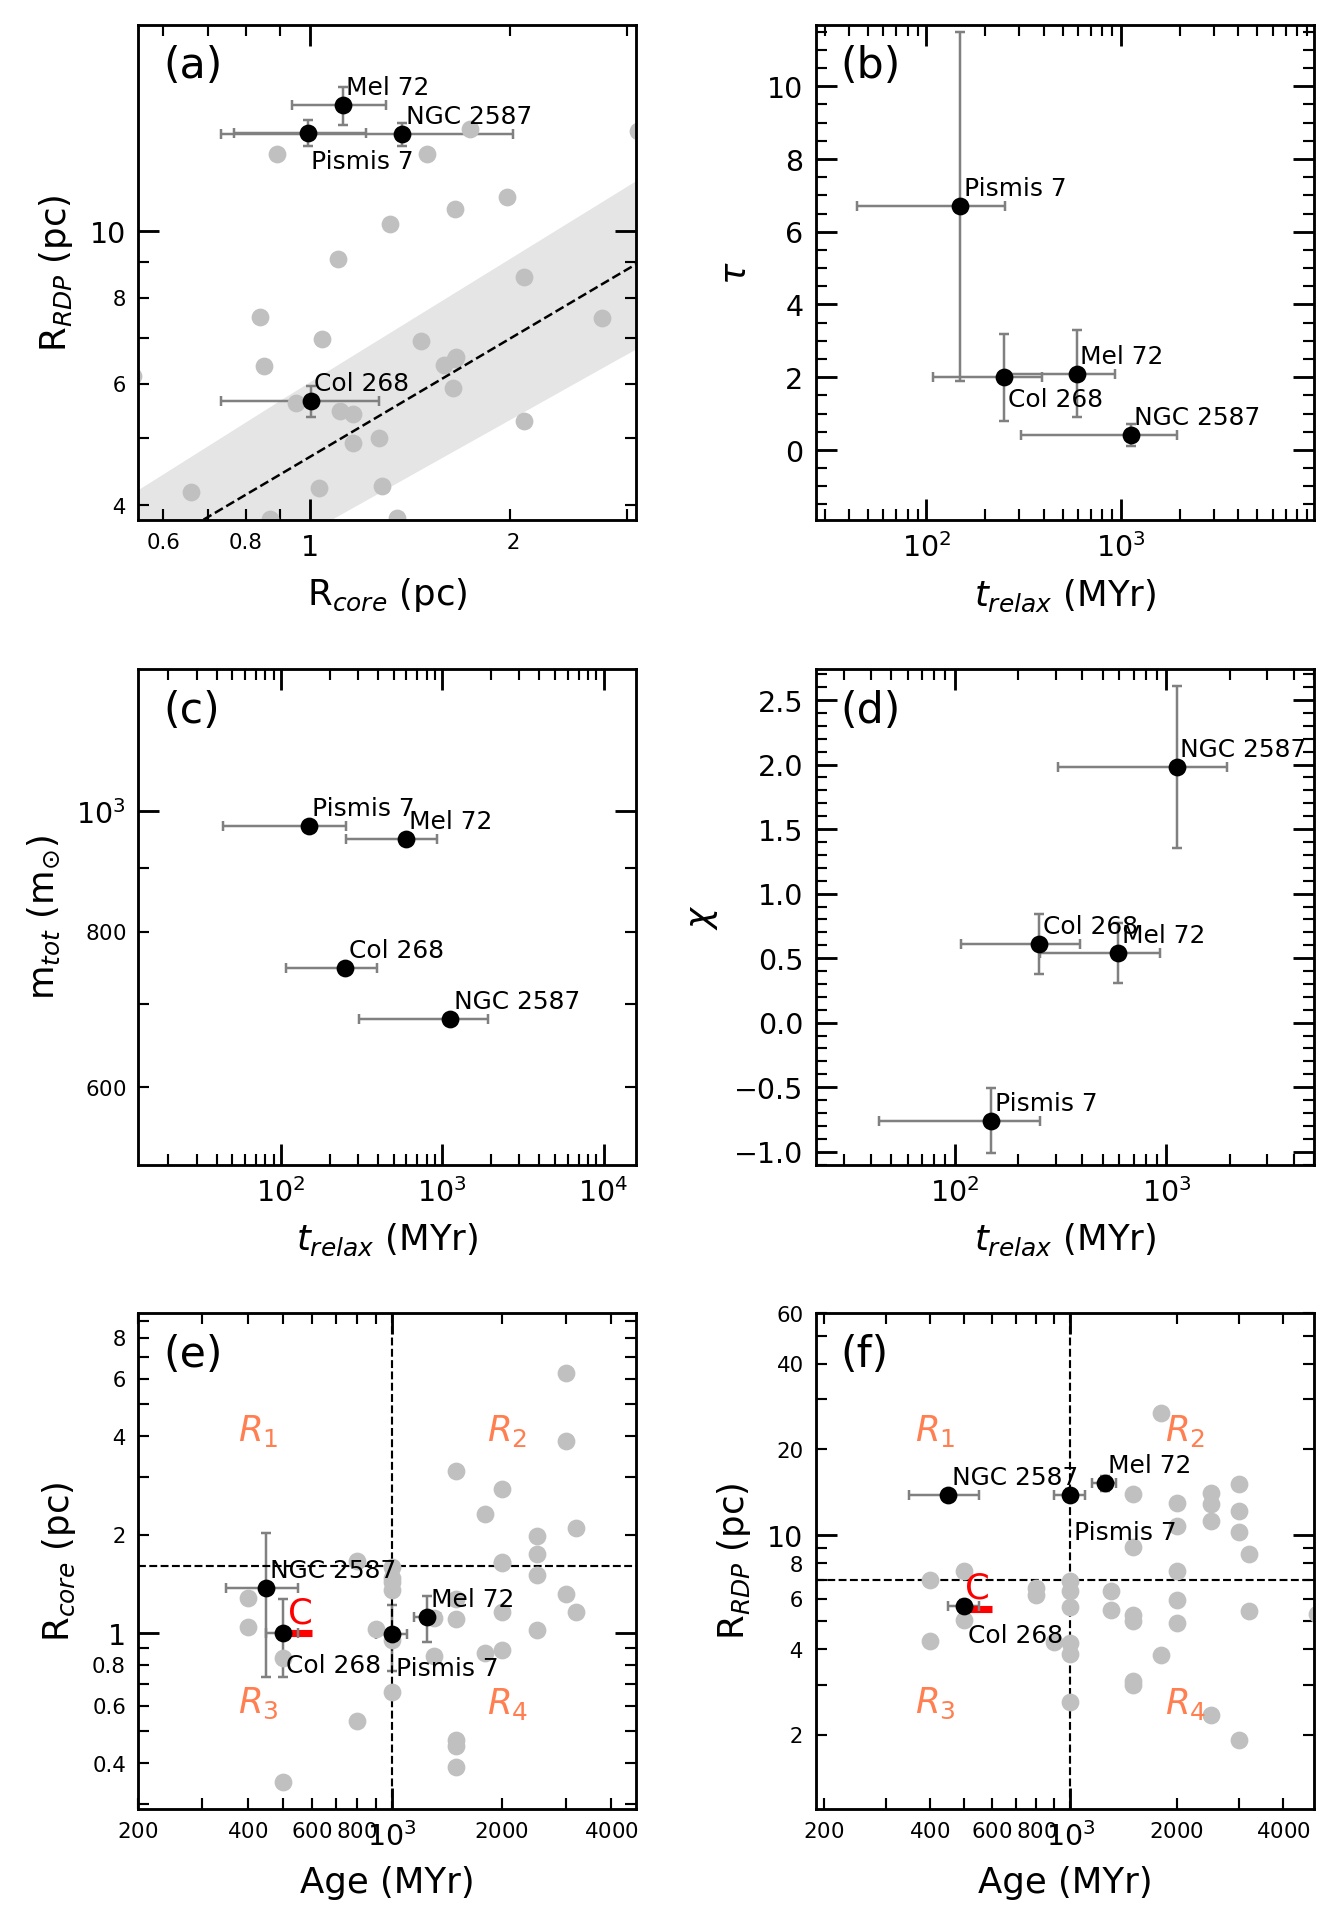
The relations between dynamical evolution parameters are presented in Figs. 10(a)–(f). The relations, the horizontal lines, the labels -, "C" and filled grey points of panels (a), (e), (f) are from Güneş et al. (2017) (their figs. 11, 14, and 17). From panel (a), NGC 2587, Mel 72 and Pismis 7 do not follow the relation of Güneş et al. (2017). These OCs can be partly attributed to clusters with large radii retaining their masses. Whereas Col 268 with the small dimensions is quite close to the relation (dashed diagonal).
The relaxation times/evolutionary parameters of four OCs exhibit similarity because they are all within one sigma of one another (Table 5 and panel b). Except NGC 2587, the ages of the remaining OCs are higher than their relaxation times. So, they are dynamically relaxed. From panel c, they seem to be less massive OCs than . Mass function gives the distribution of the stars in the cluster. In this context, NGC 2587’s steep MFs means that its low-mass stars outnumber its massive ones (panel d). This OC did not undergo dynamical evolution due to its small evolutionary time. This explains the reason that this OC lies in / with large cluster/small core radii (panels e and f). The relatively flat (as compared to of Salpeter (1955) or of Kroupa (2001)) MF slopes of Col 268 and especially Mel 72 (panel d) suggest that both OCs present signs of a somewhat advanced dynamical evolution, in the sense that they appear to have lost a significant fraction of their low-mass stars to the field.
Col 268 with the small dimensions pc is intrinsically small. Instead of shrinking in size and mass with time, it may have a primordial origin which may be related to high molecular gas density in Galactic directions (Camargo et al., 2010; van den Berg et al., 1991). Note that Col 268 (0.5 Gyr) falls in the range "C" (panels e–f).
Pismis 7’s negative/flat MFs (panel d) implies that its high-mass stars slightly outnumber its low-mass stars. Due to its value, Pismis 7 shows a sign of mild dynamical evolution. In this context, its high mass stars move towards the central region, while its low mass stars are continually being lost to the field. Regarding Pismis 7, it is the most distant OC, so completeness may affect the detection of its low-mass content. However, since its age is about 1 Gyr, mass segregation also may played some role in depleting its low-mass stars. The combination of these two factors may explain its MFs.
In panels e–f, the cluster dimension versus cluster age is given. As discussed by Camargo et al. (2010), this kind of relationship provides some information for cluster survival/dissociation rates. From this perspective, some clusters expand with time, while some seem to shrink. According to Mackey & Gilmore (2003), the dynamical evolution of the core/cluster radii of the clusters started at 500-600 Myr (the label "C", panels e–f), and continued to 1 Gyr. A bifurcation occurs at an age Gyr. Pismis 7 locates at the bifurcation. Mel 72 locates in region. Therefore, the outer parts of Mel 72 and Pismis 7 expand with time. However, Mel 72’ core contracts because of dynamical relaxation, dependig on its location. However, Pismis 7’s core may expand with the time because its massive stars move towards its central parts, given its mild dynamical evolution.
Considering the locations of four OCs in the Galaxy (Table 1/Fig. 9), NGC 2587, Mel 72 and Pismis 7 locate at third quadrant (outside solar circle), which is a region with low density of GMCs. So, except for Pismis 7, they do not seem to expose to the external dynamical effects much, such as tidal stripping due to disk and bulge crossings plus encounters with GMCs. Col 268 did not seem to lost its star content much because of the presence of massive GMCs, and tidal effects from disk and Bulge crossings as external process, taking care its direction 555We adopt the value kpc of Bland-Hawthorn & Gerhard (2016) for their distances.
Star clusters usually present crowding, especially towards the central region. This means that, near the center, some fraction of the faintest stars will not be detected because of crowding. At the outer parts where crowding is less important, one can get more faint stars observed. However, two factors should be considered on our results. A large uncertainty in and reduces the reliability of the interpretation of the dynamic evolution of these OCs. In this respect, for the interpretations we consider their mean values as a simple approach. Binaries widen the main sequence of the OCs by 0.75 mag, so the theoretical isochrones are fitted to the mid-points of CMDs of the OCs, rather than the faint or blue sides (Carney et al., 2001). Due to a consequence of the dynamical evolution in OCs, multiple systems tend to concentrate in central regions (Takahasi & Portegies Zwart, 2000). Because of a significant fraction of binaries in the central parts of OCs, the number of low-mass stars is underestimated with respect to the high mass stars (Bonatto et al., 2005).
7 Acknowledgments
We thank our referee for his/her valuable suggetsions/comments. This paper has made use of results from the European Space Agency (ESA) space mission Gaia, the data from which were processed by the Gaia Data Processing and Analysis Consortium (DPAC). Funding for the DPAC has been provided by national institutions, in particular the institutions participating in the Gaia Multilateral Agreement. The Gaia mission website is http: //www.cosmos.esa.int/gaia. This paper has also made use of the WEBDA database, operated at the Institute for Astronomy of the University of Vienna. This publication also makes use of SIMBAD database-VizieR (http://vizier.u-strasbg.fr/viz-bin/VizieR?-source=II/246.).
References
- Ahumada (2005) Ahumada, J.A., 2005, AN, 326, 3
- Bailer-Jones et al. (2018) Bailer-Jones, C. A. L., Rybizki, J., Fouesneau, M., Mantelet, G., and Andrae, R. 2018, AJ, 156, 58
- Bailer-Jones et al. (2021) Bailer-Jones, C. A. L., Rybizki, J., Fouesneau, M., Demleitner, M., and Andrae, R., 2021, AJ, 161, 147
- Balaguer-Nunez et al. (1998) Balaguer-Nunez, L., Tian, K.P., Zhao, J.L. 1998, A&AS, 133, 387
- Bertelli et al. (1994) Bertelli, G., Bressan, A., Chiosi, C., Fagotto, F., Nasi, E., 1994, A&AS, 106, 275
- Bica et al. (2008) Bica, E., Bonatto, C., Camargo, D., 2008, MNRAS, 385, 349
- Binney et al. (1998) Binney, J., Merrifield, M., 1998, Galactic Astronomy, Princeton series in astrophysics, Princeton University Press, Princeton
- Bland-Hawthorn & Gerhard (2016) Bland-Hawthorn, J., Gerhard, O., 2016, ARA&A, 54, 529
- Bonatto et al. (2004) Bonatto, C., Bica, E., Girardi, L., 2004, A&A, 415, 571
- Bonatto et al. (2005) Bonatto, C., Bica, E., Santos Jr, J.F.C., 2005, A&A, 433, 917
- Bonatto & Bica (2006) Bonatto, C., Bica, E., 2006, A&A, 455, 931
- Bonatto & Bica (2007) Bonatto, C., Bica, E., 2007, MNRAS, 377, 1301
- Bonatto (2019) Bonatto, C.,2019, MNRAS, 483, 2758
- Bonatto & Bica (2011) Bonatto, C., Bica, E., 2011, MNRAS, 415, 313
- Bressan et al. (2012) Bressan A., Marigo, P., Girardi L., Salasnich, B., Dal Cero, C., Rubele, S., Nanni, A., 2012, MNRAS, 427, 127
- Brown et al. (2018) Brown, A. G. A., Vallenari, A., Prusti, T. et al., 2018, A&A, 616, 1G
- Bukowiecki et al. (2011) Bukowiecki, L., Maciejewski, G., Konorski, P., Strobel, A., 2011, ACA, 61, 231
- Camargo et al. (2010) Camargo, D., Bonatto, C., Bica, E., 2010, A&A, 521, 42
- Cantat-Gaudin et al. (2018) Cantat-Gaudin, T., Jordi, C., Vallenari, A., Bragaglia, A., Balaguer-Nunez, L., Soubiran, C., Bossini, D., Moitinho, A., Castro-Ginard, A., Krone-Martins, A., and 3 coauthors., 2018, A&A, 618, 93
- Cantat-Gaudin et al. (2020) Cantat-Gaudin, T., Anders, F., Castro-Ginard, A., Jordi, C., Romero-Gómez, M., Soubiran, C., Casamiquela, L., Tarricq, Y., Moitinho, A., Vallenari, A., Bragaglia, A., Krone-Martins, A., Kounkel, M., 2020, A&A, 640, 1
- Carney et al. (2001) Carney, B.W., Harris, W.E., 2001, Star Clusters, Saas-Fee Advanced Course 28, Springer-Verlag, New York
- Chen et al. (1999) Chen, B., Figueras, F., Torra, J., Jordi, C., Luri, X., Galadi-Enriquez, D., 1999, A&A, 352, 459
- Dias et al. (2018) Dias, W.S., Monteiro, H., Lepine, J.R.D., prates, R., Gneiding, C.D., Sacchi, M. 2018, MNRAS, 481, 3887
- Gieles et al. (2007) Gieles, M., Athanassoula, E., Portegies-Zwart, S., 2007, MNRAS, 376, 809
- Gonzalez et al. (2012) Gonzalez, O A., Rejkuba, M., Zoccali, M., Valenti, E., Minniti, D., Schultheis, M., Tobar, R., Chen, B., 2012, A&A, 543, 13
- Güneş et al. (2017) Güneş, O., Karataş, Y., Bonatto, C., 2017, AN, 338, 464
- Hendey & Tadross (2021) Hendey, Y.H.M and Tadross, A.L., 2021, AN, arXiv:2103
- Hasegawa et al. (2008) Hasegawa, T., Sakamoto, T., Malasan, H L., 2008, PASJ, 60, 1267
- Janes & Phelps (1994) Janes, K.A. and Phelps, R.L., 1994, AJ, 108, 1773
- Kharchenko et al. (2013) Kharchenko, N.V., Piskunov, E A., Schilbach, E., Roeser, S., Scholz, R.D., 2013, A&A, 558A, 53
- King (1966) King, I., 1966, AJ, 71, 64
- Kroupa (2001) Kroupa, P., 2001, MNRAS, 322, 231
- Lamers & Gieles (2006) Lamers, H.J.G.L.M., Gieles, M., 2006, A&A, 455, 17
- Lejeune & Schaerer (2001) Lejeune, T., Schaerer, D., 2001, A&A, 366, 538
- Lindegren et al. (2018) Lindegren, L., Hernandez, J., Bombrun, A., Klioner, S. et al., 2018, A&A, 616, A2
- Lindegren et al. (2021) Lindegren, L., Klioner, S. A., Hernandez, J., et al., 2021, A&A, 649, 9
- Lynds (1965) Lynds, B.T., 1965, ApJS, 12, 163
- Mackey & Gilmore (2003) Mackey, A.D., Gilmore, G.F., 2003, MNRAS, 338, 120
- Mackey et al. (2008) Mackey, A.D., Wilkinson, M.I., Davies, M B., Gilmore, G.F., 2008, MNRAS, 386, 65
- Marigo et al. (2008) Marigo, P., Girardi, L., Bressan, A., Groenewegen, M.A.T., Silva, L., Granato, G.L., 2008, A&A, 482, 883
- Marigo et al. (2017) Marigo, P., et al., 2017, ApJ, 835, 77
- Mermilliod (1992) Mermilliod, J.C., 1992, Bull. Inform, 40, 115
- Moffat & Vogt (1975) Moffat, A.F.J., Vogt, N., 1975, A&AS, 20, 155
- Moitinho (2010) Moitinho, A., 2010, Star Clusters: Basic Galactic Building Blocks, Proceedings IAU Symposium No.266, Cambridge University Press, London
- Paunzen & Netopil (2006) Paunzen, E., Netopil, M., 2006, MNRAS, 371, 1641
- Pedregosa et al. (2011) Pedregosa et al., Scikit-learn: Machine Learning in Python, JMLR 12, pp. 2825-2830, 2011.
- Piatti et al. (2009) Piatti, A.E., Claria, J.J., Ahumada, A.V., 2009, MNRAS, 397, 1073
- Piatti et al. (2010) Piatti, A.E., Claria, J.J., Ahumada, A.V., 2010, MNRAS, 402, 2720
- Portegies Zwart & McMillan (2000) Portegies Zwart, S., McMillan, S., 2000, ApJ, 528, 17, 2000
- Salpeter (1955) Salpeter, E. 1955, ApJ, 121, 161
- Sariya et al. (2012) Sariya, D.P., Yadav, R.K.S., Yadav, Bellini, A. 2012, A&A, 543, 87
- Tadross (2011) Tadross, A.L., 2011, JKAS, 44, 1
- Takahasi & Portegies Zwart (2000) Takahasi, K., Portegies Zwart, S.F., 2000, ApJ, 535, 759
- van den Berg et al. (1991) van den Berg, S., Morbey, C., Pazder, J., 1991, ApJ, 375, 594
- Wu et al. (2002) Wu, Z.Y., Tian, K.P., Balaguer-Nunez, L., Jordi, C., Zhao, J.L., and Guibert, J. 2002, A&A, 381, 464