Atomic-scale defects restricting structural superlubricity: Ab initio study study on the example of the twisted graphene bilayer
Abstract
The potential energy surface (PES) of interlayer interaction of twisted bilayer graphene with vacancies in one of the layers is investigated via density functional theory (DFT) calculations with van der Waals corrections. These calculations give a non-negligible magnitude of PES corrugation of 28 meV per vacancy and barriers for relative sliding of the layers of 7 – 8 meV per vacancy for the moiré pattern with coprime indices (2,1) (twist angle 21.8∘). At the same time, using the semiempirical potential fitted to the DFT results, we confirm that twisted bilayer graphene without defects exhibits superlubricity for the same moiré pattern and the magnitude of PES corrugation for the infinite bilayer is below the calculation accuracy. Our results imply that atomic-scale defects restrict the superlubricity of 2D layers and can determine static and dynamic tribological properties of these layers in a superlubric state. We also analyze computationally cheap approaches that can be used for modeling of tribological behavior of large-scale systems with defects. The adequacy of using state-of-the-art semiempirical potentials for interlayer interaction and approximations based on the first spatial Fourier harmonics for the description of interaction between graphene layers with defects is discussed.
I Introduction
Twisted graphene bilayer has attracted recently considerable attention due to its unique electronic properties such as the possibility to observe superconductivity Cao et al. (2018) and formation of a network of domain walls Lebedeva and Popov (2019) with topologically protected helical states Vaezi et al. (2013); Zhang et al. (2013a). Relative rotation of graphene layers also gives rise to promising tribological properties Dienwiebel et al. (2004); Filippov et al. (2008); Androulidakis et al. (2020); Liu et al. (2012); Vu et al. (2016), namely structural superlubricity, i.e. the mode of relative motion of the layers with vanishing or nearly vanishing friction Hirano and Shinjo (1990); Hirano et al. (1991). This superlubric behavior can be used for elaboration of nanoelectromechanical systems based on electronic properties of graphene and relative sliding or rotation of graphene layers with respect to each other Poklonski et al. (2013); Popov et al. (2013a); Kang et al. (2015); Koren et al. (2015); Kang and Lee (2016). Rotation of graphene layers to incommensurate superlubric orientations is responsible for such phenomena as self-retraction of graphene layers Zheng et al. (2008); Vu et al. (2016); Popov et al. (2011a); Liu et al. (2012) and anomalous fast diffusion of a graphene flake on a graphite surface Lebedeva et al. (2010, 2011a). It should be mentioned that the phenomenon of structural superlubricity is observed not only for graphene-based systems Dienwiebel et al. (2004); Filippov et al. (2008); Androulidakis et al. (2020); Liu et al. (2012); Vu et al. (2016) but also for multiwalled carbon nanotubes Zhang et al. (2013b), graphene nanoribbons on gold surfaces Kawai et al. (2016), graphene/hexagonal boron nitride heterostructure Song et al. (2018), etc. (see review Hod et al. (2018) for more examples). For these 2D and 1D materials, superlubricity is related with the incommensurate contact interface which is formed upon relative rotation of the layers of the same material to an incommensurate orientation or because of the lattice constant mismatch for heterostructures with layers of different materials. In addition to graphene, a wide family of other 2D materials has been synthesized lately including hexagonal boron nitride (see Ref. Auwärter, 2019 for review), graphane Elias et al. (2009), various transition metal dichalcogenides (see Ref. Shi et al., 2015 for review), phosphorene Churchill and Jarillo-Herrero (2014), borophene Zhang et al. (2015), germanene Yuhara et al. (2018), etc. Heterostructures consisting of layers of different 2D materials should be also mentioned (see Ref. Geim and Grigorieva, 2013 for review). Therefore, superlubricity can be expected for a wide set of incommensurate contact interfaces.
Originally superlubricity for relative motion of 2D layers was discovered for nanoscale contacts between graphene flakes and graphite surface.Verhoeven et al. (2004); Dienwiebel et al. (2005); Filippov et al. (2008) To explain these experiments, a wide set of theoretical works and atomistic simulations were performed to study superlubricity between perfect rigid 2D layers and its loss via rotation of the layers with the same lattice constant to the commensurate ground state. Hirano and Shinjo (1990); Verhoeven et al. (2004); Dienwiebel et al. (2005); Filippov et al. (2008); Bonelli et al. (2009); Guo et al. (2007); Shibuta and Elliott (2011); Xu et al. (2013); Wang et al. (2019) The calculations did not reveal any significant effect of atomic-scale defects on the static friction in the case of incommensurate contacts between small graphene flakes and graphene layers Guo et al. (2007). However, some decrease in the diffusion coefficient of a small graphene flake on a graphene layers was observed in simulations in the presence of defects and could be attributed to the increase in the dynamic friction force Lebedeva et al. (2011a). It was shown also that superlubricity of very small flakes is restricted by pinning caused by distortions at the edges van Wijk et al. (2013); Mandelli et al. (2017). This effect becomes negligible for large flakes Mandelli et al. (2017). Recently not only nanoscale but also microscale and macroscale superlubricity between 2D layers Androulidakis et al. (2020); Liu et al. (2012); Vu et al. (2016); Song et al. (2018) was observed. Moreover, robust superlubricity was achieved for systems with a lattice mismatch such as heterostructures Song et al. (2018) or similar layers under different tension applied Wang et al. (2019); Androulidakis et al. (2020). Theoretical studies de Wijn (2012); Müser et al. (2001) and recent experiments Dietzel et al. (2013); Kawai et al. (2016) suggest that the superlubric friction force per unit area decreases with increasing the contact area. These observations generate interest in possible reasons which can restrict superlubricity of microscale and macroscale incommensurate contact interfaces.Liu et al. (2012); Mandelli et al. (2017); Hod et al. (2018); Koren and Duerig (2016)
Up to now the following factors that restrict macroscopic robust superlubricity between 2D layers have been considered: 1) contribution of incomplete unit cells of the moiré pattern located at the rim area of the layer, Koren and Duerig (2016) 2) incomplete force cancellation within complete unit cells of the moiré pattern Koren and Duerig (2016) and 3) motion of domain walls in superstructures with large commensurate domains formed upon relaxation of moiré patterns with spartial periods that are much greater than the domain wall width Liu et al. (2012); Mandelli et al. (2017); Hod et al. (2018). Based on the studies of self-retraction motion of macroscopic graphene layers, it was suggested that the ultralow but nonzero friction for the layers with an incommensurate relative orientation can be induced by defects Liu et al. (2012) and the possibility of restriction of superlubricity by defects was discussed in the recent review devoted to superlubricity of 2D materials Hod et al. (2018). The same argument was used to explain the nonzero (although very low) friction observed during macroscopic relative sliding of nanotube walls Zhang et al. (2013b). Atomic-scale defects were shown to increase the dynamic friction in gigahertz oscillators based on relative sliding of nanotube walls Guo et al. (2005); Lebedeva et al. (2009) and to give the main contribution into the static friction during superlubric relative sliding and rotation of nanotube walls Belikov et al. (2004). There is a lack of similar explicit studies of the influence of atomic-scale defects on friction in the case of macroscopic structural superlubricity for 2D materials. Here we perform ab initio calculations to investigate the effect of defects on 2D structural superlubricity by the example of twisted graphene bilayer with vacancies in one of the layers and discuss whether the defects can provide a dominant contribution to friction in the case of macroscopic superlubricity.
Registry-dependent semiempirical potentials Kolmogorov and Crespi (2000, 2005); Lebedeva et al. (2011b, 2012); Popov et al. (2012) were developed recently for description of interaction of graphene layers. They make possible modeling of relative sliding and rotation of the layers in large systems Lebedeva et al. (2010, 2011a); Popov et al. (2011a). However, these potentials were fitted to the results of ab initio calculations in the absence of defects. In the present paper, we consider the performance of one of these potentials, the Lebedeva potential Lebedeva et al. (2011b, 2012); Popov et al. (2012), for interaction between the perfect graphene layer and the one with vacancies via comparison with the DFT results. Another approach for modeling of tribological behavior of a graphene flake on a graphene layer is based on approximation of the interaction energy between a single atom and a 2D hexagonal lattice by the first Fourier harmonics Verhoeven et al. (2004); Dienwiebel et al. (2005); Filippov et al. (2008). The adequacy of such an approach in the case of the layers without defects was demonstrated not only for bilayer and few-layer graphene Ershova et al. (2010); Lebedeva et al. (2011b); Popov et al. (2012); Lebedeva et al. (2012); Reguzzoni et al. (2012) but also for a variety of other 2D materials Lebedev et al. (2016, 2020); Jung et al. (2015); Kumar et al. (2015); Lebedev et al. (2017). Here we investigate whether this approach could still work in the presence of atomic-scale defects like vacancies.
The paper is organized in the following way. In Sec. II, the model of the superlubric system and calculation methods are described. Sec. III is devoted to our results on structure and energetics of the vacancy, interlayer interaction for the moiré pattern with the perfect complete cell and influence of vacancies on the static friction. The possibility to use a simple approximation for the interaction between graphene layers with atomic-scale defects is also considered in Sec. III. The conclusions and discussion on tribological properties of macroscopic twisted graphene layers with numerous atomic-scale defects are presented in Sec. IV.
II Methodology
II.1 Model of superlubric system
An important characteristic which determines tribological properties of 2D materials is the potential energy surface (PES), that is the interlayer interaction energy as a function of the coordinates describing the relative in-plane displacement of the 2D layers. Particularly the PES determines directly the static friction force for relative motion of the layers. To consider restriction of macroscopic superlubricity because of the presence of atomic defects, it is necessary to choose a model for atomistic calculations in which the contribution of perfect layers into the PES is negligible. To make such a choice here, we recall the results of atomistic modeling of superlubricity in the simple 1D case of double-walled carbon nanotubes. Namely, for double-walled nanotubes with commensurate walls at least one of which is chiral, the PES of interwall interaction is extremely flat and its corrugations are smaller than the accuracy of calculations. This leads to the negligible static friction in the case of infinite walls (calculations using periodic boundary conditions) or finite walls with complete unit cells of the nanotube Kolmogorov and Crespi (2000); Damnjanović et al. (2002); Vuković et al. (2003); Belikov et al. (2004); Bichoutskaia et al. (2005). For such nanotubes, due to only partial compatibility of helical symmetries of the walls, only very high Fourier harmonics of the interaction energy between an atom of one of the walls and the whole second wall contribute to the PES, whereas the contributions of other harmonics corresponding to different atoms of the nanotube unit cell are completely compensated Damnjanović et al. (2002). Thus, commensurate systems can exhibit superlubricity along with completely incommensurate systems (i.e. double-walled nanotubes with incommensurate walls). In the superlubric commensurate systems based on carbon nanotubes, edges Popov et al. (2013b) and atomic-scale defects Belikov et al. (2004) are known to provide the main contribution into the static friction during relative sliding and rotation of the nanotube walls.
Evidently infinite incommensurate systems without edges cannot be considered in the framework of DFT calculations with periodic boundary conditions. Incommensurate systems with edges make it difficult to study the restriction of superlubricity by defects since the contribution of edges to friction should be dominant for system sizes accessible to DFT calculations. Therefore, a superlubric commensurate system is a preferred choice for our DFT study. The results for double-walled nanotubes described above demonstrate that it is possible to use commensurate systems as models of superlubric systems in atomistic simulations. Here we show that it is also possible for 2D systems.
Whereas twisted graphene bilayer is an incommensurate system in the general case, a set of commensurate orientations of the layers is observed for some special twist angles determined by coprime indices Xu et al. (2013); Campanera et al. (2007). Only partial compatibility of translational symmetries of the layers in such commensurate moiré patterns is analogous to that for helical symmetries of the walls in double-walled nanotubes with commensurate walls at least one of which is chiral. In Section IIIB below, we confirm that for the complete unit cell of the commensurate moiré pattern in absence of defects, contributions of individual atoms into the total PES are compensated within the calculation accuracy. Thus, only defects give rise to non-negligible PES corrugations and, correspondingly, to static and dynamic friction during relative motion of the layers.
Therefore, in the present paper, we investigate the influence of defects on the static friction via the PES calculations for the complete unit cell of the commensurate moiré pattern. As an example, we consider graphene layers, one perfect layer and another with vacancies, rotated with respect to each other by 21.8∘ and forming the moiré pattern with coprime indices (2,1) (the commensurate moiré pattern with the smallest unit cell, Fig. 1). Note that up to now the static friction between perfect twisted graphene layers has been studied only for motion of a finite smaller layer relative to the larger one for incommensurate relative orientations of the layers or the smaller layer including incomplete unit cells of the moiré pattern Hirano and Shinjo (1990); Verhoeven et al. (2004); Dienwiebel et al. (2005); Filippov et al. (2008); Bonelli et al. (2009); Guo et al. (2007); Shibuta and Elliott (2011); Xu et al. (2013); Wang et al. (2019); van Wijk et al. (2013); Mandelli et al. (2017), that is only for the cases where the nearly total compensation of individual friction forces for atoms of the smaller layer is not possible.
II.2 Computational details
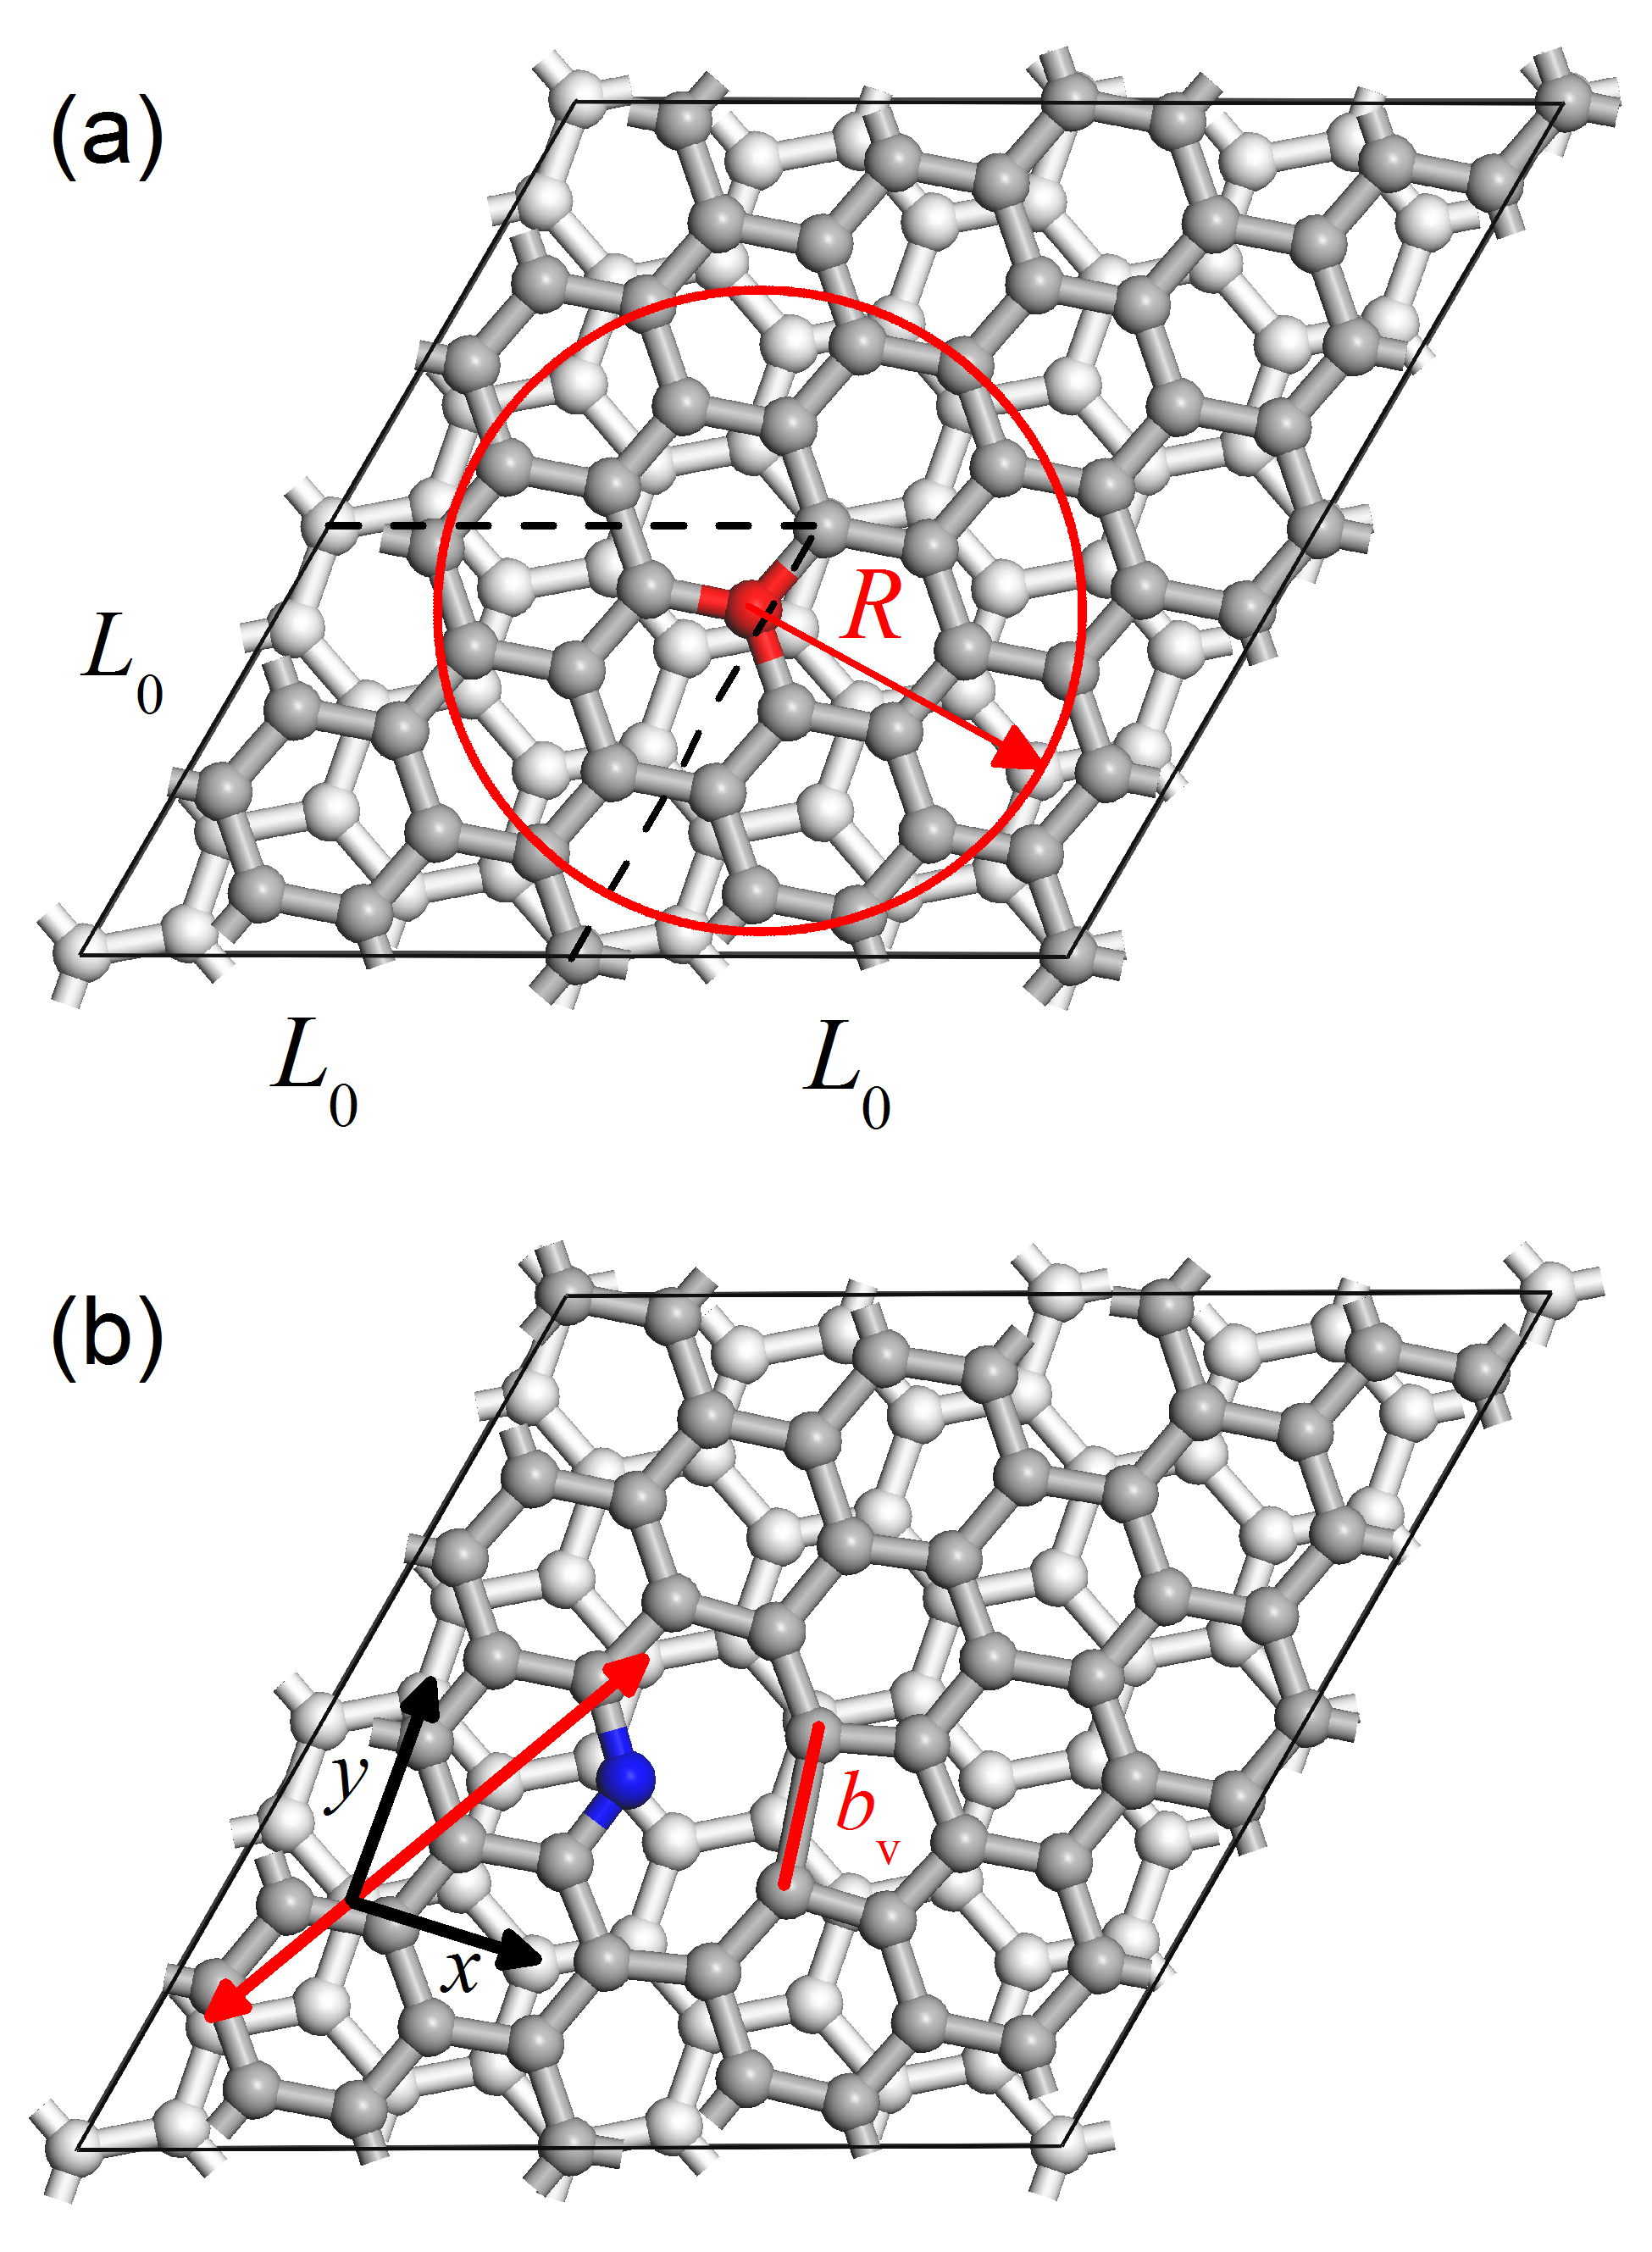
The PES of twisted graphene bilayer was obtained through DFT and classical calculations. The spin-polarized DFT calculations were carried out with the VASP code Kresse and Furthmüller (1996). The exchange-correlation functional of Perdew, Burke and Ernzerhof (PBE) Perdew et al. (1996) with the Grimme DFT-D2 dispersion correction Grimme (2006) was applied. The parameters of the DFT-D2 correction optimized for bilayer graphene and graphite were used Lebedeva et al. (2017, 2019). Interactions of valence and core electrons were described using the projector augmented-wave method (PAW) Kresse and Joubert (1999). The Monkhorst-Pack Monkhorst and Pack (1976) method was applied for integration over the Brillouin zone. The maximum kinetic energy of plane waves was at least 500 eV. The Gaussian smearing of the width of 0.05 eV was used. The convergence threshold for self-consistent iterations was eV. The bond length between carbon atoms in the perfect layer was taken equal to 1.425 Å, which is the optimal one for the PBE functional. Correspondingly, the trigonal unit cell of the moiré pattern with coprime indices (2,1) including 14 atoms in each perfect layer had equal sides of Å (Fig. 1). The height of the simulation cell was 25 Å. Periodic boundary conditions were applied.
First, the structure of the reconstructed vacancy in and simulation cells (which correspond to 4 and 9 unit cells of the moiré pattern and contain 56 and 126 atoms per the perfect layer, respectively) was studied. For that one atom was removed from the perfect graphene layer (Fig. 1a), two of three two-coordinated atoms were brought closer to each other to form the bond giving rise to the 5/9 vacancy structure (Fig. 1b) and geometry optimization was performed till the maximum residual force of 0.001 eV/Å. The k-point grid was used. The vacancy formation energy was calculated as , where is the total energy of the system with the vacancy, is the number of atoms in this system and is the energy per atom in the perfect graphene layer.
To determine the optimal interlayer distance for the twisted layers, one unit cell of the moiré pattern with coprime indices (2,1) was considered. One of the layers was rigidly shifted perpendicular to the plane and the energy of the system was calculated as a function of the interlayer distance. The k-point grid was used. The binding energy of the twisted layers per atom of the upper layer was found as , where , and are the energies of the bilayer, upper and lower layers and is the number of atoms in the upper layer.
To compute the PES for the twisted layers, the simulation cell of the moiré pattern was considered for the upper layer with a single vacancy in the simulation cell and lower layer without defects (Fig. 1b). The previously optimized structure of the layer with the reconstructed vacancy was used. The calculations were performed on the k-point grid. The layers were placed at the optimal interlayer distance for the layers without defects and then the upper layer was rigidly shifted parallel to the plane with steps of 0.154 Å and 0.130 Å in the zigzag and armchair directions of the lower defect-free layer, respectively.
The classical calculations were carried out using the registry-dependent Lebedeva potential Lebedeva et al. (2011b, 2012); Popov et al. (2012). The parameters of the potential were fitted to the DFT data on the PES of co-aligned graphene layers. The calculations were performed with the parameters from Ref. Popov et al., 2012, cutoff radius of Å and height of the simulation box of 40 Å. The structures of the layers were taken from the DFT calculations. The optimal interlayer distance was obtained for the simulation cell of the moiré pattern of the twisted defect-free layers. To study the PES in the presence of vacancies, the upper layer with 9 equidistant vacancies in the simulation cell (the cell from the DFT calculations reproduced 3 times along each side of the simulation cell) placed at the optimal interlayer distance was rigidly shifted with respect to the lower defect-free layer with steps of 0.019 Å and 0.016 Å in the zigzag and armchair directions of the lower defect-free layer, respectively. The PES for the defect-free layers was calculated with the same steps in the simulation cell of height 100 Å for the cutoff radii of the potential from 16 Å to 50 Å.
III Results
III.1 Structure and energetics of vacancy
As known from the previous studies Wadey et al. (2016); Skowron et al. (2015); Ulman and Narasimhan (2014); Dai et al. (2011); Latham et al. (2013); Wu et al. (2013), the energetically favourable structure of the vacancy in graphene corresponds to the 5/9 structure in which two of three atoms with dangling bonds form a new bond giving rise to 9- and 5-membered rings (Fig. 1b). The comparison of the length of the new bond and vacancy formation energy with the data from literature is given in Table 1. A more detailed review of the previous results can be found in Ref. Skowron et al., 2015. It is seen from Table 1 that the bond lengths and vacancy formation energies obtained here agree with the previously reported values lying in the ranges of 1.8–2.0 Å and 7.4 – 7.8 eV, respectively.
Some of the previous calculations Dai et al. (2011) predicted that the atom that is left with dangling bonds in the 5/9 structure (shown in blue in Fig. 1b) exhibits significant deviation perpendicular to the graphene plane, although the flat structure was observed in other papers Latham et al. (2013); Wadey et al. (2016) (Table 1). To clarify this, we considered several initial structures with out-of-plane deviation of the atom with dangling bonds of up to 0.4 Å. However, we found that the final relaxed structure was always flat in the spin-polarized calculations and the flat vacancy structure was used in the further PES studies. It should be also noted that in the non-spin-polarized calculations, on contrary, the relaxed structures were characterized by significant out-of-plane deviations. Clearly, account of spin polarization related to the presence of an unpaired electron in the reconstructed vacancy is crutial for adequate description of the vacancy structure.
According to our calculations, the bond lengths of the new bonds for the and simulation cells are different by 0.1 Å and the vacancy formation energies by 0.06 eV. These differences indicate that there is still some interaction of periodic images of the vacancies. However, they are sufficiently small to assume that the PES computed for the vacancy in the simulation cell is close to that for the isolated vacancy. Note also that the differences in the bond lengths and vacancy formation energies for the two simulation cells considered are small compared to the scatter in the results of DFT calculations reported in literature (Table 1 and Ref. Skowron et al., 2015).
III.2 Interlayer interaction for defect-free moiré pattern with complete unit cell
The optimal interlayer distances and binding energies for twisted graphene as well as their changes compared to the AB stacking ( and , respectively) obtianed here and the corresponding data available in literature are listed in Table 2. Note that the PBE-D2 approach with the standard parameters for the dispersion correction used in Ref. Ulman and Narasimhan, 2014 underestimates the optimal interlayer distance and overestimates the binding energy of graphene layers Lebedeva et al. (2017). Using the parameters for the dispersion correction adjusted specifically for graphene Lebedeva et al. (2017, 2019), we got more reasonable values of the optimal interlayer distance and binding energy and slightly smaller changes in the interlayer distance and binding energy upon changing the twist angle from 0 to 21.8∘. Similar optimal interlayer distance and its change were reported previously in Ref. Campanera et al., 2007, although the variation in the binding energy obtained in that paper is smaller. The Lebedeva potential gives the changes in the interlayer distance and binding energy upon twisting the graphene layers closer to those from Ref. Ulman and Narasimhan, 2014 since it was fitted to the data obtained by the same PBE-D2 approach.
| Ref. | Method | ||||||
| This work | DFT | 3.40 | 0.08111See calculations within the same approach in Ref. Lebedeva et al., 2017. | 3.6a | |||
| Campanera et al., 2007222The results for graphite bulk. | DFT | 3.41 | 0.09 | 2.7 | |||
| Ulman and Narasimhan,2014 | DFT | 3.30 | 0.10 | 4.2 | |||
| This work |
|
3.46 | 0.09 333See calculations within the same approach in Refs. Lebedeva et al., 2011b, 2012. | 4.7 |
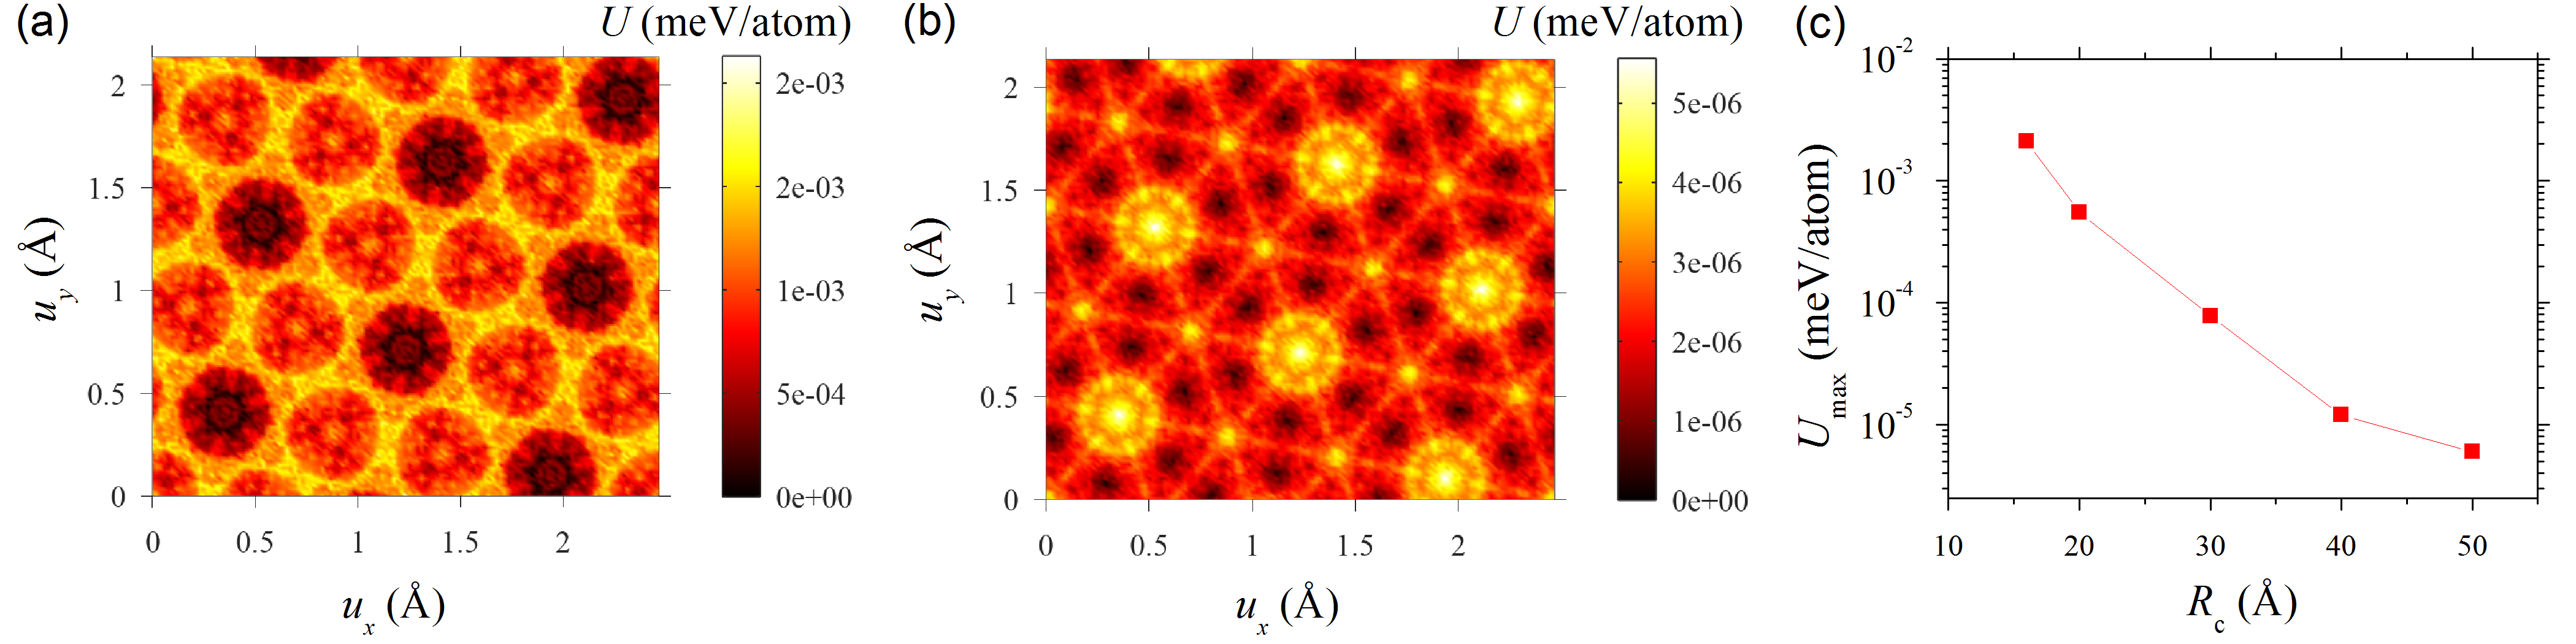
To distinguish the effect of vacancies, we first computed the PES for defect-free twisted graphene layers forming the (2,1) moiré pattern using the Lebedeva potential Lebedeva et al. (2011b, 2012); Popov et al. (2012). It can be appreciated from Fig. 2 that for a finite cutoff radius of the potential, the main contribution to this PES is provided by high spartial harmonics. Upon increasing the cutoff radius , the PES preserves its symmetry but the PES shape changes because of the cancellation of more and more harmonics. At the same time, the magnitude of corrugation, i.e. the difference between the global energy maxima and minima at the same interlayer distance, decreases exponentially (Fig. 2c). From the calculations with the cutoff radius of Å, we estimate that the magnitude of PES corrugation in the defect-free system does not exceed meV per atom of the upper layer.
Different from our results, a considerable area contribution into the force necessary for in-plane relative displacement of graphene layers (“area force” proportional to the number of complete unit cells) was found in Ref. Koren and Duerig, 2016 for twisted graphene bilayer with the same (2,1) moiré pattern as well as other moiré patterns with greater unit cells using the Kolmogorov-Crespi potential Kolmogorov and Crespi (2005). This discrepancy can be attributed to the following reasons. First, the cutoff radius used in Ref. Koren and Duerig, 2016 was only 16 Å, i.e. 3 times smaller than the maximal cutoff radius used here. Thus, the area force found in Ref. Koren and Duerig, 2016 can be an artefact of the insufficient cutoff radius (see our Fig. 2a for the same cutoff). Second, the shapes of the PES for infinite commensurate graphene bilayer without twist are different for the Lebedeva and Kolmogorov-Crespi potentials. According to the DFT studies Ershova et al. (2010); Lebedeva et al. (2011b); Popov et al. (2012); Lebedeva et al. (2012); Reguzzoni et al. (2012), the PES of the commensurate graphene bilayer can be described well using only the first spatial Fourier harmonics (see also Subsection IIID). The parameters of the Lebedeva potential were specifically fitted to reproduce this property of the PES, whereas the shape of the PES for the Kolmogorov-Crespi potential considerably deviates from that for the first spatial Fourier harmonics Lebedeva et al. (2012). This means that amplitudes of higher harmonics of the PES for the interaction between an atom of one layer and the whole perfect adjacent layer for the Kolmogorov-Crespi potential are considerably greater than those for the Lebedeva potential. This can in principle lead to an incomplete cancellation of atomic contributions into the PES for moiré patterns with small unit cells even for the complete cell. Detailed studies of this problem are beyond the scope of the present paper. Moreover, the accuracy of DFT calculations of PESs for 2D materials and hence the accuracy of the calculations using potentials fitted to such PESs may be insufficient to consider effects related with high spatial Fourier harmonics.
III.3 Vacancy influence on static friction
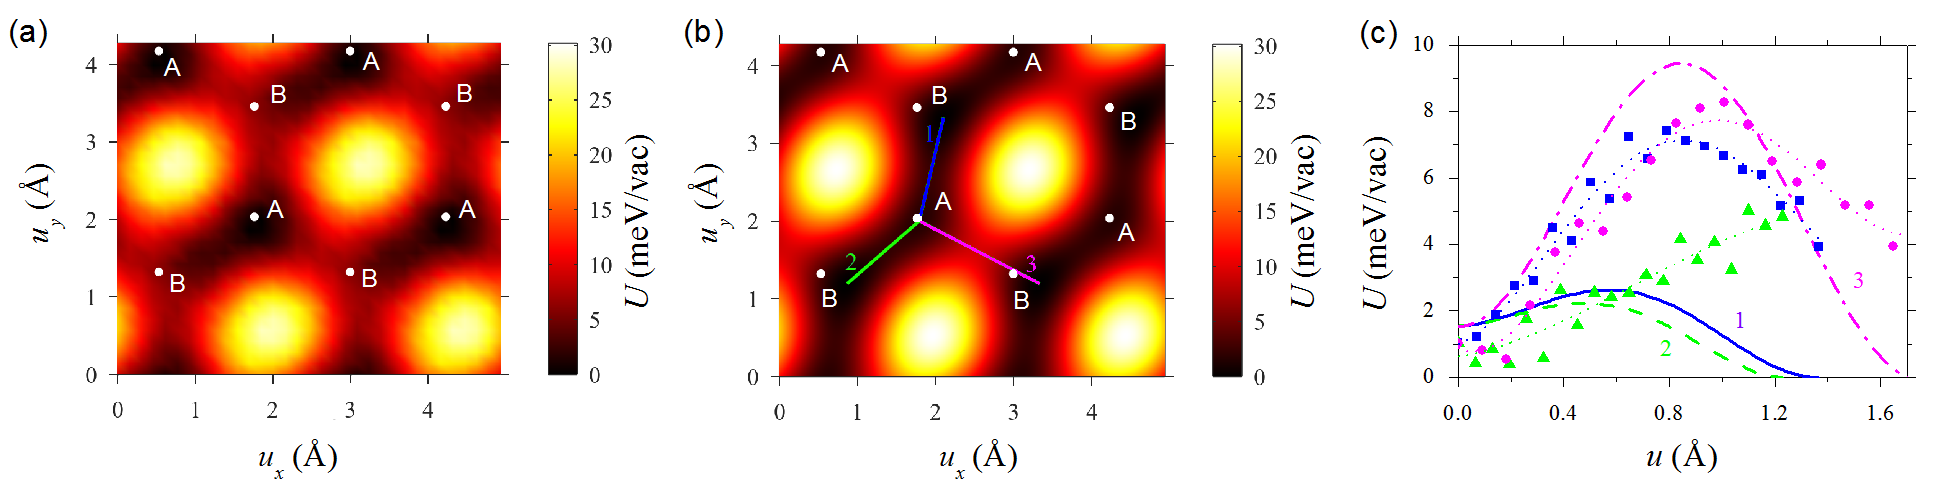
When a vacancy is created in one of the layers, the magnitude of corrugation becomes tens of meV per vacancy, i.e. it is no longer negligible. The PES obtained by the DFT calculations for this system is shown in Fig. 3a. The positions of minima and maxima on this PES are determined by the vacancy position with respect to atoms of the underlying layer. The maxima are displaced by 0.10 Å from the stackings where the atom removed to create the vacancy (shown in red in Fig. 1a) is located on top of centers of hexagons of the lower layer. The positions of the minima are close to the stackings where the atom removed to create the vacancy is located on top of an atom of the lower layer. Only positions on top of atoms of one sublattice (we denote it A) correspond to the minima. The positions on top of atoms of the second sublattice (B) are neither minima, nor maxima. The minima are displaced from the on-top positions by 0.10 Å.
The magnitude of PES corrugation according to the DFT calculations is 28.0 meV per vacancy (Fig. 3a). It can be compared to the value for the coaligned commensurate bilayer (with zero twist angle), which is 15.6 meV per atom of the upper (adsorbed) layer according to the calculations with the same functional Lebedeva et al. (2017). The barriers for relative sliding of the layers between adjacent energy minima corresponding to the vacancy positions on top of atoms of the same sublattice A are 7–8 meV (see also Fig. 3c). In the coaligned commensurate bilayer, the barrier is 1.7 meV per atom of the upper layer Lebedeva et al. (2017). For the twisted bilayer with the vacancy, the saddle points are located about 0.8 – 1 Å away from the minima. Therefore, we can estimate that the static friction force of about 12 – 16 pN per vacancy should be applied to make the layers slide with respect to each other. For the coaligned commensurate bilayer, this force is about 6 pN per atom of the upper layer Popov et al. (2011b); Lebedeva et al. (2017). It is clear that the magnitude of PES corrugation, barriers for relative sliding of the layers and static friction force in twisted bilayer are strongly reduced compared to the coaligned commensurate bilayer. For the simulation cell considered here that corresponds to the relatively high density of vacancies, the ratios of magnitude of PES corrugation, barriers for relative sliding of the layers and static friction force for the twisted and coaligned layers are only 0.03, 0.07–0.09 and 0.04–0.05, respectively. The net contribution of randomly distributed and orientated defects is discussed in the conclusion.
The PES computed using the Lebedeva potential is shown in Fig. 3b. It has a number of similarities with the PES from the DFT calculations but also some differences. The maxima of the classical PES are located at exactly the same points as those of the ab initio PES. There are shallow local minima at the same positions as the global minima on the ab initio PES with the vacancy almost on top of the atoms of the A sublattice. However, new minima are also observed on the classical PES 0.36 Å away from the positions where the vacancy is close to the atoms of the B sublattice and these minima are 1.6 meV lower in energy than the shallow ones.
The magnitude of PES corrugation for the Lebedeva potential is 30.2 meV (Fig. 3b), which is only 8% higher than the DFT value. To estimate the barriers for relative sliding of the layers between energy minima, we considered the straight lines connecting the adjacent minima of the classical PES and computed the the energy variation along these lines (Fig. 3c). The estimated barrier for one of these lines (path 3) agrees reasonably well with the DFT value, 9.4 meV vs. about 8 meV per vacancy, respectively. However, the barriers for sliding along the other lines are considerably smaller, 2.2 meV and 2.6 meV. It can be indeed appreciated from Fig. 3b that according to the semiempirical potential, there is a preferred direction for relative sliding of the layers in one of the zigzag directions. This direction is indicated by the red double-headed arrow in Fig. 1b. This property is not observed in the DFT calculations that give similar barriers for different directions of motion (Figs. 3a and c). Thus, the Lebedeva potential is able to describe the principal features to the PES of the twisted layers with a vacancy (symmetry, positions of the maxima and half of the minima, magnitude of corrugation, barriers across the preferred direction for sliding) but fails to describe its fine details (energies for relative positions of the layers with vacancies of top of atoms of the B sublattice, barriers along the preferred direction for sliding).
To investigate how the interaction between vacancies affects the PES, we also performed PES calculations for 4 equidistant vacancies in the simulation cell using the Lebedeva potential. The structure of the layer with vacancies was taken from the DFT calculations for one vacancy in the cell. These calculations revealed only minor changes in the PES as compared to the results for the simulation cell with 9 vacancies, i.e. one vacancy per the cell, discussed above. The magnitude of corrugation increased to 30.6 meV per vacancy, i.e. only by 2%. The relative energy of shallow minima increased to 1.8 meV per vacancy, i.e. by 14%. The barriers along paths 1, 2 and 3 in Fig. 3c became 2.1, 2.8 and 11.2 meV per vacancy, i.e. changed by %, % and %, respectively. These relative changes are not large given the accuracy of DFT calculations or calculations with the potential fitted to the DFT results. For example, the DFT data on the barrier for relative sliding of commensurate graphene layers reported in literature vary in the wide range from 0.5 meV/atom to 2.1 meV/atom (see Refs. Kolmogorov and Crespi (2005); Reguzzoni et al. (2012); Ershova et al. (2010); Lebedeva et al. (2011b, 2017) and references therein). Note that more consistent values of 1.55–1.62 meV/atom are obtained when the interlayer distance is fixed at the experimental one Lebedeva et al. (2017). Still the experimental data on the width of domain walls Alden et al. (2013) and shear mode frequencies in bilayer and few-layer graphene Popov et al. (2012) suggest somewhat different barriers of 2.4 meV/atom and 1.7 meV/atom, respectively. Therefore, the typical error of calculations of barriers for relative sliding of van der Waals-bound layers within the DFT and DFT-based approaches 40%. Given this accuracy, the calculations for one vacancy in the cell look sufficient for qualitative and even quantitative description of the PES.
III.4 Approximation by the first Fourier harmonics
Another approach that can be used to model interlayer interaction in large-scale van der Waals systems is based on the PES approximation by the first spatial Fourier harmonics Ershova et al. (2010); Lebedeva et al. (2011b); Popov et al. (2012); Lebedeva et al. (2012); Reguzzoni et al. (2012); Lebedev et al. (2016); Jung et al. (2015); Kumar et al. (2015); Lebedev et al. (2017). Such an approach is even cheaper computationally than those based on semiempirical potentials. The possibility to reproduce the PES obtained by the DFT calculations in this way was demonstrated not only for graphene bilayer Ershova et al. (2010); Lebedeva et al. (2011b); Popov et al. (2012); Lebedeva et al. (2012); Reguzzoni et al. (2012), but also for h-BN Lebedev et al. (2016) and hydrofluorinated graphene Lebedev et al. (2020) bilayers and graphene/h-BN heterostructureJung et al. (2015); Kumar et al. (2015); Lebedev et al. (2017). The hypothesis that the possibility of approximation of the PES by the first Fourier harmonics is a universal property of diverse 2D materials was proposed Lebedev et al. (2020). Let us discuss whether the approximation by the first Fourier harmonics can still be used in the presence of defects.
The interaction energy between a single atom and a 2D hexagonal lattice is described by the first Fourier harmonics as Verhoeven et al. (2004)
| (1) |
where and axes are chosen in the zigzag and armchair directions, respectively, , ( is the bond length), is the relative position of the atom with respect to the lattice ( corresponds to the case when the atom is located on top of one of the lattice atoms) and parameter depends on the interlayer distance. The interaction of a single atom with a 2D honeycomb lattice consisting of two hexagonal sublattices can then be written as
| (2) |
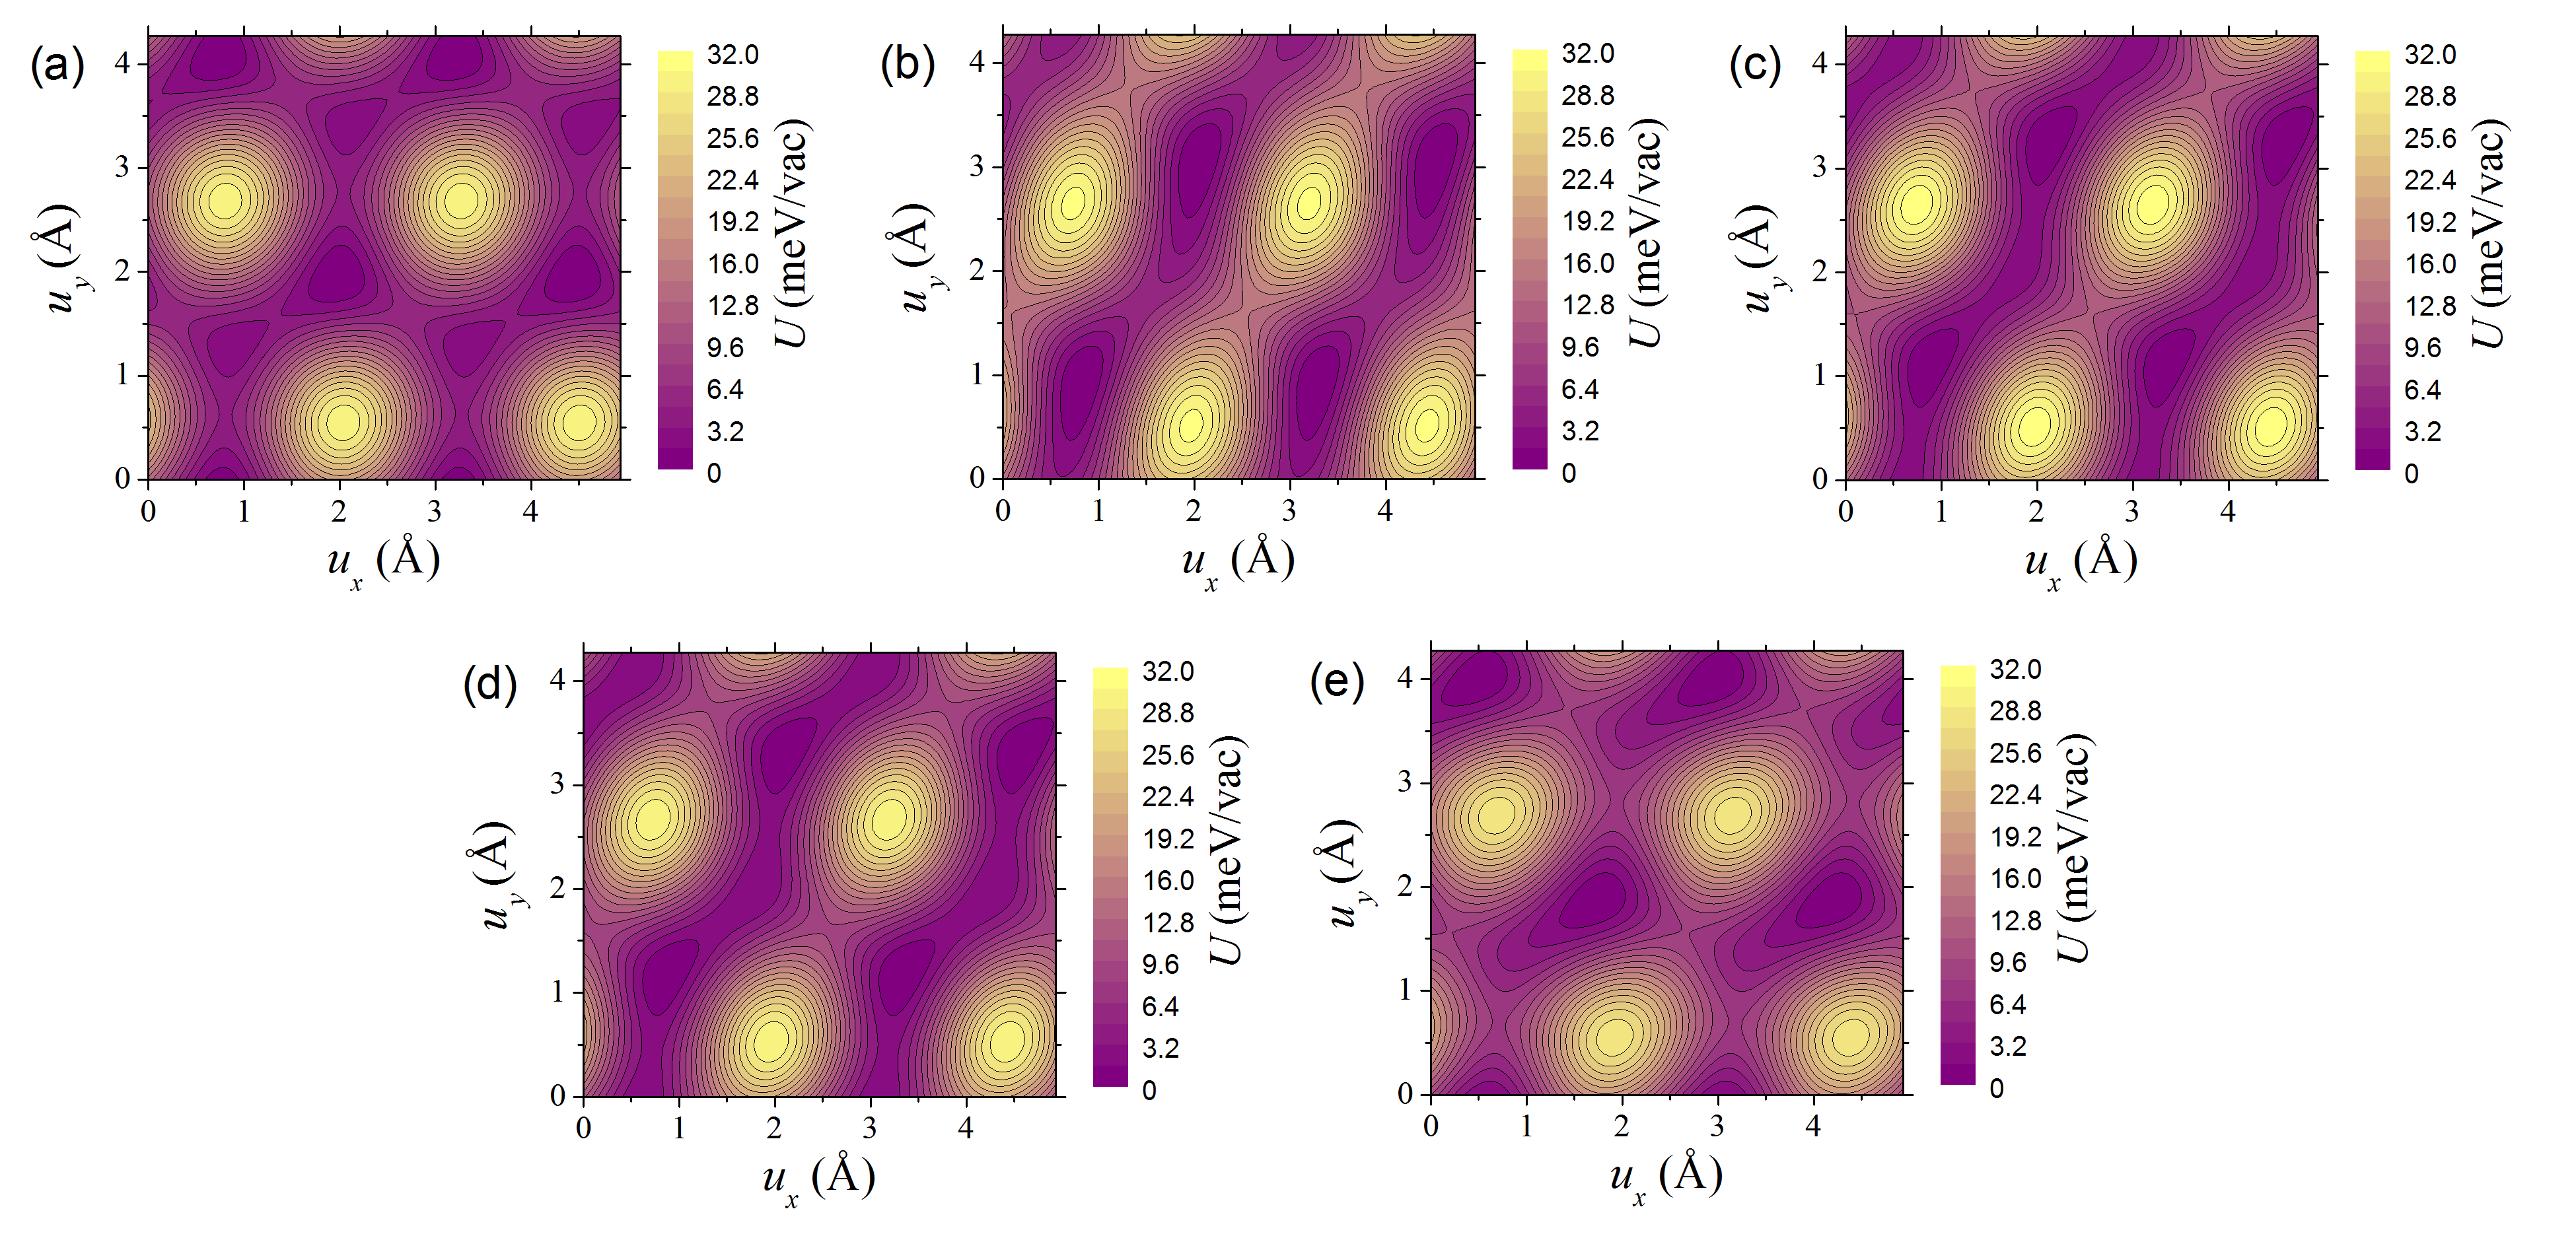
To investigate whether the PES of twisted graphene layers with defects can be described by the first Fourier harmonics, we summed up contributions corresponding to Eq. 2 for all atoms for the upper layer with the vacancy. From the classical calculations of the PES for co-aligned graphene layers at the interlayer distance of 3.463 Å optimal for the twisted defect-free layers, we estimated meV. The PES computed for the simulation cell of the moiré pattern with coprime indices (2,1) with a vacancy based on Eq. 2 is shown in Fig. 4d. As seen from comparison with Fig. 3b, the shape and quantitative characteristics of the classical PES are well reproduced. The root-mean-square deviation of the approximation from the classical PES is only 0.05 meV per vacancy, which is within 0.2% of the magnitude of PES corrugation. The maximal deviation of the approximation is 0.13 meV, which is 0.4% of , and itself is different by only 0.2%.
For the twisted layers without defects forming an infinite commensurate moiré pattern, the contributions from all the atoms of one layer cancel each other (we checked this numerically for the (2,1) moiré pattern). Therefore, the PES can be also computed as a sum of differences of contributions and given by Eq. 2 for atoms in the layer with the vacancy and the same layer before the vacancy formation. For the atom that is removed upon the vacancy formation (shown in red in Fig. 1a), the first of these two terms is zero: . It can be expected that goes to zero for atoms far from the atom removed, which have virtually the same position in the layers with and without the vacancy. Therefore, one can think on counting the contributions only from the atoms within some radius from the atom removed (Fig. 1a). Our calculations show that already for the radius of Å, which corresponds to account of only the nearest neighbours of the atom removed, the PES displays the preferred direction for sliding (Fig. 4a). This feature becomes much more prominent upon inclusion of the second and further neighbours (Fig. 4b). For 5 Å, which is close to the maximal possible for the simulation cell considered, the PES looks already similar to the one computed using the Lebedeva potential (Fig. 3b). For this radius, the root-mean-square deviation is 1 meV, which is about 4% of the magnitude of PES corrugation. The deviations of up to 2 meV, i.e. 7% of are observed. The magnitude of corrugation itself is higher by 5%. This radius can be considered as a characteristic radius of the vacancy for the phenomena related to interlayer interaction.
The approximation by the Fourier harmonics can be also used to get insight into the origin of differences in the results of the classical and DFT calculations. In the classical calculations and approximation considered above, all the atoms of the upper layer interact in with the lower layer in the same way. However, atoms in the close vicinity of the vacancy carry different charges and spins and should interact in distinct ways. This can be taken into account by changing the parameter for different atoms. It can be expected that the contribution of the atom with dangling bonds differs the most (shown in blue in Fig. 1b). Reducing for it the parameter by 20–50%, the PES becomes qualitatively similar to the one obtained by the DFT calculations (Fig. 3a). The former global minimum gets unstable and the barriers for relative displacement along and across the preferred direction for sliding become similar in magnitude (Fig. 4e). The root-mean square deviation from the ab initio PES is minimized when for the atom with dangling bonds is reduced by 37%. In this case, the magnitude of PES corrugation for this approximation is only 0.4% greater than the DFT result. The barriers for sliding are about 8 meV per vacancy, very close to the DFT estimate. The root-mean-square deviation from the ab initio PES is 1.6 meV per vacancy, i.e. 6% of the magnitude of PES corrugation. Probably this deviation can be further minimized by introducing slightly different for atoms forming the new bond in the reconstructed vacancy (Fig. 1b).
To summarize, the approximation by the first Fourier harmonics provides an extremely cheap alternative to DFT calculations and even calculations with classical potentials. Only the atoms in the close vicinity of the local defects, i.e. within 5 Å in the case of the vacancy, need to be taken into account to get the reasonable accuracy. Differentiation of the parameters for atoms within the defect makes possible adequate approximation of DFT results even in the presence of spin-polarized defects.
IV Discussion and conclusions
The density functional theory with van der Waals correction was applied in the present paper to study the restriction of structural superlubricity coming from atomic-scale defects by the example of twisted bilayer graphene with coprime indices (2,1) of the commensurate moiré pattern and vacancies in one of the layers. For the purpose of this study, the vacancy structure and the PES of interlayer interaction for perfect twisted bilayer graphene were calculated. The structure of the isolated reconstructed vacancy was found to be flat in accordance with the majority of the previous studies Latham et al. (2013); Wadey et al. (2016) (see also Ref. Skowron et al., 2015 for review). Corrugations of the PES for defect-free twisted graphene layers forming the (2,1) moiré pattern were computed using the Lebedeva potential fitted to the DFT data and turned out to be less than the calculation accuracy. From the calculations with the largest cutoff radius of the potential considered, it can be concluded that the magnitude of PES corrugation in this case is less than meV per atom of the upper layer. This contradicts the previous results Koren and Duerig (2016) obtained using the Kolmogorov-Crespi potential. However, the discrepancy should be mostly attributed to the low value of the cutoff radius of the potential used in that paper.
The DFT calculations for the twisted bilayer with vacancies in one of the layers gave the magnitude of PES corrugation of 28 meV per vacancy and the barriers for relative sliding of the layers in different directions of 7 – 8 meV per vacancy. Thus, the presence of atomic-scale defects leads to non-negligible friction for twisted layers. For comparison, in the coaligned commensurate bilayer, the magnitude of PES corrugation and barrier for relative sliding of the layers are 16 and 1.7 meV per atom of the upper layer, respectively Lebedeva et al. (2017). Thus, the friction in the twisted bilayer with a reasonable density of vacancies is still small compared to the coaligned commensurate bilayer but large compared to defect-free twisted bilayer. According to our DFT calculations, the static friction force of about 12 – 16 pN per vacancy is required to induce sliding of the layers with respect to each other.
Let us discuss applicability of the results obtained for the twisted graphene bilayer with the commensurate (2,1) moiré pattern to other 2D superlubric systems. As for the extreme PES flatness, previously the total compensation of atomic contributions into the PES (within the calculation accuracy) was demonstrated for complete unit cells of commensurate double-walled nanotubes with at least one chiral wall. Kolmogorov and Crespi (2000); Damnjanović et al. (2002); Vuković et al. (2003); Belikov et al. (2004); Bichoutskaia et al. (2005) For such nanotubes, the extremely flat PESs were found both via DFT calculations Bichoutskaia et al. (2005) and using various empirical potentials Kolmogorov and Crespi (2000); Damnjanović et al. (2002); Vuković et al. (2003); Belikov et al. (2004). At the same time, the PES corrugations obtained by different calculation methods for the (5,5)@(10,10) nanotube with compatible symmetries of the walls differ by two orders of magnitude. Vuković et al. (2003); Belikov et al. (2004); Bichoutskaia et al. (2005); Charlier and Michenaud (1993); Palser (1999); Saito et al. (2001); Bichoutskaia et al. (2006) Thus, the extreme flatness of the PES does not seem to be related with the nature of interlayer interaction but rather with only partial compatibility of symmetries of the layers. We believe, therefore, that the compensation of atomic contributions to the PES in the considered case of twisted bilayer graphene is also a result of only partial compatibility of translational symmetries of the layers and similar cancellation can be expected for (2,1) moiré patterns of other 2D materials. For commensurate double-walled nanotubes with at least one chiral layer, it was also shown that the smallest Fourier harmonics that contribute into the PES of the complete unit cell increase upon increasing the number of atoms in the unit cell, while the amplitudes of these harmonics decrease.Damnjanović et al. (2002) Hence the PES corrugations for commensurate moiré patterns with greater coprime indices should be even smaller than those for the considered moiré pattern with coprime indices (2,1).
Furthermore, the extreme PES flatness for the complete unit cell without defects means that only defects (for example, vacancies) provide non-negligible contributions to the PES and can be considered as particles moving relative to the perfect layer. In such an imaginary picture, a change of the twist angle corresponds to the change in the orientation of these particles relative to the perfect layer. Evidently a small modification in the particle orientation leads to a small change of the PES. Thus, a small change of the twist angle from the commensurate moiré pattern to incommensurate one should lead to a small change in the contributions of defects to the total PES. Therefore, the model that we considered in the present study gives the results that are qualitatively valid also for incommensurate superlubric systems.
The PES calculations for the case of several disordered defects is beyond the scope of the present study. However, we would like to discuss briefly the influence of disordered defects on static and dynamic macroscopic friction in a superlubric system. In the case of random distribution and orientation of defects, their contributions into the static friction force cannot be summed up directly. The static friction force for a disordered contact scales as , where is the contact area and is the number of atoms in the contact. Müser et al. (2001); Dietzel et al. (2013) Similar scaling of the friction force is expected for the contribution of disordered defects , where is the number of defects. The edge friction force scales as , where is the total rim area of incomplete cells of the moiré pattern Koren and Duerig (2016). The static friction force between perfect incommensurate layers does not depend on the contact area de Wijn (2012), that is the contribution of the perfect interface into the friction force . Thus, the contribution of defects into the total static friction force between incommensurate 2D layers with disordered defects should become the dominant one when the macroscopic contact area is sufficiently large. Dissipation of the kinetic energy on hills of the PES of interlayer interaction is the reason of dynamic friction during relative motion of 2D layers. Popov et al. (2011a) Therefore, a drastic increase of the PES corrugations due to the presence of defects should lead to the increase of dynamic friction in superlubric systems.
In the model system studied in our calculations, defects are present only in one layer. In the case of low densities of defects, the interaction between defects in the neighbour layers can be disregarded and defects from the both layers should contribute to the total static or dynamic friction in the same manner. Upon increasing the defect density, the interaction between defects in the neighbour layers (with probable formation of chemical bonds between the layers) should lead to further restriction of superlubricity. The presence of adjacent graphene layers or a substrate could also affect the PES. Nevertheless, previous DFT calculations Lebedeva et al. (2017, 2011b); Popov et al. (2012) showed that differences in the PES corrugations and barriers for relative sliding of coaligned commensurate graphene layers in bilayer graphene and graphite are normally within 20%, which is smaller than the scatter in the values of these physical quantities obtained using different DFT approaches Kolmogorov and Crespi (2005); Reguzzoni et al. (2012); Ershova et al. (2010); Lebedeva et al. (2011b, 2017) and estimates of these quantities from the experimental measurements Alden et al. (2013); Popov et al. (2012). Thus, we believe that the presence of additional 2D layers or a substrate for the superlubric system should not lead to a drastic change of contributions of defects into the PES of interlayer interaction in comparison with the bilayer system.
Let us now discuss the approaches that can be used for large-scale simulations of phenomena related to interlayer interaction in twisted bilayers with defects. The magnitude of PES corrugation obtained using the semiempirical Lebedeva potential differs from the DFT result by only 8%. Since the magnitude of PES corrugation determines dynamic friction related with dissipation of the kinetic energy of relative motion of the layers on such corrugations, the Lebedeva potential should be adequate for qualitative simulations of the influence of atomic-scale defects on dynamic friction in systems with structural superlubricity. On the other hand, the semiempirical potential fails to describe regions of the PES around the minima and underestimates some of the barriers. Thus, it is not appropriate for static friction studies. This failure can be attributed to ignorance of spin-polarization effects.
An approximation based on the description of the interaction energy between atoms of one layer and the whole second layer via the first Fourier components provides an alternative to calculations with classical potentials for large systems and it is even cheaper computationally. Our calculations showed that such an approximation can reproduce closely the classical PES obtained using the semiempirical potential. Considering changes in contributions of atoms as compared to the defect-free bilayer, only the atoms in the close vicinity of the defect can be taken into account. According to our calculations, it is sufficient to take into account atoms within 5 Å from the vacancy to reproduce the classical PES with the error in the magnitude of PES corrugation of 5% and root-mean-square deviation equal to 7% of the magnitude of PES corrugation. This can be considered as an effective radius of vacancy defects for phenomena related with interlayer interaction. The approximation based on the first Fourier components can also reproduce the PES obtained by the DFT calculations once somewhat different parameters of the interaction are assumed for the atoms within the defect and in the perfect layer. For vacancy defects, the root-mean-square deviation of 6% of the magnitude of PES corrugation is achieved when the amplitude of Fourier harmonics for the atom with dangling bonds is reduced by 37% compared to the other atoms of the layer with vacancies.
The raw DFT data required to reproduce our findings are available to download from Ref. Minkin et al., 2021.
Acknowledgments
A.A.K. and A.M.P. acknowledge support by the Russian Foundation for Basic Research (Grant No. 18-52-00002). I.V.L. acknowledges the European Union MaX Center of Excellence (EU-H2020 Grant No. 824143). The work was carried out using computing resources of the federal collective usage centre “Complex for simulation and data processing for mega-science facilities” at NRC “Kurchatov Institute” (http://ckp.nrcki.ru).
The authors declare no conflict of interest.
References
- Cao et al. (2018) Y. Cao, V. Fatemi, S. Fang, K. Watanabe, T. Taniguchi, E. Kaxiras, and P. Jarillo-Herrero, Nature 556, 43 (2018).
- Lebedeva and Popov (2019) I. V. Lebedeva and A. M. Popov, Phys. Rev. B 99, 195448 (2019).
- Vaezi et al. (2013) A. Vaezi, Y. Liang, D. H. Ngai, L. Yang, and E.-A. Kim, Phys. Rev. X 3, 021018 (2013).
- Zhang et al. (2013a) F. Zhang, A. H. MacDonald, and E. J. Mele, Proc. Natl. Acad. Sci. USA 110, 10546 (2013a).
- Dienwiebel et al. (2004) M. Dienwiebel, G. S. Verhoeven, N. Pradeep, J. W. M. Frenken, J. A. Heimberg, and H. W. Zandbergen, Phys. Rev. Lett. 92, 126101 (2004).
- Filippov et al. (2008) A. E. Filippov, M. Dienwiebel, J. W. M. Frenken, J. Klafter, and M. Urbakh, Phys. Rev. Lett. 100, 046102 (2008).
- Androulidakis et al. (2020) C. Androulidakis, E. N. Koukaras, G. Paterakis, G. Trakakis, and C. Galiotis, Nat. Commun. 11, 1595 (2020).
- Liu et al. (2012) Z. Liu, J. Yang, F. Grey, J. Z. Liu, Y. Liu, Y. Wang, Y. Yang, Y. Cheng, and Q. Zheng, Phys. Rev. Lett. 108, 205503 (2012).
- Vu et al. (2016) C. C. Vu, S. Zhang, M. Urbakh, Q. Li, Q.-C. He, and Q. Zheng, Phys. Rev. B 94, 081405(R) (2016).
- Hirano and Shinjo (1990) M. Hirano and K. Shinjo, Phys. Rev. B 41, 11837 (1990).
- Hirano et al. (1991) M. Hirano, K. Shinjo, R. Kaneko, and Y. Murata, Phys. Rev. Lett. 67, 2642 (1991).
- Poklonski et al. (2013) N. A. Poklonski, A. I. Siahlo, S. A. Vyrko, A. M. Popov, Y. E. Lozovik, I. V. Lebedeva, and A. A. Knizhnik, J. Comput. Theor. Nanosci. 10, 141 (2013).
- Popov et al. (2013a) A. M. Popov, I. V. Lebedeva, A. A. Knizhnik, Y. E. Lozovik, and B. V. Potapkin, J. Phys. Chem. C 117, 11428 (2013a).
- Kang et al. (2015) J. W. Kang, K.-S. Kim, and O. K. Kwon, J. Comput. Theor. Nanosci. 12, 387 (2015).
- Koren et al. (2015) E. Koren, E. Lörtscher, C. Rawlings, A. W. Knoll, and U. Duerig, Science 348, 679 (2015).
- Kang and Lee (2016) J. W. Kang and K. W. Lee, J. Nanosci. Nanotechnol. 16, 2891 (2016).
- Zheng et al. (2008) Q. Zheng, B. Jiang, S. Liu, Y. Weng, L. Lu, Q. Xue, J. Zhu, Q. Jiang, S. Wang, and L. Peng, Phys. Rev. Lett. 100, 067205 (2008).
- Popov et al. (2011a) A. M. Popov, I. V. Lebedeva, A. A. Knizhnik, Y. E. Lozovik, and B. V. Potapkin, Phys. Rev. B 84, 245437 (2011a).
- Lebedeva et al. (2010) I. V. Lebedeva, A. A. Knizhnik, A. M. Popov, O. V. Ershova, Y. E. Lozovik, and B. V. Potapkin, Phys. Rev. B 82, 155460 (2010).
- Lebedeva et al. (2011a) I. V. Lebedeva, A. A. Knizhnik, A. M. Popov, O. V. Ershova, Y. E. Lozovik, and B. Potapkin, J. Chem. Phys. 134, 104505 (2011a).
- Zhang et al. (2013b) R. Zhang, Z. Ning, Y. Zhang, Q. Zheng, Q. Chen, H. Xie, Q. Zhang, W. Qian, and F. Wei, Nat. Nanotechnol. 8, 912 (2013b).
- Kawai et al. (2016) S. Kawai, A. Benassi, E. Gnecco, H. Söde, R. Pawlak, X. Feng, K. Müllen, D. Passerone, C. A. Pignedoli, P. Ruffieux, R. Fasel, and E. Meye, Science 351, 957 (2016).
- Song et al. (2018) Y. Song, D. Mandelli, O. Hod, M. Urbakh, M. Ma, and Q. Zheng, Nat. Mater. 17, 894 (2018).
- Hod et al. (2018) O. Hod, E. Meyer, Q. Zheng, and M. Urbakh, Nature 563, 485 (2018).
- Auwärter (2019) W. Auwärter, Surf. Sci. Rep. 74, 1 (2019).
- Elias et al. (2009) D. C. Elias, R. R. Nair, T. M. G. Mohiuddin, S. V. Morozov, P. Blake, M. P. Halsall, A. C. Ferrari, D. W. Boukhvalov, M. I. Katsnelson, A. K. Geim, and K. S. Novoselov, Science 323, 610 (2009).
- Shi et al. (2015) Y. Shi, H. Li, and L.-J. Li, Chem. Soc. Rev. 44, 2744 (2015).
- Churchill and Jarillo-Herrero (2014) H. O. H. Churchill and P. Jarillo-Herrero, Nat. Nanotechnol. 9, 330 (2014).
- Zhang et al. (2015) Z. Zhang, Y. Yang, G. Gao, and B. I. Yakobson, Angew. Chem. Int. Ed. Engl. 54, 13022 (2015).
- Yuhara et al. (2018) J. Yuhara, H. Shimazu, K. Ito, A. Ohta, M. Araidai, M. Kurosawa, M. Nakatake, and G. Le Lay, ACS Nano 12, 11632 (2018).
- Geim and Grigorieva (2013) A. K. Geim and I. V. Grigorieva, Nature 499, 419 (2013).
- Verhoeven et al. (2004) G. S. Verhoeven, M. Dienwiebel, and J. W. M. Frenken, Phys. Rev. B 70, 165418 (2004).
- Dienwiebel et al. (2005) M. Dienwiebel, N. Pradeep, G. S. Verhoeven, H. W. Zandbergen, and J. W. M. Frenken, Surf. Sci. 576, 197 (2005).
- Bonelli et al. (2009) F. Bonelli, N. Manini, E. Cadelano, and L. Colombo, Eur. Phys. J. B 70, 449 (2009).
- Guo et al. (2007) Y. Guo, W. Guo, and C. Chen, Phys. Rev. B 76, 155429 (2007).
- Shibuta and Elliott (2011) Y. Shibuta and J. A. Elliott, Chem. Phys. Lett. 512, 146 (2011).
- Xu et al. (2013) Z. Xu, X. Li, B. I. Yakobson, and F. Ding, Nanoscale 5, 6736 (2013).
- Wang et al. (2019) K. Wang, W. Ouyang, W. Cao, M. Ma, and Q. Zheng, Nanoscale 11, 2186 (2019).
- van Wijk et al. (2013) M. M. van Wijk, M. Dienwiebel, J. W. M. Frenken, and A. Fasolino, Phys. Rev. B 88, 235423 (2013).
- Mandelli et al. (2017) D. Mandelli, I. Leven, O. Hod, and M. Urbakh, Sci. Rep. 7, 10851 (2017).
- de Wijn (2012) A. S. de Wijn, Phys. Rev. B 86, 085429 (2012).
- Müser et al. (2001) M. H. Müser, L. Wenning, and M. O. Robbins, Phys. Rev. Lett. 86, 1295 (2001).
- Dietzel et al. (2013) D. Dietzel, M. Feldmann, U. D. Schwarz, H. Fuch, and A. Schirmeisen, Phys. Rev. Lett. 111, 235502 (2013).
- Koren and Duerig (2016) E. Koren and U. Duerig, Phys. Rev. B 94, 045401 (2016).
- Guo et al. (2005) W. Guo, W. Zhong, Y. Dai, and S. Li, Phys. Rev. B 72, 075409 (2005).
- Lebedeva et al. (2009) I. V. Lebedeva, A. A. Knizhnik, A. M. Popov, Y. E. Lozovik, and B. V. Potapkin, Nanotechnology 20, 105202 (2009).
- Belikov et al. (2004) A. V. Belikov, Y. E. Lozovik, A. G. Nikolaev, and A. M. Popov, Chem. Phys. Lett. 385, 72 (2004).
- Kolmogorov and Crespi (2000) A. N. Kolmogorov and V. H. Crespi, Phys. Rev. Lett. 85, 4727 (2000).
- Kolmogorov and Crespi (2005) A. N. Kolmogorov and V. H. Crespi, Phys. Rev. B 71, 235415 (2005).
- Lebedeva et al. (2011b) I. V. Lebedeva, A. A. Knizhnik, A. M. Popov, Y. E. Lozovik, and B. V. Potapkin, Phys. Chem. Chem. Phys. 13, 5687 (2011b).
- Lebedeva et al. (2012) I. V. Lebedeva, A. A. Knizhnik, A. M. Popov, Y. E. Lozovik, and B. V. Potapkin, Physica E 44, 949 (2012).
- Popov et al. (2012) A. M. Popov, I. V. Lebedeva, A. A. Knizhnik, Y. E. Lozovik, and B. V. Potapkin, Chem. Phys. Lett. 536, 82 (2012).
- Ershova et al. (2010) O. V. Ershova, T. C. Lillestolen, and E. Bichoutskaia, Phys. Chem. Chem. Phys. 12, 6483 (2010).
- Reguzzoni et al. (2012) M. Reguzzoni, A. Fasolino, E. Molinari, and M. C. Righi, Phys. Rev. B 86, 245434 (2012).
- Lebedev et al. (2016) A. V. Lebedev, I. V. Lebedeva, A. A. Knizhnik, and A. M. Popov, RSC Advances 6, 6423 (2016).
- Lebedev et al. (2020) A. V. Lebedev, I. V. Lebedeva, A. M. Popov, A. A. Knizhnik, N. A. Poklonski, and S. A. Vyrko, Phys. Rev. B 102, 045418 (2020).
- Jung et al. (2015) J. Jung, A. M. DaSilva, A. H. MacDonald, and S. Adam, Nat. Commun. 6, 6308 (2015).
- Kumar et al. (2015) H. Kumar, D. Er, L. Dong, J. Li, and V. B. Shenoy, Sci. Rep. 5, 10872 (2015).
- Lebedev et al. (2017) A. V. Lebedev, I. V. Lebedeva, A. M. Popov, and A. A. Knizhnik, Phys. Rev. B 96, 085432 (2017).
- Damnjanović et al. (2002) M. Damnjanović, T. Vuković, and I. Milošević, Eur. Phys. J. B 25, 131 (2002).
- Vuković et al. (2003) T. Vuković, M. Damnjanović, and I. Milošević, Physica E 16, 259 (2003).
- Bichoutskaia et al. (2005) E. Bichoutskaia, A. M. Popov, A. El-Barbary, M. I. Heggie, and Y. E. Lozovik, Phys. Rev. B 71, 113403 (2005).
- Popov et al. (2013b) A. M. Popov, I. V. Lebedeva, A. A. Knizhnik, Y. E. Lozovik, and B. V. Potapkin, J. Chem. Phys. 138, 024703 (2013b).
- Campanera et al. (2007) J. M. Campanera, G. Savini, I. Suarez-Martinez, and M. I. Heggie, Phys. Rev. B 75, 235449 (2007).
- Kresse and Furthmüller (1996) G. Kresse and J. Furthmüller, Phys. Rev. B 54, 11169 (1996).
- Perdew et al. (1996) J. P. Perdew, K. Burke, and M. Ernzerhof, Phys. Rev. Lett. 77, 3865 (1996).
- Grimme (2006) S. Grimme, J. Comp. Chem. 27, 1787 (2006).
- Lebedeva et al. (2017) I. V. Lebedeva, A. V. Lebedev, A. M. Popov, and A. A. Knizhnik, Comput. Mater. Sci. 128, 45 (2017).
- Lebedeva et al. (2019) I. V. Lebedeva, A. V. Lebedev, A. M. Popov, and A. A. Knizhnik, Computational Materials Science 162, 370 (2019).
- Kresse and Joubert (1999) G. Kresse and D. Joubert, Phys. Rev. B 59, 1758 (1999).
- Monkhorst and Pack (1976) H. J. Monkhorst and J. D. Pack, Phys. Rev. B 13, 5188 (1976).
- Wadey et al. (2016) J. D. Wadey, A. Markevich, A. Robertson, J. Warner, A. Kirkland, and E. Besley, Chem. Phys. Lett. 648, 161 (2016).
- Skowron et al. (2015) S. T. Skowron, I. V. Lebedeva, A. M. Popov, and E. Bichoutskaia, Chem. Soc. Rev. 44, 3143 (2015).
- Ulman and Narasimhan (2014) K. Ulman and S. Narasimhan, Phys. Rev. B 89, 245429 (2014).
- Dai et al. (2011) X. Q. Dai, J. H. Zhao, M. H. Xie, Y. N. Tang, Y. H. Li, and B. Zhao, Eur. Phys. J. B 80, 343 (2011).
- Latham et al. (2013) C. D. Latham, M. I. Heggie, M. Alatalo, S. Öberg, and P. R. Briddon, J. Phys.: Condens. Matter 25, 135403 (2013).
- Wu et al. (2013) L. Wu, T. Hou, Y. Li, K. S. Chan, and S.-T. Lee, J. Phys. Chem. C 117, 17066 (2013).
- Popov et al. (2011b) A. M. Popov, I. V. Lebedeva, A. A. Knizhnik, Y. E. Lozovik, and B. V. Potapkin, Phys. Rev. B 84, 045404 (2011b).
- Alden et al. (2013) J. S. Alden, A. W. Tsen, P. Y. Huang, R. Hovden, L. Brown, J. Park, D. A. Muller, and P. L. McEuen, PNAS 110, 11256 (2013).
- Charlier and Michenaud (1993) J.-C. Charlier and J. P. Michenaud, Phys. Rev. Lett. 70, 1858 (1993).
- Palser (1999) A. H. R. Palser, Phys. Chem. Chem. Phys. 1, 4459 (1999).
- Saito et al. (2001) R. Saito, R. Matsuo, T. Kimura, G. Dresselhaus, and M. S. Dresselhaus, Chem. Phys. Lett. 348, 187 (2001).
- Bichoutskaia et al. (2006) E. Bichoutskaia, M. I. Heggie, A. M. Popov, and Y. E. Lozovik, Phys. Rev. B 73, 045435 (2006).
- Minkin et al. (2021) A. Minkin, I. Lebedeva, A. Popov, and A. Knizhnik, Mendeley Data (2021), https://data.mendeley.com/datasets/74ccpj55gf/1.