11email: murat.uzundag@postgrado.uv.cl 22institutetext: European Southern Observatory, Alonso de Cordova 3107, Santiago, Chile 33institutetext: Grupo de Evolución Estelar y Pulsaciones. Facultad de Ciencias Astronómicas y Geofísicas, Universidad Nacional de La Plata, Paseo del Bosque s/n, 1900 La Plata, Argentina 44institutetext: IALP - CONICET 55institutetext: Instituto de Física, Universidade Federal do Rio Grande do Sul, 91501-970, Porto-Alegre, RS, Brazil 66institutetext: Institut für Astronomie und Astrophysik, Kepler Center for Astro and Particle Physics, Eberhard Karls Universität, Sand 1,72076 Tübingen, Germany 77institutetext: Institute for Physics and Astronomy, University of Potsdam, Karl-Liebknecht-Str. 24/25, D-14476 Potsdam, Germany 88institutetext: DIRAC Institute, Department of Astronomy, University of Washington, Seattle, WA-98195, USA 99institutetext: NSF Astronomy and Astrophysics Postdoctoral Fellow 1010institutetext: Department of Physics, Duke University, Durham, NC-27708, USA 1111institutetext: Department of Astrophysics/IMAPP, Radboud University, P O Box 9010, NL-6500 GL Nijmegen, The Netherlands
Pulsating hydrogen-deficient white dwarfs and pre-white dwarfs observed with TESS
Abstract
Context. The TESS mission is revolutionizing the blossoming area of asteroseismology, particularly of pulsating white dwarfs and pre-white dwarfs, thus continuing the impulse of its predecessor, the Kepler mission.
Aims. In this paper, we present the observations from the extended TESS mission in both 120 s short-cadence and 20 s ultra-short-cadence mode of two pre-white dwarf stars showing hydrogen deficiency. We identify them as two new GW Vir stars, TIC 333432673 and TIC 095332541. We apply the tools of asteroseismology with the aim of deriving their structural parameters and seismological distances.
Methods. We carried out a spectroscopic analysis and a spectral fitting of TIC 333432673 and TIC 095332541. We also processed and analyzed the high-precision TESS photometric light curves of the two target stars, and derived their oscillation frequencies. We performed an asteroseismological analysis of these stars on the basis of PG 1159 evolutionary models that take into account the complete evolution of the progenitor stars. We searched for patterns of uniform period spacings in order to constrain the stellar mass of the stars, and employed the individual observed periods to search for a representative seismological model.
Results. The analysis of the TESS light curves of TIC 333432673 and TIC 095332541 reveals the presence of several oscillations with periods ranging from 350 to 500 s associated to typical gravity ()-modes. From follow-up ground-based spectroscopy, we find that both stars have similar effective temperature ( K) and surface gravity () but a different He/C composition of their atmosphere. On the basis of PG 1159 evolutionary tracks, we derived a spectroscopic mass of = for both stars. Our asteroseismological analysis of TIC 333432673 allowed us to find a constant period spacing compatible with a stellar mass , and an asteroseismological model for this star with a stellar mass = , and a seismological distance of pc. For this star, we find an excellent agreement between the different methods to infer the stellar mass, and also between the seismological distance and that measured with Gaia ( pc). For TIC 095332541, we have found a possible period spacing that suggests a stellar mass of . Unfortunately, we have not been able to find an asteroseismological model for this star.
Conclusions. Using the high-quality data collected by the TESS space mission and follow-up spectroscopy, we have been able to discover and characterize two new GW Vir stars. The TESS mission is having, and will continue to have, an unprecedented impact on the area of white-dwarf asteroseismology.
Key Words.:
asteroseismology — stars: oscillations (including pulsations) — stars: interiors — stars: evolution — stars: white dwarfs1 Introduction
GW Vir stars are pulsating PG 1159 stars, that is, pulsating hot hydrogen (H)-deficient, carbon (C)-, oxygen (O)-, helium (He)-rich white dwarf (WD) and pre-WD stars. PG 1159 stars represent the evolutionary link between post-AGB stars and most of the H-deficient WDs, including DO and DB WDs (Werner & Herwig 2006). These stars likely have their origin in a born-again episode induced by a post-AGB He thermal pulse (see Herwig 2001; Blöcker 2001; Althaus et al. 2005; Miller Bertolami et al. 2006, for references). GW Vir stars constitute the hottest class of pulsating WDs and pre-WDs, the other categories being the DAV or ZZ Ceti (H-rich atmospheres) stars, DBV or V777 Her (He-rich atmospheres) stars, ELMV stars (H-rich atmospheres and extremely low masses), and pre-ELMV stars, likely the precursors of the ELMVs (see the reviews by Winget & Kepler 2008; Althaus et al. 2010; Córsico et al. 2019). The category of GW Vir stars includes PNNV stars, which are still surrounded by a nebula, and DOV stars, that lack a nebula (Winget et al. 1991), and also the pulsating Wolf-Rayet central stars of planetary nebula ([WC] stars) and Early-[WC] = [WCE] stars, because they share the same pulsation properties of pulsating PG 1159 stars (Quirion et al. 2007). GW Vir stars exhibit multiperiodic luminosity variations with periods in the range 300–6000 sec, originated from (gravity)-mode pulsations excited by the -mechanism due to partial ionization of C and O in the outer layers111Due to the high surface temperatures of these stars, it is likely that they do not have convection in their envelopes, making them one of the few classes of pulsating stars for which the well known complication of the convection-pulsation interaction in the pulsational stability analyses is not present. (Starrfield et al. 1983, 1984; Stanghellini et al. 1991; Saio 1996; Gautschy 1997; Gautschy et al. 2005; Córsico et al. 2006; Quirion et al. 2007).
Asteroseismology of WDs and pre-WDs has been strongly promoted during the last decade mainly by the availability of space missions that provide unprecedented high-quality data. Particularly, the Kepler satellite, both the main mission (Borucki et al. 2010) and the K2 mode (Howell et al. 2014), allowed the study of 32 ZZ Ceti stars and two V777 Her stars (Østensen et al. 2011; Greiss et al. 2014; Hermes et al. 2014; Bell et al. 2015; Hermes et al. 2017a, b; Bell et al. 2017; Córsico 2020), until it was out of operation by October 2018. The successor of Kepler is the Transiting Exoplanet Survey Satellite (TESS, Ricker et al. 2015). TESS has provided extensive photometric observations of the brightest stars in 85 % of the sky in the first part of the mission, each observation with a time base of about 27 days per sector observed. In the context of pulsating WDs and pre-WDs, the high-quality observations of TESS, combined with ground-based observations, are able to provide a very important input to the asteroseismology of DBVs (Bell et al. 2019; Bognár et al. 2021), DAVs (Bognár et al. 2020), pre-ELMVs (Wang et al. 2020; Hong et al. 2021), and GW Vir stars (Córsico et al. 2021).
In this work, we report for the first time the photometric variability of the PG1159 stars TIC 333432673 (WD J064115.64-134123.77) and TIC 095332541 (WD J060244.99-135103.57) observed with TESS. Given the small number of already known pulsating stars of this class (20 objects; see Córsico et al. 2019; Sowicka et al. 2021), the discovery of two new GW Vir stars constitutes a particularly relevant finding, even more since the Kepler/K2 mission publications do not include any new object of this nature to date. We perform an asteroseismological analysis of these stars based on the state-of-the-art evolutionary models of PG 1159 stars of Althaus et al. (2005) and Miller Bertolami & Althaus (2006). This study is the second part of our series of papers devoted to the study of pulsating H-deficient WDs observed with TESS. The first article was devoted to a set of six already known GW Vir stars (Córsico et al. 2021).
The paper is organized as follows. In Sect. 2, we present the details of the spectroscopic observations and the data reduction. In Sect. 3, we derive atmospheric parameters for each star by fitting synthetic spectra to the newly obtained low-resolution spectra. In Sect. 4, we analyse the photometric TESS data and give details on the frequency analysis. Sect. 5 is devoted to the asteroseismic analysis of our targets. Finally, in Sect. 6, we summarize our main results.
2 Spectroscopy
TIC 333432673 (WD J064115.64-134123.77) and TIC 095332541 (WD J060244.99-135103.57) were classified as white dwarf candidates by Gentile Fusillo et al. (2019) from their colors and Gaia DR2 parallax. The Gaia DR3 parallax and corresponding distance for TIC 333432673 are mas and pc, while for TIC 095332541 are mas and pc (Bailer-Jones et al. 2021), respectively. We obtained spectroscopic observations for TIC 333432673 and TIC 095332541, to determine the atmospheric parameters.
TIC 333432673 was observed with the Southern Astrophysical Research (SOAR) Telescope, a 4.1-meter aperture optical and near-infrared telescope (Clemens et al. 2004), situated at Cerro Pachón, Chile on March 5, 2021 (under the program allocated by the Chilean Time Allocation Committee (CNTAC), no:CN2020B-74). We use Goodman spectrograph with a setup of 400 l/mm grating with the blaze wavelength 5500 (M1: 3000-7050 Å) with a slit of 1 arcsec. This setup provides a resolution of about 5.6 Å. The data reduction has been partially done by using the instrument pipeline222https://github.com/soar-telescope/goodman_pipeline including overscan, trim, slit trim, bias and flat corrections. For cosmic rays identification and removal, we used an algorithm as described by Pych (2004), which is embedded in the pipeline. Then, we applied the wavelength calibrations using the frames obtained with the internal He-Ar-Ne comparison lamp at the same telescope position as the targets. In a last step, we normalized the spectrum with a high-order Legendre function, using the standard star EG 274 observed with the same setup. The signal to noise ratio of the final spectrum is around 80 at 4200 with 450 s exposure time.
TIC 095332541 was observed with the Isaac Newton Telescope (INT), a 2.54 m (100 in) optical telescope run by the Isaac Newton Group of Telescopes at Roque de los Muchachos Observatory on La Palma on February 15 and 16, 2021 (ProgID: ING.NL.21A.003) with an exposure time of s, respectively. We used the Intermediate Dispersion Spectrograph (IDS) long-slit spectrograph with the grating R400V () and a 1.5 arcsec slit. This setup provides a resolution of about 3.5 Å. Bias and flat field corrections were applied to the data, the wavelength calibration was performed with Cu-Ne-Ar calibration lamp spectra. We did not flux calibrate the spectra. The signal-to-noise ratio (SNR) of the final spectra is around 80 (see Table LABEL:tablespectroscopy).
| TIC | Name | RA | Dec | Exp. | S/N | Telescope/Inst. |
|---|---|---|---|---|---|---|
| (J2000) | (J2000) | (sec) | (at 4200 Å) | |||
| 333432673 | WD J064115.64134123.77 | 06:41:15.88 | -13:41:31.31 | 450 | 80 | SOAR/GOODMAN |
| 095332541 | WD J060244.99135103.57 | 06:02:45.00 | -13:51:03.50 | 2x1800 | 80 | INT/IDS |
3 Spectral fitting
The spectra of both stars exhibit lines exclusively from He II and C IV. Oxygen, which is usually the most abundant element after He and C in PG1159 stars, and nitrogen, which is found as trace element in some PG1159 stars, might be detectable in spectra of better resolution and signal-to-noise ratio. There are no hints of the presence of hydrogen in the spectra.
For the spectral analysis, we used a grid of line-blanketed non-local thermodynamic equilibrium (non-LTE) model atmospheres consisting of H, He, and C as introduced by Werner et al. (2014). In essence, it spans = 60,000–140,000 K in effective temperature and = 4.8–8.3 in surface gravity, with steps of 5,000 K or 10,000 K and 0.3 dex, respectively. C/He mass ratios in the range 0.0–1.0 were considered, namely C/He = 0.0, 0.03, 0.09, 0.33, 0.77, and 1.0. Synthetic spectra were convolved with a Gaussian accounting for the spectral resolution of the observations. The best fitting models were chosen by visual comparison with the rectified observed spectra.
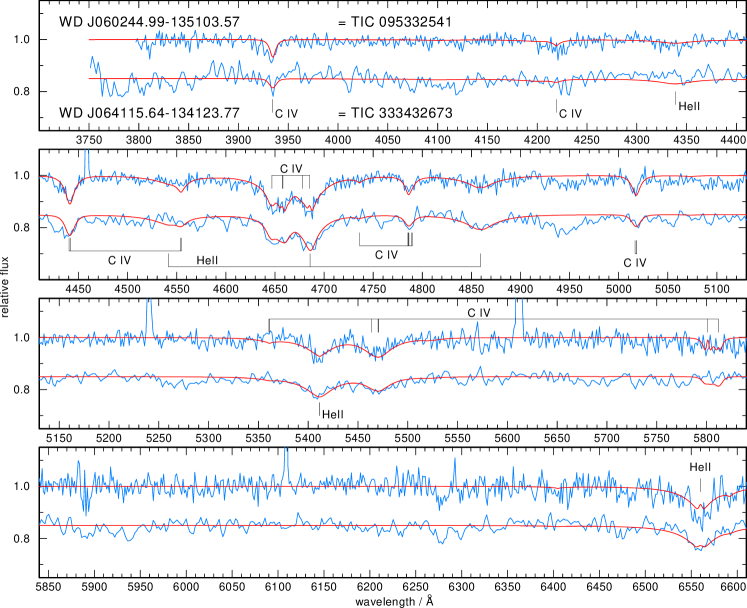
The model fits are displayed in Fig. 1. Both stars have K and , but a different atmospheric composition. For TIC 095332541, we found He = and C = and for TIC 333432673, we measured He = and C = (mass fractions).
4 Photometric observations — TESS
We investigate for variability of the two new PG 1159 stars by examining their high-precision photometric observations obtained with TESS. TIC 333432673 was observed with 120 s cadence mode, while TIC 095332541 was observed with both 120 s and 20 s cadence modes in Sector 33, between 2020-Dec-17 and 2021-Jan-13. We downloaded the data from the “Barbara A. Mikulski Archive for Space Telescopes” (MAST)333http://archive.stsci.edu. We downloaded the target pixel files (TPFs) of both targets from the MAST archive with the Python package (Lightkurve Collaboration et al. 2018). The TPFs are examined to determine the amount of crowding and other potential bright sources near the target. The contamination factor is indicated with the keyword , which gives the ratio of the target flux to the total flux in the TESS aperture. For each target, we have checked the contamination by looking at the parameter which is listed in Table LABEL:DOVlist. In the case of TIC 095332541 the value is about 0.8, which implies that 20% of the total flux measured in the TESS aperture comes from other unresolved sources. We have checked for the nearby targets and their brightness. We found 3 nearby objects to TIC 095332541 within 25 arcsec (based on measurements) with of 19.5, 20.78 and 20.76. As the differences in magnitude between TIC 095332541 and the nearby objects are larger than 4, we safely confirm that the variation comes from the PG 1159 star. In addition, these nearby objects are beyond the detection limit of TESS.
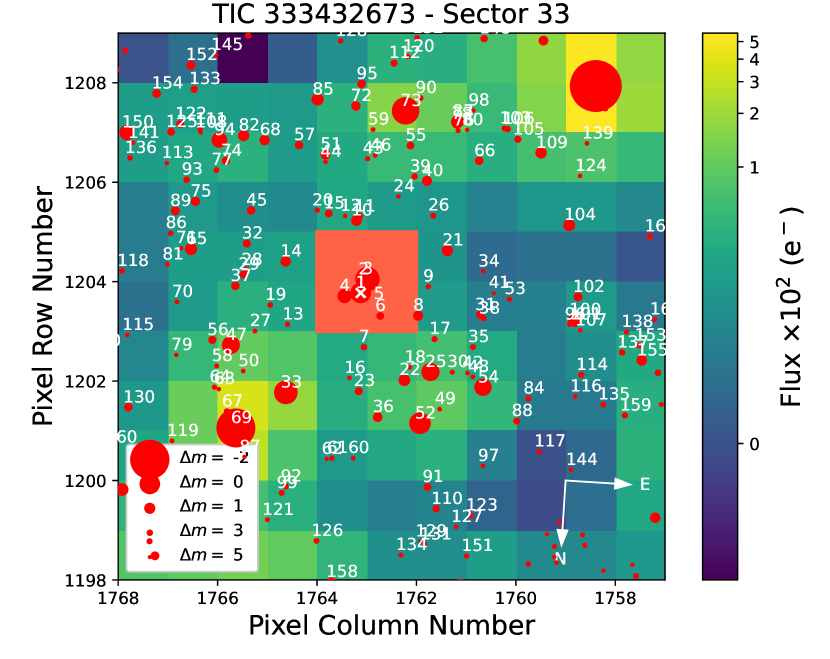
In the case of TIC 333432673, the value is around 0.15, which means that more than 80% of the flux in the TESS aperture comes from the other blended sources. As the contamination from the nearby targets is non-negligible, we considered the proximity and brightness of nearby Gaia sources that could contaminate the photometric aperture.
In Fig. 2, we show the field of view of TESS for TIC 333432673 with the aperture mask.
Within the aperture mask that we used to extract the photometry, four other objects along with TIC 333432673 are located. Two of them are fainter than (circles 2 and 5), and thus it is not possible to detect any variation from them
with TESS.
However, the other two targets (circles 3 and 4) are relatively bright, with of 14.7 and 16.4.
The origin of the signals has been found using a locator code (Higgins & Bell, in prep.) that produces a light curve and computes its Fourier transform for each pixel in the star’s Target Pixel File (TPF). Then it compares the amplitudes and locates the pixel where each signal period has the highest amplitude.
We find that the location of maximum power from the four highest signals in Table 3 is most consistent with the position of the PG 1159 source (Gaia source_id 2950907725113997312).
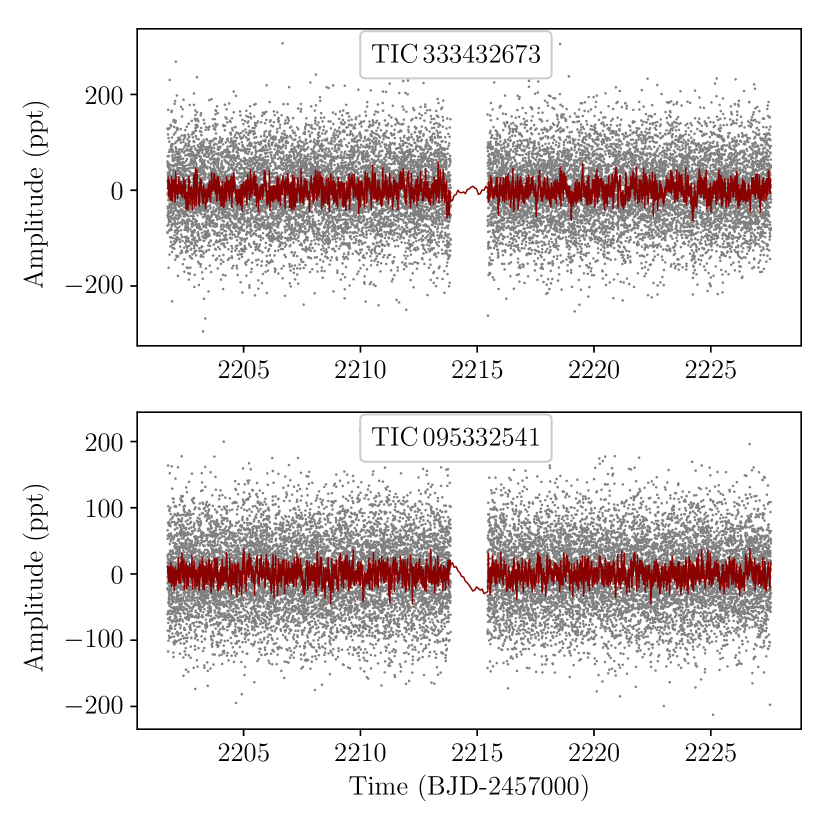
The data are in the FITS format which includes all the photometric information, which have been already processed with the Pre-Search Data Conditioning Pipeline (Jenkins et al. 2016) to remove common instrumental trends. From the FITS file, first we have extracted times in barycentric corrected Julian days (“BJD - 245700”), and fluxes (“PDCSAP FLUX”). Afterwards, we removed outliers by applying a running clipping mask. The fluxes were then normalized by the mean flux.
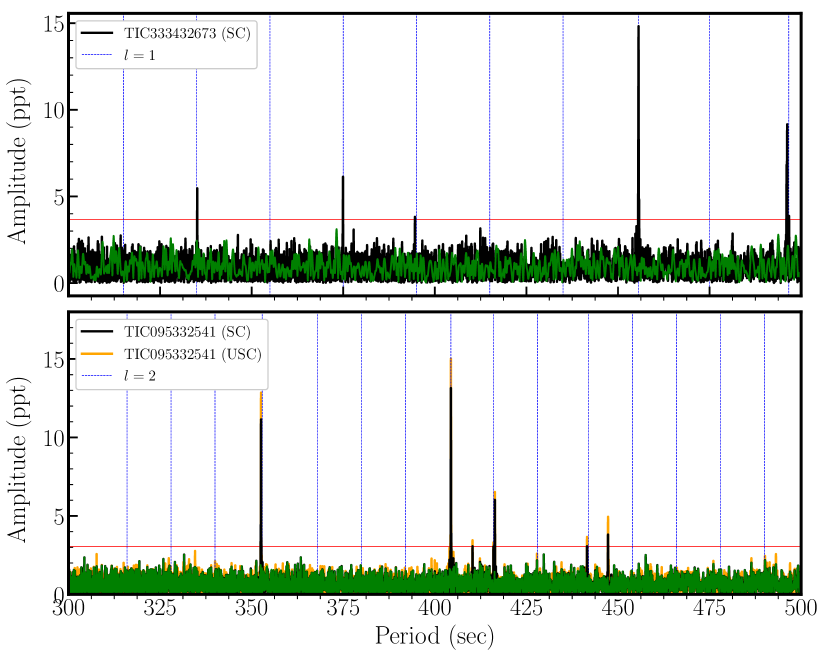
The final light curves of the target stars are shown in Fig. 3. After detrending the light curves, we calculated their Fourier transforms (FTs) to search for periodic signals. The FT of the resulting light curves are shown in Fig. 4. For pre-whitening, we employed a nonlinear least square (NLLS) method, by simultaneously fitting each pulsation frequency above the 0.1% false-alarm probability (FAP), calculated randomizing the light curve 1000 times and measuring the highest peaks in their Fourier transforms. This iterative process has been done starting with the highest amplitude peak, until there is no peak that appears above FAP significance threshold. All prewhitened frequencies for both targets are given in Table 3 and 4 including frequencies (periods) and amplitudes with their corresponding errors and the S/N ratio.
In the case of TIC 333432673, we detected 6 peaks, which are located between 2000 Hz and 3000 Hz. Two frequencies at 2015.393 and 2194.806 Hz show significant residuals. For these unresolved peaks, we did not produce NLLS fit to extract from the light curves as they can be due to either photon-count noise caused by contamination of the background light in the aperture or amplitude/frequency/phase variations over the length of the data. The frequencies of 2013.329 and 2015.393 Hz can be considered as a rotationally split dipole mode. If we assume that a central azimuthal component () is missing, then the rotation period of TIC 333432673 would be 5.6 d. If one of the side components ( or ) is missing, then the rotation period of TIC 333432673 would be 2.8 d.
In the case of TIC 095332541, we identified 6 frequencies in the 120 s short-cadence (SC) data, while we detected 7 frequencies in 20 s ultra-short-cadence (USC) data. The frequencies that located in a similar region as TIC 333432673, between 2200 and 2900 Hz as can be seen in Fig. 4. In table 4, we present the frequency solution that is derived from the USC observations. All frequencies except 2403.783 Hz (f4) were found in the FT of SC data as well. The amplitudes of frequencies that were extracted from USC observations are about 2% higher than the amplitudes of the SC observations. This effect can be seen in the lower panel of Fig. 4, where we depicted FT of USC data (orange lines) and the FT of SC data (black lines). We found a doublet for TIC 095332541 as well at 2401.602 and 2403.783 Hz. Again, if we assume that this pattern is due to rotational multiplets, then the rotation period of TIC 095332541 would be either 2.65 d (in case of either or is missing) or 5.3 d (in case of a central azimuthal component is missing).
The periodicities detected in these two PG 1159 stars are concentrated in a short region from 350 s to 500 s, which agree with the period spectrum typically exhibited by pulsating PG 1159 or GW Vir stars (e.g., McGraw et al. 1979; Winget et al. 1991; Costa et al. 2008; Córsico et al. 2021). Due to the absence of evidence of any nebulae, these two GW Vir stars are classified as DOV stars.
| Name | Obs. | Start Time | CROWDSAP | Length | Resolution | Average Noise | FAP | |
|---|---|---|---|---|---|---|---|---|
| Sector | (BJD-2 457 000) | [d] | Hz | Level [ppt] | [ppt] | |||
| TIC 333432673 | 15.66 | 33 | 2201.7372 | 0.14 | 25.83 | 0.45 | 0.95 | 3.67 |
| TIC 095332541 | 15.79 | 33 | 2201.7373 | 0.78 | 25.83 | 0.45 | 0.71 | 3.06 |
| Peak | S/N | |||
|---|---|---|---|---|
| (Hz) | (s) | (ppt) | ||
| f1 | 2013.329 (44) | 496.689 (10) | 4.155 (75) | 4.38 |
| f2 | 2015.393 (23) | 496.181 (05) | 8.718 (77) | 9.19 |
| f3 | 2194.806 (15) | 455.621 (03) | 15.819 (80) | 16.68 |
| f4 | 2534.342 (47) | 394.579 (07) | 3.829 (75) | 4.03 |
| f5 | 2667.136 (29) | 374.933 (04) | 6.143 (75) | 6.48 |
| f6 | 2983.709 (33) | 335.153 (03) | 5.478 (75) | 5.77 |
| Peak | S/N | |||
|---|---|---|---|---|
| (Hz) | (s) | (ppt) | ||
| f1 | 2235.669 (27) | 447.293 (55) | 4.975 (57) | 7.10 |
| f2 | 2264.722 (37) | 441.555 (72) | 3.675 (57) | 5.25 |
| f3 | 2401.602 (21) | 416.389 (37) | 6.447 (57) | 9.21 |
| f4 | 2403.783 (44) | 416.011 (77) | 3.105 (57) | 4.43 |
| f5 | 2437.256 (38) | 410.298 (64) | 3.578 (57) | 5.11 |
| f6 | 2472.863 (09) | 404.390 (15) | 15.119 (57) | 21.59 |
| f7 | 2836.338 (11) | 352.567 (13) | 12.856 (57) | 18.36 |
5 Asteroseismology
5.1 Spectroscopic mass
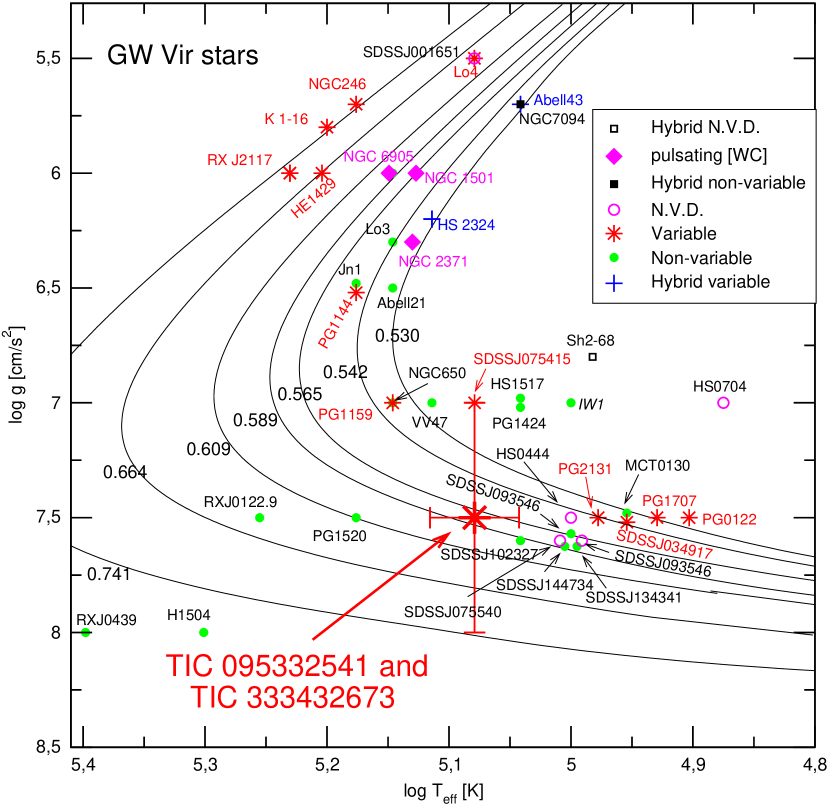
For the asteroseismological analysis of this work, we employ the set of state-of-the-art evolutionary models of PG 1159 stars of Althaus et al. (2005) and Miller Bertolami & Althaus (2006); Miller Bertolami & Althaus (2007a, b). In those works, a set of post-AGB evolutionary sequences computed with the LPCODE evolutionary code (Althaus et al. 2005) were followed through the very late thermal pulse (VLTP) and the resulting born-again episode that give rise to the H-deficient, He-, C- and O-rich composition characteristic of PG 1159 stars. The masses of the resulting remnant models are , , , , , , and . In Fig. 5 we show the evolutionary tracks of PG 1159 stars in the vs. plane. In Table 5 we show the values of the stellar mass, the mass of the envelope, and the surface chemical abundances by mass of 4He, 12C, and 16O for the evolutionary sequences employed in this study. is defined as the mass external to the location of the O/C/He chemical transition region. Since this chemical transition has a finite width (see Fig. 10), we consider the location of the interface as the point at which the He abundance has reduced to half of its surface abundance. We note that, in this work, element diffusion was neglected. This is motivated by theoretical expectations that residual weak winds and radiative acceleration retard the gravitational settling of He until the surface gravity reaches a value between and (see Unglaub & Bues 2000). For a PG 1159 model, this occurs by K. At higher , the abundances of CNO elements remain nearly unchanged.
We emphasise the need of evolutionary models derived from the full computation of the late thermal pulse to perform seismological studies of PG 1159 stars. Such models provide realistic predictions of the internal chemical stratification and a correct assessment of the evolutionary time scales during the PG 1159 regime, where He shell burning is the main source of energy. The set of PG 1159 sequences we use in this work reproduces the spread in surface chemical composition observed in PG 1159 stars, the short born-again time of post born again objects, and the location of the GW Vir instability strip, see Córsico et al. (2006); Althaus et al. (2010). During the very late thermal pulse, an outward-growing convection zone driven by the He-burning shell develops and reaches the H-rich envelope. As a result, most of the H content of the remnant is violently burned in the He-flash convection zone. After this short-lived evolutionary stage, during which the remnant returns from the hot white dwarf stage to the red giant state, evolution proceeds to the domain of PG 1159 stars with a H-deficient surface composition rich in He, C and O. The interplay between mixing and burning during the late thermal pulse creates large quantities of 13C and 14N. The role of such isotopes is by no means negligible since during the PG 1159 regime, captures by 13C affect the shape of the O profile at the base of the He, C, O envelope (see Fig. 10).
| (cgs) | |||||
|---|---|---|---|---|---|
| 0.530 | 6.120 | 0.33 | 0.39 | 0.17 | |
| 0.542 | 5.944 | 0.28 | 0.41 | 0.21 | |
| 0.565 | 5.853 | 0.39 | 0.27 | 0.22 | |
| 0.589 | 5.780 | 0.31 | 0.38 | 0.23 | |
| 0.609 | 5.677 | 0.50 | 0.35 | 0.10 | |
| 0.664 | 5.541 | 0.47 | 0.33 | 0.13 | |
| 0.741 | 5.417 | 0.48 | 0.34 | 0.14 |
On the basis of the evolutionary tracks and the values of the spectroscopic surface gravity and effective temperature of TIC 333432673 and TIC 095332541, we derive by interpolation a value of the spectroscopic mass. We obtain a stellar mass of for both GW Vir stars. The large uncertainties of the spectroscopic mass come mainly from the uncertainties in the surface gravity.
5.2 Mean period spacing of TIC 333432673
In the asymptotic limit of stellar pulsations, i.e., for large radial orders (), modes of consecutive radial order in WDs and pre-WDs are approximately uniformly spaced in period (Tassoul et al. 1990). The asymptotic period spacing is given by , being a constant defined as , where is the Brunt-Väisälä frequency (see, e.g., Unno et al. 1989, for its definition). This asymptotic formula constitutes a very precise description of the pulsational properties of chemically homogeneous stellar models. However, the -mode period spacings in chemically stratified PG 1159 stars show appreciable departures from uniformity caused by the mechanical resonance called ”mode trapping” (Kawaler & Bradley 1994). The observed average period spacing of GW Vir stars primarily depends on the stellar mass and the effective temperature (Kawaler & Bradley 1994). It allows us to estimate by fixing . Specifically, a way to derive an estimate of the stellar mass is by comparing the observed average period spacing () of the target star with the asymptotic period spacing () computed at the effective temperature of the star (see the pioneer works of Kawaler 1987, 1988). Since GW Vir stars generally do not have all of their pulsation modes in the asymptotic regime, there is usually no perfect agreement between and . A variation of this approach is to compare with the average of the computed period spacings (), instead the asymptotic period spacing.
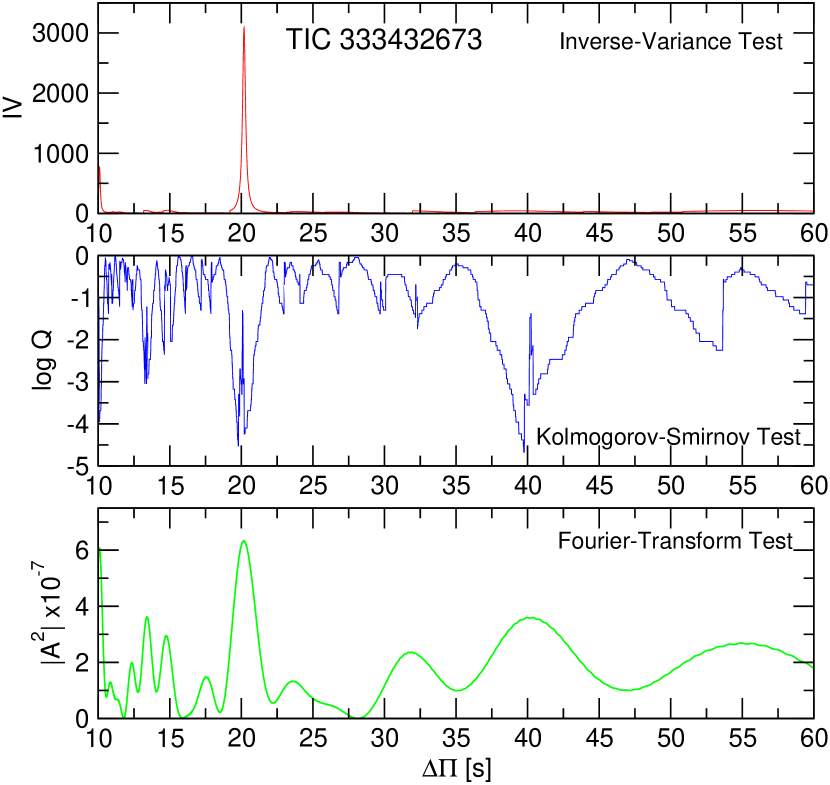
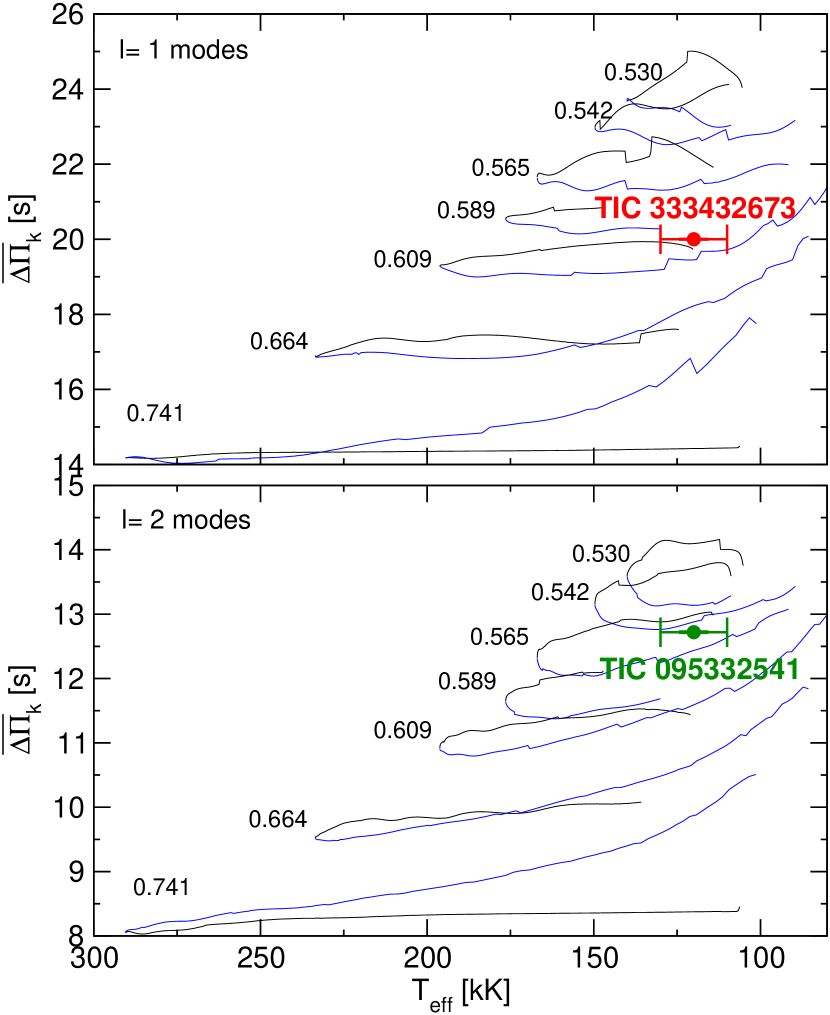
We searched for a constant period spacing in the data of the new GW Vir stars using the Kolmogorov-Smirnov (K-S; Kawaler 1988), the inverse variance (I-V; O’Donoghue 1994), and the Fourier Transform (F-T; Handler et al. 1997) significance tests. In Fig. 6 we show the results of applying these tests to the set of 6 periods of TIC 333432673 (Table 3). A very strong signature of a period spacing of s is evident according to the three tests. There is also an indication of a possible period spacing of s according to the K-S and F-T tests, although it is completely absent in the I-V test. In Fig. 7 we show the dipole (, upper panel) and quadrupole (, lower panel) average of the computed period spacings, , assessed in a range of periods that includes the periods observed in TIC 095332541 and TIC 333432673 ( s), shown as curves for different stellar masses. The -mode adiabatic pulsation periods employed to assess were computed with the LP-PUL pulsation code (Córsico & Althaus 2006). We can safely discard a period spacing of s due to the fact that if such a long period spacing were real, TIC 333432673 should have an extremely low mass, irreconcilable with the spectroscopic mass. Thus, we can assume that the mean period spacing of s is robust and reliable for this star. It can be associated with a sequence of modes444If they were , then the stellar mass of TIC 333432673 would be extremely low (see lower panel of Fig. 7), and thus, incompatible with the spectroscopic mass.. An period spacing, if present, should have a value s. Given the absence of a period spacing of this value in the three statistical tests, we conclude that there is no period spacing corresponding to modes with in the observed pulsational spectrum of TIC 333432673. We compared the period spacing of s with the in terms of for all the masses considered in the upper panel of Fig. 7. The resulting mass value is or if the star is before or after the evolutionary knee, respectively. These values are in good agreement with the spectroscopic mass value ().
5.3 Period-to-period fits for TIC 333432673
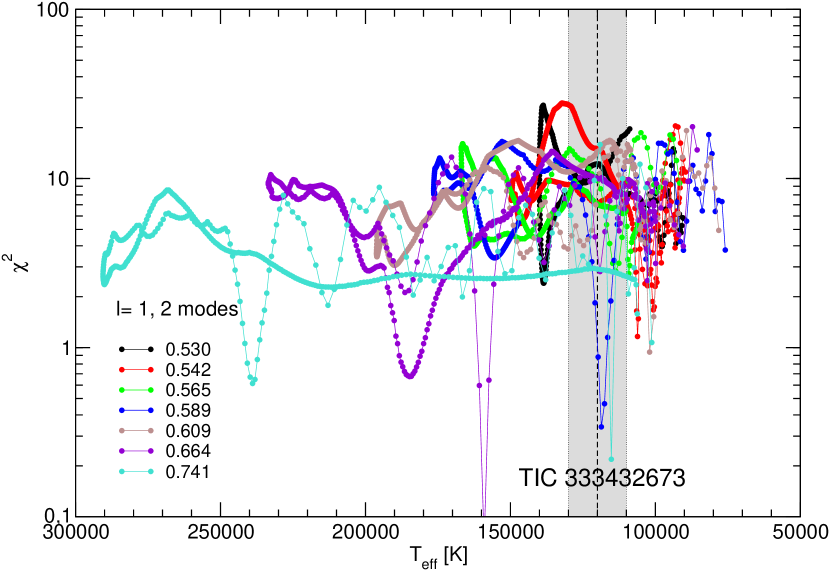
A powerful asteroseismological tool to disentangle the internal structure of GW Vir stars is to seek theoretical models that best match the individual pulsation periods of the target stars. To measure the goodness of the match between the theoretical pulsation periods () and the observed individual periods (), we assess the merit function (see, for instance, Córsico et al. 2021). Here, is the number of observed periods. In order to find the stellar model that best replicates the observed periods exhibited by each target star — the “asteroseismological” model — we evaluate the function for stellar masses between and and effective temperatures in the range K, with K. For each target star, the PG 1159 model that shows the lowest value of is adopted as the best-fit asteroseismological model.
| (s) | (s) | (s) | ( s/s) | |||
|---|---|---|---|---|---|---|
| 335.153 | 1 | 335.306 | 1 | 14 | 6.006 | |
| 374.933 | 1 | 374.215 | 1 | 16 | 6.763 | |
| 394.579 | 1 | 396.035 | 1 | 17 | 5.165 | |
| 455.621 | 1 | 455.941 | 1 | 20 | 5.632 | |
| 496.181 | 1 | 496.467 | 1 | 22 | 8.181 |
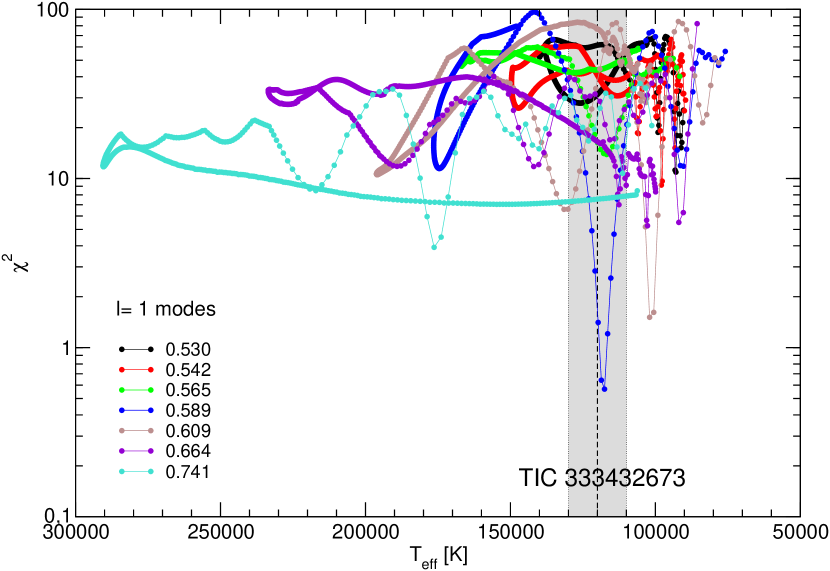
The period-to-period fits for TIC 333432673 lead us to an excellent seismological solution for this star. The quality function versus the effective temperature for the different stellar masses corresponding to the case in which we assume that all the observed periods correspond to modes is shown in Fig. 8. We note that, among the periods 496.181 s and 496.689 s555These two very close periods could be part of a rotational frequency triplet; see at the end of Sect. 4, we have retained only the largest amplitude one, that is, 496.181 s. So, we employ a set of 5 observed periods in our period fits (first column in Table 6). It is noteworthy the existence of a very clear minima of the quality function ( s2) corresponding to an asteroseismological model characterized by an effective temperature of K, very close to the spectroscopic effective temperature of TIC 333432673 and well within its uncertainties ( K). The stellar mass of this model is , in perfect agreement with the mass derived with the period spacing, , and the spectroscopic mass value, .
We have also performed period fits assuming the situation in which the 5 observed periods are a mix of and periods, i.e., we compare the observed periods with dipole and quadrupole theoretical periods. In this case, which is illustrated in Fig. 9, we find two possible solutions compatible with the spectroscopic effective temperature, one of them characterized by K, , and s2 and the other one characterized by K, and s2. In addition, a very strong minimum of is found for a model with K, and s2, but we have to discard this model as a possible solution since it is too hot and incompatible with the range of possible effective temperatures given by spectroscopy.
In summary, we face the problem of choosing an asteroseismological model among three possible solutions. In Section 5.2 we found that the periods of TIC 333432673 make up an equispaced pattern with a period separation of s corresponding to dipole modes. This finding constitutes a strong constraint on the assignment of the value of the modes, that is, it indicates that the identification of all the observed periods with modes is robust. In Córsico et al. (2021) we have employed this constraint to assign the value of the periods of a set of GW Vir stars observed with TESS. Using that constraint for TIC 333432673, we safely retain the solution characterized by K and , in which all modes are dipole modes, as the asteroseismological model for this star. Note that this solution is very close to one of the possible solutions obtained when we assume a possible mixture of and modes in the observed spectrum of TIC 333432673 ( K and ).
In Table 6 we show a detailed comparison of the observed periods of TIC 333432673 and the theoretical periods of the asteroseismological model. According to our asteroseismological model, all the periods exhibited by the star correspond to modes with high radial order . We compute the average of the absolute period differences, , where and , and the root-mean-square residual, . We compute also the Bayes Information Criterion (BIC; Koen & Laney 2000), , where is the number of free parameters of the models, and is the number of fitted periods. The smaller the value of BIC, the better the quality of the fit. In our case, (stellar mass and effective temperature), and . We obtain s, s, and , which means that our period fit is excellent, although admittedly, the differences between theoretical and observed periods is larger than the uncertainties in the measured periods.
We also include in Table 6 the rates of period change () predicted for each mode of TIC 333432673. Note that all of them are positive (), implying that the periods are lengthening over time. The rate of change of periods in WDs and pre-WDs is related to ( being the temperature at the region of the period formation) and ( being the stellar radius) through the order-of-magnitude expression (Winget et al. 1983). According to our asteroseismological model, the star is cooling at almost constant radius after reaching its maximum temperature (evolutionary knee), i.e., TIC 333432673 is in its cooling stage. As a consequence, and , and then, . Continuous monitoring of this star could in the future make it possible to measure rates of period change for comparison with our theoretical predictions, if the pulsations are shown to be otherwise coherent over the span of observations.
| Quantity | Spectroscopy | Asteroseismology |
|---|---|---|
| Astrometry | ||
| [kK] | ||
| [] | ||
| [cm/s2] | ||
| 0.75, 0.25, | 0.30, 0.38, 0.23 | |
| [pc] | ||
| [mas] |
References: (a) Gaia DR3.
In Table 7, we list the spectroscopic and astrometric parameters of TIC 333432673 and the main characteristics of the asteroseismological model found in this work. The seismological stellar mass is in excellent agreement with the value derived from the period spacing () and the spectroscopic mass. The average of the dipole () period spacings of our asteroseismological model is s, in excellent agreement with the mean period spacing derived for TIC 333432673, s.
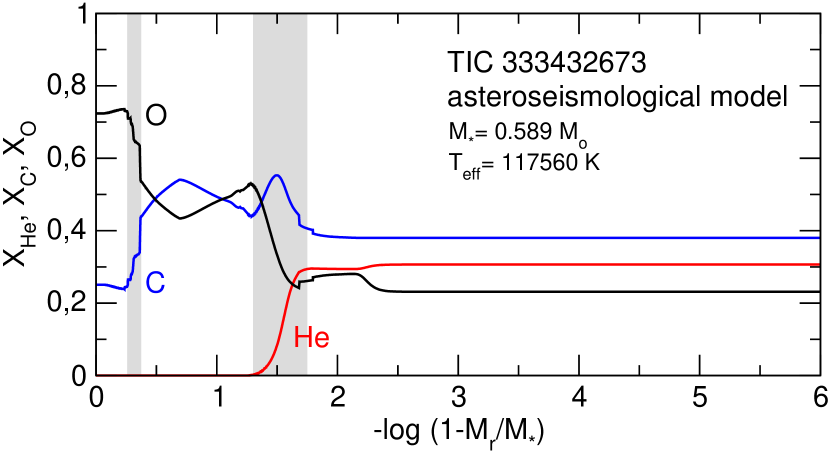
In Fig. 10 we show the fractional abundances of the main chemical species, 4He, 12C, and 16O, corresponding to our asteroseismological model with and K. The chemical transition regions of O/C and O/C/He are clearly visible. The location, thickness, and steepness of these chemical interfaces define the mode-trapping properties of the models. (see, e.g., Córsico & Althaus 2005, 2006, for details).
5.4 The asteroseismological distance of TIC 333432673
We can assess the asteroseismological distance on the basis of the luminosity of the asteroseismological model []. Using a bolometric correction , interpolated from the values corresponding to PG 1159035 ( K, ), RX J2117+3142 ( K, ), and PG 2131+066 ( K, ), as given by Kawaler & Bradley (1994), Córsico et al. (2007), and Kawaler et al. (1995), respectively, the visual absolute magnitude can be assessed as , where . We employ the solar bolometric magnitude (Cox 2000). The seismological distance is derived from the relation: , where we employ the 3D reddening map of Lallement et al. (2014) (see also Capitanio et al. 2017; Lallement et al. 2018)666https://stilism.obspm.fr/ to infer and then the interstellar absorption , which is a nonlinear function of the distance and also depends on the Galactic latitude () and longitude (). For the equatorial coordinates of TIC 333432673 (Epoch B2000.00, ) the corresponding Galactic latitude is and . We use the apparent visual magnitude (TESS catalog), and obtain iteratively the seismological distance, pc, parallax mas, and extinction coefficient . The large uncertainty in the seismological distance comes mainly from the large uncertainty in the luminosity of the asteroseismological model and in the reddening coefficient . A very important check for the validation of the asteroseismological model of TIC 333432673 is the comparison of the seismological distance with the distance derived from astrometry. We have available the estimates from Gaia EDR3 (Gaia Collaboration et al. 2021), pc and mas. They are in excellent agreement with the asteroseismological derivations in view of the uncertainties in both determinations. This adds confidence to the correctness of the asteroseismological model.
5.5 Mean period spacing of TIC 095332541
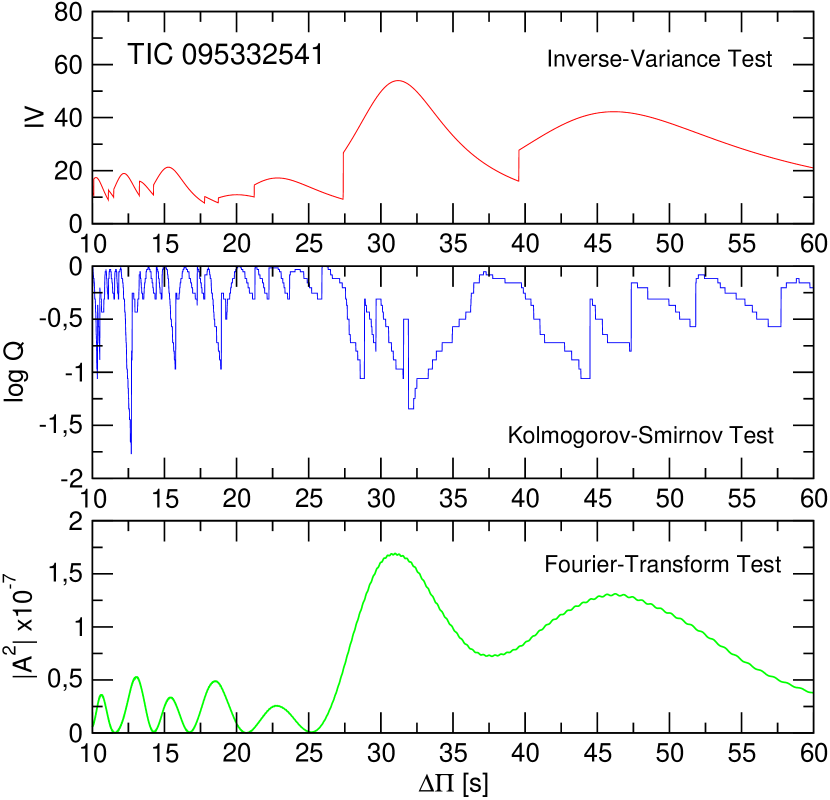
In Fig. 11 we show the results of applying the significance tests to the set of 7 periods of TIC 095332541 (Table 4). The three tests point to the existence of a probable constant period spacing of s. If we want to guess what the stellar mass corresponding to this period spacing would be by comparing it with the average of the computed period spacings, we realize that we cannot draw the location of TIC 095332541 in the diagrams of Fig. 7. A period spacing as long as s for TIC 095332541 does not make physical sense, since it would be compatible with a star with unusually low mass (much below ), in strong conflict with the spectroscopic mass. Therefore, this possible period spacing has to be disregarded. For the same reason, we also rule out a possible period spacing of s that can be seen in Fig. 11. A third possible constant period separation is s, as suggested by the K-S test. Such a short period spacing could make any sense only if all the modes exhibited are quadrupole () modes. In this case, the stellar mass would be (see lower panel of Fig. 7). However, since this possible period-spacing signature is only suggested by one of the significance tests, we cannot take it as true, and we are forced to discard it. We conclude that it is not possible to find a realistic period spacing for TIC 095332541 with this data set of only 7 detected periods.
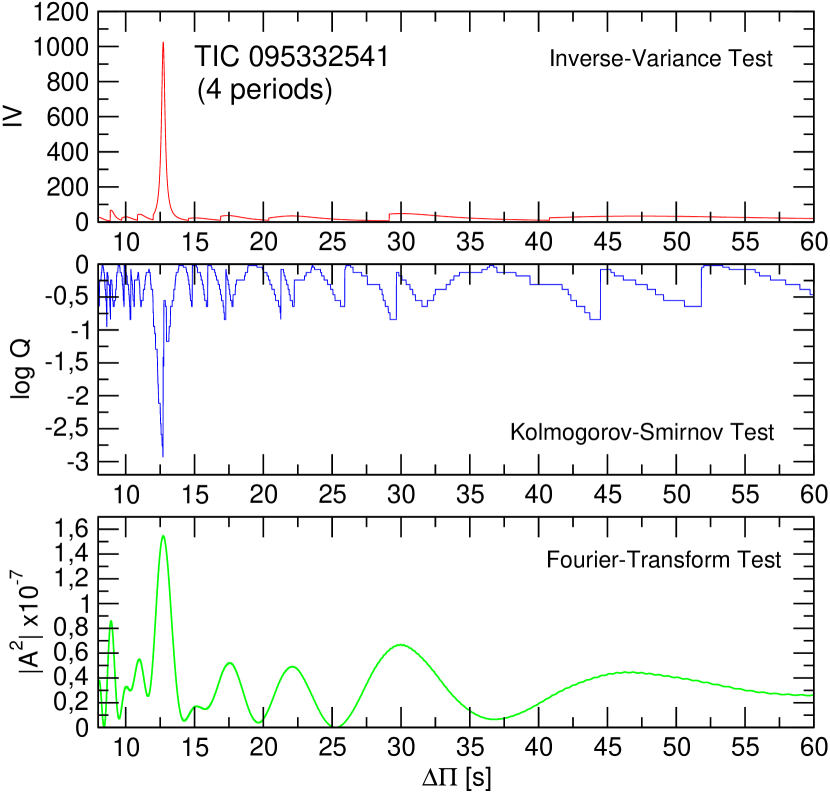
We have sought an alternative interpretation of the period spectrum of TIC 095332541 in which we consider subsets of periods when looking for patterns of period spacing. In particular, if we consider the subset of 4 periods 352.567 s, 404.390 s, 416.389 s, and 441.555 s, we find what is plotted in Fig. 12, where we show the statistical tests considering this reduced set of periods. The existence of a period spacing of around s is evident according the three significance tests. Averaging the results between the three tests, we find s. A period spacing of s can be due to that the four periods considered are associated to modes, which implies a stellar mass in the range (see lower panel of Fig. 7). The remainder periods (410.298 s, and 447.293777The period at 416.011 s is very similar to the period at 416.389 s, and could be a component of a rotational multiplet or a single mode with . We do not consider it in the computation of the period spacing nor in our period fits; see the next section.) could be modes affected by mode trapping, or, alternatively, modes. The absence of a dipole period spacing at sec (according to the asymptotic theory) and the simultaneous presence of a quadrupole period spacing at s is hard to explain, because modes with should have higher observable amplitudes when compared with modes to due to geometric cancellation effects (Dziembowski 1977). However, it might be possible that some modes, and the associated period spacing, are not driven to observable amplitudes for some reason; for instance, it might be that modes are not excited at the effective temperature and gravity of this star but modes are unstable.
The other possibility in the interpretation of the period spacing of s of TIC 095332541 is that it is due to modes. In this case, however, the stellar mass should be unusually large for the standards of PG 1159 stars (; see upper panel of Fig. 7), and in serious conflict with the spectroscopic mass (), or mode trapping is severe.
We conclude that the period spacing s is most probably associated to quadrupole modes and that the stellar mass derived on the basis of this period spacing is . This constraint in the value of of the four periods at 352.567 s, 404.390 s, 416.389 s, and 441.555 s will be used in the next section when performing period fits to TIC 095332541.
5.6 Period-to-period fits for TIC 095332541
We have also performed period fits for the new GW Vir star TIC 095332541. We started by examining the case in which we consider the 7 detected periods of this star according to Table 4. Unfortunately, our period-to-period fits for this star, either considering all modes as , as , or as a mixture of and , do not allow us to find a clear seismological solution, that is, a single minima of the function distinguishable from a crowd of similar minima associated to different effective temperatures and stellar masses. Therefore, we cannot find an asteroseismological model for this star in this case.
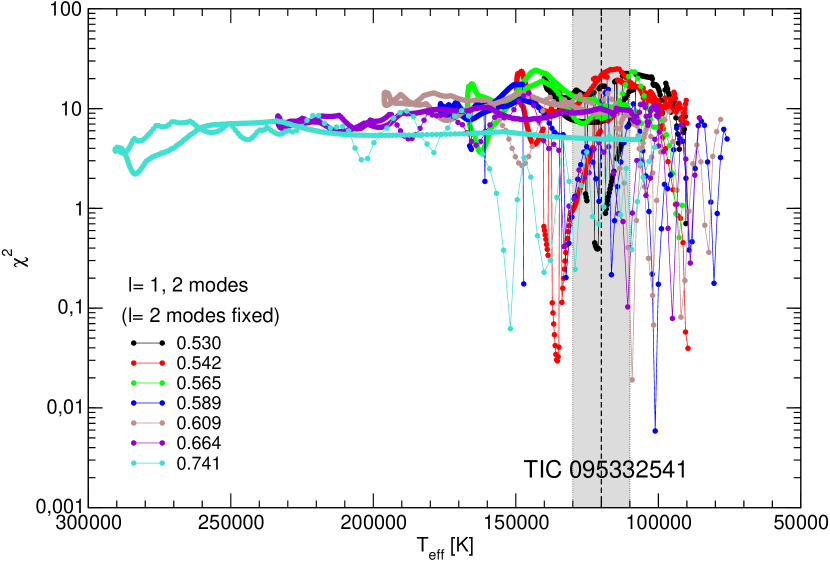
We also carried out period fits for this star following the results obtained in Sect. 5.5. That is, we assumed that a subset of 4 periods are associated with modes, and left the assignment as or free to the remaining two periods. Specifically, we set the ”observed” value for the periods at 352.567 s, 404.390 s, 416.389 s, and 441.555 s, and we assume that the periods at 410.298 s and 447.293 s can be either or . The quality function versus the effective temperature for the different stellar masses is depicted in Fig. 13. Unfortunately, there is no single and clear solution in the range of effective temperature of the star, so, neither in this case we are able to choose any asteroseismological model for TIC 095332541.
Since we have not available an asteroseismological model for TIC 095332541, we lack the luminosity of the star, and that prevents us from assessing its seismological distance. More observations are needed.
6 Summary and conclusions
In this paper, we have presented the discovery of two new GW Vir stars, TIC 333432673 and TIC 095332541. We have derived atmospheric parameters for both stars by fitting synthetic spectra to the newly obtained low to intermediate resolution SOAR/GOODMAN for TIC 333432673 and INT/IDS for TIC 095332541 spectra. The determined atmospheric parameters show that TIC 333432673 and TIC 095332541 are identical in terms of surface temperature and surface gravity ( K and ) and they are only different regarding the surface C and He abundance.
We investigate the potential variability of the two new PG 1159 stars by examining their short and ultra-short-cadence single-sector observations obtained with TESS. Our frequency analysis reveals six significant independent oscillation frequencies for TIC 333432673 and seven for TIC 095332541, which we associate with -modes. The periodicities detected in these two PG 1159 stars are compatible with the period spectrum typically exhibited by GW Vir stars. TIC 333432673 exhibits a possible contamination by other sources in the TESS aperture within a magnitude limit of . We examined the target pixel files of TIC 333432673 in order to verify the frequencies that are originated by the PG 1159. We found that the location of the 4 frequencies (S/N 5) is most consistent with the position of TIC 333432673. TIC 333432673 is a great target for ground-based time-series photometry in order to confirm TESS signals. Furthermore, TIC 333432673 and TIC 095332541 are excellent targets for the future ground-based photometric monitoring in order to possibly measure rates of period change and compare it to the theoretical predictions.
We have carried out an asteroseismological investigation on both GW Vir stars employing fully evolutionary models of PG 1159 stars. For TIC 095332541 we have been able to find a possible constant period spacing, and therefore it was possible to estimate a stellar mass in the range based on that quantity. Unfortunately, we did not find an asteroseismological model for this star, which prevented us from estimating its structural parameters and its seismological distance. For TIC 333432673 we have been able to find a very clear constant period spacing that leads to a stellar mass in very good agreement with the spectroscopic mass. Also for this star, we were able to find an asteroseismological model whose mass is in excellent agreement with the spectroscopic mass, and the derived seismological distance is in concordance with the distance estimated by Gaia for this star.
In this paper, we have discovered and characterized two new GW Vir stars using the high-quality data collected by the TESS space mission and follow-up spectroscopy. So far, the TESS mission has met the expectations of researchers both in the goal of finding new planetary systems, and in terms of new findings in the area of stellar seismology. We are confident that this mission will continue to provide exciting new discoveries in the field of pulsating WD and pre-WD asteroseismology.
Acknowledgements.
We wish to acknowledge the suggestions and comments of an anonymous referee that strongly improved the original version of this work. M.U. acknowledges financial support from CONICYT Doctorado Nacional in the form of grant number No: 21190886 and ESO studentship program. SOK is supported by CNPq-Brazil, CAPES-Brazil and FAPERGS-Brazil. K.J.B. is supported by the National Science Foundation under Award AST-1903828. This paper includes data collected with the TESS mission, obtained from the MAST data archive at the Space Telescope Science Institute (STScI). Funding for the TESS mission is provided by the NASA Explorer Program. STScI is operated by the Association of Universities for Research in Astronomy, Inc., under NASA con-tract NAS 5–26555. Part of this work was supported by AGENCIA through the Programa de Modernización Tecnológica BID 1728/OC-AR, and by the PIP 112-200801-00940 grant from CONICET. This research has made use of NASA’s Astrophysics Data System. Financial support from the National Science Centre under projects No. UMO-2017/26/E/ST9/00703 and UMO-2017/25/B/ST9/02218 is appreciated.References
- Aller et al. (2020) Aller, A., Lillo-Box, J., Jones, D., Miranda, L. F., & Barceló Forteza, S. 2020, A&A, 635, A128
- Althaus et al. (2010) Althaus, L. G., Córsico, A. H., Isern, J., & García-Berro, E. 2010, A&A Rev., 18, 471
- Althaus et al. (2005) Althaus, L. G., Serenelli, A. M., Panei, J. A., et al. 2005, A&A, 435, 631
- Bailer-Jones et al. (2021) Bailer-Jones, C. A. L., Rybizki, J., Fouesneau, M., Demleitner, M., & Andrae, R. 2021, VizieR Online Data Catalog, I/352
- Bell et al. (2019) Bell, K. J., Córsico, A. H., Bischoff-Kim, A., et al. 2019, A&A, 632, A42
- Bell et al. (2015) Bell, K. J., Hermes, J. J., Bischoff-Kim, A., et al. 2015, The Astrophysical Journal, 809, 14
- Bell et al. (2017) Bell, K. J., Hermes, J. J., Vanderbosch, Z., et al. 2017, ApJ, 851, 24
- Blöcker (2001) Blöcker, T. 2001, Ap&SS, 275, 1
- Bognár et al. (2021) Bognár, Z., Kalup, C., & Sódor, Á. 2021, arXiv e-prints, arXiv:2103.17192
- Bognár et al. (2020) Bognár, Z., Kawaler, S. D., Bell, K. J., et al. 2020, A&A, 638, A82
- Borucki et al. (2010) Borucki, W. J., Koch, D., Basri, G., et al. 2010, Science, 327, 977
- Capitanio et al. (2017) Capitanio, L., Lallement, R., Vergely, J. L., Elyajouri, M., & Monreal-Ibero, A. 2017, A&A, 606, A65
- Clemens et al. (2004) Clemens, J. C., Crain, J. A., & Anderson, R. 2004, in Society of Photo-Optical Instrumentation Engineers (SPIE) Conference Series, Vol. 5492, Ground-based Instrumentation for Astronomy, ed. A. F. M. Moorwood & M. Iye, 331–340
- Córsico (2020) Córsico, A. H. 2020, Frontiers in Astronomy and Space Sciences, 7, 47
- Córsico & Althaus (2005) Córsico, A. H. & Althaus, L. G. 2005, A&A, 439, L31
- Córsico & Althaus (2006) Córsico, A. H. & Althaus, L. G. 2006, A&A, 454, 863
- Córsico et al. (2006) Córsico, A. H., Althaus, L. G., & Miller Bertolami, M. M. 2006, A&A, 458, 259
- Córsico et al. (2019) Córsico, A. H., Althaus, L. G., Miller Bertolami, M. M., & Kepler, S. O. 2019, A&A Rev., 27, 7
- Córsico et al. (2007) Córsico, A. H., Althaus, L. G., Miller Bertolami, M. M., & Werner, K. 2007, A&A, 461, 1095
- Córsico et al. (2021) Córsico, A. H., Uzundag, M., Kepler, S. O., et al. 2021, A&A, 645, A117
- Costa et al. (2008) Costa, J. E. S., Kepler, S. O., Winget, D. E., et al. 2008, A&A, 477, 627
- Cox (2000) Cox, A. N. 2000, Allen’s astrophysical quantities
- Dziembowski (1977) Dziembowski, W. 1977, Acta Astron., 27, 203
- Gaia Collaboration et al. (2021) Gaia Collaboration, Brown, A. G. A., Vallenari, A., et al. 2021, A&A, 650, C3
- Gautschy (1997) Gautschy, A. 1997, A&A, 320, 811
- Gautschy et al. (2005) Gautschy, A., Althaus, L. G., & Saio, H. 2005, A&A, 438, 1013
- Gentile Fusillo et al. (2019) Gentile Fusillo, N. P., Tremblay, P.-E., Gänsicke, B. T., et al. 2019, MNRAS, 482, 4570
- Greiss et al. (2014) Greiss, S., Gänsicke, B. T., Hermes, J. J., et al. 2014, MNRAS, 438, 3086
- Handler et al. (1997) Handler, G., Pikall, H., O’Donoghue, D., et al. 1997, MNRAS, 286, 303
- Hermes et al. (2014) Hermes, J. J., Charpinet, S., Barclay, T., et al. 2014, ApJ, 789, 85
- Hermes et al. (2017a) Hermes, J. J., Gänsicke, B. T., Kawaler, S. D., et al. 2017a, ApJS, 232, 23
- Hermes et al. (2017b) Hermes, J. J., Kawaler, S. D., Bischoff-Kim, A., et al. 2017b, ApJ, 835, 277
- Herwig (2001) Herwig, F. 2001, ApJ, 554, L71
- Hong et al. (2021) Hong, K., Lee, J. W., Koo, J.-R., et al. 2021, AJ, 161, 137
- Howell et al. (2014) Howell, S. B., Sobeck, C., Haas, M., et al. 2014, PASP, 126, 398
- Jenkins et al. (2016) Jenkins, J. M., Twicken, J. D., McCauliff, S., et al. 2016, in Proc. SPIE, Vol. 9913, Software and Cyberinfrastructure for Astronomy IV, 99133E
- Kawaler (1987) Kawaler, S. D. 1987, in IAU Colloq. 95: Second Conference on Faint Blue Stars, ed. A. G. D. Philip, D. S. Hayes, & J. W. Liebert, 297–307
- Kawaler (1988) Kawaler, S. D. 1988, in IAU Symposium, Vol. 123, Advances in Helio- and Asteroseismology, ed. J. Christensen-Dalsgaard & S. Frandsen, 329
- Kawaler & Bradley (1994) Kawaler, S. D. & Bradley, P. A. 1994, ApJ, 427, 415
- Kawaler et al. (1995) Kawaler, S. D., O’Brien, M. S., Clemens, J. C., et al. 1995, ApJ, 450, 350
- Koen & Laney (2000) Koen, C. & Laney, D. 2000, MNRAS, 311, 636
- Lallement et al. (2018) Lallement, R., Capitanio, L., Ruiz-Dern, L., et al. 2018, A&A, 616, A132
- Lallement et al. (2014) Lallement, R., Vergely, J. L., Valette, B., et al. 2014, A&A, 561, A91
- Lightkurve Collaboration et al. (2018) Lightkurve Collaboration, Cardoso, J. V. d. M. a., Hedges, C., et al. 2018, Lightkurve: Kepler and TESS time series analysis in Python
- McGraw et al. (1979) McGraw, J. T., Starrfield, S. G., Liebert, J., & Green, R. 1979, in IAU Colloq. 53: White Dwarfs and Variable Degenerate Stars, ed. H. M. van Horn, V. Weidemann, & M. P. Savedoff, 377–381
- Miller Bertolami & Althaus (2006) Miller Bertolami, M. M. & Althaus, L. G. 2006, A&A, 454, 845
- Miller Bertolami & Althaus (2007a) Miller Bertolami, M. M. & Althaus, L. G. 2007a, A&A, 470, 675
- Miller Bertolami & Althaus (2007b) Miller Bertolami, M. M. & Althaus, L. G. 2007b, MNRAS, 380, 763
- Miller Bertolami et al. (2006) Miller Bertolami, M. M., Althaus, L. G., Serenelli, A. M., & Panei, J. A. 2006, A&A, 449, 313
- O’Donoghue (1994) O’Donoghue, D. 1994, MNRAS, 270, 222
- Østensen et al. (2011) Østensen, R. H., Bloemen, S., Vučković, M., et al. 2011, ApJ, 736, L39
- Pych (2004) Pych, W. 2004, PASP, 116, 148
- Quirion et al. (2007) Quirion, P. O., Fontaine, G., & Brassard, P. 2007, ApJS, 171, 219
- Ricker et al. (2015) Ricker, G. R., Winn, J. N., Vanderspek, R., et al. 2015, Journal of Astronomical Telescopes, Instruments, and Systems, 1, 014003
- Saio (1996) Saio, H. 1996, in Astronomical Society of the Pacific Conference Series, Vol. 96, Hydrogen Deficient Stars, ed. C. S. Jeffery & U. Heber, 361
- Sowicka et al. (2021) Sowicka, P., Handler, G., Jones, D., & van Wyk, F. 2021, arXiv e-prints, arXiv:2108.08167
- Stanghellini et al. (1991) Stanghellini, L., Cox, A. N., & Starrfield, S. 1991, ApJ, 383, 766
- Starrfield et al. (1984) Starrfield, S., Cox, A. N., Kidman, R. B., & Pesnell, W. D. 1984, ApJ, 281, 800
- Starrfield et al. (1983) Starrfield, S. G., Cox, A. N., Hodson, S. W., & Pesnell, W. D. 1983, ApJ, 268, L27
- Tassoul et al. (1990) Tassoul, M., Fontaine, G., & Winget, D. E. 1990, ApJs, 72, 335
- Unglaub & Bues (2000) Unglaub, K. & Bues, I. 2000, A&A, 359, 1042
- Unno et al. (1989) Unno, W., Osaki, Y., Ando, H., Saio, H., & Shibahashi, H. 1989, Nonradial oscillations of stars
- Wang et al. (2020) Wang, K., Zhang, X., & Dai, M. 2020, ApJ, 888, 49
- Werner & Herwig (2006) Werner, K. & Herwig, F. 2006, PASP, 118, 183
- Werner et al. (2014) Werner, K., Rauch, T., & Kepler, S. O. 2014, A&A, 564, A53
- Winget et al. (1983) Winget, D. E., Hansen, C. J., & van Horn, H. M. 1983, Nature, 303, 781
- Winget & Kepler (2008) Winget, D. E. & Kepler, S. O. 2008, ARA&A, 46, 157
- Winget et al. (1991) Winget, D. E., Nather, R. E., Clemens, J. C., et al. 1991, ApJ, 378, 326