Revealing magnetoelectric coupling effect in polar antiferromagnet Fe2Mo3O8 by static and time resolved second harmonic generation
Abstract
We present both static and time-resolved second harmonic generation (SHG) measurements on polar antiferromagnet Fe2Mo3O8 to monitor the evolution of the electric polarization change and its coupling to magnetic order. We find that only one of the second order tensor elements, ,shows a prominent change below the Neel temperature K, indicating a magnetic order induced electric polarization change along the c-axis. Time-resolved SHG measurement reveals an ultrafast recovery of the second order tensor element upon the ultrashort laser excitation with fluence above 0.3 , yielding evidence for a photoinduced ultrafast phase transition from the AFM ordered state to the paramagnetic state. Our work will help understand the spin induced polarization and the ultrafast optical tuning effect in Fe2Mo3O8.
I Introduction
Multiferroic materials that contain coupled ferroelectricity and magnetism have attracted much attention in condensed matter physics and materials science due to the rich and fascinating physical phenomena and potential application in novel electronic devices. The strong magnetoelectric coupling effect enables the mutual control of the macroscopic magnetization (polarization) with external electric (magnetic) fields Kimura et al. (2003); Tokura (2007); Fiebig et al. (2016). It also provides a platform for ultrafast switching and manipulation of different orders by ultrashort laser pulses. In optical approach, time resolved Kerr rotation and time resolved second harmonic generation (SHG) are two important techniques. Kerr rotation is often used to study the magnetic interaction of ferromagnetic ordered materials Beaurepaire et al. (1996); Kise et al. (2000); Ogasawara et al. (2005a, b). However, directly probing physical effect in antiferromagnetism (AFM) via table-top optical technique is challenging because of the lack of net magnetization. On the other hand, the SHG spectroscopy is very sensitive to the lattice inversion symmetry. It is a powerful tool to study the electric polarization in the crystallographic structure. Besides the strong signal of SHG arising from broken inversion symmetry, the breaking of time-inversion symmetry in magnetic ordered structure may also contribute to SHG. Therefore SHG is often used to investigate noncentrosymmetric AFM and multiferroics Fiebig et al. (2000); Nordlander et al. (2018); Matsubara et al. (2009); Sheu et al. (2018); Cheong (2019).
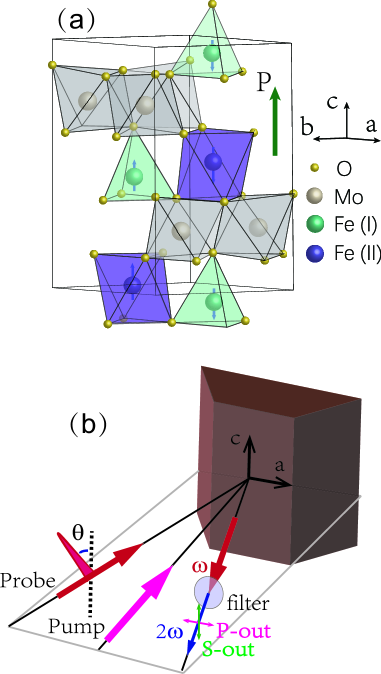
Fe2Mo3O8 is a polar magnet recently under intensive investigations Le Page and Strobel (1982); Wang et al. (2015); Kurumaji et al. (2015); Li et al. (2017); Kurumaji et al. (2017a, b); Li et al. (2017); Yu et al. (2018); Sheu et al. (2019); Wang et al. (2021); Csizi et al. (2020); Reschke et al. (2020); Stanislavchuk et al. (2020). The structure can be viewed as the stacking of honeycomb Fe layers and Kagome Mo layers along the c-axis. The crystal structure of Fe2Mo3O8 is illustrated in Fig. 1 (a). The magnetism is dominated by the partially occupied 3d electrons in Fe ions at two sites, Fe(I) and Fe(II), which are surrounded by tetrahedral and octahedral coordination of oxygen, respectively. The lattice structure is characterized by the space group P63mc with a crystalline polarization pointing along the c-axis. Below = 60 K, the spin moments are ordered along the c-axis. The moments of Fe at two different sites have different magnitudes and opposite directions, which makes the layer ferrimagnetic. Adjacent layers have opponent magnetic moment arrangement, which makes the material antiferromagnetic. Accompanied by the magnetic ordering below , a lattice structure transition occurs. The oxygen atoms shifts along the c-axis, inducing additional electric polarization change along the c-axis. The shift also causes an increase of the Fe-O-Fe angle and the associated in-plane AFM coupling J Wang et al. (2015). Therefore, a strong magnetic-electric coupling effect exists in the material. The ionic shifts as well as the accompanied polarization change is attributed to the exchange striction in the AFM state Wang et al. (2015); Kurumaji et al. (2015). Recently, it was found that, when the compound is pumped by circularly polarized laser pulse, a huge magneto-optical Kerr rotation can be observed Sheu et al. (2019).
In this work, we present both static and time-resolved SHG probe on Fe2Mo3O8. The temperature dependent static SHG measurement reveals a prominent reduction in one of the second order tensor elements, , below the Neel tempreature K, suggesting a magnetic order induced change of electric polarization along the c-axis. Time-resolved SHG measurement indicates an ultrafast recovery of the second order tensor element when the pump fluence exceeds a threshold value in the low temperature AFM state, yielding evidence for a photoinduced ultrafast phase transition from the AFM ordered state to the paramagnetic state. The results provide new information about the electric polarization and its coupling to magnetization in Fe2Mo3O8.
II Experiments
The single crystal of Fe2Mo3O8 was grown by chemical vapor transport method, similar to previous reports Strobel and Page (1983); Strobel et al. (1982); Satoh et al. (2007). The crystal sample is characterised by magnetic susceptibility measurement via physical property measurement system (PPMS, Quantum Design) and time-domain terahertz measurement. A sharp antiferromagnetic phase transition is observed at 60 K, and an electric-active magnon is observed at frequency of 1.25 THz Shi et al. (2020), being the same as the reported measurements Wang et al. (2015); Kurumaji et al. (2017a). Static and time resolved SHG measurement is preformed on the ac-surface of the sample using a standard optical pump-probe system. Pulses from a Ti:sapphire amplifier with 800 nm wavelength, 35 fs duration and 1 kHz repetition are separated into pump and probe beams. The pump light is normally incident to the sample and the probe light is reflected from the sample with a small incident angle, as shown in Fig. 1 (b). The polarization angle of the incident probe laser deviated from the c-axis is controlled by half-wave plate. The SHG signal for either p or s polarization is detected by a photomultiplier tube after filtering out the fundamental photon. In the time resolved SHG measurement, the probe light is kept much weaker than the pump light.
III Static SHG
In magnetic materials, the second order nonlinear polarization can be expressed as , where is the time invariant nonlinear tensor corresponding to the lattice symmetry and is the time noninvariant nonlinear tensor corresponding to magnetic symmetry group, respectivelyFiebig et al. (2005); Matsubara et al. (2009). It should be noticed that while the electric SHG is usually dominant, the magnetic dipole may also contribute SHG signal. However, the magnetic dipole effect is negligible due to the symmetry of Fe2Mo3O8 as we shall explain below.
At high temperature, the space group of Fe2Mo3O8 is P63mc (point group 6mm). The polar symmetry provides nonzero components of the i-type tensor , = , while the c-type tensor is zero and the magnetic dipole effect is forbidden. Below = 60 K, the time inversion symmetry is broken, the space group of Fe2Mo3O8 changes from 6mm to . The c-type tensor of magnetic group has nonzero components = - = - = -. Considering the light is nearly normal incident to the ac plane of the sample, all these components are undetectable. So all the SHG signals we measured in the ac-plane are contributed from the time invariant electric dipole. We also measured the SHG signal in an ab-cut sample. Within our measurement resolution, no observable signal emerges at the magnetic phase transition. The magnetic SHG is negligibly small compared to the electric SHG.
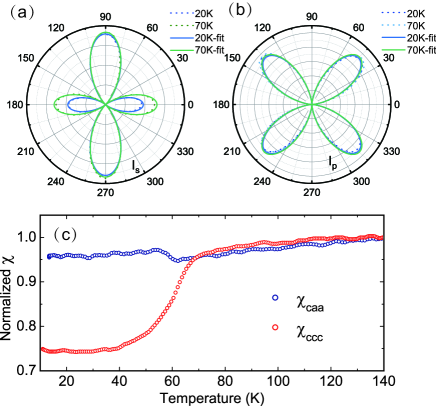
Figure 2 (a) (b) shows the polar angle (the angle of the light polarization rotated from the c-axis) dependent patterns of s-out and p-out SHG signals, measured at 20 K (below ) and 70 K (above ), respectively. The SHG signal is proportional to the nonlinear tensor. The generated SHG intensity can be expressed as and (see the appendix). Indeed, the -dependent polar patterns for both s-out and p-out SHG signals can be well reproduced by the expressions, shown as the lines in Fig.2 (a) and (b). From the fitting to s-out SHG signal as displayed in Fig.2 (a), we find that must have the opposite sign with . The values at =0 and =90∘ are related only to and respectively. Obviously, the absolute value of is larger than . With the temperature drops down to 20 K, a prominent decrease of the SHG is observed in , at the petal around . The other petal of and all the petals of remain unchanged. According to the equation of , the change of the SHG signal is originated from . These results reveal the is sensitive to the phase transition while (or ) is not sensitive.
With the experimental configration setup, we can separately pick up the signals of and . Monitoring the temperature evolution of different tensor elements can help identify their relation to the order parameters. To measure the temperature evolution of , the polarization of the probe light is set to s-in () and s-out (). For comparison, the signal related to is measured by setting of p-in and s-out, and signal related to can be measured by p-out with . The temperature dependence of the is shown in Fig.2 (c). In the paramagnetic state, SHG intensity decreases slightly as temperature is reduced from 140 K due to anharmonic effects of the lattice. The prominent change happened around TN. The intensity from drops sharply by 20 percent, while the SHG signal from shows no significant change. The electric dipole SHG signal is usually considered to be proportional to the electric polarization. Fe2Mo3O8 is supposed to contain a magnetic induced polarization modulation at . The reduction of the SHG signal indicates that the magnetic order induced polarization is negative with the primal lattice polarization. It means that the magnetic ordered state has smaller inversion symmetry broken than the paramagnetic state. Usually, with the decrease of the electric polarization, all the components of the nonlinear tensor are supposed to decrease. However, the experimental results show that only the changes with the polarization. This results may be related to the fact that magnetic order induced polarization change arising from the spin exchange striction effect is along the positive direction of c-axis Wang et al. (2015).
We notice that previous report revealed presence of antiphase magnetic domains of the antiferromagnetic order Kim et al. (2018). Magnetic SHG signal is sensitive to magnetic domain Cheong et al. (2020). We performed measurement on different points of the sample, as well as different samples, and obtained the same result. The intensity of always drops at , independence of magnetic domain. This is consistent with the fact that the signals are all generated from electric dipole effect. The results indicate the magnetism induced polarization is independent of the magnetic antiphase domain.
IV Time - resolved SHG
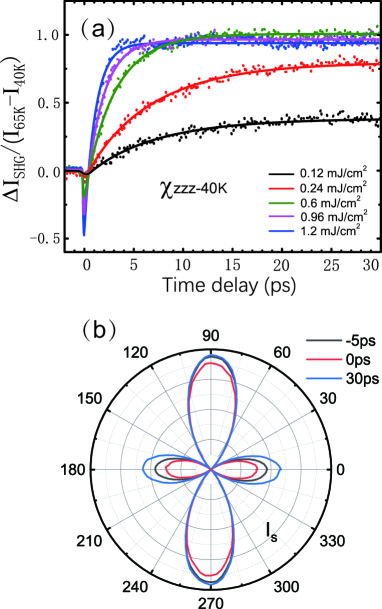
Since only has relation to the magnetic order induced polarization, the time resolved SHG measurement is mainly performed on this tensor element. With excitation by 800 nm femtosecond laser pulse, we observed a significant change of the SHG signal in picosecond time scale. Figure 3 (a) shows the time evolution of the pump induced transient SHG signal of , measured at 40 K with different pump fluences. The time trace of SHG contains two main features, a sharp decrease followed by a fast relaxation, and a slower rise to a plateau. The first feature is observed for all the nonlinear tensors, while the second feature is only observed for . We will discuss later that these two features are related to the excitation of electrons and suppression of spin order, respectively. To quantitatively extract the time scales of different processes, we fit the transient SHG by following expression,
| (1) |
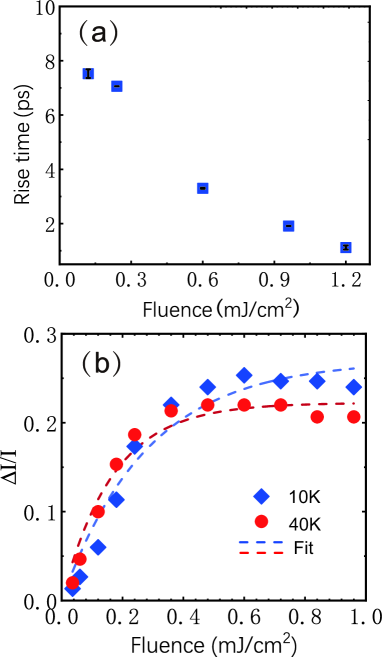
where is the Heaviside step with 35 fs rise time, and are the magnitude of changes of spike and plateau, respectively, and the is the rise time associated to the suppression of the magnetic order, which was found to vary from 8 ps at low fluence to 2 ps at saturated fluence. The solid lines in Fig.3 (a) show the fitting curves. The fitting parameters are shown in Fig. 4.
The rapid decrease of the SH intensity immediately after the photo-excitation recovered in less than 1 ps, labeled as the fast component . We attribute the fast process to the ultrafast modulation of the spontaneous polarization. The ultrafast laser pulse excites the electrons from the valence band to conduction bands. These delocalized electrons can not contribute to dipole moments due to the screening effect. The polarization recover with the electron decay in by electron phonon scattering. Thus the laser pulse transiently modulates the polarization, and directly affect the intensity of all the nonlinear tensors as shown below. This ultrafast polarization modulation process is an effective way to generate terahertz emission.
The subsequent slowly rising signal reaches the maximum value in several picoseconds, and then stays at a plateau that last for more than 100 ps. The maximum of the pump induced SH intensity grows with increasing fluence and saturates () at 0.4 . At saturated value, this component compensates the nagetive SHG signal induced by magnetic order. In order to clarify the observed dynamics, we did the polar angle scan of the s-out SHG signal at -5 ps, 0 ps and 30 ps, as shown in Fig. 3 (b). The signal of -5 ps is before the pump pulse, consistent with the static SHG. At 0 ps, different tensors are simultaneously reduced with the electron excitations. This is consistent with the expectation that all the second order tensors are dependent on the spontaneous polarization. At 30 ps, the photoexcitation only dramatically changes the s-in s-out signal from , which is sensitive to magnetic order. The results show that at saturation condition, the pump induced increase of the SH intensity exactly offsets the negative signal below TN. Obviously, the light excitations melt the magnetic order and eliminate the exchange striction effect. To determine the critical fluence required to suppress magnetic order, a simple saturated model is used to fit the fluence dependent increase of the SHG intensity at long live time delays (30 ps) for base temperature of 10 K and 40 K, respectively, as shown in Fig.4 (b). The critical fluence() for melting magnetic order at 10 K is only 0.3 , which is about an order of magnitude lower than the pump fluence in previously reported light induced demagnetization in isolating multiferroics Johnson et al. (2015); Bowlan et al. (2016); Baldini et al. (2018).
In previous report about the pump induced Kerr rotation in Fe2Mo3O8, the circularly polarized light can induce prominent Kerr rotation, while the linear polarized light can not induce Kerr rotation. Kerr rotation is a signature of magnetization. In antiferromagnetic systems, the magnetization from different magnetic sublattices counteracts each other. The light induced Kerr signal indicates the circularly polarized light can selectivity flip the spins in the antiferromagntic sublattice and induce net magnetic momentSheu et al. (2019). Our SHG measurement of Fe2Mo3O8 is sensitive to the lattice polarization rather than the magnetic order. However, the signal from the exchange striction induced polarization can be taken as a sign of the antiferromagntic spin order. In our experiments, the SHG signal is independent on the polarization of the pump light. We have used circularly polarized light and linear polarized light with different polarizations to excite the sample, and obtained the same result. We also changed the frequency of pump light to 2 by using an optical parametric amplifier, the pump induced phase transition is essentially unchanged (see appendix). The results indicate that the light excitation can easily melt the primary antiferromagntic order, but we can not identify the magnetization of the light induced state. Considering the fact that the linear polarized light may drive the system to a disorder state while the circularly polarized light induce net magnetization Sheu et al. (2019), our measurements imply that the exchange striction induced polarization can be eliminated in both cases.
V Summary
To summarize, we performed static and time-resolved SHG on Fe2Mo3O8 to study the evolution of the lattice polarization. The equilibrium SHG results confirmed the lattice symmetry of Fe2Mo3O8. At , we observed prominent change of , which should be directly related to the magnetic induced polarization along the c-axis. On the other hand, the other second order tensor elements are not sensitive to the magnetic order. The time-resolved SHG reveals the ultrafast dynamics of the polarization. The magnetic order induced electric polarization is eliminated in several picoseconds at relatively high fluence, indicating an ultrafast melting of the antiferromagnetic order.
VI Appendix
VI.1 SHG pattern fitting
In this Appendix, we present details of fitting the polar pattern. We consider the second order polarization and the electric field are vectors with directions. The SHG process can be expressed as
| (2) |
The nonlinear coefficient is a third rank tensor. For second harmonic generation, , . So in general the subscripts 23 or 32 can be substituted by subscript 4, 31 or 13 by 5, and 12 or 21 by 6. The equation 1 can be write as
| (3) |
In the experiment set up as shown in figure 1, the lab axis 1, 2, 3 are consistent to the crystal axis a, b, c. The light normally incident to the ac plane of the sample, so . According to the symmetry of the sample P63mc, the nonzero components of the tensor are and .
| (4) |
| (5) |
Therefore the generated SHG intensity can be expressed as and .
In the optical pump SHG probe measurement, the probe light reflects from the sample with a very small angle, rather than normal incident. The incident angle dose not affect the i-type SHG measurement. The incident angle is in the horizontal plane, which is the ab-plane. The angle would project a small part of to , since a-axis is equal to b-axis for i-type tensor. The result with a small incident angle is the same as the result with normal incident.
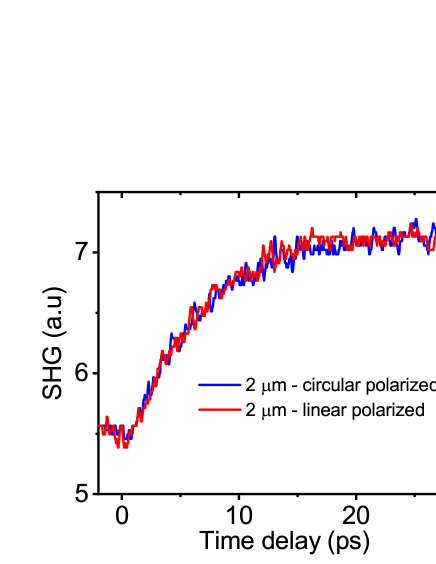
VI.2 Pumped at 2
The light with different wavelength may excite different electron transitions. We tune the pump pulse to 2 by using an optical parametric amplifier. The time traces of the SHG signal related to are shown in Fig.5. The spike like fast process disappears while the slow process is qualitatively unchanged. The results are not dependent on the polarization of the pump pulse.
VII Acknowledgments
We would like to thank Profs. S. Dong, S. W. Cheong, J. Demsar for helpful discussions. This work was supported by National Natural Science Foundation of China (No. 11888101), the National Key Research and Development Program of China (No. 2017YFA0302904).
References
- Kimura et al. (2003) T. Kimura, T. Goto, H. Shintani, K. Ishizaka, T. Arima, and Y. Tokura, Nature 426, 55 (2003).
- Tokura (2007) Y. Tokura, Journal of Magnetism and Magnetic Materials 310, 1145 (2007), proceedings of the 17th International Conference on Magnetism.
- Fiebig et al. (2016) M. Fiebig, T. Lottermoser, D. Meier, and M. Trassin, Nature Reviews Materials 1, 16046 (2016).
- Beaurepaire et al. (1996) E. Beaurepaire, J.-C. Merle, A. Daunois, and J.-Y. Bigot, Phys. Rev. Lett. 76, 4250 (1996).
- Kise et al. (2000) T. Kise, T. Ogasawara, M. Ashida, Y. Tomioka, Y. Tokura, and M. Kuwata-Gonokami, Phys. Rev. Lett. 85, 1986 (2000).
- Ogasawara et al. (2005a) T. Ogasawara, K. Ohgushi, Y. Tomioka, K. S. Takahashi, H. Okamoto, M. Kawasaki, and Y. Tokura, Phys. Rev. Lett. 94, 087202 (2005a).
- Ogasawara et al. (2005b) T. Ogasawara, K. Ohgushi, Y. Tomioka, K. S. Takahashi, H. Okamoto, M. Kawasaki, and Y. Tokura, Phys. Rev. Lett. 94, 087202 (2005b).
- Fiebig et al. (2000) M. Fiebig, D. Fröhlich, K. Kohn, S. Leute, T. Lottermoser, V. V. Pavlov, and R. V. Pisarev, Phys. Rev. Lett. 84, 5620 (2000).
- Nordlander et al. (2018) J. Nordlander, G. De Luca, N. Strkalj, M. Fiebig, and M. Trassin, Applied Sciences 8 (2018), 10.3390/app8040570.
- Matsubara et al. (2009) M. Matsubara, Y. Kaneko, J.-P. He, H. Okamoto, and Y. Tokura, Phys. Rev. B 79, 140411 (2009).
- Sheu et al. (2018) Y. M. Sheu, N. Ogawa, Y. Tokunaga, H. C. Chan, and Y. Tokura, Phys. Rev. B 98, 100301 (2018).
- Cheong (2019) S.-W. Cheong, npj Quantum Materials 4, 53 (2019).
- Le Page and Strobel (1982) Y. Le Page and P. Strobel, Acta Crystallographica Section B 38, 1265 (1982).
- Wang et al. (2015) Y. Wang, G. L. Pascut, B. Gao, T. A. Tyson, K. Haule, V. Kiryukhin, and S.-W. Cheong, Scientific Reports 5, 12268 (2015).
- Kurumaji et al. (2015) T. Kurumaji, S. Ishiwata, and Y. Tokura, Phys. Rev. X 5, 031034 (2015).
- Li et al. (2017) Y. Li, G. Gao, and K. Yao, EPL (Europhysics Letters) 118, 37001 (2017).
- Kurumaji et al. (2017a) T. Kurumaji, Y. Takahashi, J. Fujioka, R. Masuda, H. Shishikura, S. Ishiwata, and Y. Tokura, Phys. Rev. B 95, 020405 (2017a).
- Kurumaji et al. (2017b) T. Kurumaji, Y. Takahashi, J. Fujioka, R. Masuda, H. Shishikura, S. Ishiwata, and Y. Tokura, Phys. Rev. Lett. 119, 077206 (2017b).
- Yu et al. (2018) S. Yu, B. Gao, J. W. Kim, S.-W. Cheong, M. K. L. Man, J. Madéo, K. M. Dani, and D. Talbayev, Phys. Rev. Lett. 120, 037601 (2018).
- Sheu et al. (2019) Y. M. Sheu, Y. M. Chang, C. P. Chang, Y. H. Li, K. R. Babu, G. Y. Guo, T. Kurumaji, and Y. Tokura, Phys. Rev. X 9, 031038 (2019).
- Wang et al. (2021) W. Wang, P. Z. Li, Y. T. Chang, M. F. Liu, C. L. Lu, X. B. Lu, M. Zeng, and J.-M. Liu, Applied Physics Letters 118, 112901 (2021), https://doi.org/10.1063/5.0044565 .
- Csizi et al. (2020) B. Csizi, S. Reschke, A. Strinić, L. Prodan, V. Tsurkan, I. Kézsmárki, and J. Deisenhofer, Phys. Rev. B 102, 174407 (2020).
- Reschke et al. (2020) S. Reschke, A. A. Tsirlin, N. Khan, L. Prodan, V. Tsurkan, I. Kézsmárki, and J. Deisenhofer, Phys. Rev. B 102, 094307 (2020).
- Stanislavchuk et al. (2020) T. N. Stanislavchuk, G. L. Pascut, A. P. Litvinchuk, Z. Liu, S. Choi, M. J. Gutmann, B. Gao, K. Haule, V. Kiryukhin, S.-W. Cheong, and A. A. Sirenko, Phys. Rev. B 102, 115139 (2020).
- Strobel and Page (1983) P. Strobel and Y. L. Page, Journal of Crystal Growth 61, 329 (1983).
- Strobel et al. (1982) P. Strobel, Y. L. Page, and S. McAlister, Journal of Solid State Chemistry 42, 242 (1982).
- Satoh et al. (2007) T. Satoh, B. B. Van Aken, N. P. Duong, T. Lottermoser, and M. Fiebig, Phys. Rev. B 75, 155406 (2007).
- Shi et al. (2020) L. Y. Shi, D. Wu, Z. X. Wang, T. Lin, C. M. Hu, and N. L. Wang, 1, 1 (2020), arXiv:2004.05823 .
- Fiebig et al. (2005) M. Fiebig, V. V. Pavlov, and R. V. Pisarev, J. Opt. Soc. Am. B 22, 96 (2005).
- Kim et al. (2018) M. G. Kim, H. Miao, B. Gao, S.-W. Cheong, C. Mazzoli, A. Barbour, W. Hu, S. B. Wilkins, I. K. Robinson, M. P. M. Dean, and V. Kiryukhin, Nature Communications 9, 5013 (2018).
- Cheong et al. (2020) S.-W. Cheong, M. Fiebig, W. Wu, L. Chapon, and V. Kiryukhin, npj Quantum Materials 5, 3 (2020).
- Johnson et al. (2015) J. A. Johnson, T. Kubacka, M. C. Hoffmann, C. Vicario, S. de Jong, P. Beaud, S. Grübel, S.-W. Huang, L. Huber, Y. W. Windsor, E. M. Bothschafter, L. Rettig, M. Ramakrishnan, A. Alberca, L. Patthey, Y.-D. Chuang, J. J. Turner, G. L. Dakovski, W.-S. Lee, M. P. Minitti, W. Schlotter, R. G. Moore, C. P. Hauri, S. M. Koohpayeh, V. Scagnoli, G. Ingold, S. L. Johnson, and U. Staub, Phys. Rev. B 92, 184429 (2015).
- Bowlan et al. (2016) P. Bowlan, S. A. Trugman, X. Wang, Y. M. Dai, S.-W. Cheong, E. D. Bauer, A. J. Taylor, D. A. Yarotski, and R. P. Prasankumar, Phys. Rev. B 94, 184429 (2016).
- Baldini et al. (2018) E. Baldini, T. Kubacka, B. P. P. Mallett, C. Ma, S. M. Koohpayeh, Y. Zhu, C. Bernhard, S. L. Johnson, and F. Carbone, Phys. Rev. B 97, 125149 (2018).