[a]David Kieda
The VERITAS-Stellar Intensity Interferometry (VSII) survey of Stellar Diameters
Abstract
The VERITAS Imaging Air Cherenkov Telescope (IACT) array was augmented in 2019 with high-speed focal plane electronics to allow its use for Stellar Intensity Interferometry (SII) observations. Since January 2019, the VERITAS Stellar Interferometer (VSII) recorded more than 250 hours of moonlit observations on 39 different bright stars and binary systems () at an effective optical wavelength of 416 nm. These observations resulted in the measurement of the diameters of several stars with better than 5% resolution. This talk will describe the status of the VSII survey and analysis.
1 Introduction
The SII technique measures correlated fluctuations in starlight intensity between spatially separated telescopes. The VERITAS Stellar Intensity Interferometer (VSII) is currently conducting a comprehensive survey of northern sky bright stars, with the goal of measuring the diameters of 30+ stellar objects to an precision of 5% or better. the VSII survey also allows a quantitative exploration of the sensitivity of the VSII observatory and has led to continuous improvements in both instrumentation and analysis techniques. An accompanying paper at this conference [1] describes the current status of the VSII observatory, including recent upgrades and improvements motivated by the initial results of the VSII survey observations.
2 VSII Nightly Observation Procedure
Nightly SII observations begin about 1 hour before twilight. The observer opens the shutter to each VSII camera, and deploys a collapsable mirror to a 45-degree position to reflect the starlight onto a photomultiplier tube (PMT) mounted transverse to the optical axis. The PMT High Voltage (HV) supply battery is reconnected after daytime charging, and the HV supply is powered up. The Data Acquisition (DAQ) system for each telescope is then started and short (10-30 second duration) calibration runs (with HV = 0V) are performed with the telescopes parked in their stow positions. The pedestals of the data traces are recorded and used for removing the DC offset in each electronics channel. About 30 minutes before the start of the observation, the HV is turned on to a sufficient level to verify that each PMT is operational and that the telescopes are ready for beginning observations. The telescopes are then slewed to the first target of the night, and the CCD camera for each telescope is used to micro-adjust the pointing of the telescope to center the point spread function of the starlight onto the narrowband filter. Finally, the HV in each telescope is adjusted to provide a nominal DC current in each PMT (about 10 microamps for a star).
Once the PMT currents are equalized, the telescopes are slewed off from the star’s sky position, and a 1 minute OFF run is taken to measure the night sky background near the star’s sky field. The telescope is then slewed to point at the target star, and a 30-90 minute continuous observation is performed (an ON run). Each observation run is triggered at every telescope by a central trigger pulse that is distributed to each DAQ system via a fiber optic system. As the VERITAS telescopes track the target over 4-6 hours, the projected distance between the telescope combinations continuously changes with the movement of the star position in elevation and azimuth. The measurement of the correlated fluctuations between two telescopes (interferometric visibility ) is therefore is sampled over a range of projected distances during a single night’s observations.
During the ON run, the point spread function (PSF) of the starlight on the focal plane is tracked. If the PSF moves off the narrowband filter window, manual telescope tracking adjustments are performed to recenter the starlight on the light sensor. At the end of the ON run, another OFF run is taken with a offset, and the ON-OFF observing sequence is repeated, as necessary. Moving to a new observing target requires slewing to the desired target, making the manual tracking adjustments to center the PSF onto the optical filter, setting the HV to equalize the PMT gains, and then performing the nominal OFF-ON-OFF run sequence.
At the end of the observing night the HV is turned off and the telescopes are brought to their stow positions. The HV battery is connected to the battery charger, and the collapsible mirror is folded down. The camera shutter is then closed to protect the focal plane during the daytime.
3 VSII Observing Target Selection
The suitability of a target for any given night of observation depends upon several factors. These factors include source-specific characteristics (stellar classification and magnitude, stellar diameter, single/binary/multiple star configuration), observatory characteristics (observatory latitude/longitude, telescope diameters, telescope separations, electronic noise and optical efficiencies), and astronomical considerations (Source RA/Dec, number of hours observable on a given night, seasonal nighttime visibility of the source). VSII uses the public domain ASIIP software package [2, 3] to list and rank the suitability of potential sources for any given observation night.
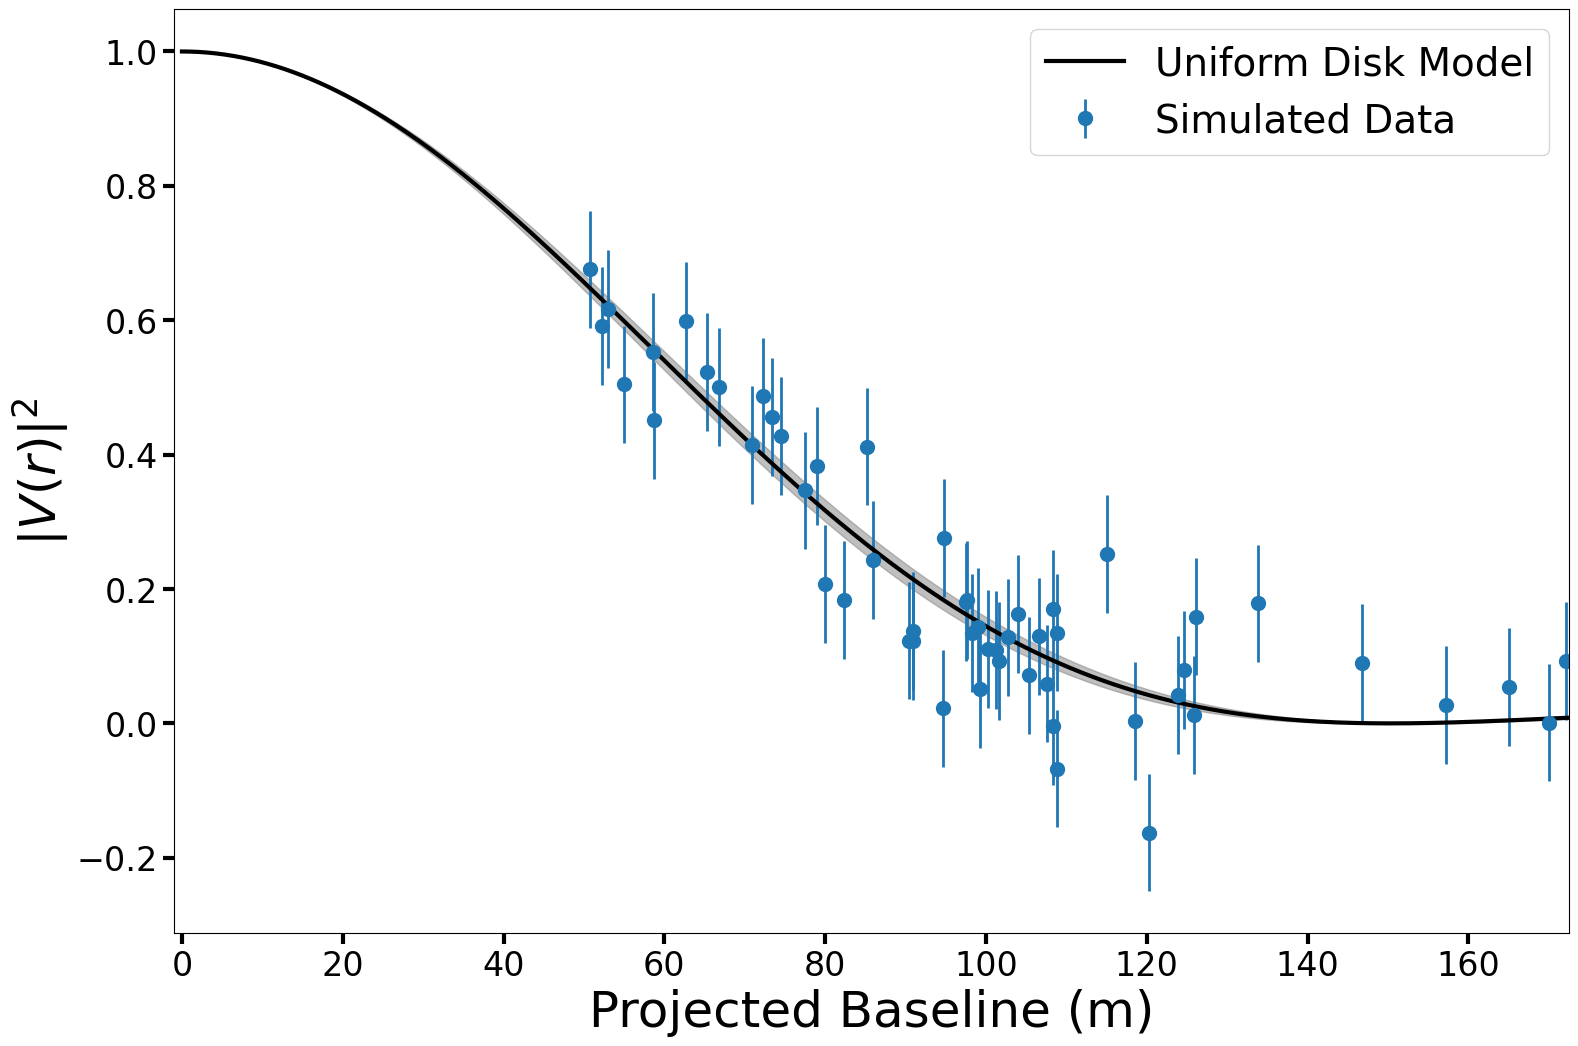
ASIIP simulations are performed for a specified SII observing week during the year, and potential observation targets (drawn from several catalogs, including the JMMC catalog [4]) are ranked according to the estimated error in the determination of the stellar diameter. For examples, large diameter stars () may be poorly fit of the source can only be observed directly overhead on a given night. In contrast, smaller stars () may be unresolved if the observations are constrained to low elevations on a given night. At the beginning of the observing night, the simulated visibility curves for each target (e.g. Figure 1 ) are reviewed, and an observing sequence of 2-5 stellar observations is generated. Then, the observing plan is sequenced to provide an appropriate set of observation hours and baselines for each target to result in a quality measurement of each visibility curve.
3.1 Effects of Moon Angle on Observational Planning
The narrowband Semrock interference filter (5 bandpass, normal incidence) [5] substantially reduces the intensity of background light impinging on the VSII photomultipler tubes (PMTs). This allows VSII observation to occur at all moon phases, including the full moon. In practice, the moonlight places additional restrictions on the observability of specific stars on a given night. The effects include:
-
1.
Moonlight shining directly on the focal plane. Direct moonlight on the focal plane makes it difficult to view the location of the starlight PSF on the interference filter aperture using the focal plane CCD camera. The direct moonlight makes it challenging to visualize the tracking adjustments necessary to keep the starlight PSF centered on the narrowband filter. To first order, this issue rules out any observations when the moon angle to the target source is . In practice, the VSII focal plane is slightly recessed into the VERITAS camera body, providing additional baffling against the moonlight. This baffling allows targets to be observed with moon angles .
-
2.
Moonlight is scattered by the atmosphere through both Rayleigh and Mie Scattering. The scattering functions are peaked in the forward direction, creating a halo of scattered moonlight around the moon. SII observations are dchallenging when the target star is less than aways from the moon position. Moon angles less than also make it challenging to make tracking adjustments.
-
3.
Atmospheric conditions can cause additional constraints on the observability of targets. Patchy clouds in the night sky can strongly scatter moonlight onto the focal plane at unanticipated angles, making it difficult to perform reliable tracking or estimate night sky background biases in the visibility curves. Low clouds on the horizon can restrict observation to higher elevations (longer baselines), making it difficult to sample the central peak of the visibility curve for stars with diameters greater than 1 mas. Alternatively, atmospheric conditions that restrict a given night’s observations to low elevations (short baselines) will result in smaller stars being unresolved.
-
4.
Observing stars at low elevation will noticeably dim their magnitude due to the increased atmospheric depth. If moon angle constraints force observations to occur only at low elevation angles, visible dimmer magnitude targets ( ) may not be feasible observations.
-
5.
Dimmer stars ( ) are difficult to track under most moonlight conditions, regardless of the moon angle. therefore, the nightly observation plan must schedule time between astronomical twilight and moonrise/moonset to perform such observations.
-
6.
In addition, a larger amount background light compared to the starlight will bias the visibility curves, and result in a systematic error in determining the stellar radius. The night sky background light correction is most straightforward when the background light is less intense, and the background does not change significantly across short angular distances across the night sky.
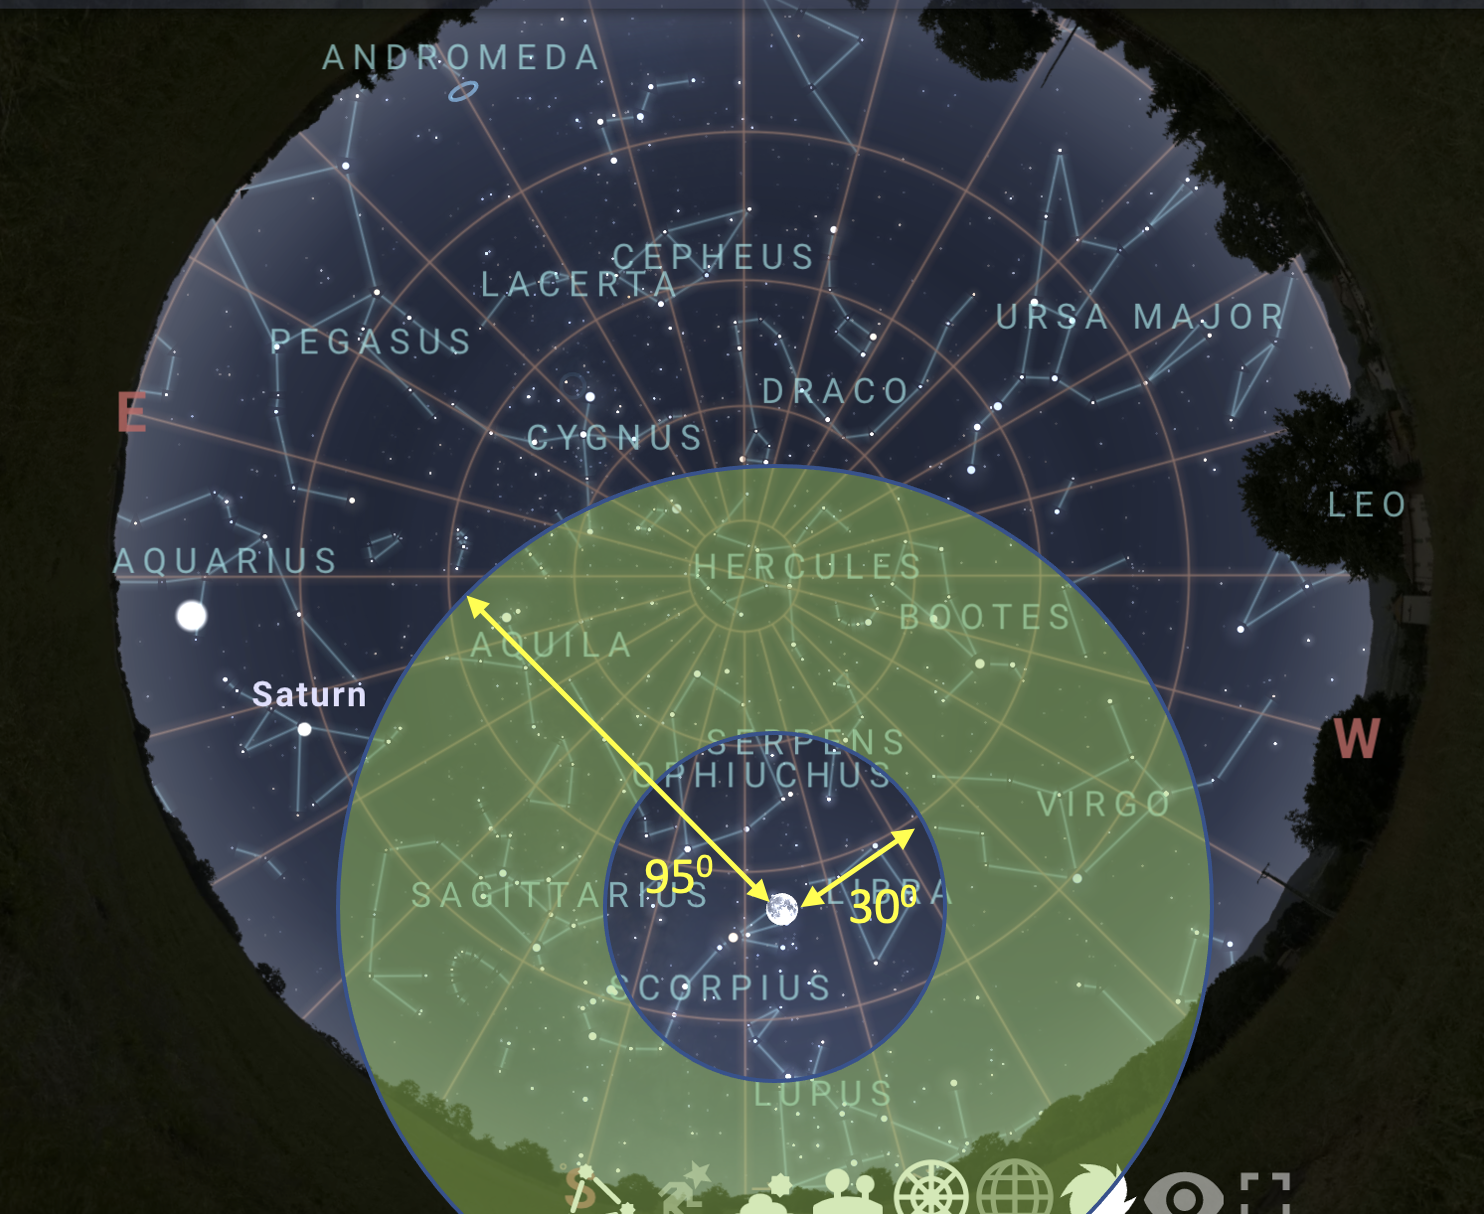
At the beginning of the observing week, the first target observed is chosen to be a bright SII reference (previously observed) star () with to verify the basic operational status of VSII. The star must have an appropriate moon angle () and the star is selected to give a strong visibility signal with a 1 to 1.5 hour exposure.
Priority for Subsequent observations is evaluated using the following priorities:
-
1.
-
2.
Observation time hour
-
3.
-
4.
Quality of ASIIP constraint on stellar diameter
-
5.
Prefer
-
6.
Prefer O, then B, then A stars
-
7.
Previously unobserved targets have a priority
-
8.
Underexposed targets have a priority
-
9.
Short period orbital binaries (e.g. Spica) establish a multi-day priority to map out a visibility curve at different phases of the orbit.
-
10.
Unusual stellar characteristics (e.g. cepheid, fast rotators, etc) gain priority over ‘vanilla’-type singular stars.
4 Summary of VSII Survey Observations
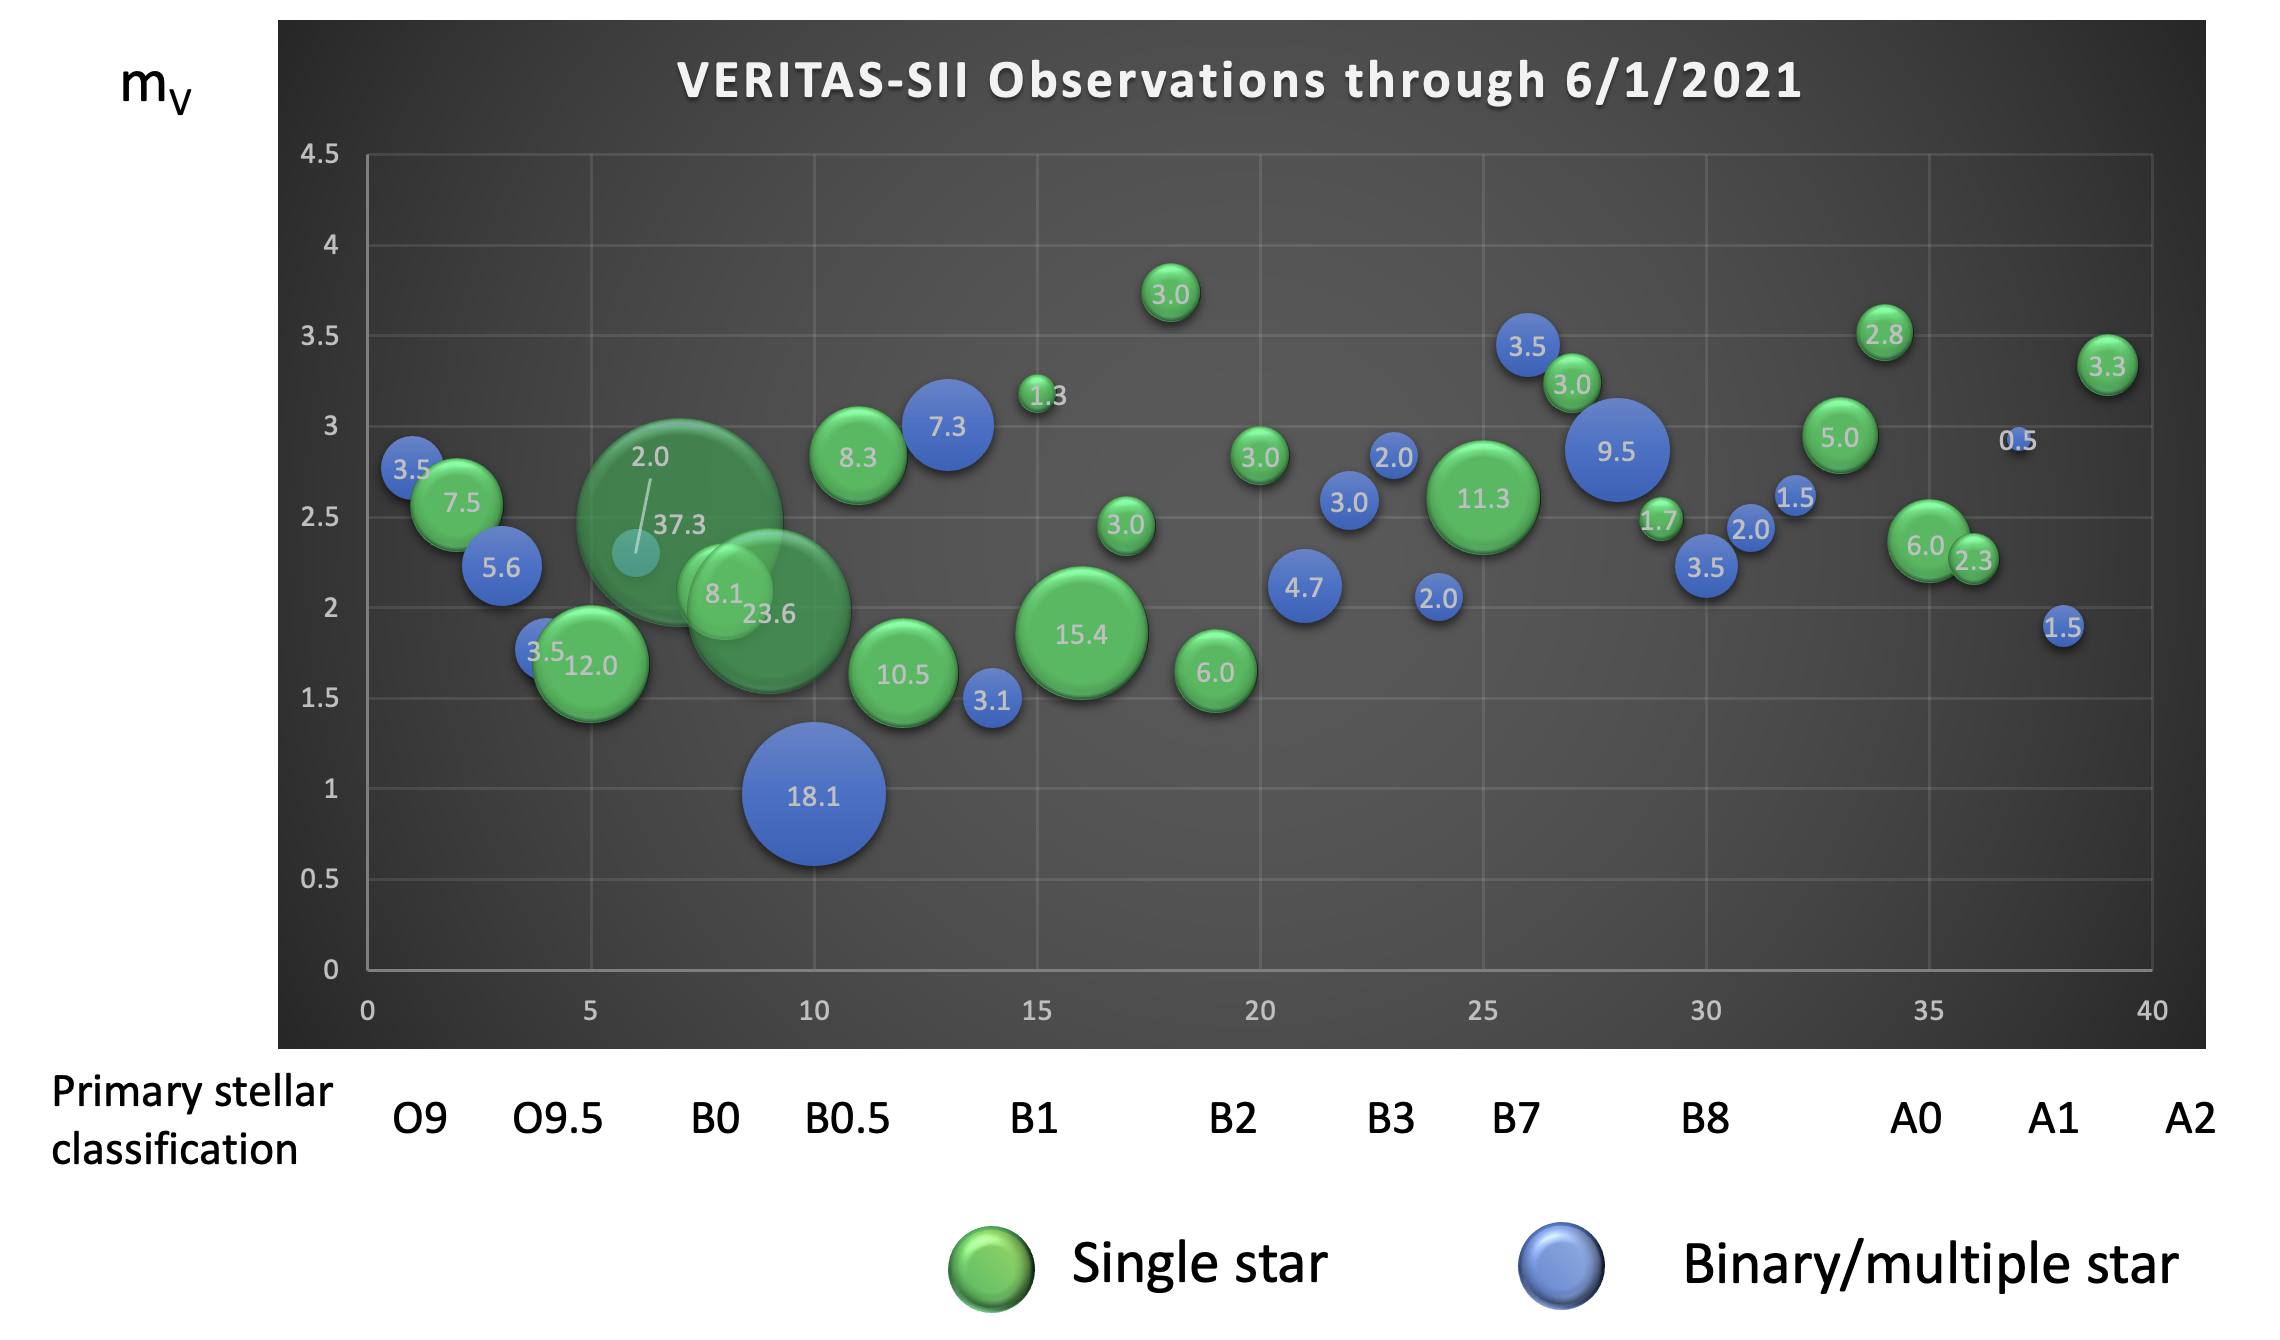
Since December 2019, VSII has performed more that 250 hours of SII observation on 39 different astronomical targets (Figure 3). The survey includes 21 single stars and 18 binary/multiple star systems ranging in magnitude from . The primary stellar classification ranges from O9 through A2 . Figure 3 illustrates the number of observation hours on each target as a function of stellar classification (temperature), stellar magnitude , and single/binary star system classification. This plot include VSII observations through June 1, 2021. The observation exposure is weighted towards longer observation hours for bright () O/B0/B1 stars, but there are a substantial number of observation hours spent probing the sensitivity of VSII to dimmer B7/B8/A stars (). Both single stars and multiple stars are broadly represented across visual magnitude and stellar classification.
5 Data Analysis and Extraction of Visibility Curves
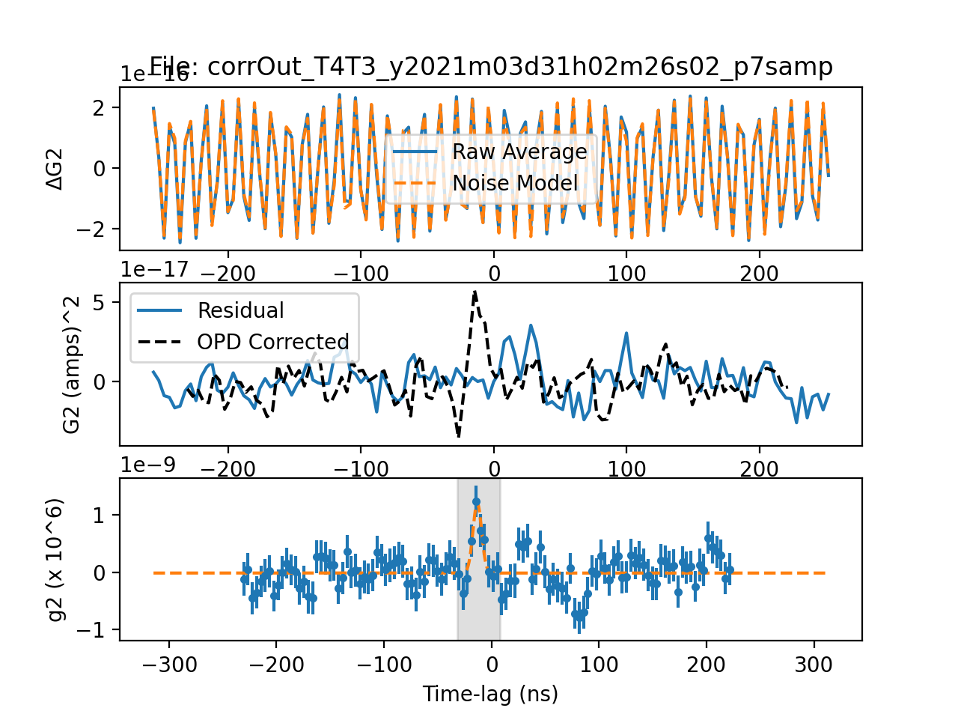
Raw data from individual source observations are processed on-site into a "correllelogram" using a pipelined two-telescope cross-correlation algorithm that the FGPAs host in the VSII Data Acquisition crates. Further details regarding the cross-correlation analysis is provided in a separate paper at this conference [1]. Once the correllelogram for each two-telescope combination is computed, each correllelogram is analyzed to extract the magnitude of the visibility at the specific telescope separation. Figure 4 illustrates the analysis steps of each two-telescope correllelogram. This procedure is complicated by the presence of RF 79 Mhz noise in the raw data stream.
First, the raw correllogram is fitted for a noise model, including a dominant 79 MHz component and several side frequencies. The weighting of each component is iteratively adjusted to match the raw correllogram data until the values converge on a satisfactory fit (Figure 4, upper panel). Next, the residual between the noise model and the raw data is calculated, and the residual data is corrected for the changing optical path delay during the observation using the known projected distance difference between the two telescope to the target (Figure 4, middle panel). Finally a Gaussian fit is used to extract the peak of the visibility curve at the expected time lag between telescopes (Figure 4, bottom panel). A visibility curve similar to Figure 1 is then calculated using the measured visibility peaks and known telescope separations for every telescope pair in the observation. The final visibility curve must be corrected for the presence of night sky background. After this correction, a suitable stellar diameter model is fitted to the visibility curve to extract a reliable measurement of the stellar diameter [7, 8]. We will present a sampling of preliminary stellar diameter measurements for selected stars from the VSII survey at the conference.
6 Acknowledgements
This research is supported by grants from the US Department of Energy Office of Science, the US National Science Foundation, the Smithsonian Institution, and NSERC in Canada. This research used resources provided by the Open Science Grid, which is supported by the National Science Foundation and the US Department of Energy’s Office of Science, and resources of the National Energy Research Scientific Computing Center (NERSC), a US Department of Energy Office of Science User Facility operated under Contract No. DE-AC02-05CH11231. The authors gratefully acknowledge support under NSF Grant #AST 1806262 for the fabrication and commissioning of the VERITAS-SII instrumentation. We acknowledge the excellent work of the technical support staff at the Fred Lawrence Whipple Observatory and the collaborating institutions in the construction and operation of the instrument.
References
- [1] Kieda, D. et al, Status of the VERITAS Stellar Intensity Interferometry (VSII) System, Proc. 37th International Cosmic Ray Conference POS(ICRC 2021) (this conference).
- [2] Davis, J., Matthews, N. and Kieda, D., ASIIP: A Stellar Intensity Interferometry Target Planner, J. Ast. Inst. 2020 6, 037001.
- [3] https://github.com/astronomaestro/ASIIP
- [4] Duvert, G. et al., VizieR Online Data Catalog: JMDC : JMMC Measured Stellar Diameters Catalogue., VizieR Online Data Catalog 2345, November 2016.
- [5] https://www.semrock.com/filterdetails.aspx?id=ff01-420/5-25
- [6] https://stellarium-web.org/
- [7] Abeysekara, A. U. et al. Demonstration of stellar intensity interferometry with the four VERITAS telescopes, Nature Astronomy 2020 https://www.nature.com/articles/s41550-020-1143-y
- [8] Matthews, N. , Intensity Interferometry Observations with VERITAS, PhD Dissertation, University of Utah (2020).
Full Authors List: VERITAS Collaboration
C. B. Adams1,
A. Archer2,
W. Benbow3,
A. Brill1,
J. H. Buckley4,
M. Capasso5,
J. L. Christiansen6,
A. J. Chromey7,
M. Errando4,
A. Falcone8,
K. A. Farrell9,
Q. Feng5,
G. M. Foote10,
L. Fortson11,
A. Furniss12,
A. Gent13,
G. H. Gillanders14,
C. Giuri15,
O. Gueta15,
D. Hanna16,
O. Hervet17,
J. Holder10,
B. Hona18,
T. B. Humensky1,
W. Jin19,
P. Kaaret20,
M. Kertzman2,
D. Kieda18,
T. K. Kleiner15,
S. Kumar16,
M. J. Lang14,
M. Lundy16,
G. Maier15,
C. E McGrath9,
P. Moriarty14,
R. Mukherjee5,
D. Nieto21,
M. Nievas-Rosillo15,
S. O’Brien16,
R. A. Ong22,
A. N. Otte13,
S. R. Patel15,
S. Patel20,
K. Pfrang15,
M. Pohl23,15,
R. R. Prado15,
E. Pueschel15,
J. Quinn9,
K. Ragan16,
P. T. Reynolds24,
D. Ribeiro1,
E. Roache3,
J. L. Ryan22,
I. Sadeh15,
M. Santander19,
G. H. Sembroski25,
R. Shang22,
D. Tak15,
V. V. Vassiliev22,
A. Weinstein7,
D. A. Williams17,
and
T. J. Williamson10
1Physics Department, Columbia University, New York, NY 10027, USA
2Department of Physics and Astronomy, DePauw University, Greencastle, IN 46135-0037, USA
3Center for Astrophysics Harvard & Smithsonian, Cambridge, MA 02138, USA
4Department of Physics, Washington University, St. Louis, MO 63130, USA
5Department of Physics and Astronomy, Barnard College, Columbia University, NY 10027, USA
6Physics Department, California Polytechnic State University, San Luis Obispo, CA 94307, USA
7Department of Physics and Astronomy, Iowa State University, Ames, IA 50011, USA
8Department of Astronomy and Astrophysics, 525 Davey Lab, Pennsylvania State University, University Park, PA 16802, USA
9School of Physics, University College Dublin, Belfield, Dublin 4, Ireland
10Department of Physics and Astronomy and the Bartol Research Institute, University of Delaware, Newark, DE 19716, USA
11School of Physics and Astronomy, University of Minnesota, Minneapolis, MN 55455, USA
12Department of Physics, California State University - East Bay, Hayward, CA 94542, USA
13School of Physics and Center for Relativistic Astrophysics, Georgia Institute of Technology, 837 State Street NW, Atlanta, GA 30332-0430
14School of Physics, National University of Ireland Galway, University Road, Galway, Ireland
15DESY, Platanenallee 6, 15738 Zeuthen, Germany
16Physics Department, McGill University, Montreal, QC H3A 2T8, Canada
17Santa Cruz Institute for Particle Physics and Department of Physics, University of California, Santa Cruz, CA 95064, USA
18Department of Physics and Astronomy, University of Utah, Salt Lake City, UT 84112, USA
19Department of Physics and Astronomy, University of Alabama, Tuscaloosa, AL 35487, USA
20Department of Physics and Astronomy, University of Iowa, Van Allen Hall, Iowa City, IA 52242, USA
21Institute of Particle and Cosmos Physics, Universidad Complutense de Madrid, 28040 Madrid, Spain
22Department of Physics and Astronomy, University of California, Los Angeles, CA 90095, USA
23Institute of Physics and Astronomy, University of Potsdam, 14476 Potsdam-Golm, Germany
24Department of Physical Sciences, Munster Technological University, Bishopstown, Cork, T12 P928, Ireland
25Department of Physics and Astronomy, Purdue University, West Lafayette, IN 47907, USA