Custom-Tailored Clone Detection for IEC 61131-3 Programming Languages
Abstract
Automated production systems (aPS) are highly customized systems that consist of hardware and software. Such aPS are controlled by a programmable logic controller (PLC), often in accordance with the IEC 61131-3 standard that divides system implementation into so-called program organization units as the smallest software unit and is comprised of multiple textual ( Structured Text (ST)) and graphical ( Function Block Diagram (FBD), Ladder Diagram (LD), and Sequential Function Chart (SFC)) programming languages that can be arbitrarily nested.
A common practice during the development of such systems is reusing implementation artifacts by copying, pasting, and then modifying code. This approach is referred to as code cloning. It is used on a fine-granular level where a POUs is cloned within a system variant. It is also applied on the coarse-granular system level, where the entire system is cloned and adapted to create a system variant, for example for another customer. This ad hoc practice for the development of variants is commonly referred to as clone-and-own. It allows the fast development of variants to meet varying customer requirements or altered regulatory guidelines. However, clone-and-own is a non-sustainable approach and does not scale with an increasing number of variants. It has a detrimental effect on the overall quality of a software system, such as the propagation of bugs to other variants, which harms maintenance.
In order to support the effective development and maintenance of such systems, a detailed code clone analysis is required. On the one hand, an analysis of code clones within a variant (i.e., clone detection in the classical sense) supports experts in refactoring respective code into library components. On the other hand, an analysis of commonalities and differences between cloned variants (i.e., variability analysis) supports the maintenance and further reuse and facilitates the migration of variants into a software product line (SPL).
In this paper, we present an approach for the automated detection of code clones within variants (intra variant clone detection) and between variants (inter variant clone detection) of IEC61131-3 control software with arbitrary nesting of both textual and graphical languages. We provide an implementation of the approach in the Variability Analysis Toolkit (VAT) as a freely available prototype for the analysis of IEC 61131-3 programs. For the evaluation, we developed a meta-model-based mutation framework to measure our approach’s precision and recall. Besides, we evaluated our approach using the Pick and Place Unit (PPU) and Extended Pick and Place Unit (xPPU) scenarios. Results show the usefulness of intra and inter clone detection in the domain of automated production systems.
Abstract
Automated production systems (aPS) are highly customized systems that consist of hardware and software. Such aPS are controlled by a programmable logic controller (PLC), often in accordance with the IEC 61131-3 standard that divides system implementation into so-called program organization units (POUs) as the smallest software unit and is comprised of multiple textual (Structured Text (ST)) and graphical (Function Block Diagram (FBD), Ladder Diagram (LD), and Sequential Function Chart(SFC)) programming languages that can be arbitrarily nested.
A common practice during the development of such systems is reusing implementation artifacts by copying, pasting, and then modifying code. This approach is referred to as code cloning. It is used on a fine-granular level where a POU is cloned within a system variant. It is also applied on the coarse-granular system level, where the entire system is cloned and adapted to create a system variant, for example for another customer. This ad hoc practice for the development of variants is commonly referred to as clone-and-own. It allows the fast development of variants to meet varying customer requirements or altered regulatory guidelines. However, clone-and-own is a non-sustainable approach and does not scale with an increasing number of variants. It has a detrimental effect on the overall quality of a software system, such as the propagation of bugs to other variants, which harms maintenance.
In order to support the effective development and maintenance of such systems, a detailed code clone analysis is required. On the one hand, an analysis of code clones within a variant (i.e., clone detection in the classical sense) supports experts in refactoring respective code into library components. On the other hand, an analysis of commonalities and differences between cloned variants (i.e., variability analysis) supports the maintenance and further reuse and facilitates the migration of variants into a software productline (SPL).
In this paper, we present an approach for the automated detection of code clones within variants (intra variant clone detection) and between variants (inter variant clone detection) of IEC61131-3 control software with arbitrary nesting of both textual and graphical languages. We provide an implementation of the approach in the variability analysis toolkit (VAT) as a freely available prototype for the analysis of IEC 61131-3 programs. For the evaluation, we developed a meta-model-based mutation framework to measure our approach’s precision and recall. Besides, we evaluated our approach using the Pick and Place Unit (PPU) and Extended Pick and Place Unit (xPPU) scenarios. Results show the usefulness of intra and inter clone detection in the domain of automated production systems.
keywords:
Clone Detection, Variability Mining, IEC 61131-3, Reverse Engineering1 Introduction
During the evolution of software systems, code cloning is a common practice [1] for reusing software artifacts. To cope with an increasing market for custom-tailored software systems, developers often follow a clone-and-own approach where existing variants are copied and altered to create new variants [2]. It is an unsustainable approach that reduces the overall software quality due to bug propagation, increases the maintenance effort, and hinders further reuse [3]. In the field of clone detection, research focuses on high-level programming languages such as Java or C [1, 4, 5, 6]. In the domain of automated production systems, code cloning is a common practice due to frequently changing products, customer requirements, and altered regulatory guidelines [7, 8].
The state of the art programming languages for programming logical controller software is defined in the IEC 61131-3 standard [9]. It comprises five programming languages, the two textual languages Structured Text (ST) and Instruction List (IL), and the three graphical languages Sequential Function Chart (SFC), Ladder Diagram (LD), and Function Block Diagram (FBD). The standard allows the nesting of languages languages, such as using Structured Text (ST) in Function Block Diagram (FBD) implementations. The control program developers can select the language that is best suited for a particular task, significantly increasing their productivity. Programs implemented according to IEC 61131-3 are divided into POUs as the smallest software unit in a program. Such systems are often reused by copying the whole system and then modifying it to create new and independent system variants (referred to as clone-and-own). Furthermore, developers also often reuse single POUs within a system (referred to as classical code cloning), for example, the POU that controls a sorting conveyor that can occur several times in a production system [10, 11].
To restore the sustainable development of cloned system variants, they need to be re-engineered into a structured reuse approach, such as a software product line (SPL) [12, 13]. Therefore, a detailed analysis of system variants concerning code clones within a variant (intra clone detection) and commonalities and differences between cloned variants (inter clone detection) is essential. It serves as a first step to re-engineer system variants into an SPL [14, 15] and to refactor code clones into reusable and configurable software artifacts such as library components [16].
We propose a fully customizable comparison approach for IEC 61131-3 in order to support the detection of clones within a variant (intra variant clone detection) and between variants (inter variant clone detection). This supports developers in tracing clones within and between variants, which helps them create reusable components within systems and migrating system variants into an SPL, respectively. Specifically, the contributions of this paper are as follows:
-
1.
A model-based, fine-grained, and fully customizable approach for the detection of code clones within variants (intra clone detection) and analysis of commonalities and differences between cloned variants (inter clone detection) of IEC 61131-3 programs composed of arbitrarily nested sub languages.
-
2.
Publicly available prototype implementation called VAT, evaluation data and results111https://github.com/TUBS-ISF/IEC_61131_3_Clone_Detection.
-
3.
A mutation framework for the evaluation of clone detection tools for IEC 61131-3 systems.
-
4.
Detailed evaluation and analysis of the approach by applying it to a large clone data set created using the mutation framework, as well as to the PPU and xPPU case study systems.
The remainder of this paper is structured as follows: Section 2 provides relevant background on the IEC 61131-3 standard with the utilized programming languages and describes code clones and variability analysis. Section 3 presents our approach for detecting clones within and between variants. In Section 4, we explain the implementation of our approach as a tool called VAT. In Section 5, we evaluate our approach by performing qualitative and quantitative analyses. Finally, we discuss related work in Section 6 and conclude in Section 7.
2 Background
This section provides background on IEC 61131-3 control software, types of code clones, and variability analysis.
2.1 IEC 61131-3 Control Software
Automated production systems are typically controlled by PLCs, which are typically programmed in accordance with the IEC 61131-3 standard. A PLC executes programs in a cycle that is divided into three phases input scan, program execution, and update of outputs.
Figure 1 illustrates the IEC 61131-3 software model. The highest level of a PLC controlled system is described in a configuration, which is assigned to a particular type of control system, including the hardware, i.e., processing resources, memory addresses for all input and output channels, as well as the system capabilities. Within a configuration, there are resources, which are a processing facility that can execute IEC programs. A resource can contain one or more tasks controlling the execution of programs and function blocks. Programs are defined as a logical assembly of all programming language elements and constructs necessary to fulfill plant machinery’s control task. Functions and function blocks are the basic elements and contain specific implementation. Functions do not have a state and always return the identical output given the same input. In contrast, function blocks contain a state and tracking the execution history. Programs, function blocks and functions are called program organization units (POUs), within the IEC 61131-3. A POU contains a declaration part ( Figure 5) where variables and data types are defined and a body part ( Figure 5) where algorithms are implemented. For the implementation of POUs, the IEC 61131-3 provides multiple languages, which are Structured Text (ST) shown in Section 2.1.1, Function Block Diagram (FDB) reflected in Section 2.1.2, Ladder Diagram (LD) illustrated in Section 2.1.3, Sequential Function Chart (SFC) which is explained in Section 2.1.4. The last implementation language is Instruction List (IL), an assembly-like programming language, which we don’t consider due to its deprecation in the previous version of the IEC 61131-3 standard. The control program developers can select the language that is best suited for a particular task, significantly increasing their productivity. Moreover, different languages can be nested so that developers can flexibly switch languages based on the specific tasks, as explained in Section 2.2.
2.1.1 Structured Text (ST)
ST is a high-level textual language that looks syntactically similar to C or Pascal [18]. An ST implementation is a composition of single steps called statements (cf.1). Available statement types are for, while, if, case, assignment, and function call. ST allows implementing complex algorithms, long mathematical functions, array manipulation, and repetitive tasks.
2.1.2 Function Block Diagram (FBD)
FBD comes from the field of signal processing, where integer and/or floating-point values are processed [19]. It is a graphical programming language that can describe the function between input and output variables. A POU implemented in FBD contains a declaration part and an implementation part. The declaration part is used to define variables or constants, either graphical or textual. The implementation part uses networks on the top layer to structure the implementation. Networks represent either a logical or arithmetic expression. Every network has a mark that can be used as a jump target from other networks. For the implementation of networks, we can use functions such as logical AND and function blocks such as timer on delay. All function blocks have input and output ports, which can be connected with variables or with other blocks. Blocks describe a function between input and output.

2.1.3 Ladder Diagram (LD)
LD is a graphical programming language such as FBD and resembles an electric circuit structure. An LD implementation contains a series of networks that are limited on the left and right sides by a current vertical line called the power rail shown in Figure 3. Networks are implemented using contacts, coils, and connecting lines as in a circuit diagram. Contacts pass the condition true and false from left to the right side. A coil transmits the value of the connections from left to right and stores it in a variable. In addition to contacts and coils, the usage of function blocks and programs is allowed.

2.1.4 Sequential Function Chart (SFC)
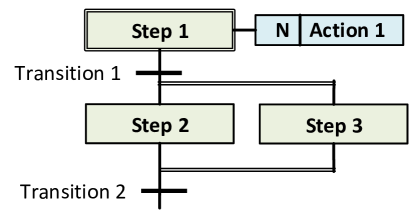
SFC is a graphical programming language used for PLCs based on binary Petri nets [20]. It can be used to program processes divided into single steps. The main components of an SFC implementation are Steps with associated Actions and Transitions with assigned conditions, as shown in Figure 4. An SFC implementation consists of a series of steps connected with directed Transitions. Steps in an SFC implementation can be active or inactive. When a Step is active, the associated actions are executed. A step is triggered. Either the step is an initial step specified by the developer, or all the steps above are active, and the connecting transition is active. Actions can be either entry or exit action. An entry action is executed right after a step is activated, and the exit action is executed after the step turns from active to inactive.
2.2 Nesting of IEC61131-3 Languages
An additional challenges for the analysis of IEC 61131-3 is the language nesting.
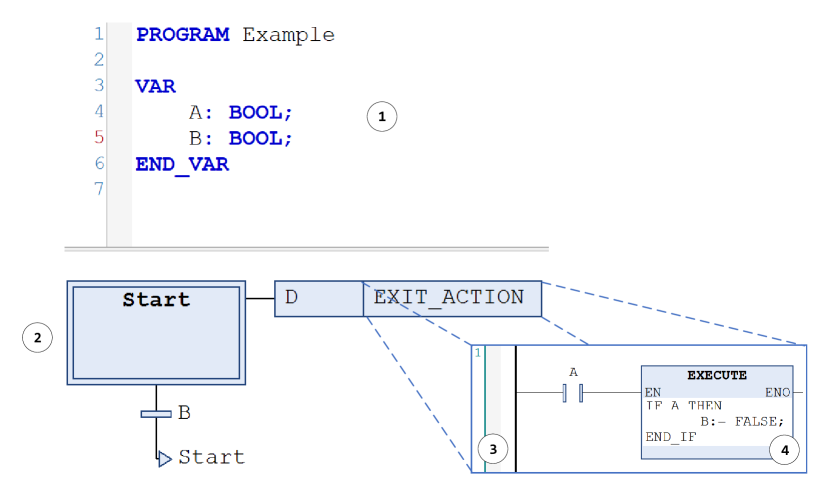
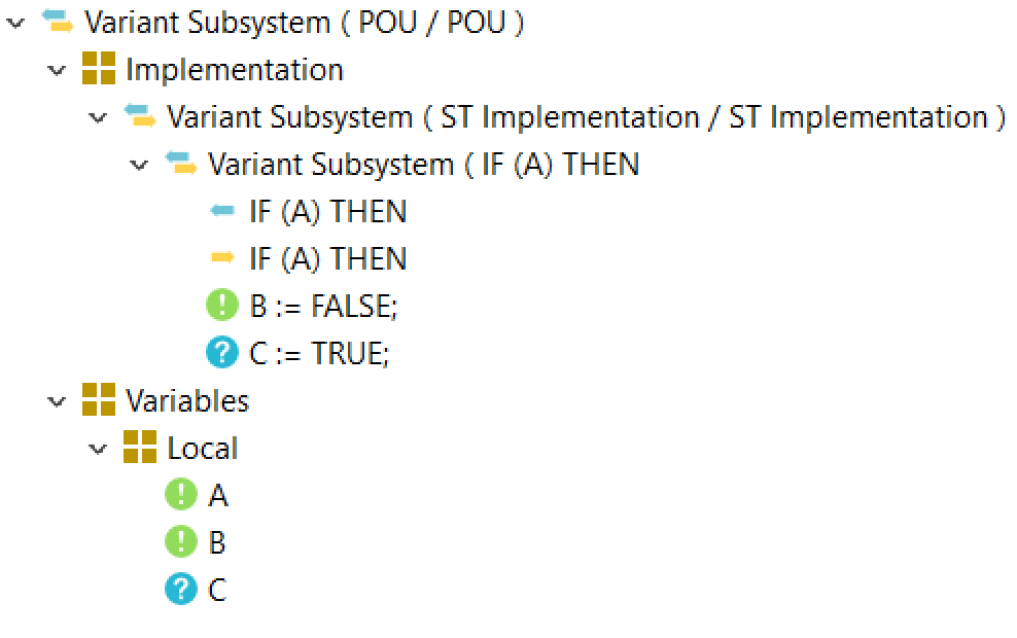
Figure 5 shows the implementation of a program using four languages for its implementation. On the top, we can see the global variable declaration with the definition of the Boolean variables A and B . The program is implemented in SFC and has one step that executes a time-delayed (D) action, which is implemented using LD. In the LD implementation , we use an execute function block that executes ST code .
2.3 Types of Clones
Two fragments of code that are similar or even equal are called code clones. The similarity between code clones can be assessed based either on their textual representation or on their functionality. Textual clones are often the result of copying and pasting existing code to another location where it can then be adapted if necessary. Roy et al. [5] classify code clones according to the following four types:
-
1.
Type I: Two code fragments that are similar except for changes in white space or variation in code comments.
-
2.
Type II: Code fragments that are syntactically equal but can show renaming of literals or identifiers as well as the changes of Type I clones.
-
3.
Type III: In addition to the properties of Type 2 clones, the fragments can show further modifications such as additional statements, added, or deleted lines.
-
4.
Type IV: Two code fragments that offer the same functionality but are implemented differently. Type IV clones are also called semantic clones.
In Figure 6 we show a cloned pair of ST implementations. On the left, if the variable CONDITION evaluates to true (cf. line 1), we assign the value 5 to the variable VALUE (cf. line 2). On the right, the variable VALUE is renamed to VAR1 (cf. line 2), and the if condition block is extended with an additional assignment (cf. line 3). So these code fragments are type III clones of each other. We can also apply the commonly available definition of clones to IEC 61131-3 languages. The only difference is the name of the artifacts. In the context of IEC systems, we speak of configurations or POU, whereas in object-oriented languages, for example, classes and methods are common artifacts.
2.4 Variability Analysis
In contrast to clone detection, variability analysis describes the identification of similar and variable parts between a family of software variants. A family of software is a set of programs that has common properties [22]. One member of this software family represents a valid realization of one product known as a software variant. Depending on how such a software family has been created, the effort of creating new variants and maintaining existing products increases rapidly [12]. A variability analysis is recommended to re-instantiate software variants’ sustainable development in a system created with clone-and-own. Such an analysis can support developers in maintaining software families, e.g., tracing bugs between variants, or helping them by migrating the whole software family into an SPL [12, 23, 24].
3 Clone Detection Approach
This section presents our approach for the detection of code clones in IEC 61131-3 control software. We first explain the general comparison approach and then each step in more detail in the following sections.
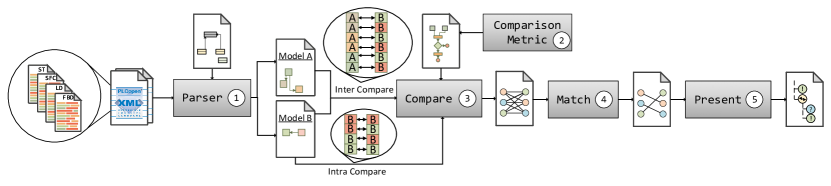
Figure 7 illustrates the process for the detection of code clones.
In the first step, the control software is parsed . The parsing process transforms a PLCOpenXML file into a model based on a set of meta-models. We created these meta-models as an abstraction of the IEC 61131-3 standard to reduce the complexity. A PLCOpenXML file contains the implementation of a system as a set of POUs. Every POU may be implemented in one of five languages proposed by the IEC61131-3 and can contain nested implementations in different languages.
A configurable comparison metric can customize the comparison process. This metric is a composition of options and weighted attributes that the user can customize. The input model(s) are decomposed into smaller elements based on selected options. These elements are then compared with each other, and a similarity value is computed based on the weighted attributes.
The comparison step receives as input either one instance of a model representing a system (in case of intra clone detection) or two instances, each representing a system variant (in case of inter clone detection). The comparison process decomposes the input models into smaller elements and then compares them to compute pairwise similarities based on the comparison metric. The difference between intra and inter clone detection is only in the pairing of elements for comparison. In the case of intra clone detection (i.e., the detection of clones within a system), all pairwise combinations of all POUs in one model are created and compared. In contrast, the inter clone detection (i.e., the detection of clones between variants of a system) receives two models (each representing a variant) as input, and all POUs within the first model are compared against all POUs of the second model. The result of the comparison process is a similarity tree in which each node is a description of a weighted edge in a completed, weighted, bipartite graph.
The matching step calculates an independent edge set on this graph to filter it and obtain the most similar elements. The independent edge set contains information about the relation of elements that are finally presented to the user in the form of a family model for more straightforward interpretation than just a list of matched pairs.
3.1 Parsing Nested IEC 61131-3 Code
The parsing process transforms a PLCOpenXML file into an instance of our meta-models. We decided on this file format because most of the tools that deal with IEC 61131-3 code support the export of projects into this format. Besides, this format reflects the project structure and delivers meta information of the project. To process the project structure, we created a set of meta-models that capture the extent of PLCOpen projects.
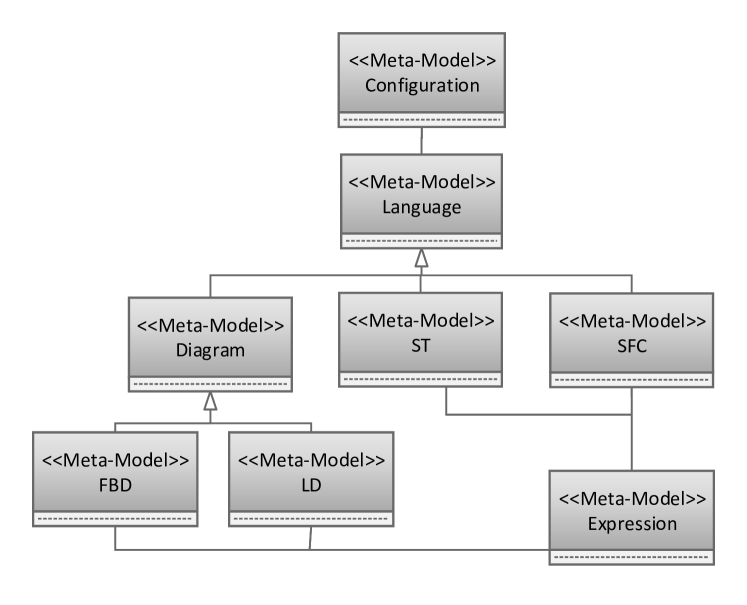
Figure 8 illustrates a schematic overview of our meta-model architecture. On the top level, the configuration meta-model models the project structure and contains elements such as the POUs and their implementations. As an abstraction layer between the configuration and the implementation of each POU, we introduced the Language meta-model. Additionally, we created a meta-model for each of the IEC 61131-3 programming languages that inherit from the Language meta-model, except for IL, which has been deprecated in the last version of the standard. As another abstraction level, the diagram meta-model contains the common elements of the two graphical languages FBD and LD such as networks, ports, and jumps. Moreover, we created a meta-model for expressions used in all programming languages, such as the condition of contacts in an LD implementation or a Boolean expression in an ST statement. We created eight meta-models that contain a total of 51 classes and 18 enumerations. Generally, our meta-models and their classes allow capturing detailed information about systems and artifacts, which is essential for a detailed analysis of such systems. Furthermore, our meta-models are an abstraction of the IEC 61131-3 standard, which reduces the complexity of systems implemented in accordance with it. As input for the parsing process, we utilize a PLCOpenXML file and get a meta-model instance as output, which is the input for the comparison process.
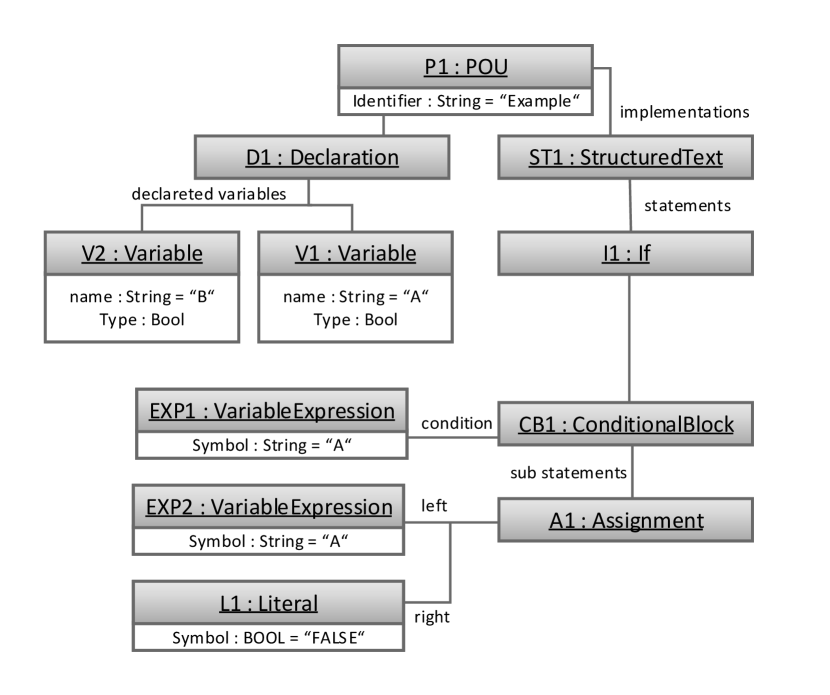
In 2 and 3 we illustrate an example POU declaration and implementation, respectively. Figure 9 shows the respective model representation as UML object diagram. The root is the POU, which has the declaration and the StructuredText objects as child elements. The declaration object contains the defined variables A and B and the implementation object the statements of our example ST implementation.
3.2 Comparison Metric Definition
A fully customizable, fine-grained comparison metric drives the comparison of IEC 61131-3 artifacts. It allows domain experts to customize the comparison process. A metric is a hierarchical composition of options and attributes. Attributes are atomic comparison operations that compare two elements with each other, such as comparing two statement types. Each attribute’s result is a float value between 0 and 1, which indicates how similar are the compared elements in percent. Options can activate and deactivate parts of the comparison process, such as the comparison of global variables. Moreover, it is possible to adjust every attribute and option with a weight, allowing the customization of the metric and prioritization of parts of the comparison. In general, options define which elements to compare, and attributes define how to compare these elements.
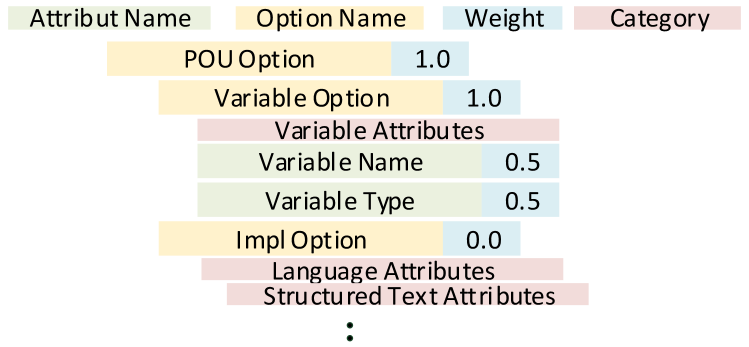
Figure 10 shows a part of a metric for the comparison of POUs. The composition of options and attributes has the same structure as the model (cf. Figure 9). In this graph, options can contain options and attributes, and attributes are leaves. In the example metric in Figure 10 we compare POUs only based on their variables (indicated by the X on the left of the respective option) and ignore their implementation. Variables are compared with two attributes, which compare the type and the name of variables. Selected attributes are adjusted with a weight that is shown on their right. In total, our clone detection technique for IEC 61131-3 supports 17 options and 65 attributes for the definition of a custom comparison metric. A detailed list of all attributes and options is available in our online material 222github.com/TUBS-ISF/IEC_61131_3_Clone_Detection.
More formally, a comparison metric is represented by a root option. An option is a triple where is a set of sub-options, is a set of attributes, is the type of artifact the option applies to, and is a weight value. An Attribute is a pair , where is a function with and being implementation artifacts (i.e., elements of our meta-model) and the computed similarity value, and is a weight value.
3.3 Comparison Process for IEC 61131-3 Models
In this section, we present the general comparison approach. In Section 3.3.1 we describe the comparison of model elements and the resulting similarity tree. Each node of the tree describes a relation between an element of the first and the second input model. Finally, we describe how we cope with nested implementation artifacts shown in Section 3.3.2.
3.3.1 Comparison Approach and resulting Similarity Tree
The comparison function shown in Algorithm 1 receives two artifacts of the same type and the option for comparison. If both artifacts have child elements and the comparison of these elements is enabled in the metric (i.e., an option with matching type exists), the function is called recursively for each pair of child artifacts. This way, we systematically perform all pairwise comparisons of elements. Considering the input as sets of artifacts and , we create all pairs and compute their similarities based on the comparison metric (specifically, the current option). The resulting data structure is a tree comprised of three types of similarity nodes: pairs of elements, options, and attributes. Pairs of elements can have options and attributes as children, options can only have element pairs as children, and attributes do not have children.
After the forward path of the recursion in Algorithm 1, only the attribute nodes (which are the leaves) of the resulting similarity tree have a similarity value assigned, as shown in Figure 11.
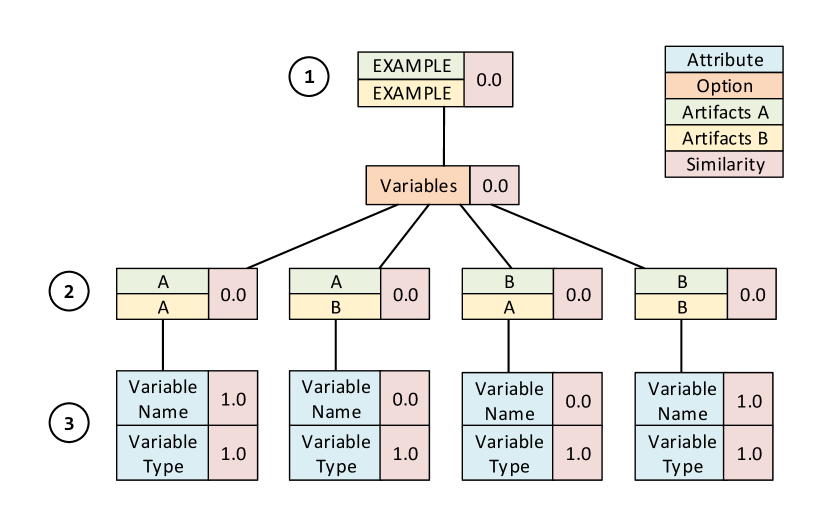
It shows the similarity tree that is created during the comparison of our example model shown in Figure 9 driven by the example metric shown in Figure 10. Driven by the metric, the process compares both models systematically and creates pairs of elements for the comparison. The root node of the similarity tree is the pair of POUs with the name EXAMPLE ( in Figure 11). Due to the selected variables option in the metric (Figure 10), all pairwise combinations of variables are created and compared. The pairs are compared using the attributes that are contained in the metric, which are Variable Name and Variable Type ( Figure 11). Only the attributes have a similarity value after the comparison that needs to be propagated to all other nodes.
The similarity values of the remaining nodes are set on the backward path of the recursion where the weighed similarity values are propagated upward in the similarity tree, as shown in Figure 12.
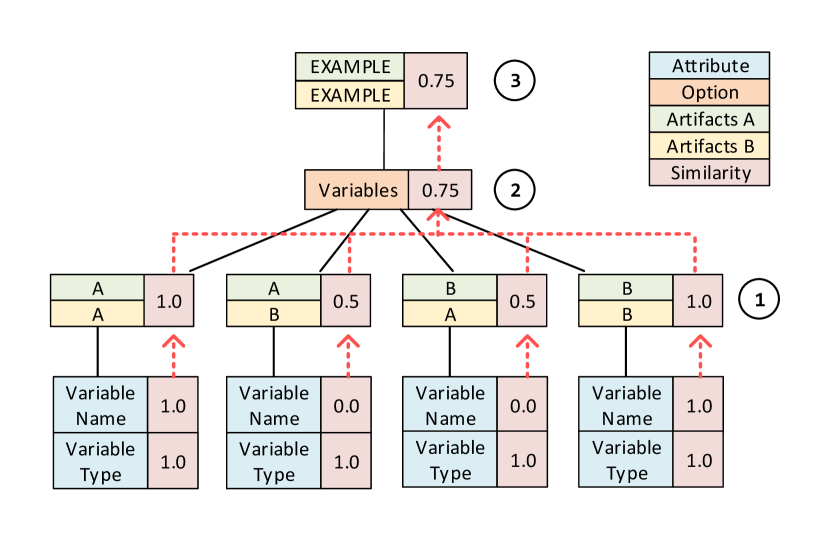
First, the leaf artifact pairs ( in Figure 12) update their similarity by based on the similarities of their attributes. After that, the variables option ( in Figure 12) updates its similarity based on their children’s similarity values. Finally, the similarity value of the root artifact pair ( in Figure 12) is updated.
Each node in this graph describes a weighted edge between an element of and , which expresses the relation between them (cf. Figure 11. The edge’s weight is a float value between 0 and 1 reflects the similarity between both elements. All nodes in this graph can be considered as a completed weighted bipartite graph between both sets of elements.
3.3.2 Detecting Nested Implementations
Our meta-models are designed to store different implementation languages in one model. This allows us to compare different combinations of nestings in the implementation, such as an action in an SFC implementation that is implemented in another language. To compare different language nestings, we extended the metric with pointers at any place where IEC implementations can be nested. This allows to jump to the corresponding language options and attributes whenever an artifact with a type is detected that corresponds to another language. In Figure 17 and Figure 19, this is indicated by black arrows on the left side. The whole process is called recursively, which allows comparing nestings of any level. We extended the similarity tree with an implementation option for artifacts with a nested implementation. To the best of our knowledge, this is the only work that provides this functionality. This comparison is possible based on the abstraction level in our meta-model structure, which allows us to model abstract languages on the one hand. On the other hand, the recursively defined comparison approach compares models based on a fully customizable metric.
3.4 Matching Process using the Similarity Tree
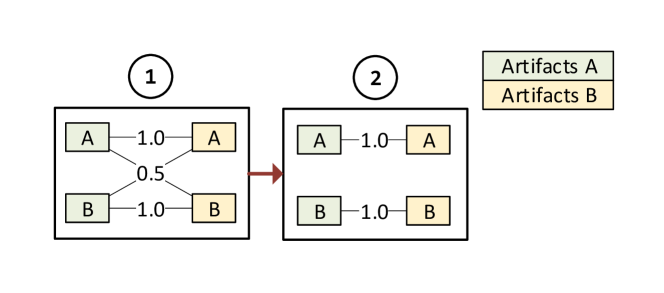
The resulting similarity tree is processed to match each element of the one input model to at most one element of the other input model. This matching is important, as the relations identified during the comparison are usually ambiguous as elements can be contained in multiple pairs. For instance, the children of the variables option ( in Figure 12) are all pairwise combinations of the input models’ variables. The result contains the triples , , , , which are visualized as a completed, weighted, bipartite graph ( in Figure 13). Every node on the left is connected with all nodes on the right and vise versa. During the matching phase, the graph is filtered and afterward contains only element-pairs with the highest similarity, also known as an independent edge set. Therefore, we use an approximation algorithm that sorts the edge set by similarity and picks the elements with the highest similarity. After that, selected elements are marked to prevent them from being selected again. in Figure 13 shows the calculated matching of our example. Finally, we can update the solution and get a similarity of 100% between both models as expected because we compared a model with itself.
3.5 Presentation of the Result
The last step in our process is the presentation. In contrast to other clone detection approaches that present results as and edit script, we visualize the results as a family model [25]. Family models represent the variable architecture of product lines independently of the programming or modeling languages. It is a comprehensible representation of commonalities and differences between artifacts. A further advantage of a family model is that it is possible to derive a domain-level feature model from it. A family model contains three different element types: mandatory, optional, and alternative are assigned using an adjustable threshold of . Mandatory elements are marked with an exclamation mark and have a similarity value larger than , which means that they are common in both models or code clones. Optional elements are marked with a question mark and have a similarity of zero, which means that they are only contained in either of the two variants or code fragments. The last element type is alternative, which is marked with a left and right arrow and assigned when . Alternative elements are similar to each other but not equal, as is the case after a smaller code modification.
3.6 Summary
In this section, we showed our approach for the detection of fine-grained changes between implementation artifacts. This approach can detect code clones in variants and detect variability between variants. Based on the parsing process, Type I clones are detectable due to the code normalization utilized by the lexer. Type II clones can be detected based on utilized attributes that compare different properties of the respective implementation artifacts, such as the name of the type or more specific attributes. The detection of Type III clones in fine-grained elements such as a statement with a changed expression can be detected with attributes. Cloned code fragments are visualized in the family model with the . These elements result from the similarities of their nested artifacts and can show changes on cloned code and differences between two variants. This clone detection can be used to detect variation points between two variants.
4 Implementation
In order to evaluate our approach, we implemented it in a publicly available tool we call the Variability Analysis Toolkit (VAT)333https://github.com/TUBS-ISF/IEC_61131_3_Clone_Detection.
4.1 Implementation Techniques
Meta models that describe the IEC 61131-3 project structure are created with the Eclipse Modeling Framwork (EMF), which utilizes Ecore. Ecore is a meta-model that represents an implementation of the Essential Meta-Object Facility (EMOF), which is a subset of the Meta-Object Facility™ (MOF)444www.omg.org/mof, a modeling standard defined by the Object Managment Group (OMG)555www.omg.org. To transform PLCOpenXML into a model representation, we created a parser using ANother Tool for Language Recognition (ANTLR)666www.antlr.org, which generates a lexer and a parser based on a grammar file.
The data structures, as well as the compare engine, are implemented using Java 8. The prototype is developed as Rich Client Platform (RCP) client based on the Eclipse 4.0777www.eclipse.org framework and runs on Windows888www.microsoft.com with a Java Virtuel Machine (JVM). All parts of the VAT are plug-ins that are reusable in other applications.
All meta-models, grammar files, and plug-ins with their source code are freely available in our online materials999https://github.com/TUBS-ISF/IEC_61131_3_Clone_Detection.
4.2 The Variability Analysis Toolkit
The VAT is a tool that supports domain experts with the analysis of IEC 61131-3 programs. In order to improve the usability of our approach, we implemented a graphical user interface that supports domain experts during every step of our approach.
4.2.1 Metric Definition
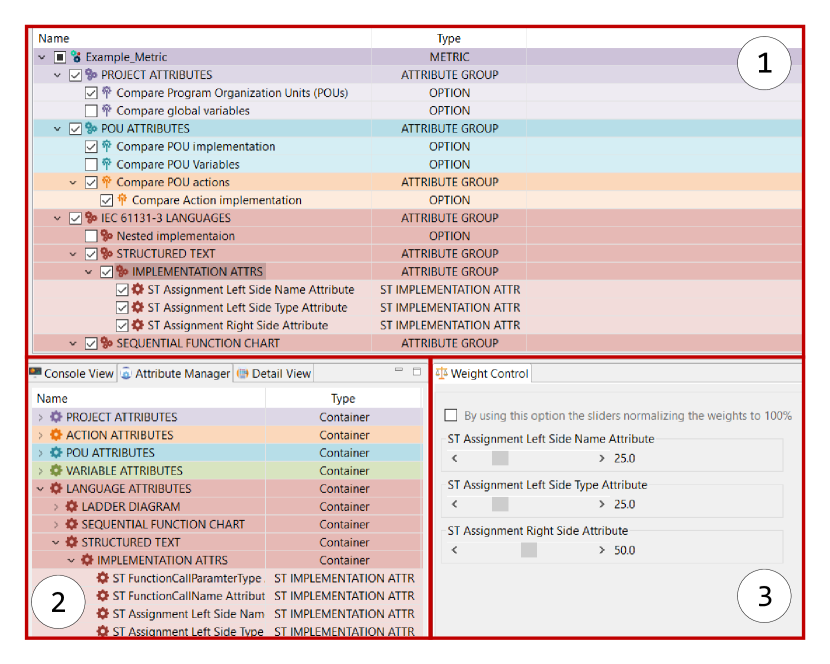
A screenshot of the interface for the definition of the comparison metric is shown in Figure 15. The metric definition is supported by the Metric Manager . In the Metric Manager, we can see the base structure of a metric, which contains options that allow us to enable and disable parts of the comparison approach. Attributes can be selected in the Attribute Manager , which contains 66 predefined attributes that are sorted by artifact categories. For the comparison of fine-grained artifacts we implemented 29 attributes in total, that can compare fine-grained implementation artifacts such as single statements or function blocks. We implemented 11 attributes for the comparison of ST, 6 attributes for SFC, 5 attributes for LD, and 7 attributes for FBD. To adjust the weights of options and attributes, which express their impact on the comparison process, we can use the Weight Controller . Metrics can be stored and exchanged, which allows domain experts to discuss utilized metrics.
4.2.2 Comparison and Presentation
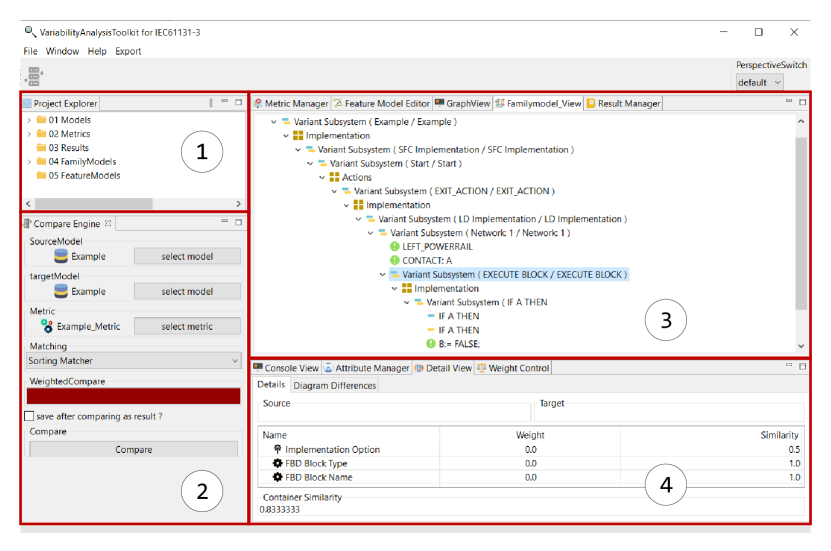
A screenshot of the comparison process and the presentation of the results is sown in Figure 16. To start the comparison approach, at least one model from the project explorer must be selected. In a context menu, the user can then select if an intra or inter variant clone detection shall be performed, which changes the selected models’ decomposition process. After selecting the comparison mode, the compare engine shows, and the user can select a metric and decide if it wants to compare weighted or not.
After the comparison, the results are presented in family model . The comparison details, such as element similarities per attribute, can be inspected using the Detail View . This view shows utilized attributes, options, and their weights as well as the resulting similarity value and supports experts in the comprehension of the created results.
5 Evaluation
We evaluated different aspects of our clone detection approach. The correctness, measured in precision and recall, of results are crucial for detecting code clones within software variants and analyzing commonalities and differences between software variants. Otherwise, incorrectly matched elements inevitably compromise subsequent steps such as refactoring code clones into library components or consolidating a set of variants into an SPL. Thus, analyzing the results concerning their correctness is an essential goal of our evaluation. Another key aspect for the productive use of the toolkit is its scalability in terms of run time and memory consumption.
5.1 Research Questions
Based on the requirements we identified to be relevant, we defined the following research questions (RQs) that we address in this evaluation:
RQ1 Correctness: With what precision and recall can we detect code clones in arbitrarily nested IEC 61131-3 programming languages?
-
1.
RQ 1.1: What is the impact of different comparison metrics on precision and recall?
RQ2 Scalability: Does the clone detection approach scale?
-
1.
RQ 2.1: Is the run time of the comparison approach within reasonable bounds?
-
2.
RQ 2.2: Is the memory consumption of the comparison approach within reasonable bounds?
RQ3 Usefulness: How useful is the approach when applied to realistic industrial subject systems?
- 1.
-
2.
RQ 3.2: How many clones per type can be identified during the evolution of the PPU and xPPU scenarios?
5.2 Setup
We evaluated our approach on an Intel Core i7-3770k (3,5 GHz) with 16 GB of RAM, running Windows 10 64bit. We utilize two different comparison metrics. On the one hand, we use a coarse-grained metric that compares the implementation using attributes that count the number of specific artifacts, such as how many steps are in an SFC implementation. On the other hand, we use a fine-grained metric to detect fine-grained changes between single statements, such as an extended condition. This lets us draw conclusions on the impact of a fine-grained comparison metric in comparison to a coarse-grained comparison metric. All weights for the options and attributes are chosen with our intuition of importance. For example, the implementation of POUs has more impact on their similarity than their variable declarations. In the following, we show all metrics employed in this evaluation in detail with their respective attributes and options.
Base Metric
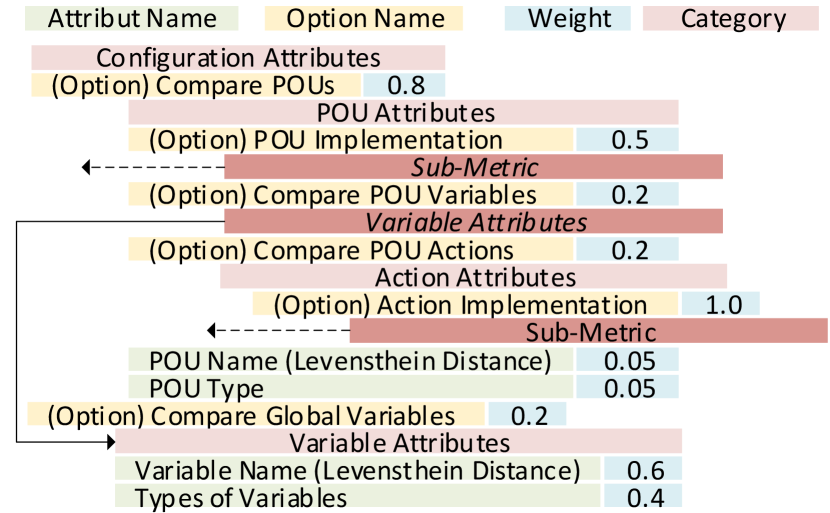
Driven by the base metric, the comparison process decomposes models from POU level down to fine-grained implementation artifacts such as statements. The base metric is not used in the evaluation directly. Instead, it represents the common base for the following metrics that extend it. Figure 17 shows the base metric, which contains mostly options. The black arrows on the left side indicate pointers to avoid redundancy and to support language nesting. For example, the variable attributes used in the POU variables option are the same as the variable attributes used in the global variables option. Therefore, we simply place a pointer from the former to the latter. The dashed, black arrows on the left side indicate pointers to options and attributes in sub-metrics.
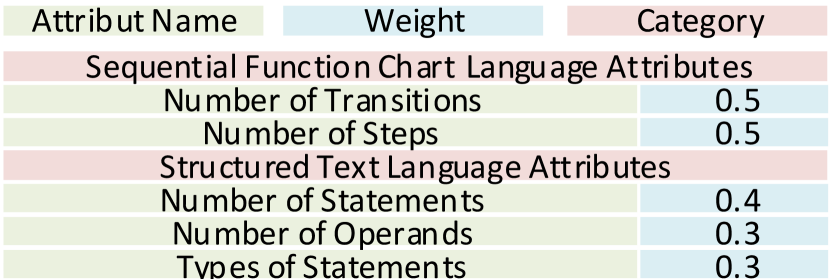
Coarse-grained Metric
This metric is based on our previous work [26] and extends the base metric with attributes for the comparison of languages as illustrated in Figure 18.
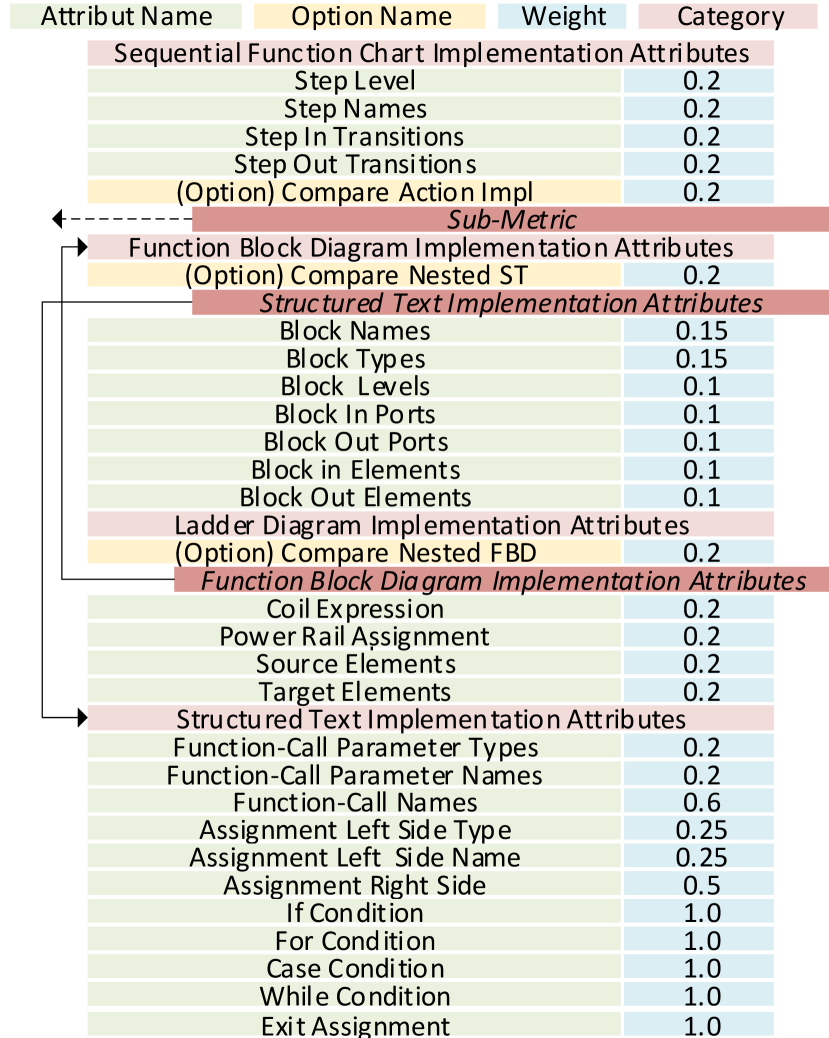
Fine-grained Metric
The fine-grained metric extends the base metric with further attributes and options for the comparison of IEC 61131-3 languages. In contrast to the coarse-grained metric, it compares fine-grained artifacts with each other and can detect fine-grained changes such as additional expressions in a condition. It also contains additional options for the comparison of nested artifacts. Figure 19 shows all selected options and weighted attributes. Again, the black arrows on the left indicate pointers. For example, a LD implementation can contain nested FBD, as indicated by the Compare Nested FBD option. Therefore, underneath the option Compare Nested FBD we place a pointer to the FBD Implementation category of the metric. These, in turn, contain an option Compare Nested ST with a pointer to the ST Implementation category of the metric.
5.3 Subject Systems
To evaluate our approach for the detection of intra variant as well as inter variant clone detection, we use the Pick and Place Unit (PPU) and Extended Pick and Place Unit (xPPU) scenarios. The PPU handles and manipulates work pieces of different material. It is a universal demonstrator for the study of evolution of aPS [27]. It consists of 23 evolutionary steps, each referred to as a scenario. All used PPU and xPPU scenarios are IEC 61131-3 projects exported in the PLCOpenXML format. The scenarios were created using TwinCat3 [21].
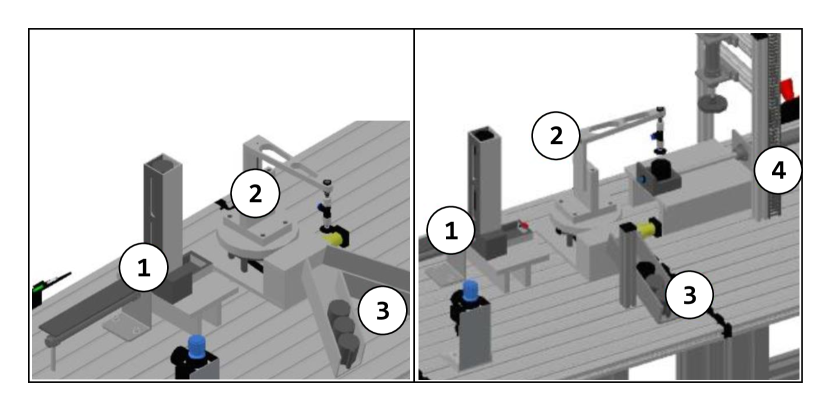
Figure 20 shows the first PPU scenario on the left and the third PPU scenario on the right. Scenario 1 of the PPU consists of a stack that serves as input storage for workpieces a crane utilized for the transportation of workpieces and a ramp as a workpiece output storage. These parts can be found in the third scenario, as well. In the third scenario, a stamp was added to stamping workpieces. The introduced functionality to stamp workpieces induces an adaption of the underlying software in response to the hardware changes. For each scenario a PLC implementation is available, which utilize ST and SFC as programming languages. These scenarios contain language nesting between ST and SFC, which are actions that are called in SFC and implemented in ST. Further information on the PPU and the respective evolution of the scenarios can be found in [27].
5.4 Methodology
The evaluation is divided into two parts: a quantitative and a qualitative analysis. During the quantitative analysis, we measure correctness and scalability. To determine the correctness (RQ1), we measure the precision and recall. The measurement of recall and precision is difficult for tool developers due to a lack of case studies with an existing ground truth [28, 5]. Therefore, we decided to employ a mutation-based strategy. We implemented a mutation framework for IEC 61131-3 based programs. The mutation framework is integrated into the VAT and available on GitHub101010https://github.com/TUBS-ISF/variability_analysis_toolkit_iec.
The evaluation is driven by a evaluation-cycle shown in Figure 21.
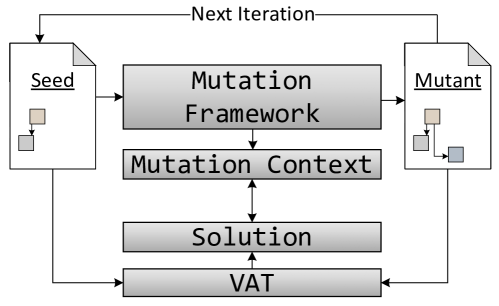
The process starts with a randomly selected model of the PPU and xPPU scenarios, which serves as a seed for the mutation process. Our mutation framework creates an exact copy of this seed model and randomly injects mutations. We defined 11 mutation-operators for the mutation to add or remove artifacts and change identifiers or expressions. All mutations are based on the meta-model representation that reflects the IEC 61131-3 standard and generates syntactically correct artifacts. Changes are stored as pairs in the mutation context: . Mutated scenarios can be stored as models and the mutation context as JSON files, allowing to generate cloned variants with existing ground truth. To evaluate our approach, we devised an automated process, which generates mutants, compares them, and calculates the precision and recall. The process generates a mutant out of a selected seed model and stores all changed artifacts in a mutation context. Seed model and mutant model are compared using the VAT. Changed elements are collected out of the resulting solution data-structure and compared with the mutation context. The precision and recall are measured for only the injected/changed artifacts. We use the following definition for the interpretation of our results: Changed artifacts within the mutation context and solution data-structure are true positives (TP). Changed artifacts in the solution data-structure, but not in the mutation context are false positives (FP). Artifacts that are only in the mutation context and not in the solution data-structure are false negatives (FN). For the calculation of the precision and recall, we use the following definitions:
To evaluate the scalability (RQ2) of the VAT, we measure run time and memory consumption during the comparison approach in relation to the system size.
The second part of our evaluation is the qualitative analysis, which gives insight into the usefulness (RQ3) of the VAT. We perform a pairwise comparison of each PPU and xPPU scenario using the coarse-grained as well as the fine-grained metric. To evaluate our approach for intra-system clone detection, we perform a clone analysis on the granularity level of POUs for each PPU and xPPU variant. The intra-system clone analysis granularity is adjustable, for example to POU level or even finer-grained implementation level. For the purpose of this evaluation, we decided to visualize the results on the granularity level of POUs, as it is well-suited for a re-engineering workflow towards planned reuse of IEC 61131-3 legacy software [29].
5.5 Results and Discussion
In this section, we present and discuss the results of our quantitative and qualitative evaluation.
5.5.1 Quantitative Analysis: Correctness (RQ1)
To evaluate correctness, we use our mutation framework to fully automatically compute recall and precision using a standard mutation-based analysis procedure. As per standard for mutation analysis, the framework is configured to only use one category of mutations, i.e., either only T2 mutations such as renaming of artifacts, or only T3 mutations such as insertions or deletions of artifacts, per model. We perform two runs with 10000 iterations each, to determine the precision and recall for Type II and Type III mutations respectively. We also calculate the overall precision an recall over all types of mutations. Due to the parsing process which normalizes the PLCOpenXML files, we cannot detect Type I mutations, and thus not distinguish Type I and Type II clones.
| Fine T2 | Coarse T2 | Fine T3 | Coarse T3 | Fine Total | Coarse Total | |
| True Positives | 7738 | 686 | 9991 | 6852 | 17729 | 7538 |
| False Positives | 0 | 0 | 0 | 44 | 0 | 44 |
| False Negatives | 2262 | 9314 | 9 | 3148 | 2271 | 12462 |
| Precision-Total | 100 | 100 | 100 | 99,36 | 100 | 99,42 |
| Recall-Total | 77,38 | 6,86 | 99,91 | 68,52 | 88,65 | 37,69 |
In Table 1, we show the precision and recall measures.
The coarse-grained metric achieves a precision of 100% for the analysis of Type II clones but only a recall of 6,86%. Only coarse changes on configuration or POU level could be detected. Renaming of implementation artifacts could not be detected due to the fact that elements are only counted and not compared directly. For the analysis of Type III clones, the coarse metric achieves a higher recall of 68,52%, as added or removed artifacts result in a changed similarity value during the comparison between those elements and can thus be detected. Overall, the coarse-grained metric achieves a precision of 99,42% and a recall of 37,69%.
The fine-grained metric achieves better results, as expected. For the analysis of Type II clones, precision is at 100% and recall at 77,38%. A detailed analysis of the resulting mutants showed that the VAT, using the fine-grained metric for the comparison, had problems with the renaming of some elements such as the returning type of a POU within the Type II run. To improve the recall value in this case, additional attributes are needed for the comparison of POUs that consider those elements. For the detection of Type III clones, the VAT achieved a precision of 100 % and a recall of 99,91%. Some variable insertions and removals could not be detected, causing all 9 false negatives. Overall, our approach achieved a precision of 100% and a recall of 88,65% using the fine-grained metric, which are excellent precision and recall values.
The fine-grained metric could, in contrast to the coarse-grained metric, detect changes on the implementation level, such as renamed, added, or removed statements. We conclude that, based on a coarse-grained metric, IEC 61131-3 systems can be analyzed only on an abstraction level where the correct position of cloned artifacts is not essential, which is why the coarse-grained metric has such a low recall value. The fine-grained metric is the better choice to get more details about the correct location of code clones. Ultimately, the desired granularity of comparison can be freely configured based on the comparison metric to achieve the desired results. Detected clones are then shown in the family model at a desired level of granularity.
Overall, the used data set together with the achieved results provide strong evidence for the correctness of our approach. Moreover, the created metrics can be automatically evaluated using the mutation framework to assess their feasibility.
5.5.2 Quantitative Analysis: Scalability (RQ2)
Run Time (RQ 2.1)
Reasonable run-times for the analysis of fine-grained variability relations between software variants are required for the productive use of the VAT. To measure the run-time, we use an event-based benchmark system that is already implemented in the VAT. For the comparison, we created a metric that compares all artifacts within the xPPU scenarios.
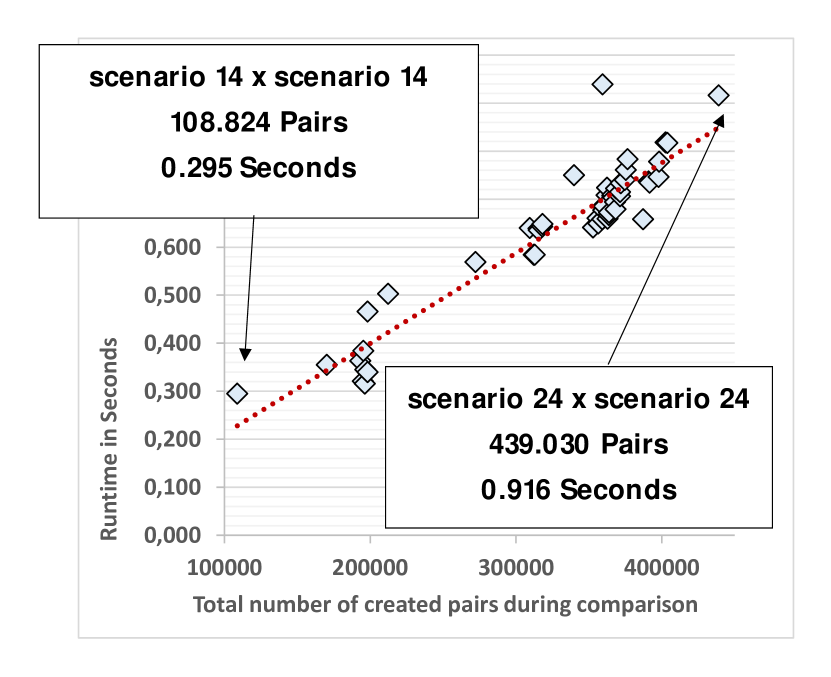
We perform all possible pairwise comparisons of the xPPU scenarios and show the run-time results in Figure 22. The x-axis shows the total number of element pairs that were created during the comparison process, and the y-axis shows the required time for the comparison in seconds. On the left side in Figure 22, we can see the comparison of scenario S14 with itself. Scenario S14 is the smallest scenario of the xPPU scenarios, and the comparison process creates element pairs when compared with itself, which takes seconds. The comparison of the largest xPPU scenario S24 with itself is shown on the right in Figure 22 and in detail in Figure 22. During this comparison, element pairs are created, and it requires seconds. The red line indicates a linear relationship between created element pairs and comparison time.
| Elements | Pairs | Attributes | Comparisons |
|---|---|---|---|
| Projects | 1 | 0 | 0 |
| POU | 2,116 | 2 | 4,232 |
| Actions | 25,663 | 0 | 0 |
| Steps | 207,125 | 4 | 828,500 |
| Statements | 204,126 | 10 | 2,041,260 |
| Overall | 439,030 | 2,873,992 |
To provide more details about the comparison, we count the number of element pairs that are created during the comparison of scenario S24 with itself. This scenario represents the last evolution step of the xPPU scenarios and contains all elements of the scenarios before. In Table 2, we list the number of element pairs that are created and the number of attributes and comparisons. The comparison process creates pairs of steps. These steps are compared with four attributes, which results in over comparisons. Overall, for the comparison of scenario S24 with itself, the compare process creates pairs of elements. In total, to compare both models, million comparisons are made. To reduce the random impact of a non-closed test system, we repeated the run-time measurement ten times and created average values. For the comparison of scenario S24 with itself, the comparison process takes a total time of seconds on average. The trend-line in Figure 22 indicates a linear increase in run-time in relation to artifacts to compare. Hence, we consider the run-time of the VAT as reasonable for the evaluated scenarios.
Memory Consumption (RQ 2.2)
Another key factor for the scalability of software, such as the VAT, is the memory consumption. We assume that, if the VAT is reliably applicable to realistic industrial models, then it is useful to domain experts.
To determine the memory consumption, we use VisualVM that provides insight into the JVM memory dump assigned to a process ID. We perform a scripted pairwise comparison of all PPU scenarios. Specifically, we compare each of the 23 PPU scenarios pairwise, resulting in a total of 276 pairwise comparisons. This means we perform the comparison and matching steps and storage of the family models 276 times. The memory consumption is shown in Figure 23. The orange area represents the allocated heap memory of the JVM. The blue area represents the used heap, i.e., how much memory is actually used by the VAT.
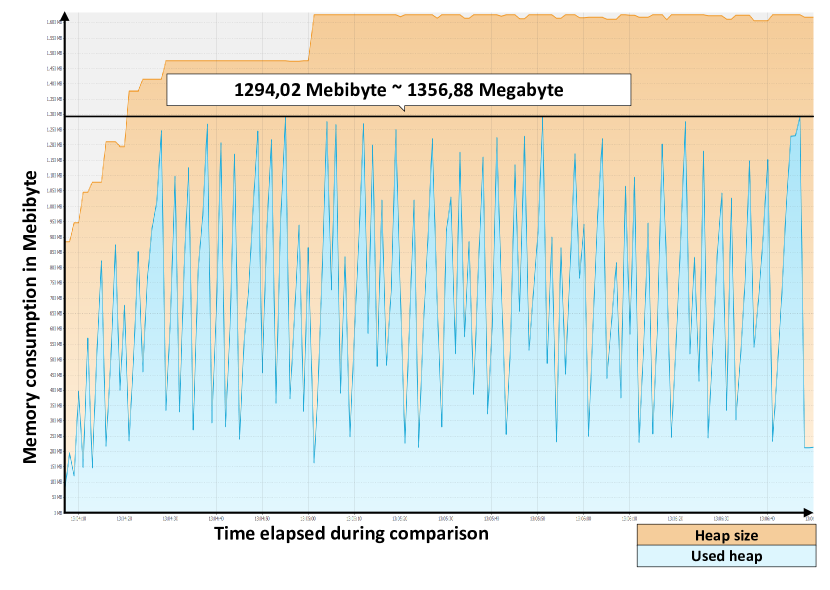
For all 276 comparisons, the process takes 3 minutes and 18 seconds. The initial heap size is MB, and during the comparison, the JVM allocated more memory to a maximum of MB. After each comparison of two models, the family model is created and drawn to the family model view. Each peak in used memory is a result of the drawing process. The maximum amount of memory used depends on the size of the drawn models. Comparison of scenario S1 with itself results in a smaller family model than the comparison between scenario S24 with itself. Consequently, the memory consumption is lower. However, as a maximum value, MB of RAM is used for the pairwise comparison of 23 models. Thus, we conclude that our approach scales for larger models as well.
5.5.3 Qualitative Analysis: Usefulness (RQ3)
Based on the quantitative analysis we could show that the output that is created by the VAT is correct and that the VAT scales well. In this section, we show a qualitative analysis to assess the usefulness of the VAT for the re-engineering of IEC 61131-3 based systems by giving insights into the detected clones in the PPU and xPPU evolution scenarios.
Scenario Similarity (RQ 3.1)
We separately evaluate the overall similarities calculated for each pairwise project comparison for the PPU and xPPU scenario sets. The overall similarity is an indicator of the relationship between projects. We created and analyzed 292 family models for the analysis of PPU and xPPU scenarios in total. In this section, we only provide aggregated data and refer to our supplementary material111111https://github.com/TUBS-ISF/IEC_61131_3_Clone_Detection, which contains all scenarios, metrics, and family models, and the implementation of the VAT.
| % | S2 | S3 | S4a | S4b | S5 | S7 | S8 | S9 | S10 | S11 | S12 | S13 |
|---|---|---|---|---|---|---|---|---|---|---|---|---|
| S1 | 91,21 | 75,05 | 71,52 | 71,51 | 75,08 | 65,97 | 65,97 | 63,1 | 63,1 | 63,1 | 63,1 | 60,32 |
| S2 | 81,31 | 77,41 | 77,39 | 81,34 | 71,11 | 71,11 | 67,83 | 67,83 | 67,83 | 67,83 | 64,79 | |
| S3 | 94,86 | 94,88 | 99,96 | 86,19 | 86,06 | 81,50 | 81,5 | 81,50 | 81,57 | 77,60 | ||
| S4a | 99,58 | 94,82 | 89,46 | 89,33 | 84,65 | 84,65 | 84,65 | 84,65 | 80,90 | |||
| S4b | 94,84 | 89,48 | 89,35 | 84,67 | 84,67 | 84,67 | 84,67 | 80,89 | ||||
| S5 | 86,16 | 86,03 | 81,48 | 81,47 | 81,47 | 81,47 | 77,58 | |||||
| S7 | 99,86 | 94,48 | 94,48 | 94,48 | 94,48 | 88,41 | ||||||
| S8 | 94,55 | 94,55 | 94,55 | 94,55 | 88,48 | |||||||
| S9 | 99,07 | 99,08 | 99,08 | 92,66 | ||||||||
| S10 | 99,86 | 99,78 | 93,33 | |||||||||
| S11 | 99,91 | 93,45 | ||||||||||
| S12 | 93,54 |
| % | S15 | S16 | S17 | S18 | S19 | S20 | S21 | S23 | S24 |
|---|---|---|---|---|---|---|---|---|---|
| S14 | 78,33 | 72,40 | 68,90 | 67,58 | 65,43 | 55,45 | 52,17 | 51,46 | 51,09 |
| S15 | 91,43 | 86,54 | 84,82 | 81,15 | 67,8 | 63,61 | 62,64 | 62,22 | |
| S16 | 94,51 | 92,57 | 88,22 | 73,34 | 68,63 | 67,56 | 67,14 | ||
| S17 | 97,18 | 91,73 | 76,07 | 71,18 | 70,05 | 69,63 | |||
| S18 | 93,87 | 77,75 | 72,74 | 71,58 | 71,16 | ||||
| S19 | 82,56 | 77,20 | 75,94 | 75,40 | |||||
| S20 | 93,64 | 92,02 | 91,49 | ||||||
| S21 | 98,20 | 96,46 | |||||||
| S23 | 96,70 |
In Table 3 and Table 4, we show all pairwise similarities for the comparison of the PPU and xPPU scenarios. In both cases, the similarity decreases in every row from left to right, which is plausible and can be explained by the increasing divergence of scenarios that are further apart in time.
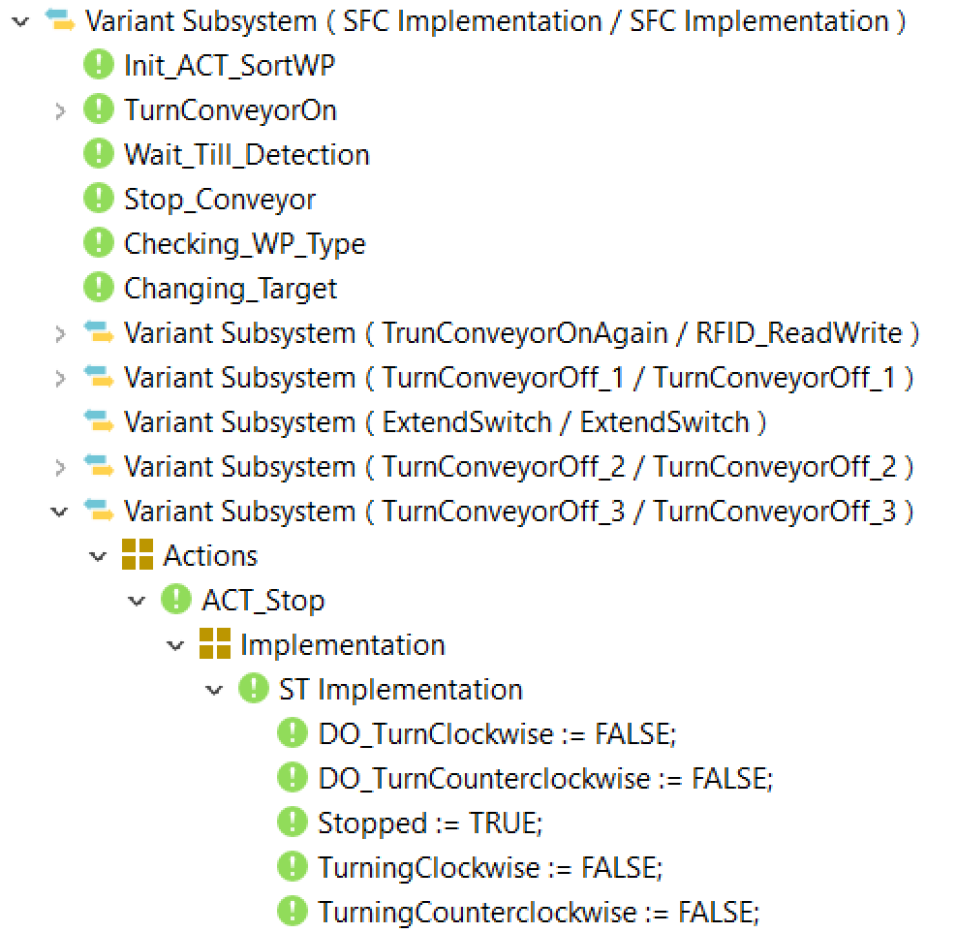
In Figure 24, we show a fragment of the resulting family model of comparing scenarios S23 and S24. The TurnConveyorOff_3 step, which is used by the SFC implementation, calls an action that is implemented in ST. The resulting family model shows that the nested action could be matched, which results in a mandatory element. Moreover, we could analyze different scenarios that show different kinds of language nesting, such as a utilized function block in a LD implementation or a ST implementation in a function block. Hence, we argue that our comparison approach can detect and compare nested implementations and that it is useful in real-world scenarios.
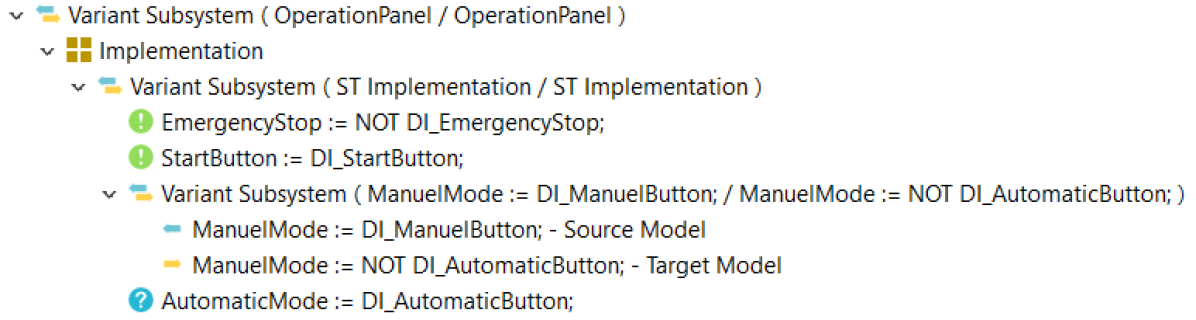
Overall, we were able to detect fine-grained changes such as parts of a statement like renaming of a function or an additional literal in an expression. In Figure 25, we show a snippet that shows the resulting family model of the comparison between scenarios S14 and S23. We can see a variation point between both OperationPanel POUs, which contains two mandatory , a changed , and an additional assignment. We investigated this change and found that it can be explained with a renaming of the DI_ManuelButton into DI_AutomaticButton. We analyzed all resulting family models and the respective PLCOpenXML files to manually verify our results and found them to be sensible.
| % | S2 | S3 | S4a | S4b | S5 | S7 | S8 | S9 | S10 | S11 | S12 | S13 |
|---|---|---|---|---|---|---|---|---|---|---|---|---|
| S1 | -1,07 | -1,92 | -1,82 | -1,81 | -1,92 | -1,77 | -1,77 | -1,85 | -1,85 | -1,85 | -1,85 | -1,43 |
| S2 | -1,45 | -1,38 | -1,38 | -1,45 | -1,44 | -1,44 | -1,61 | -1,61 | -1,61 | -1,61 | -1,43 | |
| S3 | -0,02 | -0,01 | 0,00 | -0,57 | -0,57 | -1,00 | -1,00 | -1,00 | -1,00 | -0,61 | ||
| S4a | -0,02 | -0,02 | 0,32 | 0,32 | -0,15 | -0,15 | -0,15 | -0,15 | 0,21 | |||
| S4b | -0,01 | 0,33 | 0,33 | -0,14 | -0,14 | -0,14 | -0,14 | 0,29 | ||||
| S5 | -0,57 | -0,57 | -1,00 | -1,01 | -1,01 | -1,01 | -0,6 | |||||
| S7 | 0,00 | -0,54 | -0,54 | -0,54 | -0,54 | -1,7 | ||||||
| S8 | -0,54 | -0,54 | -0,54 | -0,54 | -1,7 | |||||||
| S9 | -0,01 | -0,01 | -0,01 | -1,20 | ||||||||
| S10 | -0,01 | -0,02 | -1,21 | |||||||||
| S11 | -0,01 | -1,20 | ||||||||||
| S12 | -1,19 |
| lowest similarity | min | -3 | -2 | -1 | 0 | 1 | 2 | 3 | max | highest similarity |
| % | S15 | S16 | S17 | S18 | S19 | S20 | S21 | S23 | S24 |
|---|---|---|---|---|---|---|---|---|---|
| S14 | -1,43 | -1,32 | -1,43 | -1,2 | -2,25 | -1,62 | -1,51 | -1,48 | -1,39 |
| S15 | -0,21 | -0,53 | -0,19 | -1,91 | -1,36 | -1,26 | -1,24 | -1,17 | |
| S16 | -0,38 | -0,01 | -2,08 | -1,5 | -1,39 | -1,36 | -1,29 | ||
| S17 | -0,36 | -3,00 | -2,22 | -2,07 | -2,02 | -1,95 | |||
| S18 | -2,95 | -2,18 | -2,03 | -1,98 | -1,91 | ||||
| S19 | 0,14 | 0,14 | 0,13 | 0,22 | |||||
| S20 | 0,00 | 0,00 | 0,09 | ||||||
| S21 | -0,04 | -0,81 | |||||||
| S23 | -1,51 |
| lowest similarity | min | -3 | -2 | -1 | 0 | 1 | 2 | 3 | max | highest similarity |
To investigate the impact of a fine-grained metric on the overall similarity, we created a heat-map that shows how the similarity values change between the comparison with fine-grained implementation artifacts with the fine-grained metric, compared to the coarse-grained metric that compares languages with count metrics. In Table 5 and Table 6 we illustrate these maps for the PPU and xPPU scenarios. Red-colored cells show that the fine-grained metric results in a lower similarity value than using the coarse-grained metric. A green-colored cell means that the resulting similarity is higher. As we can see, most of the cells are colored red, which means that the comparison utilizing the fine-grained comparison metric results in a lower similarity, e.g., the similarity between S17 and S19 is 3 percent lower. We analyzed the resulting family models to explain and discuss this behavior. For example, when we compare the scenarios S17 and S19, we can see that the Main POU implementation of S17 contains 93 statements and the scenario S19 95 statements. With a simple statement count metric, which relates the statements, we obtained a similarity of . In contrast, the fine-grained comparison metric compares every single statement. In this case, we have 32 mandatory , 61 altered statements, and 2 optional statements. Based on the changes, the resulting similarity between these implementations using a fine-grained metric is . Moreover, the comparison of nested languages can lower the similarity based on changed artifacts in the nested implementations. In the case that the nested artifacts are not altered, the overall similarity would not change. Still, in the case that the nested artifacts are changed, it would yield a lower similarity. Hence, we conclude that fine-grained metrics lower the overall similarity if fine-grained artifacts are altered. When only adding or removing artifacts, the coarse-grained metric will capture the similarity correctly as well.
Cloned POUs in the PPU and xPPU Scenarios (RQ 3.2)
A common approach to evolve systems is code cloning. We analyzed each of the PPU and xPPU scenarios to identify possible cloned POUs. To filter our results, we used a similarity threshold of 70%, which means all artifacts that have a similarity lower than the threshold are not considered. For each scenario, we performed a pairwise POU comparison, which results in an analysis of 354 family models for the PPU scenarios and 810 family models for the xPPU scenarios.
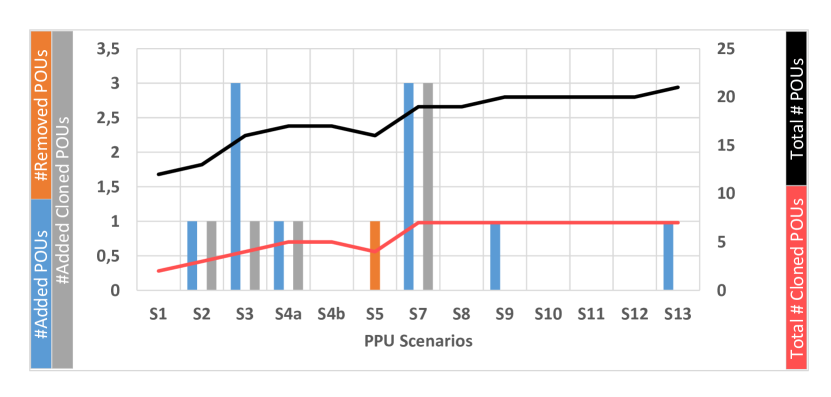
In Figure 26 and Figure 27 we show our aggregated results of the analysis of the PPU and xPPU scenarios. The bars show the changed amount of POUs in the respective evolution step. The blue bar shows how many POUs were added, the orange bar how many were removed, and the gray bar shows how many clones were introduced. Besides, the black trend line shows the amount of POUs in the respective scenario, and the orange trend line shows how many of this POUs are potential clones. The first scenario S1 contains a potential cloned POU which stores the status of the respective POU in a Boolean variable. During the evolution of this system, nine POUs are added, in which 7 are potential clones. For example, in scenario S3, the BistableCylinder is added, a Type III clone of the MonostableCylinder.
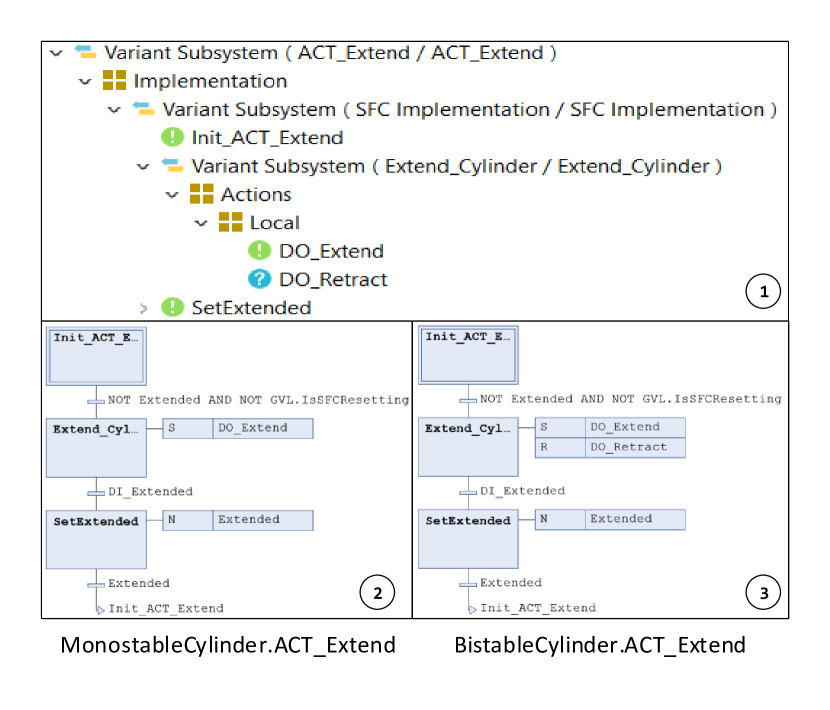
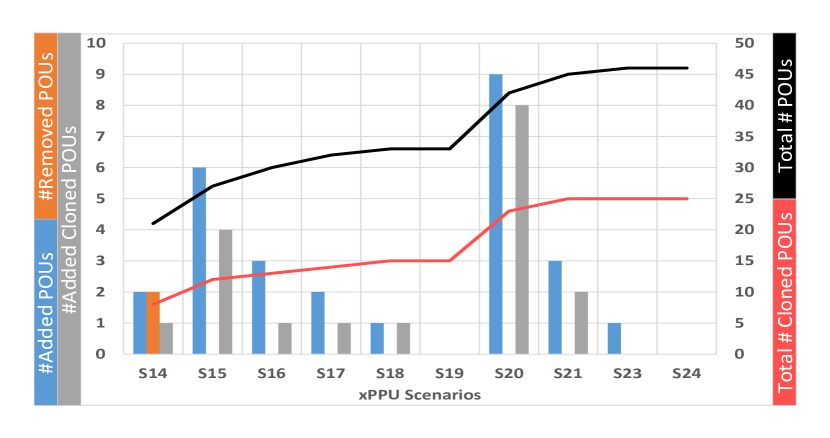
In Figure 28 we depict a snippet of the resulting family model with the respective SFC implementation of the comparison between the MonostableCylinder and BistableCylinder. shows the family model of the ACT_extend action used by both POUs. As we can see, the SFC implementation was altered by adding an action to the Extended_Cylinder step. The difference can be inspected in the respective implementations shown in and . An additional copy of the MonostableCylinder POU is added during the evolution to scenario 15. The only change is a renaming of the POU from Monostable Cylinder to Switch, which can be classified as a type II clone. In scenario 15, the POUs PicAlpha and RefillConveyor are added, which are clones of each other. However, we were able to identify 25 of 46 POUs as potential clones in scenario 24, which represents the last evolution step. Overall, we could detect Type I and Type III clones during the PPU and xPPU scenarios’ evolution.
The intra- and inter-system clone detection approach allows visualization of cloned artifacts within a system and shows variation points between artifacts. That information is useful for the developer to show potential candidates for the extraction of library components, which can be reused in different IEC 61131-3 systems.
5.6 Threats to Validity
This section categorizes the threats to the validity of our results into construct, internal, external, and conclusion validity and identifies the respective threats.
5.6.1 Construct Validity
To measure the precision, we used a mutation framework that generates mutant models. Mutant models are syntactically correct, but we can not guarantee that they are semantically correct. Measured precision and recall may be lower for a real-world subject system.
To identify the performance of our approach, we benchmarked the VAT. Therefore, we performed a run-time measure using the event-based benchmark system provided by the VAT. For memory consumption, we analyzed the memory dump that is created by the VisualVM. Both measures are key factors for the analysis of the scalability and are specially selected to give an insight into the VAT performance. Other measures might also support the results in terms of performance, and other developers might identify more suitable ones. Moreover, in a non-closed system, run-time deviations occur that we can not influence, such as hardware faults. However, we argue that our selection of measures supports the corresponding performance analysis. Furthermore, we measured the run-time several times and used the average value to reduce the deviation.
To investigate our approach’s usefulness, we manually evaluated the results of the VAT using human intuition. The resulting similarity values between element pairs and our matching approach’s results may only make sense for us. The intuition of other researchers or domain experts might be different, such that they question the usefulness of our results. Besides, the metrics we used for comparing IEC 61131 programming languages and their nestings may not be suited to all scenarios.
5.6.2 Internal Validity
All measures we discussed and the data we gathered during the evaluation might be influenced by factors, which we did not consider. This might restrict the validity of the performance measures and the drawn conclusions. However, we carefully analyzed the performance and performed control measures to reduce the random impact factors such as memory scheduling or the code optimization performed by the JVM.
5.6.3 External Validity
We evaluated the comparison approach and especially the attributes by using synthetic case studies that show a representative history of changes. Other scenarios can show different kinds of changes and nesting of languages, which we did not consider and may stay undetected, e.g., changing a statement type by replacing a while-loop with a for-loop. We used the PPU and xPPU case studies to perform the comparative measurement. This case study is only implemented in ST and SFC. Systems of other domains may show other utilized programming languages and language nestings. We argue that evaluated scenarios show a significant complexity and are representative for systems in the domain of aPS.
5.6.4 Conclusion Validity
Our comparison approach for IEC 61131-3 languages is realized using metrics to compare different variants of software systems. Metrics use attributes, options, and weights and are highly configurable. Also, the user can customize the VAT by adjusting different thresholds in the preferences. The configuration of the metric and setup of the VAT largely depends on human intuition and the user’s domain knowledge. Consequently, the metrics we used during the evaluation are not reliable because other developers might select other parameters that can cause different results. However, we argue that the used metrics and settings were created with high caution and are evaluated using a mutation framework. Besides, we explicitly provide the capability to customize metrics and configure the VAT to meet the user’s expectations.
6 Related Work
Clone and own is a common and popular reuse strategy in the software development domain. In the past decades, the interest in code clones is also exhibited in existing research’s wealth. In general, clone-detection aims to reduce large software systems’ maintenance effort by tracing clones or transferring a software system into an SPL [30]. Both activities require a detailed analysis of the respective software systems. Most of the research focused on detecting code clones in high-level programming languages such as C, C++, and Java [1, 5, 6]. However, in the domain of aPS, cloning code is also a common practice [7, 8]. To bridge the gap, we developed a comparison approach that allows detecting clones in and between software variants, which are implemented regarding the IEC61131-3 standard. Our approach relates to two main categories, which are Intra Clone Detection and Variability Analysis or also referred to as Inter Clone Detection.
Intra Variant Clone Detection (Classic Clone Detection)
Different code clone detection approaches have been presented in the last decades. Roy et al. classified clone detection techniques by utilizing internal source code representation, which are text-, token-, tree-, graph and model-based [5]. Kelter et al. [31] show an approach to compare pairs of UML class diagrams. They semantically lift derived differences to enhance comprehensibility. In extension of their work, they utilize State Charts [32]. However, unlike our approach, results are not presented in a family model, in which we present our results. Alanen et al.[33] presented a model comparison of UML models to achieve a model versioning system for MOF-based models. They presented three meta-model independent algorithms to calculate differences, merge and calculate the union of two models, and depend on the UML’s Universally Unique Identifiers. Results of the analysis are presented as deltas, which are used for the merge algorithm.
In the industrial domain, the analysis of behavior and data-flow models such as MATLAB/Simulink models that are often used in the context of Model-driven engineering (MDE) becomes essential. Deissenboeck et al. [34, 35] showed a clone detection approach for model-based languages on MATLAB/Simulink models using a depth-first search heuristic for cloned pairs on a labeled graph that is created out of a model. Pham et al. [36] presented an accurate clone detection approach in graph-based models. Those models are comparable with FBD , which are using transitions to connect blocks to model a behavior. However, both approaches transforming the models into a graph representation in the difference we transform the PLCOpenXML into a model and work directly on them. Alalfi et al. [37, 38] adapted a text-based code clone detection technique to identify clones in the textual representation of Simulink models. A particular issue they have is the graphical representation of results. Our approach uses a solution structure, which can be presented as a family or technical feature model.
Yu et al. present an approach that detects clones in Java using the Smith-Waterman algorithm on Java bytecode [39]. This approach is only suitable for languages that are translated into Java bytecode. In contrast to Java, IEC61131-3 languages are compiled into machine language that is executed directly and not interpreted by a JVM. Hummel et al. show an incremental graph-based clone detection algorithm in [40]. They use a data structure called the clone index to store sub-graphs for efficient matching. Although the relation between statements forms a graph, adding or removing a statement changes the underlying graph. Consequently, the detection is inappropriate for variability mining, as we want to quantify possible clones in terms of similarities. In [41], Kamiya et al. show a clone detection technique that uses transformation rules and a token-based comparison. Their approach is limited and can not use source files written in two or more programming languages. For our case, it is not suitable because IEC61131-3 source files can contain a mix of all four languages. With the rise of deep learning, techniques were presented with a learning-based paradigm. White et al. [42] specified a learning-based approach that utilizes a Recursive Neural Network (RvNN) to detect clones in Java code.
In the domain of aPS only a few researchers analyzed IEC 61131-3 software system. H K et al. [43] proposes a method for detecting semantic clones in IEC61131-3 based systems by performing an input-output variable impact and dependency analysis. Thaller et al. [44] analyzed a real-world PLC software system using an extended version of Simian [45], which is a text-based clone detection tool. The analyzed system is implemented using ST and C++. Fahimipirehgalin et al. [46] presented a call-graph based approach that allows detect similarities between two software structures, e.g., POUs, which support the detection of clones with a pre-selection of potentially similar artifacts. In the field of clone detection on LD Nedvěd et al. [47] presents a tool that can detect differences between LD implementation based on their PLCOpenXML representation. We are the first to analyze IEC61131-3 variants with nested implementations on a fine-grained level to the best of our knowledge.
Inter Variant Clone Detection (Variability Analysis)
The identification of variability in software evolution has been subject to research for several years. However, there are few extractive approaches focused on reverse engineering of legacy systems without feature information. In our prior work, we analyze Pascal programs to identify code clones [48]. We use a model-based approach for the comparison of Pascal variants that compares programs statement-wise. For the comparison of ST implementations, we adopt this approach because both languages have a similar structure. Schlie et al. [49] employ an adjustable matching window technique to enhance variability analysis in MATLAB Simulink models. The windows define a sub-graph on which a data flow based comparison is applied to compare each model. The approach takes hierarchical structures of blocks into account while comparing windows. In contrast to our approach, we strictly compare the four languages’ implementation artifacts within the same hierarchical level. Holthusen et al. [50] showed a family model mining approach for FBD, which is an adaption of their previous work in the automotive domain analyzing MATLAB Simulink models [51, 52]. Both approaches are working on block-based languages, which have a more straightforward structure than textual languages. Moreover, they do not consider the ST implementation that can occur in some function blocks. Duszynski et al. [53], present the Variant Analysis, which is an approach for the individual analysis of multiple software variants. Variants are mapped onto a system structure model. Although the variants are represented as models, they use a string-based comparison approach applied to these variants’ source code. As our model stores elements with their corresponding source code, we support string-based comparisons as well. However, our approach operates on pairs of software variants and compares them to a lower detail level. Fischer et al. [54], present the ECCO (Extraction and Composition for Clone-and-Own) tool, which can automatically locate reusable parts from previously developed variants. The conceptual framework behind ECCO is shown in [55]. The process is divided into three steps: extraction, composition, and completion, while the variability analysis is performed on an artifact tree that allows comparing any artifacts. The ECCO tool compares artifact trees and stops if two nodes are not equal. In contrast to ECCO, our approach determines the changes and compares all sub-elements if it finds differences between artifacts. Finally, our work’s fundamental is the VAT[26] that we extended with our concepts and used to perform the evaluation.
Mutation Framework
For the evaluation of or approach, we implemented a mutation framework that allows to mutate scenarios based on a meta-model and store the mutation context, which can be used as ground truth. The mutation framework is inspired by other authors that also used a mutation based strategy to evaluate their clone-detection approach. Roy et al. [56] proposed an evaluation framework that uses code fragment mutation to create and inject known code clones that can be used to measure recall and precision of clone detection tools accurately. Stephan et al. [57, 58] showed a mutation-based evaluation framework for evaluating the Simulink clone detection approach. Svajlenko et al. [59] introduced Big Clone Bench as a big data, varied and comprehensive clone benchmark for modern tools. In contrast to our work, the existing mutation frameworks use existing code fragments from a repository to inject them into models. We use existing models as a seed and generate artifacts based on our meta-model, reflecting the IEC61131-3 standard. Other authors use mutation frameworks in another context, such as software testing. Just [60] showed Major, a framework for the mutation analysis and fault seeding to evaluate software test suits.
7 Conclusion and Future Work
With an increasing interest in variant variety for industrial products, variability has become a key factor of many software systems. In the domain of aPS and their control, software often remains in use for decades. To reduce such a system’s maintenance effort, the detection of clones and analysis of variability is crucial. On the one hand, code-clones can be refactored into reusable artifacts such as library components. And on the other hand, the variability analysis can support experts in migrating a system portfolio into an SPL. To this end, the identification of code clones and the detection of variability in the domain of aPS is a remaining challenge that requires appropriate tool support. A key feature of such tools is a fine-grained analysis of implementation artifacts to provide useful results to domain experts.
This paper proposed a comparison approach for IEC 61131-3 languages to detect fine-grained changes between variants (Inter Clone Detection) and within a variant (Intra Clone Detection). We implemented our comparison approach in the VAT tool. To compare fine-grained implementation artifacts, we implemented 29 attributes and added options to compare nested implementation languages. We evaluated our concept based on our implementation.
To assess our concept, we performed a qualitative and quantitative analysis. The quantitative analysis allows us to reason about the correctness and performance of our approach. Therefore, a mutation framework was implemented, which generates mutants that for automatic evaluation of the VAT. We applied a fine-grained and a coarse-grained metric and compared their impact on precision and recall. To argue about the performance and scalability, we measured the run-time and memory consumption.
To show our clone-detection approach’s usefulness as a step during the re-engineering of legacy aPS systems, we used two metrics during the qualitative analysis and applied them to all pairwise comparisons of the PPU and xPPU scenarios. We showed the similarities for the PPU and xPPU scenarios and what impact the different granularities of metrics have on the similarity values and the precision and recall.
Moreover, we evaluated the detection and comparison of nested implementation languages. In general, we conclude that our comparison approach with a fine-grained metric has excellent precision and recall values and can detect changed artifacts of nested implementations. Overall, the evaluation shows that our approach can detect fine-grained changes between and within IEC 61131-3 implementations down to fine-grained artifacts such as statements.
Our work provides several possibilities for future work. To this point, we can only compare, match, and merge two variants. For the generation of a 150% model, it is crucial to extend our approach to cope with multiple input models. This allows us to merge a complete variant portfolio and reduce the effort of migrating such systems. Based on the clone detection results, we try to establish a semi-automatic refactoring of code-clones into reusable artifacts such as library components. An additional field of interest is improving our mutation framework with more complex mutation operations. More configuration possibilities such as only ST or SFC mutations would allow assessing the precision and recall of the clone detection for a single language. This would help compare our approach with other solutions that only support the comparison of a subset of our approach. Moreover, it eases the assessment of code detection tools and calculates precision and recall, but it can also be used to assess test suits.
- aPS
- automated production system
- SPL
- software product line
- POU
- program organization unit
- JVM
- Java Virtuel Machine
- PLC
- programmable logic controller
- ST
- Structured Text
- FBD
- Function Block Diagram
- LD
- Ladder Diagram
- SFC
- Sequential Function Chart
- VAT
- Variability Analysis Toolkit
- PPU
- Pick and Place Unit
- xPPU
- Extended Pick and Place Unit
- IL
- Instruction List
- MOF
- Meta-Object Facility™
- EMOF
- Essential Meta-Object Facility
- OMG
- Object Managment Group
- ANTLR
- ANother Tool for Language Recognition
- RCP
- Rich Client Platform
- EMF
- Eclipse Modeling Framwork
- UML
- Unified Modeling Language
- RvNN
- Recursive Neural Network
- UUID
- Universally Unique Identifier
- MDE
- Model-driven engineering
References
- [1] M. Mondal, C. K. Roy, K. A. Schneider, A survey on clone refactoring and tracking, Journal of Systems and Software.
- [2] S. Fischer, L. Linsbauer, R. E. Lopez-Herrejon, A. Egyed, Enhancing clone-and-own with systematic reuse for developing software variants, in: 2014 IEEE International Conference on Software Maintenance and Evolution, 2014, pp. 391–400.
- [3] F. Deissenboeck, B. Hummel, E. Juergens, Code clone detection in practice, in: 2010 ACM/IEEE 32nd International Conference on Software Engineering, Vol. 2, 2010, pp. 499–500.
- [4] Q. U. Ain, W. H. Butt, M. W. Anwar, F. Azam, B. Maqbool, A systematic review on code clone detection, IEEE Access 7 (2019) 86121–86144.
- [5] C. K. Roy, J. R. Cordy, A survey on software clone detection research, Queen’s School of Computing TR 541 (115) (2007) 64–68.
- [6] S. Bellon, R. Koschke, G. Antoniol, J. Krinke, E. Merlo, Comparison and evaluation of clone detection tools, IEEE Transactions on software engineering 33 (9) (2007) 577–591.
- [7] Z. Durdik, B. Klatt, H. Koziolek, K. Krogmann, J. Stammel, R. Weiss, Towards sustainability guidelines for long-living software systems, in: ICSM, 2012, pp. 517–526.
- [8] C. Legat, J. Folmer, B. Vogel-Heuser, Evolution in Industrial Plant Automation: A Case Study, in: IECON, 2013, pp. 4386–4391.
- [9] International Electrotechnical Commision, Programmable Logic Controllers – Part 3: Programming Languages (2009).
- [10] B. Vogel-Heuser, F. Ocker, Maintainability and evolvability of control software in machine and plant manufacturing—an industrial survey, Control Engineering Practice 80 (2018) 157–173.
- [11] S. Bougouffa, B. Vogel-Heuser, J. Fischer, I. Schaefer, H. Li, Visualization of variability analysis of control software from industrial automation systems, in: 2019 IEEE International Conference on Systems, Man and Cybernetics (SMC), IEEE, 2019, pp. 3357–3364.
- [12] L. Northrop, Software Product Lines: Practices and Patterns, Addison-Wesley, 2002.
- [13] J. Fischer, S. Bougouffa, A. Schlie, I. Schaefer, B. Vogel-Heuser, A qualitative study of variability management of control software for industrial automation systems, in: 2018 IEEE International Conference on Software Maintenance and Evolution (ICSME), IEEE, 2018, pp. 615–624.
- [14] H. P. Breivold, S. Larsson, R. Land, Migrating industrial systems towards software product lines: Experiences and observations through case studies, in: 2008 34th Euromicro Conference Software Engineering and Advanced Applications, 2008, pp. 232–239.
- [15] C. Krueger, Easing the transition to software mass customization, in: International Workshop on Software Product-Family Engineering, Springer, 2001, pp. 282–293.
- [16] B. Vogel-Heuser, J. Fischer, E.-M. Neumann, S. Diehm, Key maturity indicators for module libraries for plc-based control software in the domain of automated production systems, IFAC-PapersOnLine 51 (11) (2018) 1610–1617.
- [17] I. Iec, 61131-3: Programmable controllers–part 3: Programming languages, International Standard, Second Edition, International Electrotechnical Commission, Geneva 1 (2003) 2003.
- [18] R. Ramanathan, The iec 61131-3 programming languages features for industrial control systems, in: 2014 World Automation Congress (WAC), IEEE, 2014, pp. 598–603.
- [19] K. H. John, M. Tiegelkamp, Iec 61131-3: Programming industrial automation systems concepts and programming languages, requirements for programming systems, decision-making aids (2010).
- [20] R. W. Lewis, Programming industrial control systems using IEC 1131-3, Iet, 1998.
- [21] Twincat3 by beckhoff automation gmbh co. kg, url = https://www.beckhoff.com/de-de/produkte/automation/twincat (2020).
- [22] D. L. Parnas, On the design and development of program families, IEEE Transactions on software engineering (1976) 1–9.
- [23] D. Parmeza, S. Punnekkat, S. Baumgart, Cost and efforts in product lines for developing safety critical products–an empirical study (2015).
- [24] M. M. Alam, A. I. Khan, A. Zafar, A comprehensive study of software product line frameworks, International Journal of Computer Applications 151 (3).
- [25] D. Beuche, Variants and variability management with pure:: variants, in: 3rd Software Product Line Conference (SPLC 2004), Workshop on Software Variability Management for Product Derivation, Boston, MA, 2004.
- [26] A. Schlie, K. Rosiak, O. Urbaniak, I. Schaefer, B. Vogel-Heuser, Analyzing variability in automation software with the variability analysis toolkit, in: Proceedings of the 23rd International Systems and Software Product Line Conference-Volume B, 2019, pp. 191–198.
-
[27]
Technical University in Munich, Germany - Institute of Automation and
Information Systems, The pick and
place unit demonstrator for evolution in industrial plant automation (2003).
URL http://www.ppu-demonstrator.org - [28] C. K. Roy, M. F. Zibran, R. Koschke, The vision of software clone management: Past, present, and future (keynote paper), in: 2014 Software Evolution Week-IEEE Conference on Software Maintenance, Reengineering, and Reverse Engineering (CSMR-WCRE), IEEE, 2014, pp. 18–33.
- [29] J. Fischer, B. Vogel-Heuser, F. Haben, I. Schaefer, Reengineering workflow for planned reuse of iec 61131-3 legacy software, in: 2020 IEEE International Conference on Industrial Engineering and Engineering Management (IEEM), IEEE, 2020, pp. 1126–1130.
- [30] E. Juergens, F. Deissenboeck, B. Hummel, S. Wagner, Do code clones matter?, in: 2009 IEEE 31st International Conference on Software Engineering, IEEE, 2009, pp. 485–495.
- [31] U. Kelter, J. Wehren, J. Niere, A generic difference algorithm for uml models., Software Engineering 64 (105-116) (2005) 4–9.
- [32] U. Kelter, J. Wehren, J. Niere, A generic difference algorithm for uml models., Software Engineering 64 (105-116) (2005) 4–9.
- [33] M. Alanen, I. Porres, Difference and union of models, in: International Conference on the Unified Modeling Language, Springer, 2003, pp. 2–17.
- [34] F. Deissenboeck, B. Hummel, E. Juergens, M. Pfaehler, B. Schaetz, Model clone detection in practice, in: Proceedings of the 4th International Workshop on Software Clones, 2010, pp. 57–64.
- [35] F. Deissenboeck, B. Hummel, E. Jürgens, B. Schätz, S. Wagner, J.-F. Girard, S. Teuchert, Clone detection in automotive model-based development, in: 2008 ACM/IEEE 30th International Conference on Software Engineering, IEEE, 2008, pp. 603–612.
- [36] N. H. Pham, H. A. Nguyen, T. T. Nguyen, J. M. Al-Kofahi, T. N. Nguyen, Complete and accurate clone detection in graph-based models, in: 2009 IEEE 31st International Conference on Software Engineering, IEEE, 2009, pp. 276–286.
- [37] M. H. Alalfi, J. R. Cordy, T. R. Dean, M. Stephan, A. Stevenson, Near-miss model clone detection for simulink models, in: 2012 6th International Workshop on Software Clones (IWSC), IEEE, 2012, pp. 78–79.
- [38] M. H. Alalfi, J. R. Cordy, T. R. Dean, M. Stephan, A. Stevenson, Models are code too: Near-miss clone detection for simulink models, in: 2012 28th IEEE International Conference on Software Maintenance (ICSM), IEEE, 2012, pp. 295–304.
- [39] D. Yu, J. Yang, X. Chen, J. Chen, Detecting java code clones based on bytecode sequence alignment, IEEE Access 7 (2019) 22421–22433.
- [40] B. Hummel, E. Juergens, D. Steidl, Index-based model clone detection, in: Proceedings of the 5th International Workshop on Software Clones, IWSC ’11, 2011, pp. 21–27.
- [41] T. Kamiya, S. Kusumoto, K. Inoue, Ccfinder: a multilinguistic token-based code clone-detection system for large scale source code, IEEE Transactions on Software Engineering 28 (7) (2002) 654–670.
- [42] M. White, M. Tufano, C. Vendome, D. Poshyvanyk, Deep learning code fragments for code clone detection, in: 2016 31st IEEE/ACM International Conference on Automated Software Engineering (ASE), IEEE, 2016, pp. 87–98.
- [43] J. HK, R. Jetley, F. Henskens, D. Paul, M. Wallis, S. SD, Analysis of industrial control system software to detect semantic clones.
- [44] H. Thaller, R. Ramler, J. Pichler, A. Egyed, Exploring code clones in programmable logic controller software, in: 2017 22nd IEEE International Conference on Emerging Technologies and Factory Automation (ETFA), IEEE, 2017, pp. 1–8.
- [45] S. Harris, Simian-similarity analyser, HYPERLINK Available from: http://www. harukizaemon. com/simian/index. html.
- [46] M. Fahimipirehgalin, J. Fischer, S. Bougouffa, B. Vogel-Heuser, Similarity analysis of control software using graph mining, in: 2019 IEEE 17th International Conference on Industrial Informatics (INDIN), Vol. 1, IEEE, 2019, pp. 508–515.
- [47] M. Nedvěd, P. Vrba, M. Obitko, Tool for visual difference display of programs in iec 61131-3 ladder diagrams, in: 2015 IEEE International Conference on Industrial Technology (ICIT), IEEE, 2015, pp. 2994–2999.
- [48] K. Rosiak, O. Urbaniak, A. Schlie, C. Seidl, I. Schaefer, Analyzing variability in 25 years of industrial legacy software: an experience report, in: Proceedings of the 23rd International Systems and Software Product Line Conference-Volume B, ACM, 2019, p. 70.
- [49] A. Schlie, D. Wille, S. Schulze, L. Cleophas, I. Schaefer, Detecting Variability in MATLAB/Simulink Models: An Industry-Inspired Technique and Its Evaluation, in: SPLC, ACM, 2017, pp. 215–224.
- [50] S. Holthusen, D. Wille, C. Legat, S. Beddig, I. Schaefer, B. Vogel-Heuser, Family model mining for function block diagrams in automation software, in: Proceedings of the 18th International Software Product Line Conference: Companion Volume for Workshops, Demonstrations and Tools-Volume 2, 2014, pp. 36–43.
- [51] D. Wille, S. Holthusen, S. Schulze, I. Schaefer, Interface variability in family model mining, in: Proceedings of the 17th International Software Product Line Conference co-located workshops, 2013, pp. 44–51.
- [52] S. Holthusen, P. Manhart, I. Schaefer, S. Schulze, C. Singer, D. Wille, Automatische synthese von familienmodellen durch analyse von block-basierten funktionsmodellen, INFORMATIK 2013–Informatik angepasst an Mensch, Organisation und Umwelt.
- [53] S. Duszynski, J. Knodel, M. Becker, Analyzing the source code of multiple software variants for reuse potential, in: 2011 18th Working Conference on Reverse Engineering, 2011, pp. 303–307.
- [54] S. Fischer, L. Linsbauer, R. E. Lopez-Herrejon, A. Egyed, The ecco tool: Extraction and composition for clone-and-own, in: 2015 IEEE/ACM 37th IEEE International Conference on Software Engineering, Vol. 2, IEEE, 2015, pp. 665–668.
- [55] S. Fischer, L. Linsbauer, R. E. Lopez-Herrejon, A. Egyed, Enhancing clone-and-own with systematic reuse for developing software variants, in: 2014 IEEE International Conference on Software Maintenance and Evolution, IEEE, 2014, pp. 391–400.
- [56] C. K. Roy, J. R. Cordy, A mutation/injection-based automatic framework for evaluating code clone detection tools, in: 2009 International Conference on Software Testing, Verification, and Validation Workshops, IEEE, 2009, pp. 157–166.
- [57] M. Stephan, M. H. Alafi, A. Stevenson, J. R. Cordy, Towards qualitative comparison of simulink model clone detection approaches, in: 2012 6th International Workshop on Software Clones (IWSC), IEEE, 2012, pp. 84–85.
- [58] M. Stephan, M. H. Alafi, A. Stevenson, J. R. Cordy, Using mutation analysis for a model-clone detector comparison framework, in: 2013 35th International Conference on Software Engineering (ICSE), IEEE, 2013, pp. 1261–1264.
- [59] J. Svajlenko, C. K. Roy, Evaluating clone detection tools with bigclonebench, in: 2015 IEEE International Conference on Software Maintenance and Evolution (ICSME), IEEE, 2015, pp. 131–140.
- [60] R. Just, The major mutation framework: Efficient and scalable mutation analysis for java, in: Proceedings of the 2014 International Symposium on Software Testing and Analysis, 2014, pp. 433–436.