Data-driven Smart Ponzi Scheme Detection
Tóm tắt nội dung
A smart Ponzi scheme is a new form of economic crime that uses Ethereum smart contract account and cryptocurrency to implement Ponzi scheme. The smart Ponzi scheme has harmed the interests of many investors, but researches on smart Ponzi scheme detection is still very limited. The existing smart Ponzi scheme detection methods have the problems of requiring many human resources in feature engineering and poor model portability. To solve these problems, we propose a data-driven smart Ponzi scheme detection system in this paper. The system uses dynamic graph embedding technology to automatically learn the representation of an account based on multi-source and multi-modal data related to account transactions. Compared with traditional methods, the proposed system requires very limited human-computer interaction. To the best of our knowledge, this is the first work to implement smart Ponzi scheme detection through dynamic graph embedding. Experimental results show that this method is significantly better than the existing smart Ponzi scheme detection methods.
Index Terms:
Blockchain Ponzi scheme detection, data-driven methodI Introduction
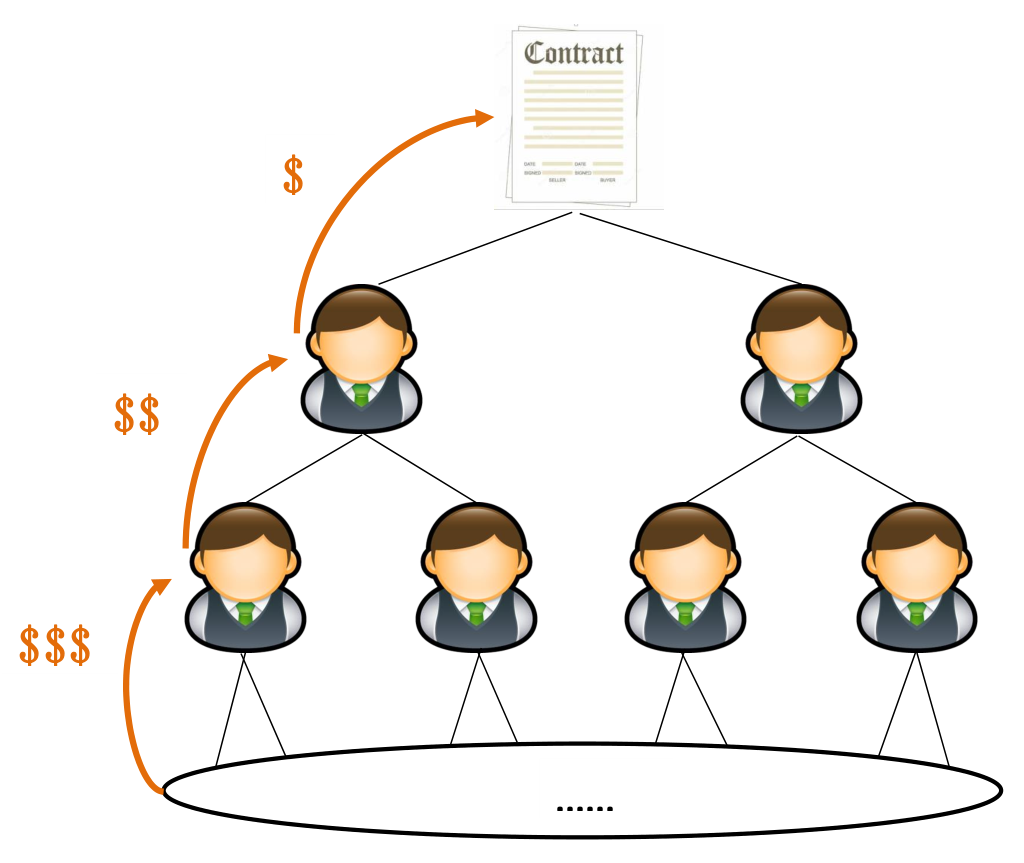
A Ponzi scheme is an investment scheme that uses the funds contributed by new investors to pay off the returns of existing investors (Fig. 1). Recently, the prosperity of blockchain has given birth to a new form of Ponzi scheme, that is, the Ponzi scheme based on Ethereum. Specifically, criminals write the code for implementing the Ponzi scheme in the smart contract of the Ethereum account and realize the Ponzi scheme through the automatic execution of the smart contract [1, 2, 3]. This new form of Ponzi scheme is called the smart Ponzi scheme. Ethereum is an excellent environment for the implementation of smart Ponzi scheme for the following reasons: 1) The account on Ethereum is anonymous, so users cannot identify the smart Ponzi scheme account by checking the profile of the account creator; 2) The smart contract is public, immutable and self-executing, which makes it easy for investors to relax their vigilance and mistakenly believe that their investment is safe. According to the research in [4], the loss of the smart Ponzi scheme to investors exceeded 7 million U.S. dollars from September 2013 to September 2014.
It is essential to identify the accounts implementing the smart Ponzi scheme efficiently. Compared to passively waiting for the victim to report, proactive detection usually detects the problematic account faster, allowing victims have more time to take action to reduce losses. However, research on smart Ponzi scheme detection is still very limited. The existing smart Ponzi scheme detection methods can be broadly divided into detection methods based on source code inspection [5, 6] and detection methods based on feature engineering and machine learning [7, 8, 9, 10]. The detection method based on source code inspection detects the smart Ponzi scheme by manually checking the source code on the smart contract. The problem with this method is that code checking is cumbersome and requires a lot of human resources. The method based on feature engineering and machine learning represents an account on Ethereum through a set of designed features and then inputs the account representation into the machine learning model to determine whether the account is a smart Ponzi scheme account. This method usually requires a lot of professional knowledge to design account features, and it is difficult to represent the account with a limited number of features precisely. Due to the lack of good representation, advanced machine learning techniques do not perform well in feature-based smart Ponzi scheme detection. According to the experiments in [8], in the feature-based smart Ponzi pattern detection, the performance of using neural networks as classifiers is even worse than that of using decision trees as classifiers. In addition, feature-based methods may have poor portability, and features suitable for one Ethereum environment may not work properly in another Ethereum environment.
From our investigation, Ponzi scheme contracts share a few patterns, and most new Ponzi scheme contracts are obtained by modifying existing Ponzi scheme contracts. In general, the smart Ponzi scheme can be divided into four schemes, namely the array-based pyramid scheme, the tree-based pyramid scheme, the switching scheme, and the waterfall scheme [11]. If we build a transaction network with Ethereum accounts as nodes and Ethereum transactions as edges, the account nodes that implement the Ponzi scheme will form a special structure in the transaction network. On the other hand, according to the existing research, we know that the temporal information and code in the smart contract are also important information for smart Ponzi scheme detection [9]. Different transaction sequences can reflect different transaction purposes, and the operation code on the smart contract reveals the control logic of the contract account. Therefore, we can use different information sources to observe whether the target account is implementing a smart Ponzi scheme from multiple views, which is conducive to obtaining correct results for detection.
In this paper, we design a novel data-driven smart Ponzi scheme detection system named DSPSD. DSPSD integrates the structural information of each node in the transaction network, the dynamic information (i.e., the formation process of the transaction network), and the operation code of the smart contract into a low-dimensional continuous vector through dynamic node embedding. The embedding has the following characteristics. First, it can retain the structural information of the transaction network. Second, It is interactive account-aware, that is, the account has different embeddings when the account is transacting with different accounts; Thrid, it preserves the formation process of the transaction network by tracking the trading history of each account. Finally, it contains the operation code information for each account. The contributions of this work are as follows.
-
1.
We propose a data-driven smart Ponzi scheme detection system DSPSD. DSPSD can be regarded as a function that directly predicts whether the account is implementing a Ponzi scheme based on the account’s opcode and transaction data. The system can automatically learn the representation of the account based on the input data, so very limited human interaction is required. Compared with the method based on feature engineering, DSPSD saves the labor cost of feature design, and at the same time has better detection effect and adaptability to the environment.
-
2.
A method is designed to project multi-source account transaction-related information into a low-dimensional continuous vector. This method uses the vector generated based on structural information of the transaction network, the control logic of the account, and the dynamic changes of the transaction network as the representation of the account. Compared with generating node representation based on a single data source, using multi-source data can observe accounts from multiple views and generate a more comprehensive account representation.
-
3.
We have conducted extensive experiments on a large-scale dataset, and the performance of DSPSD is significantly better than the existing smart Ponzi scheme detection methods.
II Background and Related Work
II-A Ethereum
Ethereum is a Blockchain-based distributed computing platform and operating system. Ethereum implements an execution environment on the Blockchain called Ethereum Virtual Machine (EVM), which can excute code of arbitrary algorithmic complexity[12]. Users can use existing programming languages such as Python and Javascript to create applications that run on EVM. Then, Ethereum can serve as a platform for many different types of decentralized Blockchain applications, including but not limited to cryptocurrencies.
We introduce some terms about Ethereum as follows.
Ethereum account: Ethererum uses an account-based system, and the state of Ethernet consists of accounts in Ethereum and transactions between accounts. Ethereum has two types of accounts, namely contract accounts and externally owned accounts (EOA) [13][14]. Contract accounts are controlled by the smart contracts associated with the accounts. When a contract account receives a message, its contract code is activated. On the other hand, externally owned accounts have no smart contracts associated with them.
Smart contract: Smart contracts are public, self-executing code that runs when certain trigger conditions are met [15, 16, 17]. For example, it can be a function that sends a message to a specific account when the account balance reaches a predefined value. A smart contract reflects the control logic of the corresponding contract account.
Opcode: Before uploading to the Blockchain, the source code in the smart contract will be compiled into an Ethereum-specific binary format called EVM bytecode. The EVM bytecode in a smart contract consists of a series of bytes, each byte is an operation, and each operation has a corresponding operation code. In smart contract code analysis, the source code in a smart contract is often converted to opcodes for better readability [18][6].
II-B Smart Ponzi Scheme
The control logic of a contract account is defined by its smart contract. Thus, criminals can implement the Ponzi scheme on Ethereum by including code related to the Ponzi scheme in smart contracts. Ponzi scheme contracts share a few patterns, and most new Ponzi scheme contracts are obtained by modifying existing ones. Specifically, the smart Ponzi scheme can be divided into four schemes, namely array-based pyramid scheme, tree-based pyramid scheme, handover scheme, and waterfall scheme [11]. The array-based scheme refunds users based on their arrival order. Old users can make a profit when the funds raised from new users are sufficient. The tree-based scheme uses a tree structure to store the addresses of the Ethereum accounts, the root of the tree is the contract owner, and each user in the tree has a parent node. When a new user joins the program, his investment is used to refund his ancestors. The handover scheme only stores the address of the last user. If a new user wants to join the program, he needs to pay off the investment of the last user plus a fixed interest. The waterfall scheme refund users by dividing new investments among existing users. Starting with the first user, each user gets a fixed percentage of their investment in turn until the new investment is exhausted.
II-C Smart Ponzi Scheme Detection
The detection of the Ethereum Ponzi scheme is a new topic emerging after the prosperity of the Blockchain. The existing smart Ponzi scheme detection methods can be divided into two categories, namely the code inspection-based method and the feature-based method. The code inspection-based detection method first converts the code in the smart contract into the corresponding opcode, and then analyze the control logic of the smart contract based on the operation code. Salvatore et al. manually examined 900 smart contracts on Ethereum to study the logic, life cycle, and financial impact of the smart contracts. They categorized the smart Ponzi scheme patterns into array-based pyramid schemes, tree-based pyramid schemes, handover schemes, and waterfall schemes. Nicola et al. [5] provided a taxonomy of Ethereum smart contract security vulnerabilities based on where they were introduced (Solidity, EVM bytecode, or Blockchain) and listed a set of Blockchain attacks that can be implemented by smart contracts. Ting et al. [6] defined several gas-costly smart contract programming patterns and developed a tool to automatically detect the patterns from the contract source code.
The feature-based smart Ponzi scheme detection method regards smart Ponzi scheme detection as a binary classification problem. A feature-based model uses a set of features to represent a contract account and then uses supervised learning to train a binary classifier to identify whether the account is a smart Ponzi scheme account based on the representation. The classifier can be random forests, neural networks, XGBoost, etc. The main difference between different feature-based approaches lies in how to define features. For instance, Massimo et al. [7] used 11 features to represent a Bitcoin address. These features include the time the account exists, the amount of Bitcoin received by the account, the ratio of incoming and outgoing transactions to/from the address, and so on. In [8], the authors argued that opcodes in smart contracts can also be applied to contract account representations because they reflect the control logic of the account. The authors divided the account features into transaction-based features and code-based features. The transaction features are similar to the features used in [7], and the code-based features of a contract are defined by the frequency of each opcode in the smart contract. The article also analyzed the importance of these features in the detection of smart Ponzi schemes. Weili et al. [9] examined the Ether flow graph and obtain three smart Ponzi scheme patterns, that is, a smart Ponzi scheme contract mainly paid to known accounts, lots of investment transactions had no refund, and some of the participants paid more than other investment accounts. According to the patterns, the authors devised a set of features for smart Ponzi scheme detection, such as the proportion of receivers who have invested before payment, the proportion of investors who received at least one payment. Compared with the features used in [7] and [8], the features designed in [9] can more accurately reflect the characteristics of the smart Ponzi scheme. Steven et al. [10] designed 42 features to represent an account based on the analysis of transaction records and used XGboost as the classifier to detect smart Ponzi scheme. Fan et al. [21] imporved the performance of the feature-based smart Ponzi scheme detection method through eliminating imbalanced datasets.
Most of the feature-based approaches focus on designing new features for the representation of contract accounts. The problems with this method are: 1) The features used to represent the account are designed based on manual analysis of transaction data, which requires a lot of labor costs. The existing technology supports us to use artificial intelligence technology and massive data to save labor costs [22]; 2) the risk of overfitting increases with the number of features; 3) feature-based methods are often poorly portable, and features designed for one environment may not suitable for another environment.
II-D Node Embedding
Node embedding is a technique for representing a network in a low-dimensional space by learning a continuous vector for each node in the network. The graph information is preserved in the vectors, and then graph algorithms can be computed efficiently on node vectors. In recent years, there have been a large number of methods proposed to learn efficient node embedding. One of the main differences between the various approaches is the information to be preserved. Some methods primarily preserve first-order proximity between nodes. These methods assume that if two nodes are connected, their node vector should be similar or close. For example, Locally Linear Embedding (LLE) [23], Isomap [24], and DeepWalk [25] are node embedding methods that preserve first-order proximity. LEE first constructs an affinity graph, where each node on the affinity graph is represented by its nearest neighbors, and then learns the low-dimensional vector of each node by solving the leading eigenvectors of the affinity matrix. The core idea of Isomap is similar to LEE. Isomap first obtains a distance matrix that records the distance between each pair of nodes of a given graph and then uses the eigendecomposition of the distance matrix as the embedding of the nodes in the graph. DeepWalk was inspired by word2vec [26], a model that generates word embedding. DeepWalk uses DFS to walk randomly on the network to capture the network structure, and each walk collects a list of connected nodes. The authors found that if each node is considered a word, then the node list is a sentence, and the embedding of a node can be calculated by word2vec. Other first-order proximity preserving network embedding methods include graph factorization[27], Eigenmap [28], Directed graph embedding [29], etc.
The second-order proximity of a pair of nodes is defined by the similarity of their neighbors. There are some methods generate node embedding by preserving both first-order proximity and second-order proximity of network. These methods include Large-scale Information Network Embedding (LINE) [30], node2vec [31], Structural Deep Network Embedding (SDNE) [32], etc. LINE defines two different objective functions for the first and second-order similarity of the network. The node embedding generated by LINE can aware of its higher-order neighbors. This paper also proposed a sampling algorithm that enables LINE to be applied to large-scale networks. Node2vec uses both a depth-first search and breadth-first search to obtain the paths generated by random walks. These paths can capture not only the first-order proximity of the network but also the higher-order proximity of the network. Then, node2vec uses the same method as Deepwalk to generate node embeddings in the network. SDNE first uses a semi-supervised multi-layer model to capture the second-order proximity of the network, and then learns node embeddings by jointly optimizing the first-order proximity and the second-order proximity of the network.
In real life, graph nodes may be associated with external information such as text and labels. Some studies have tried to integrate the network structure and the external information of each node into the node embedding. For example, Cheng et al. [33] first proved that DeepWalk is equivalent to matrix factorization. The authors then proposed text-associated deep walking (TADW) that integrates the text features of nodes into the network embedding through matrix decomposition. Xiaofei et al. [34] proposed content-enhanced network embedding (CENE), which treats text information as a special kind of node to integrate text modeling and network structure modeling in a unified framework, and optimizes the probabilities of heterogeneous links. In [35], the authors designed context-aware network embedding (CANE) that uses a mutual attention mechanism to generate context-aware embeddings for nodes. The node embedding generated by CANE not only contains the text and structure information of the nodes, but also the text and structure information of its neighboring nodes.
Many real-world networks, such as social network and biological networks, are dynamic and evolving. The node embedding of temporal graph has become the focal point of increasing research interests recently. The existing temporal graph embedding methods can be divided into two categories, namely time-based methods and event-based methods. The time-based temporal node embedding method records the changes of the graph after each fixed time interval, and then computes the node embeddings in the graph based on these changes. For example, Lun et al. [36] extended LINE to a dynamic setting. Given a sequence of network snapshots within a time interval, the model can generalize to new vertex representation and update the most affected original vertex representations during the evolvement of the network. Uriel et al. [37] proposed a downstream task-aware temporal node embedding method. The algorithm uses static node embedding for initialization, then aligns the node representations at different timestamps, and eventually adapts to a given task in joint optimization. The event-based temporal node embedding method uses the events in the network to characterize the changing pattern of the network. For example, Yuan et al. [38] describe the evolution of a node by using temporal excitation effects exist between neighbors in the sequence. They proposed a time node embedding method that integrates Hawkes process into network embedding to capture the influence of historical neighbors on current neighbors. In [39], the authors introduced a method for temporal node embedding based on triad, which is one of the basic units of the network. This method captures network dynamics and learns representations by modeling how a closed triad, which consists of three vertices connected, develops from an open triad that has two of three vertices not connected.
III Problem statement
We consider smart Ponzi scheme detection in Ethereum with accounts. First, we model the Ethereum transaction network by constructing a temporal directed graph based on Ethereum transactions. The node represents an account on Ethereum (it can be an externally owned account or a contract account). The edge represents a transaction between the nodes and , and the weight of the edge is the number of transactions from to . The file is the opcode of a smart contract. The interactive formation sequence denotes the nodes have transactions with in turn. The interactive formation sequence describes how the transaction network changes over time.
Our task is to design a model which satisfies the following aspects.
-
1.
The model takes as the input.
-
2.
The model learns the evolution of nodes over time by the interactive accounts formation sequence.
-
3.
The model outputs a boolean value which indicates whether is a smart Ponzi scheme account.
-
4.
The prediction of should be as accurate as possible.
IV Methodology
As stated in section III, the smart Ponzi scheme detection problem is formulated as a binary classification problem. In general, our idea is to use dynamic graph embedding to represent the structural information and temporal information of the transaction network and the opcode information of the account with a low-dimensional continuous vector, and then use a binary classifier to define whether the account is a smart Ponzi scheme account. The using of information from different source entitle the algorithm observe the account from different view and is beneficial for DSPSD generate a correct answer.
As described in Section II-D, the existing temporal graph embedding methods can be divided into time-based methods and event-based methods. The data-driven smart Ponzi scheme detection system (DSPSD) we designed is an event-based approach. According to our observations, for a node in a transaction network, the related transactions often occur within a short period, and the network structure near this node does not change much in most of the time. Therefore, if time-based temporal node embedding is used, most of the network changes associated with the account occur in 1-2 timeslots, which is not sufficient to capture the evolution process of the transactions of the account.
IV-A Overview
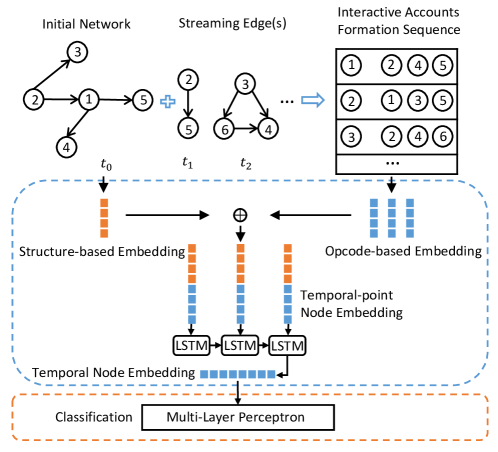
The overall architecture of DSPSD is shown in Fig. 2. The detection process is divided into two steps, namely designing contract account embedding and classifying the embedding. In the first step, for a contract account, the transaction network structure, control logic, and dynamic information of the transaction network related to the account will be embedded into a continuous vector as a representation of the account. Specifically, assume a node has transactions with nodes , ,…, in turn, then we call as the interactive account sequence of . Let denote the time of the -th event, we compute the representation of at , denoted by , based on the transaction network at . The vector is calculated from two aspects, that is, structure-based embedding and opcode-based embedding. After computing , Long Short-Term Memory (LSTM) [40] is employed to learn the overall representation of . Then, in the classification step, we put the learned representation of , denoted by , into a multi-layer perceptron (MLP). The MLP outputs a Boolean value to indicate whether the account of is implementing a smart Ponzi scheme.
IV-B Temporal-point Node Embedding
The temporal-point node embedding is to compute the embedding of a node at a specific timestamp. Let denote the transaction network at , we compute the temporal-point node embedding of from two aspects. First, the structure-based embedding that defined by the topology of . Second, the interactive account-aware opcode-based embedding that defined by the control logic of and its interactive accounts.
Structure-based Embedding: The structure-based embedding is to generate a vector according to the topology of , where is the dimension of the embedding. The core idea is to embed the information of the edge weights into the node representations. Concretely, for an edge , the conditional probability of generated by is defined as
| (1) |
where , are the structure-based vectors of and , the symbol represents matrix transposition.
Then, for edge , the objective is to minimize
| (2) |
where represents the weight of .
Opcode-based Embedding: The opcode-based embedding of , denoted by , is generated from three aspects. First, the control logic of . Second, the control logic of the interactive accounts of in . The interactive accounts of refers to the accounts that have transactions with before . Third, the formation sequence of the interactive accounts of .
Assume are the interactive accounts of before , the computation of opcode-based embedding of , denoted by can be divided into 3 steps:
-
1.
Computing a representation for the control logic of and the nodes in ;
-
2.
Computing the interactive account-aware opcode-based representation of based on each node in ;
-
3.
Integrating the representations obtained from step 2.
The first step is to compute the control logic representation of each node. The control logic of the node is determined by the operation code of the contract account. Therefore, the computation of the control logic representation can be converted into a text encoding problem, that is, encoding the content of the opcode (text information) into a continuous vector. In DSPSD, we use a CNN-based encoding method, which is widely used in text coding[41][42], to obtain the representation. In the encoding of the text, each word in the text is usually represented by a word vector, and then the word vectors of all the words in the text are stacked into a matrix. CNN captures the features between multiple consecutive words through the convolution kernel and shares the weights when calculating the same type of features, thereby capturing the local semantic dependence between words. Specifically, the representation of the control logic of node is computed as follows. First, prepare an opcode dictionary. For any opcode, it has the corresponding random generated vector representation in the opcode dictionary. Assuming that the length of the contract of is , the control logic matrix of node , denoted by , can be produced by looking up the opcode dictionary and stacking the vectors. For an EOA without associated contracts, its is a matrix of all zeros. Then, we employ a convolutional layer to extract the local features of . In the convolutional layer, a learnable filter , is a user-defined parameter, are applied over to capture the local multi-gram information. For instance, a new feature is extracted from according to the following formula:
| (3) |
where is element-wise multiplication, is a bias term and is a non-linear function such as the hyperbolic tangent. The filter will be applied to the representations of whole node matrix via a sliding window to establish the feature map, i.e., the out of the convolutional layer . Let , .
For filters with the same length, the generated feature maps can be rearranged as feature representations of node for each window:
| (4) |
Here, semicolons represent column vector concatenation and is the feature map generated with the -th filter, .
In this way, we can compute the representation of the control logic of and the nodes in .
The second step is to compute the interactive account-aware opcode-based representation of . We assume that has different aspects when interacting with different nodes in . To achieve this, we employ mutual attention [43] to obtain interactive account-aware embedding. The mutual attention enables the pooling layer in CNN to be aware of the vertex pair in an edge. Specifically, to generate the representation of based on , we compute a correlation matrix by using an attentive matrix as follows:
| (5) |
where and are the representation of the control logic of and , and in represents the pair-wise correlation score between and .
Afterward, we conduct a max-pooling operation along rows and columns of to generate opcode-based attention vectors for node and node separately.
The attention vectors are denoted by and , where . The interactive account-aware node representation of based on can be computed as:
| (6) |
The interactive account-aware node representation of based on is:
| (7) |
For , the objective is to minimize
| (8) |
where
| (9) |
The third step is to integrate . We obtain by concatenating the vectors:
| (10) |
The overall loss of DSPSD at time is
| (11) |
One of the problems is that the loss function contains several conditional probabilities that are computationally expensive in optimization. We can employ negative sampling [44] to solve the problem. Afterward, optimization methods such as stochastic gradient descent [45], Adam [46], can be utilized to minimize and train the system.
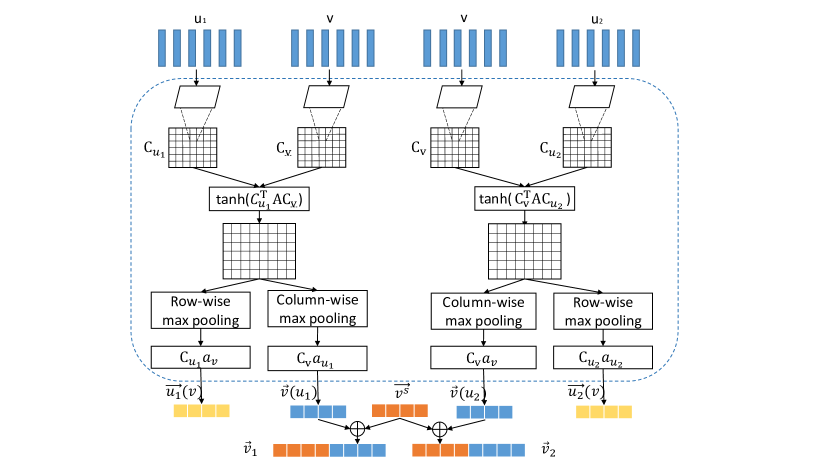
In order to better explain the algorithm, we illustrate the process of computing opcode-based embedding of a node with interactive account formation sequence in Fig. 3. First, the control logic representation of , , and are calculated based on the opcodes of the nodes. Then, the interactive account-aware opcode-based embedding of is computed according to and . Finally, the overall opcode-based embedding of is obtained by concatenating the interactive account-aware opcode-based embedding of based on and .
IV-C Node Embedding over Interactive Accounts Formation Sequence
For a node with interactive account formation sequence , we can compute its temporal-point embedding of each event , and the order in the sequence reflects the way that evolves over time. To obtain an embedding with interactive accounts formation sequence information, we need to aggregate node representations at different timestamps, that is, merging into a vector . This task can be transformed into a sequence modeling problem. The state of the last unit of the sequence model can be regarded as a comprehensive representation of the input at different timestamps. We use Long Short-Term Memory (LSTM) to achieve this aggregation. LSTM is a widely used and effective sequence modeling method[47][48]. It improves the long-term dependency problem in Recurrent Neural Networks (RNN), and the performance of LSTM is usually better than RNN and Hidden Markov Model (HMM). With the increase of data, LSTM uses a self-cycling structure with gates to transfer the last state to the current input. The function of the gate is to decide what information to forget or what information to continue to transmit. Concretely, we the embeddings one by one into an LSTM, and the last memory unit represents the overall embedding of , i.e., (). The content of the -th memory unit is defined by the -th temporal-point embedding and the output of last memory unit . There are three gates in the unit, namely the input gate , the forget gate and the output gate . The formulas for the three gates are as follows.
| (12) |
| (13) |
| (14) |
where , are weights and biases for respective gates. Then, the content of is defined by:
| (15) |
| (16) |
| (17) |
where is the unit state can be updated.
In reality, the number of interactive accounts for each node is different. However, We have to make them of equal length before we take them as input for Long Short-Term Memory (LSTM). Rather than simply truncating, we employ unweighted averaging for nearby temporal-point embedding to reduce the sequence length while keeping the whole interaction process. For some short sequence, we simply pad them with zeroes in the ending. After padding, each temporal-point node embedding is fed as input to an LSTM memory cell. The last memory cell of the LSTM represents the final temporal embedding of the node, optimizing for the classification.
IV-D Classification
The embedding of a node will be input to a binary classifier, and the output of the classifier indicates whether the node is a smart Ponzi scheme account. In DSPSD, we leverage a Multi-Layer Perceptron (MLP) as the classifier. MLP is a simple but effective neural network structure, which is widely used in classification problems.
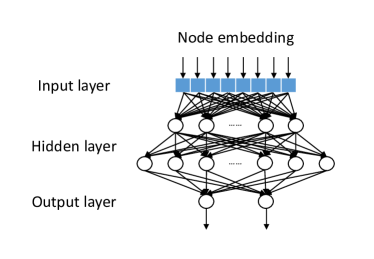
Figure 4 presents an MLP that has two hidden layers and an output layer. An MLP can be divided into the input layer, hidden layer, and output layer. Each layer uses a sigmod function as the transfer function. Let , , and denotes the transfer function of the input layer, the hidden layer, and the output layer, the MLP works as follows.
The input layer of the MLP take as its input.
| (18) |
The output of the input layer will be the input of the hidden layer.
| (19) |
Then, the output layer is
| (20) |
Finally, we use a softmax function to obtain the classification result.
| (21) |
where is a learnable weight matrix and is a bias vector. Then we can get a boolean value indicates whether the input node is a smart Ponzi scheme account according to .
Assume the nodes in the network is , is the softmax result of , is the golden label of , the loss of the MLP is in Eq. 22.
| (22) |
where contains all the parameters of the network and is the regulation term. The objective function in Eq. 22 measures how predictive the model is on the training data and the regulation term helps to avoid over-fitting.
To recap, the overall process of DSPSD is as follows:
-
Step 1:
Construct a transaction network according to the transaction data.
-
Step 2:
For each node and its corresponding account formation sequence (), construct ;
- Step 3:
- Step 4:
-
Step 5:
Uses Eq. 11 as the loss function to compute the representation of at ;
- Step 6:
- Step 7:
V EXPERIMENT
We used Ethereum’s real transaction data to evaluate the effectiveness and efficiency of DSPSD. The data used in this paper is the same as that used in [9]111The data is available at ibase.site/scamedb. The data is part of the data collected from http://etherscan.io before May 7, 2017. Each of the records contains the payment account ID, recipient account ID, transaction time, transaction value, etc. There are 1251 normal contract accounts and 131 smart Ponzi scheme accounts.
Our model training has two parts. The first part is to generate node embeddings based on the transaction network structure and contract opcodes. In this part, we use all the transaction data to construct the transaction network, and use the edges in the transaction network as supervisory signals to train the model. The second part is classification training. In this part, we only focus on contract accounts and use the labeled data of contract accounts as supervisory signals. We used 10-fold cross-validation to obtain the results. That is, we divided the dataset into 10 parts, of which 9 parts were used for training and the remaining part was used for testing. This process can be repeated 10 times, with different test data each time, and the final result is the average result of 10 experiments.
In the experiment, we first compared the performance of DSPSD with several baseline methods. For all baseline methods, we first generate a representation for each contract account through embedding or feature extraction and then input the representation into a classifier to detect whether the corresponding account is a smart Ponzi scheme account. We evaluated the performances from two aspects. First, we compared the effects of using different methods to generate contract account representations. Second, we compared the detection results of different classifiers. In addition, we visualized different types of embeddings and opcodes for contract accounts.
VI Parameters Setting
We initialized all the embeddings by randomly sampling from a uniform distribution in [-0.1, 0.1]. The vector length . The width of CNN filters was set to 2, and the number of convolutional feature maps and the attentive matrix size were set to 100. An LSTM layer of size 32 follows with a dropout value of 0.75 and using hyperbolic tangent as the activation function. The MLP used in our experiment consists of 3 layers, each layer contains 32 or 64 hidden units. The model parameters are regularized with L2 regularization. We used stochastic gradient descent as the optimizer, and the range of the learning rate is set to [0.001, 0.01]. The maximum length of opcodes in a smart contract is set to 300. We train all the models in batches with a size of 64.
VI-A Evaluation Metrics and Baseline Method
Our experiment compares the impact of different methods on the detection results from two aspects, namely embedding method and classification method. The results were evaluated by precision, recall, and F-score. Precision is used to measure the exactness or quality of the method, and is defined as the number of correctly predicted positive items divided by the total number of predicted items. The recall is a measure of completeness or quantity, and is defined as the number of correctly predicted positive items divided by the total number of positive items in the dataset. F-score is a measure of the overall performance of a model, .
The following method serves as our baselines.
-
•
LINE + SVM: LINE[30] is a node embedding algorithm that preserves the first-order proximity and the second-order proximity of a network. The vector generated by LINE contains only the structural information of the static network. We use LINE to compute the embedding of each contract account and then use Support Vector Machine (SVM) [49] to identify smart Ponzi scheme accounts. The support vector machine classifier performs classification by achieving the hyperplane that enlarges the border between two categories.
-
•
LINE + MLP: We use LINE to compute the embedding of each contract account, and then use MLP to identify smart Ponzi scheme accounts. MLP is a basic type of feedforward neural network that consists of an input layer, several hidden layers, and an output layer (Figure 4).
-
•
Control logic representation + SVM: In order to generate the control logic representation of the node, we do not consider the structural information in the training, that is, remove from Eq. 11. The control logic representation can then be input into a trained SVM to identify if the account is a smart Ponzi scheme account.
-
•
Control logic representation + MLP: We input the control logic representation of a node into a trained MLP to identify if the node is representing a smart Ponzi scheme account.
-
•
CANE + SVM: For each node, CANE[35] integrates the network structure, text information associated with the node into a continuous vector. CANE has separate objective functions for structure-based embedding and text-based embedding. In our experiment, the opcodes of a node serve as the text information of the node. Then, we use SVM to classify the vectors generated by CANE.
-
•
CANE + MLP: We use CANE to compute the embeddings of the contract accounts and use MLP to classify the embeddings.
-
•
DPSE: DPSE is a smart Ponzi scheme detection methods described in [9]. DPSE uses account features and code features to represent contract accounts, and then uses Random forest (RF) as a classifier to identify whether the account is a smart Ponzi scheme account. Random forest is a classic machine learning tool based on aggregating the output of a collection of decision trees.
| Algorithm | Embedding Description | Precision | Recall | F-score |
| LINE+SVM | structure-only, static node embedding | 0.67 | 0.32 | 0.43 |
| LINE+MLP | structure-only, static node embedding | 0.91 | 0.4 | 0.56 |
| Control logic representation+SVM | opcode-only, static node embedding | 0.92 | 0.61 | 0.73 |
| Control logic representation+MLP | opcode-only, static node embedding | 0.87 | 0.75 | 0.81 |
| CANE+SVM | structure + opcode, static node embedding | 0.87 | 0.83 | 0.85 |
| CANE+MLP | structure + opcode, static node embedding | 0.92 | 0.83 | 0.87 |
| DPSE (structure-only) | structure-only, feature-based | 0.74 | 0.32 | 0.44 |
| DPSE (structure + opcode) | structure + opcode, feature-based | 0.94 | 0.81 | 0.86 |
| Our Embedding + SVM | structure + opcode, temporal node embedding | 0.90 | 0.84 | 0.87 |
| DSPSD (Our Embedding + MLP) | structure + opcode, temporal node embedding | 0.98 | 0.85 | 0.91 |
VI-B Smart Ponzi Scheme Detection Result
In this section, we compare the effectiveness of different account representation methods and classification methods. In the comparison of account representations, we used LINE, control logic representation, CANE, DPSE, and our method to represent contract accounts. In the comparison of classification methods, we compared the effects of SVM and MLP on account embedding classification. The results are listed in Table I.
From the table, we have the following observations.
(1) The combination of network structure and operation code information can achieve better results than only using network structure or operation code information. The experimental results show that the method using network structure and operation code information (i.e., CANE, DSPSD) can improve the value by at least 29% compared with the method using only structural information (i.e., LINE). In smart Ponzi scheme detection, operation code information is more important than transaction network structure information. Detection methods based only on transaction network structure often have a very low recall value, resulting in a low F-score. For example, according to the performance of DPSE, if only structural information is used for prediction, the recall rate is only 0.32, while the recall rate of using both structure and opcode information is 0.81.
(2) In smart Ponzi scheme detection, the models based on node embedding are better than the models based on feature engineering. One of the reasons is that the recall rate of the feature-based model is lower than that of the node-embedded models. This indicates it is difficult to represent the network structure by several features. The node-embedded model can automatically learn the node representation according to the network topology, which is more accurate than the designed features.
(3) Compared with support vector machine, MLP has better detection effect. Although the detection performance of MLP and support vector machine both improve with the increase of network information, MLP has better adaptability.
(4) The proposed DSPSD is remarkably better than the baseline methods. When both of the transaction network and opcode information are used, the F-score of DSPSD can reach up to 0.91, which is superior than other methods. Compared with the static node embedding method, DSPSD uses the evolution information of each node, which is of great significance to the detection of smart Ponzi scheme. That indicates that in smart Ponzi scheme detection, we not only need to consider the network structure generated by transaction data, but also the process of generating the transaction network.
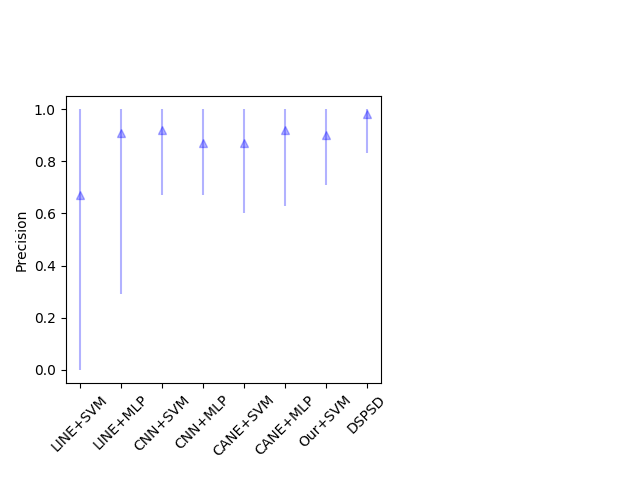
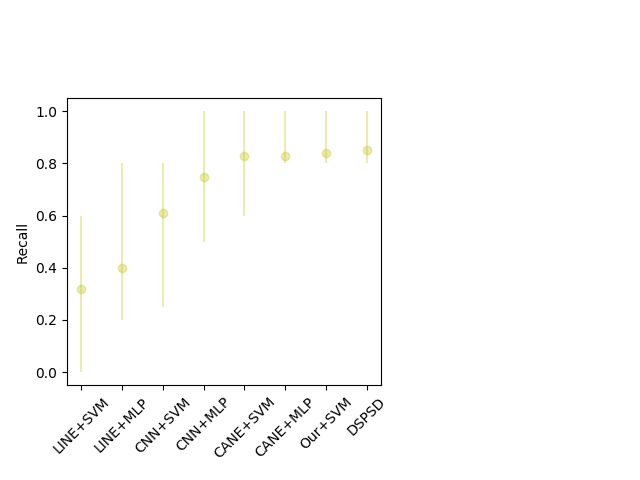
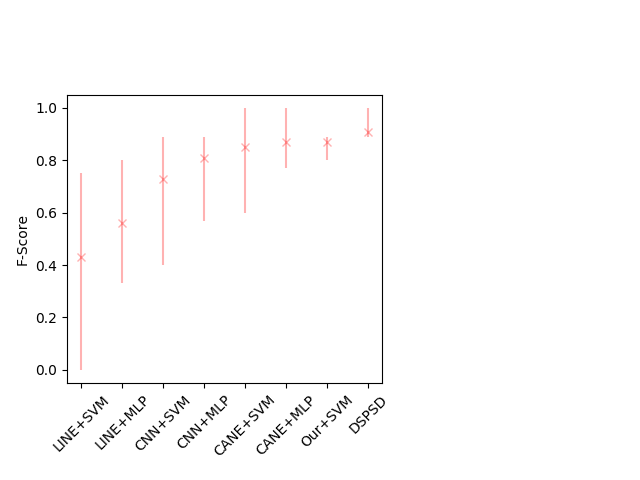
We used 10-fold cross validation in our experiments, so we have different results on 10 data sets for each experiment. Figure 5 shows the range of values for the results of each method. It can be seen that the result range of DSPSD is smaller than other methods (the corresponding line is shorter), which indicates DSPSD is more robust than the baseline methods.
VI-C Case Study
In this part, we have selected two cases for case analysis in the results of false positive and false negative.
False positive:
(1) ’0x160fc84c8c5d46561b01d38eb7d44671f3eed4ca’: In the data we use, there are only two transaction records related to this account. We guess that the wrong classification is caused by insufficient information.
(2) ’0x7753a9d834844cfde5c211ec3912b49f0d8b8e11’: There are multiple transaction records with this account in the data we use, but the operation code of this account is missing, which causes our algorithm to generate wrong results.
False negative:
(1) ’0xa9fa83d31ff1cfd14b7f9d17f02e48dcfd9cb0cb’: The characteristic of transactions related to this account is that the transaction value generated by most accounts is very low, but the transaction value of a few transactions is particularly high. The account is incorrectly classified as an normal account might be because the number of transactions related to the account is similar to that of an normal account, but the transaction value characteristics are different from that of an normal account. In the transaction network, we use the number of transactions instead of the transaction value to define the edge weights. The advantage is that the difference in edge weights will not be too large. Otherwise, the edge with extremely high weight will dominate the representation of the node, while the remaining edges have a very limited influence on the representation of the node. But the disadvantage is that the node representation does not contain information about the transaction value.
(2) ’0x258d778e4771893758dfd3e7dd1678229320eeb5’: The characteristic of transactions related to this account is that the transaction amount is either 1 or 10. We guess that the reason for the wrong classification is also related to the edge weights of the transaction network is defined by the number of transactions instead of the amount.
In summary, false positive cases may be caused by insufficient information. The false negative cases may be caused by the fact that we only used information about the number of transactions and not the value of transactions when constructing the transaction network.
VI-D Embedding Visualization
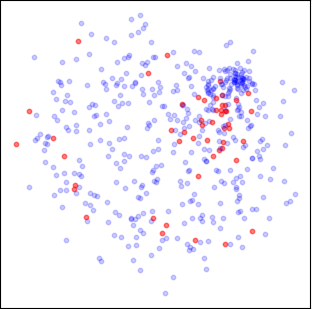
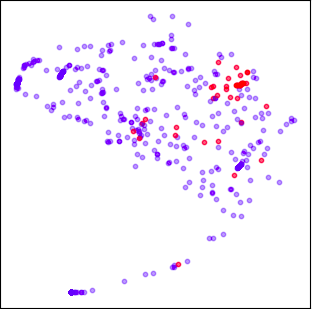
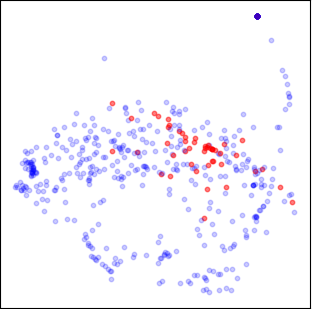
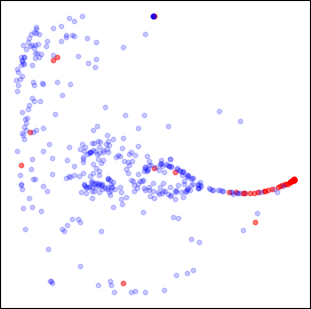
In order to demonstrate the embedding generated by LINE, control logic representation, CANE and DSPSD, we used different methods to generate the embedding of each contract account. The embedding is 200-dimensional, to visualize high-dimensional data, we use t-distributed randocial Neighbor embedding (t-SNE)[50] to map each embedding to a two-dimensional vector, and then use 2-D graph display data. The embedding of is shown in Figure 6, where the blue points are normal accounts and the red points are smart Ponzi scheme accounts. As can be seen from the figure, the embedding generated by DSPSD is the most classification-friendly. Even from a 2-D graph, it is easy to distinguish the area of the smart Ponzi scheme account vector from the area of the normal contract account vector. On the other hand, the embedding generated by LINE, CANE, and control logic representation are not as good as the embedding generated by DSPSD. Especially for LINE, the area of the smart Ponzi scheme account vector is mixed with the area of the normal contract vector. The embedding generated by CANE is slightly better than the control logic representation because the nodes generated by CANE are more concentrated in a smaller area. This is consistent with the results we obtained in Table I.
VI-E Opcode Visualization
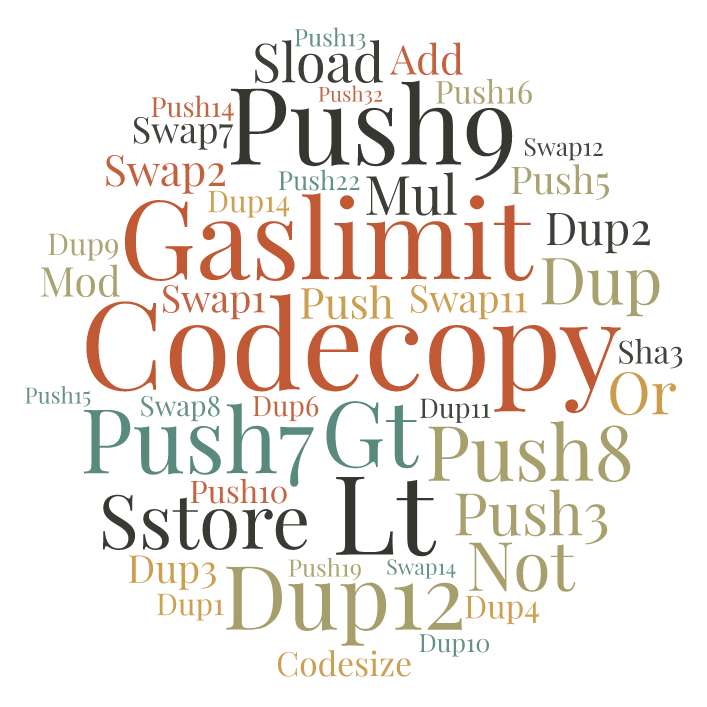
Opcodes are important for detecting smart contracts because they reflect the logic of smart contracts. In our experiments, we define important opcodes as those that are strongly related to smart Ponzi scheme contract or normal contract. Generally speaking, an opcode is an important opcode if (1) it is rare and mainly appears in one category, or (2) it frequently appears in one category, but is not common in the other category.
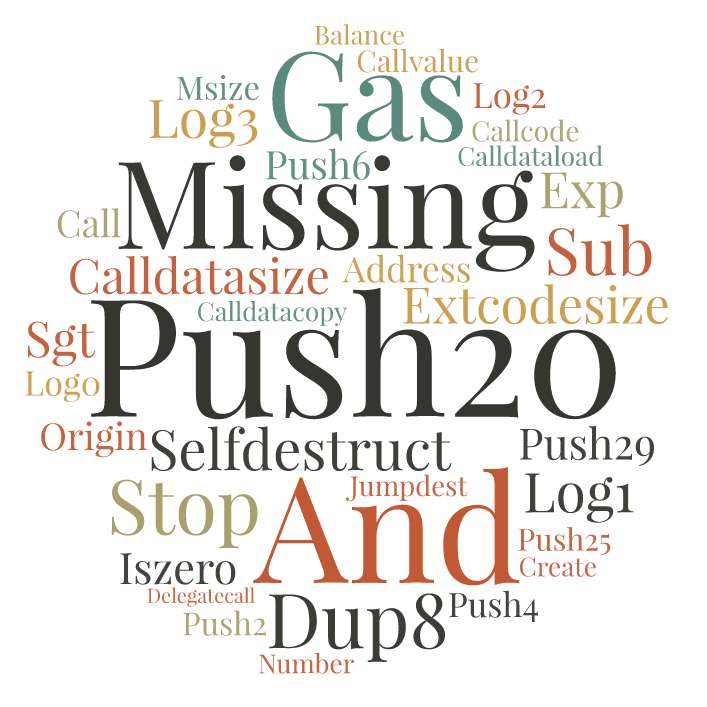
In our experiment, we use the TF-IDF value to indicate the importance of an opcode. For an opcode , we first compute its IDF value based on all of the smart contracts. Second, we calculate the TF-IDF value of in the smart Ponzi scheme contract and the TF-IDF value of in the normal contract . The final TF-IDF value of is . Then we select the 80 opcodes with the highest TF-IDF value for display. For one of the 80 opcodes, if its , we classify it as an opcode related to the smart Ponzi scheme contract and display it in Fig. 7, otherwise it will be regarded as an opcode related to the normal contract and displayed in Fig. 8. The font size is determined by the TF-IDF value of the corresponding opcode.
VII Conclusion and Future Work
This paper proposes a data-driven smart Ponzi scheme system DSPSD. The system uses historical transaction data of Ethereum as input to construct a dynamic transaction network, and then uses the temporal-point node embedding model we designed to embed the Ethereum account information (including account-related network structural information, network dynamic information, and account attribute information) into a low-dimensional vector, and then the vector is input into a classifier composed of Multi-layer Perceptrons to determine whether the corresponding account has implemented a smart Ponzi scheme. Compared with the traditional feature-based smart Ponzi scheme detection method, DSPSD requires very limited human interaction, which saves a lot of time for feature engineering. In addition, the experimental results show that DSPSD has significantly better performance than the existing smart Ponzi scheme detection method, especially in boosting the recall rate.
This work is the first attempt to implement a data-driven smart Ponzi scheme detection algorithm using dynamic graph embedding technology and has achieved good results, proving that the method is feasible in smart Ponzi scheme detection or related tasks. However, there are still some problems in our work that require further research and improvement. First of all, when we set the edge weights of the transaction network, only the number of transactions data is used and the transaction value is not used. The use of the number of transactions instead of the transaction value is to avoid that the difference of edge weight is too large, which makes the representation of the network node overly dependent on the edge with a large weight. However, this also makes the information of the transaction value not used. How to add transaction value information to the node representation is one of the issues that need to be studied in the future. Second, when constructing the transaction network, we treat all types of accounts on Ethereum as nodes of the same type, ignoring the attribute information of the nodes. Future work can consider how to include the attribute information of the node into the account representation. Using heterogeneous nodes to represent different types of accounts, and then using heterogeneous graph embedding technology to learn the node embedding can be one of the solutions.
Tài liệu
- [1] C. K. Elwell, M. M. Murphy, M. V. Seitzinger, and E. V. Murphy, “Bitcoin: questions, answers, and analysis of legal issues,” 2015.
- [2] M. Swan, Blockchain: Blueprint for a New Economy. ”O’Reilly Media, Inc.”, 2015.
- [3] Z. Zheng, S. Xie, H. Dai, X. Chen, and H. Wang, “Blockchain challenges and opportunities: a survey,” Int. J. Web Grid Serv., vol. 14, no. 4, pp. 352–375, 2018. [Online]. Available: https://doi.org/10.1504/IJWGS.2018.10016848
- [4] M. Vasek, M. Thornton, and T. Moore, “Empirical analysis of denial-of-service attacks in the bitcoin ecosystem,” in International conference on financial cryptography and data security. Springer, 2014, pp. 57–71.
- [5] N. Atzei, M. Bartoletti, and T. Cimoli, “A survey of attacks on ethereum smart contracts (sok),” in International Conference on Principles of Security and Trust. Springer, 2017, pp. 164–186.
- [6] T. Chen, X. Li, X. Luo, and X. Zhang, “Under-optimized smart contracts devour your money,” in 2017 IEEE 24th International Conference on Software Analysis, Evolution and Reengineering (SANER). IEEE, 2017, pp. 442–446.
- [7] M. Bartoletti, B. Pes, and S. Serusi, “Data mining for detecting bitcoin ponzi schemes,” in Proceedings of the 2018 Crypto Valley Conference on Blockchain Technology, 2018, pp. 75–84.
- [8] E. Jung, M. L. Tilly, A. Gehani, and Y. Ge, “Data mining-based ethereum fraud detection,” 2019 IEEE International Conference on Blockchain (Blockchain), pp. 266–273, 2019.
- [9] W. Chen, Z. Zheng, J. Cui, E. C. H. Ngai, P. Zheng, and Y. Zhou, “Detecting ponzi schemes on ethereum: Towards healthier blockchain technology,” in Proceedings of the 2018 World Wide Web Conference on World Wide Web, WWW 2018, Lyon, France, April 23-27, 2018, P. Champin, F. L. Gandon, M. Lalmas, and P. G. Ipeirotis, Eds. ACM, 2018, pp. 1409–1418. [Online]. Available: https://doi.org/10.1145/3178876.3186046
- [10] S. Farrugia, J. Ellul, and G. Azzopardi, “Detection of illicit accounts over the ethereum blockchain,” Expert Systems with Applications, vol. 150, p. 113318, 2020. [Online]. Available: https://www.sciencedirect.com/science/article/pii/S0957417420301433
- [11] M. Bartoletti, S. Carta, T. Cimoli, and R. Saia, “Dissecting ponzi schemes on ethereum: Identification, analysis, and impact,” Future Gener. Comput. Syst., vol. 102, pp. 259–277, 2020. [Online]. Available: https://doi.org/10.1016/j.future.2019.08.014
- [12] Y. Hirai, “Defining the ethereum virtual machine for interactive theorem provers,” in International Conference on Financial Cryptography and Data Security. Springer, 2017, pp. 520–535.
- [13] V. Buterin et al., “A next-generation smart contract and decentralized application platform,” white paper, 2014.
- [14] C. Dannen, Introducing Ethereum and Solidity. Springer, 2019.
- [15] N. Atzei, M. Bartoletti, and T. Cimoli, “A survey of attacks on ethereum smart contracts sok,” vol. 10204, pp. 164–186, 2017.
- [16] A. Bogner, M. Chanson, and A. Meeuw, “A decentralised sharing app running a smart contract on the ethereum blockchain,” in Proceedings of the 6th International Conference on the Internet of Things. ACM, 2016, pp. 177–178.
- [17] S. Jani, “Smart contracts: Building blocks for digital transformation,” 2020.
- [18] S. Amani, M. Bégel, M. Bortin, and M. Staples, “Towards verifying ethereum smart contract bytecode in isabelle/hol,” in Proceedings of the 7th ACM SIGPLAN International Conference on Certified Programs and Proofs. ACM, 2018, pp. 66–77.
- [19] A. M. Antonopoulos, Mastering Bitcoin: unlocking digital cryptocurrencies. ”O’Reilly Media, Inc.”, 2014.
- [20] D. Vujičić, D. Jagodić, and S. Ranđić, “Blockchain technology, bitcoin, and ethereum: A brief overview,” in 2018 17th International Symposium INFOTEH-JAHORINA (INFOTEH). IEEE, 2018, pp. 1–6.
- [21] S. Fan, S. Fu, H. Xu, and X. Cheng, “Al-spsd: Anti-leakage smart ponzi schemes detection in blockchain,” Information Processing and Management, vol. 58, no. 4, p. 102587, 2021.
- [22] J. Ge, F. Wang, H. Sun, L. Fu, and M. Sun, “Research on the maturity of big data management capability of intelligent manufacturing enterprise,” Systems Research and Behavioral Science, vol. 37, no. 4, pp. 646–662, 2020. [Online]. Available: https://onlinelibrary.wiley.com/doi/abs/10.1002/sres.2707
- [23] S. T. Roweis and L. K. Saul, “Nonlinear dimensionality reduction by locally linear embedding,” science, vol. 290, no. 5500, pp. 2323–2326, 2000.
- [24] M. Balasubramanian and E. L. Schwartz, “The isomap algorithm and topological stability,” Science, vol. 295, no. 5552, pp. 7–7, 2002.
- [25] B. Perozzi, R. Al-Rfou, and S. Skiena, “Deepwalk: Online learning of social representations,” in Proceedings of the 20th ACM SIGKDD international conference on Knowledge discovery and data mining. ACM, 2014, pp. 701–710.
- [26] T. Mikolov, K. Chen, G. Corrado, and J. Dean, “Efficient estimation of word representations in vector space,” in 1st International Conference on Learning Representations, ICLR 2013, Scottsdale, Arizona, USA, May 2-4, 2013, Workshop Track Proceedings, Y. Bengio and Y. LeCun, Eds., 2013. [Online]. Available: http://arxiv.org/abs/1301.3781
- [27] P. Goyal and E. Ferrara, “Graph embedding techniques, applications, and performance: A survey,” Knowledge-Based Systems, vol. 151, pp. 78–94, 2018.
- [28] M. Belkin and P. Niyogi, “Laplacian eigenmaps and spectral techniques for embedding and clustering,” in Advances in neural information processing systems, 2002, pp. 585–591.
- [29] M. Chen, Q. Yang, and X. Tang, “Directed graph embedding.” in IJCAI, 2007, pp. 2707–2712.
- [30] J. Tang, M. Qu, M. Wang, M. Zhang, J. Yan, and Q. Mei, “Line: Large-scale information network embedding,” in Proceedings of the 24th international conference on world wide web. International World Wide Web Conferences Steering Committee, 2015, pp. 1067–1077.
- [31] A. Grover and J. Leskovec, “node2vec: Scalable feature learning for networks,” in Proceedings of the 22nd ACM SIGKDD international conference on Knowledge discovery and data mining. ACM, 2016, pp. 855–864.
- [32] D. Wang, P. Cui, and W. Zhu, “Structural deep network embedding,” in Proceedings of the 22nd ACM SIGKDD international conference on Knowledge discovery and data mining. ACM, 2016, pp. 1225–1234.
- [33] C. Yang, Z. Liu, D. Zhao, M. Sun, and E. Chang, “Network representation learning with rich text information,” in Twenty-Fourth International Joint Conference on Artificial Intelligence, 2015.
- [34] X. Sun, J. Guo, X. Ding, and T. Liu, “A general framework for content-enhanced network representation learning,” arXiv preprint arXiv:1610.02906, 2016.
- [35] C. Tu, H. Liu, Z. Liu, and M. Sun, “Cane: Context-aware network embedding for relation modeling,” in Proceedings of the 55th Annual Meeting of the Association for Computational Linguistics (Volume 1: Long Papers), 2017, pp. 1722–1731.
- [36] L. Du, Y. Wang, G. Song, Z. Lu, and J. Wang, “Dynamic network embedding : An extended approach for skip-gram based network embedding,” in Proceedings of the Twenty-Seventh International Joint Conference on Artificial Intelligence, 2018, pp. 2086–2092.
- [37] U. Singer, I. Guy, and K. Radinsky, “Node embedding over temporal graphs.” in Proceedings of the Twenty-Eighth International Joint Conference on Artificial Intelligence, 2019, pp. 4605–4612.
- [38] Y. Zuo, G. Liu, H. Lin, J. Guo, X. Hu, and J. Wu, “Embedding temporal network via neighborhood formation,” in Proceedings of the 24th ACM SIGKDD International Conference on Knowledge Discovery and Data, 2018, pp. 2857–2866.
- [39] L. Zhou, Y. Yang, X. Ren, F. Wu, and Y. Zhuang, “Dynamic network embedding by modeling triadic closure process,” in Proceedings of the Twenty-Seventh International Joint Conference on Artificial Intelligence, 2018, pp. 571–578.
- [40] K. Greff, R. K. Srivastava, J. Koutník, B. R. Steunebrink, and J. Schmidhuber, “LSTM: A search space odyssey,” IEEE Trans. Neural Netw. Learning Syst., vol. 28, no. 10, pp. 2222–2232, 2017. [Online]. Available: https://doi.org/10.1109/TNNLS.2016.2582924
- [41] Y. Zhang and B. Wallace, “A sensitivity analysis of (and practitioners’ guide to) convolutional neural networks for sentence classification,” in Proceedings of the Eighth International Joint Conference on Natural Language Processing (Volume 1: Long Papers). Taipei, Taiwan: Asian Federation of Natural Language Processing, Nov. 2017, pp. 253–263. [Online]. Available: https://www.aclweb.org/anthology/I17-1026
- [42] A. Jacovi, O. Sar Shalom, and Y. Goldberg, “Understanding convolutional neural networks for text classification,” in Proceedings of the 2018 EMNLP Workshop BlackboxNLP: Analyzing and Interpreting Neural Networks for NLP. Brussels, Belgium: Association for Computational Linguistics, Nov. 2018, pp. 56–65. [Online]. Available: https://www.aclweb.org/anthology/W18-5408
- [43] C. dos Santos, M. Tan, B. Xiang, and B. Zhou, “Attentive Pooling Networks,” arXiv e-prints, p. arXiv:1602.03609, Feb. 2016.
- [44] T. Mikolov, I. Sutskever, K. Chen, G. S. Corrado, and J. Dean, “Distributed representations of words and phrases and their compositionality,” in Advances in Neural Information Processing Systems 26: 27th Annual Conference on Neural Information Processing Systems 2013. Proceedings of a meeting held December 5-8, 2013, Lake Tahoe, Nevada, United States, 2013, pp. 3111–3119. [Online]. Available: http://papers.nips.cc/paper/5021-distributed-representations-of-words-and-phrases-and-their-compositionality
- [45] D. E. Rumelhart, G. E. Hinton, and R. J. Williams, “Learning representations by back-propagating errors,” Nature, vol. 323, no. 6088, pp. 696–699, 1988.
- [46] D. P. Kingma and J. Ba, “Adam: A method for stochastic optimization,” arXiv preprint arXiv:1412.6980, 2014.
- [47] L. Qi, Z. Wu, J. Zhu, and H. Meng, “Modelling high-dimensional sequences with lstm-rtrbm: application to polyphonic music generation,” AAAI Press, 2015.
- [48] S. Viswanathan, M. A. Kumar, and K. P. Soman, A Sequence-Based Machine Comprehension Modeling Using LSTM and GRU. Power and Justice, 2019.
- [49] N. I. Sapankevych and R. Sankar, “Time series prediction using support vector machines: A survey,” IEEE Computational Intelligence Magazine, vol. 4, no. 2, pp. 24–38, 2009.
- [50] P. E. Rauber, A. X. Falcão, and A. C. Telea, “Visualizing time-dependent data using dynamic t-sne,” in Eurographics Conference on Visualization, EuroVis 2016, Short Papers, Groningen, The Netherlands, 6-10 June 2016, 2016, pp. 73–77. [Online]. Available: https://doi.org/10.2312/eurovisshort.20161164