Peak in the superconducting transition temperature
of the nonmagnetic topological line-nodal material CaSb2 under pressure
Abstract
Investigating the pressure dependence of the superconducting (SC) transition temperature is crucial for understanding the SC mechanism. Herein, we report on the pressure dependence of in the nonmagnetic topological line-nodal material CaSb2, based on measurements of electric resistance and alternating current magnetic susceptibility. initially increases with increasing pressure and peaks at 3.1 GPa. With a further increase in pressure, decreases and finally becomes undetectable at 5.9 GPa. Because no signs of phase transition or Lifshitz transition are observed in the normal state, the peculiar peak structure of suggests that CaSb2 has an unconventional SC character.
The superconducting (SC) transition temperature of a material is closely related to its electronic state. In a conventional Bardeen-Cooper-Schrieffer (BCS) superconductor, at the weak coupling limit is expressed as [1, 2]
| (1) |
where is the Debye frequency, is Dirac’s constant, is Boltzmann’s constant, is the density of states (DOS) at the Fermi energy , and is the effective interaction between the electrons mediated by the electron-phonon coupling. Therefore, the of a BCS superconductor is usually suppressed by the decrease in owing to the bandwidth expansion when pressure is applied [3]. In contrast, exhibits a dome-like shape against tuning parameters, such as pressure and chemical substitution, when superconductivity is mediated by quantum critical fluctuations sensitive to these tuning parameters [4, 5]. In addition, structural phase transitions or Lifshitz transitions change the electronic state dramatically, resulting in discontinuous variations in [6, 7, 8]. Thus, investigating the pressure dependence of is important for understanding the SC mechanism.
In this paper, we investigate the pressure dependence of in CaSb2 based on measurements of electric resistance and alternating current (AC) magnetic susceptibility. We found that shows a peak structure with a maximum value of 3.4 K at 3.1 GPa; this suggests the superconductivity of an unconventional nature in CaSb2.
CaSb2 crystallizes in a monoclinic structure with a non-symmorphic space group (, No. 11, ). Based on band structure calculations [9], CaSb2 has Dirac line nodes in its bulk bands, which are protected by a combination of screw and mirror symmetries even with the spin-orbit coupling (SOC). In line-nodal materials, the intersections of two doubly degenerated bands, namely the Dirac point nodes, are connected to each other along a special line in the -space. These materials are predicted to exhibit several interesting phenomena, such as quasitopological electromagnetic response, owing to their special band structure [10]. Note that CaSb2 has topologically nontrivial bands as well as trivial bands around . Recently, some of the authors of the present study discovered superconductivity in this compound with K [11]. CaSb2 is expected to exhibit topologically nontrivial superconductivity owing to its topological bands. However, at ambient pressure, 121/123Sb-nuclear quadrupole measurements reveal that the conventional metallic behavior originating from the Fermi-surface parts away from the nodes is dominant in the normal state and that the SC pairing symmetry is a conventional -wave [12]. The variation in the SC properties with pressure will provide further insights regarding CaSb2.
CaSb2 were grown using the melt-growth method for resistance measurements (sample A) and the Sb self-flux method for AC susceptibility measurements (samples B–H). The details of the melt-growth method were reported previously [11]. In the self-flux method, Ca and Sb in a molar ratio of 1:3.1 were placed in a tungsten crucible, which was sealed inside a quartz tube with Ar gas. The tube was heated to 1000oC over 3 h, left undisturbed for 5 h, and then slowly cooled from 740oC to 600oC. To identify the products, powder X-ray diffraction (XRD) was performed using a commercial diffractometer (Bruker AXS, D8 Advance) using Cu-K radiation. In the melt-growth method, almost single-phase polycrystalline CaSb2 was synthesized, whereas with the self-flux method, a mixture of small single crystals of CaSb2 and Sb was obtained. The superconductivity of Sb can be ignored because it appears only above 8.5 GPa ( K) [13]. The energy dispersive x-ray analysis (EDX) spectra of CaSb2 in all samples were measured using a commercial spectrometer (EDAX VE7800), and the composition ratio of Ca and Sb was determined to be approximately 1:2. Pressure was applied using two types of pressure cells; an indenter-type pressure cell [14] was used for 4 GPa and an opposed-anvil high-pressure cell, designed by Kitagawa [15], was used for higher-pressure measurements. Daphne 7575, which is liquid at an ambient condition and solidifies above 4 GPa, was used as a pressure medium. Based on the pressure dependence of in a Pb manometer [16, 17], we estimated the pressure value as follows:
where is in GPa, and . Electrical resistance was measured using a conventional four-terminal method with an AC resistance bridge (372, Lake Shore Cryotronics Inc.). The AC magnetic susceptibility was measured using a self-inductance method.
The pressure dependence of was calculated using the full-potential linearized augmented plane wave plus local orbitals method implemented in the WIEN2K package [18, 19]. We adopted the Perdew-Burke-Ernzerhof generalized gradient approximation [20] as the exchange-correlation functional. We also considered the effect of SOC. The electronic states with varying lattice parameters were calculated. We fitted the volume dependence of condensation energy with the Murnaghan equation of states and converted the volume change to pressure [21]. The origin of the calculated pressure was set at the condensation-energy minimum at which the lattice parameters are slightly larger than the experimental values [22]. We then assumed two types of the pressure effect. One is isotropic compression, whereby, the unit cell shrinks without any variation in its aspect ratio. The other is -axis compression. For simplicity, we assume that only the -axis lattice parameter shrinks and that the - and - axis lattice parameters do not change under pressure. Since CaSb2 has a layered crystal structure, this assumption is more realistic even under hydrostatic pressure [23, 24].
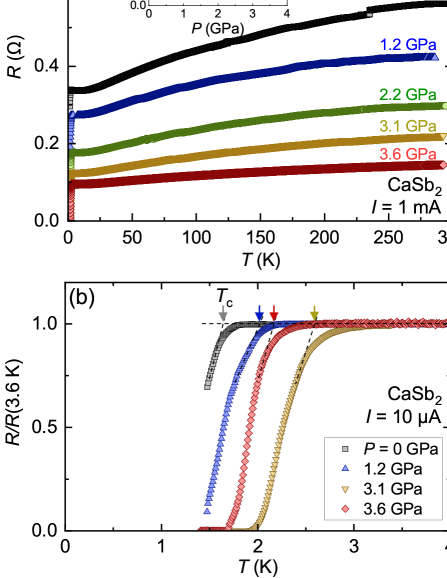
Figure 1(a) shows the temperature dependence of resistance at various pressures. Because a sintered polycrystalline sample was measured and because its resistance value includes a large contribution from the grain boundary, it was difficult to estimate the exact value of resistivity. At all pressures, decreased upon cooling, which is a typical behavior of a normal metal. The value of linearly decreased with increasing pressure, as shown in the inset of Fig. 1(a). No other anomalies except for the SC transition were found in the pressure range up to 3.6 GPa.
We observed the SC transition at 1.7 K under ambient pressure. Because of the limitations of the experimental conditions, the measurements were performed only down to 1.4 K. Therefore, we defined the onset of the SC transition as , as shown in Fig. 1(b). initially increased with increasing pressure and became 2.6 K at 3.1 GPa; this trend is opposite to that for conventional superconductors. In contrast, decreased with a further increase in pressure.
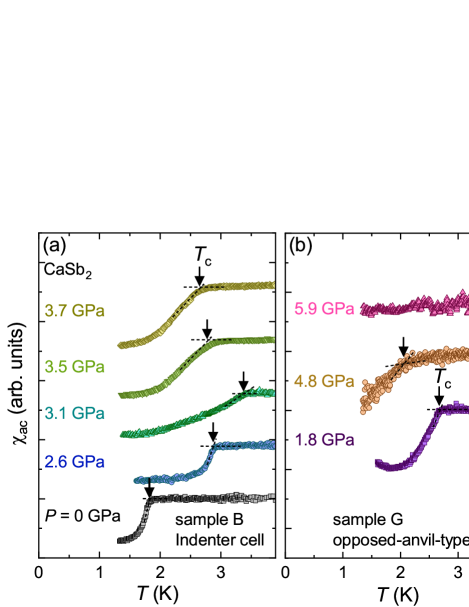
To check the nonmonotonic pressure dependence of , we also measured the AC magnetic susceptibility , as shown in Fig. 2. shows a clear diamagnetic signal below 1.8 K at ambient pressure. As in the resistance measurements, was defined as the onset temperature of the SC transition. The SC transition becomes broader under pressure due to the pressure distribution and the inhomogeneity of . exhibited a peak at 3.1 GPa, and no diamagnetic signal was observed down to 1.4 K at 5.9 GPa, which is consistent with the resistance measurements.
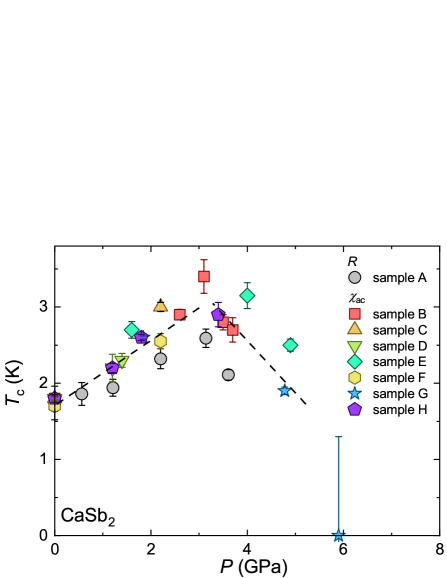
The pressure dependence of is summarized in Fig. 3. The distribution of could originate from that of sample quality. In particular, the difference in the sample synthesis methods might be reflected in the difference in between and measurements. Nevertheless, all samples exhibited similar peak structures. initially increased with K/GPa. The maximum was 3.4 K at 3.1 GPa in sample B, which is roughly double the at ambient pressure. Above 3.1 GPa, decreased with K/GPa.
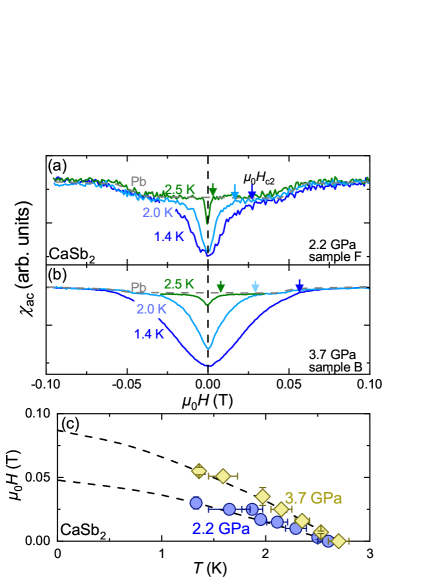
To investigate the change in the SC properties before and after the peak, the temperature dependence of the upper critical field at 2.2 and 3.7 GPa was also examined. At these two pressures, at zero field is almost the same ( 2.7 K). was determined from the magnetic field dependence of at a fixed temperature, as shown in Figs. 4(a) and (b), and from the temperature dependence of at a fixed field, as shown in Fig. S2. Because we placed Pb inside the coil with the sample, the diamagnetic signal of Pb was also observed in both samples, as shown in Figs. 4(a) and (b). At both pressures, superconductivity was quickly suppressed by the magnetic field, and appeared to be governed by the orbital pair-breaking effect, as shown in Fig. 4(c). The estimated (0)s at 2.2 and 3.7 GPa were 0.05 T and 0.08 T, respectively. The change in (0) is related to the change in the effective mass of the electron . The orbital critical field can be described as [25]. Here, is the fluxoid quantum, is the SC coherence length, is the Fermi wave vector, and is the SC gap. (0) at 3.7 GPa is 1.6 times larger than that at 2.2 GPa, suggesting a 1.3-fold increase in . Note that the of CaSb2 is fairly small; it is even smaller than that of the type-I superconductor Pb. However, because the lower critical field of CaSb2 is 5 mT at ambient pressure [11], CaSb2 is a type-II superconductor that is very close to a type-I superconductor, even under pressure.
Herein, we discuss the origin of the enhancement of by applying pressure. As mentioned above, of BCS superconductors usually decreases with increasing pressure because of the decrease in [2]. Indeed, as shown in Fig. 5, the calculated of CaSb2 decreases slightly with isotropic compression and, at 3 GPa, it is approximately 97% of the value at ambient pressure, while a small peak exists at 3.4 GPa. However, there are some exceptions. One is vanadium. The of vanadium monotonically increases with increasing pressure up to 120 GPa as a result of the suppression of spin fluctuations through the broadening of the -band width [26]. Based on our 121/123Sb-nuclear quadrupole measurements at ambient pressure [12], the SC pairing symmetry of CaSb2 is a conventional -wave, and conventional metallic behavior without low-energy spin fluctuations was observed in the normal state. In addition, at ambient pressure was estimated to be from specific heat measurements [11], indicating a weak electron–phonon coupling. In such a case, the pressure dependence of and is weaker than that of and is negligible [3]. Therefore, it would be naively expected that the of CaSb2 decreases with the application of pressure; however, experimental results indicate the opposite. One possible scenario to explain the experimental results is the increase in with applying pressure due to anisotropic compressibility. Actually, at 3 GPa increases by approximately 10% with -axis compression, as shown in Fig. 5, resulting in a of 2.7 K, according to Eq.(1). Thus, the experimentally determined of 3.4 K cannot be explained only by the increase in with -axis compression. Furthermore, in reality, may not increase so much because not only the -axis but also the other crystal axes should shrink by hydrostatic pressure. Therefore, an additional mechanism is necessary to completely understand the experimentally observed pressure dependence of .
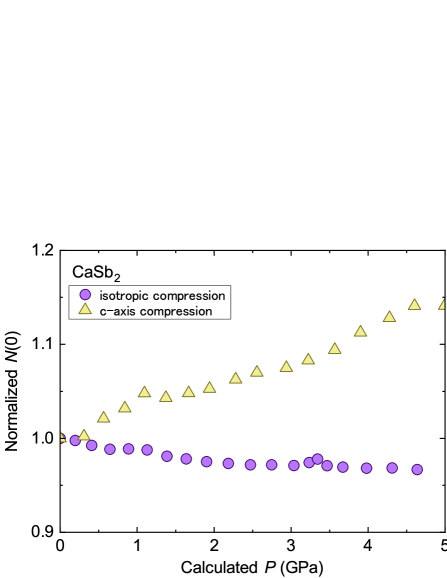
The origin of the peculiar peak structure of against pressure is also unknown. In general, there are three possible reasons for a nonmonotonic change in . The first is that the superconductivity is mediated by quantum critical fluctuations and appears near the quantum critical point [4, 5, 27, 28]. In such a case, exhibits a dome-like shape with respect to tuning parameters. The second is that the electronic state is changed due to a phase transition. A typical example is a drastic change in the electronic state due to a structural phase transition induced by pressure, resulting in a discontinuous change in [6, 7]. The final reason refers to the case of a change in the Fermi surface character passing through the van Hove singularity, namely the Lifshitz transition. When a van Hove singularity exists, the DOS has a peak, resulting in a corresponding peak in the pressure dependence of [29, 8]. There have been no reports of phase transitions in CaSb2 other than the SC transition, and the measurements in this study did not indicate such a transition. In addition, the absolute values of the slope of with respect to pressure as well as are almost the same before and after the peak of , suggesting the absence of a substantial change in the electronic state. Therefore, the possibility of the first or second reason is marginal. Moreover, the last reason is inconsistent with the result of the band calculations. As shown in Fig. 5, almost monotonically decreases(increases) with isotropic compression(-axis compression) instead of peaking at 3 GPa. The origin of the peak structure in is therefore unknown.
The remaining possibility is that the complex pressure dependence of the lattice parameters results in the peak structure of . More detailed investigations, including XRD measurements under pressure and microscopic measurements, will clarify this behavior. Since our measurements may have overlooked phase transitions that exist, it is necessary to measure high-quality single-crystal samples. Furthermore, it is important to investigate the SC symmetry in the high-pressure region because the SC symmetry above 3.1 GPa could be different from the -wave realized at ambient pressure. It was theoretically proposed that an SC symmetry other than an -wave ( in the irreducible representation of ) in CaSb2 should be topologically nontrivial [30].
In conclusion, we observed a peculiar pressure dependence of the of CaSb2 from the measurements of electrical resistance and AC magnetic susceptibility. The maximum was 3.4 K at 3.1 GPa, which is approximately double that at ambient pressure. Because there are no signs of phase transition or Lifshitz transition up to 4 GPa in the normal state, the peculiar peak structure in suggests that the SC character of CaSb2 is unconventional and changes at around 3 GPa. To confirm the origin of this peak structure and the SC mechanism under high pressure, further investigations are desired. Our findings provide a new perspective for investigating the SC properties of topologically nontrivial materials.
Note added. After submitting this Letter, we noticed that the superconducting properties of single crystalline CaSb2 at ambient pressure have been reported by another group [31].
Acknowledgments
The authors thank H. Takahashi for valuable discussions. This work was partially supported by Kyoto University LTM center, Grant-in-Aid for Scientific Research on Innovative Areas from the Ministry of Education, Culture, Sports, Science, and Technology (MEXT) of Japan, and JSPS Core-to-core program (No. JPJSCCA20170002). We are also supported by JSPS KAKENHI Nos. JP15H05852, JP15K21717, JP17H06136, JP20H00130, JP15K21732, JP15H05745, JP20KK0061, JP19H04696, JP19K14657, and JP20H05158.
References
- Bardeen et al. [1957] J. Bardeen, L. N. Cooper, and J. R. Schrieffer, Phys. Rev. 108, 1175 (1957).
- [2] Frontiers in Superconducting Materials edited by A. V. Narlikar, (Springer, New York, 2005).
- Smith and Chu [1967] T. F. Smith and C. W. Chu, Phys. Rev. 159, 353 (1967).
- Ishida et al. [2009] K. Ishida, Y. Nakai, and H. Hosono, J. Phys. Soc. Jpn. 78, 062001 (2009).
- Pfleiderer [2009] C. Pfleiderer, Rev. Mod. Phys. 81, 1551 (2009).
- Kobayashi et al. [2011] T. C. Kobayashi, Y. Irie, J. Ichi Yamaura, Z. Hiroi, and K. Murata, J. Phys. Soc. Jpn. 80, 023715 (2011).
- Kitagawa et al. [2013] S. Kitagawa, H. Kotegawa, H. Tou, H. Ishii, K. Kudo, M. Nohara, and H. Harima, J. Phys. Soc. Jpn. 82, 113704 (2013).
- Steppke et al. [2017] A. Steppke, L. Zhao, M. E. Barber, T. Scaffidi, F. Jerzembeck, H. Rosner, A. S. Gibbs, Y. Maeno, S. H. Simon, A. P. Mackenzie, and C. W. Hicks, Science 355, eaaf9398 (2017).
- Funada et al. [2019] K. Funada, A. Yamakage, N. Yamashina, and H. Kageyama, J. Phys. Soc. Jpn. 88, 044711 (2019).
- Ramamurthy and Hughes [2017] S. T. Ramamurthy and T. L. Hughes, Phys. Rev. B 95, 075138 (2017).
- Ikeda et al. [2020] A. Ikeda, M. Kawaguchi, S. Koibuchi, T. Hashimoto, T. Kawakami, S. Yonezawa, M. Sato, and Y. Maeno, Phys. Rev. Mater. 4, 041801(R) (2020).
- Takahashi et al. [2021] H. Takahashi, S. Kitagawa, K. Ishida, M. Kawaguchi, A. Ikeda, S. Yonezawa, and Y. Maeno, J. Phys. Soc. Jpn. 90, 073702 (2021).
- Wittig [1969] J. Wittig, J. Phys. Chem. Solids 30, 1407 (1969).
- Kobayashi et al. [2007] T. C. Kobayashi, H. Hidaka, H. Kotegawa, K. Fujiwara, and M. I. Eremets, Rev. Sci. Instrum. 78, 023909 (2007).
- Kitagawa et al. [2010] K. Kitagawa, H. Gotou, T. Yagi, A. Yamada, T. Matsumoto, Y. Uwatoko, and M. Takigawa, J. Phys. Soc. Jpn. 79, 024001 (2010).
- Eiling and Schilling [1981] A. Eiling and J. S. Schilling, J. Phys. F: Met. Phys. 11, 623 (1981).
- Bireckoven and Wittig [1988] B. Bireckoven and J. Wittig, J. Phys. E: Sci. Instrum. 21, 841 (1988).
- [18] P. Blaha, K. Schwarz, G. K. H. Madsen, D. Kvasnicka, J. Luitz, R. Laskowski, F. Tran, and L. D. Marks, WIEN2k, An Augmented Plane Wave + Local Orbitals Program for Calculating Crystal Properties (Karlheinz Schwarz, Techn. Universität Wien, Austria, 2018).
- Blaha et al. [2020] P. Blaha, K. Schwarz, F. Tran, R. Laskowski, G. K. H. Madsen, and L. D. Marks, J. Chem. Phys. 152, 074101 (2020).
- Perdew et al. [1996] J. P. Perdew, K. Burke, and M. Ernzerhof, Phys. Rev. Lett. 77, 3865 (1996).
- Murnaghan [1944] F. Murnaghan, Proc. Nat. Acad. Sci. 30, 244 (1944).
- Deller and Eisenmann [1976] K. Deller and B. Eisenmann, Z. Anorg. Allg. Chem. 425, 104 (1976).
- Manikandan et al. [2020] K. Manikandan, R. Pervin, C. Saravanan, M. Sathiskumar, N. Chakraborty, P. M. Shirage, S. Mondal, V. Srihari, H. K. Poswal, and S. Arumugam, RSC Advances 10, 13112 (2020).
- Tsirlin et al. [2021] A. A. Tsirlin, P. Fertey, B. R. Ortiz, B. Klis, V Merkl, V. Merkl, M. Dressel, S. D. Wilson, and E. Uykur arXiv:2105.01397 (2021).
- Hake [1967] R. R. Hake, Appl. Phys. Lett. 10, 189 (1967).
- Ishizuka et al. [2000] M. Ishizuka, M. Iketani, and S. Endo, Phys. Rev. B 61, 3823(R) (2000).
- [27] Y. Kvashnin, D. VanGennep, M. Mito, S.A. Medvedev, R. Thiyagarajan, O. Karis, A.N. Vasiliev, O. Eriksson, and M. Abdel-Hafiez, Phys. Rev. Lett. 125, 186401 (2020).
- [28] A. Majumdar, D. VanGennep, J. Brisbois, D. Chareev, A. V. Sadakov, A. S. Usoltsev, M. Mito, A. V. Silhanek, T. Sarkar, A. Hassan, O. Karis, R. Ahuja, and M. Abdel-Hafiez, Phys. Rev. Materials 4, 084005 (2020).
- Chu et al. [1970] C. W. Chu, T. F. Smith, and W. E. Gardner, Phys. Rev. B 1, 214 (1970).
- Ono et al. [2020] S. Ono, H. C. Po, and K. Shiozaki Rhys. Rev. Research 3, 023086 (2021).
- Oudah et al. [2020] M. Oudah, J Bannies, D. A. Bonn, and M. C. Aronson arXiv:2106.06175 (2021).