Mass-Velocity Dispersion Relation in MaNGA Brightest Cluster Galaxies
Abstract
We investigate a kinematic scaling relation between the baryonic mass and the flat velocity dispersion, i.e. mass-velocity dispersion relation (MVDR), from the brightest cluster galaxies (BCGs) to the galaxy clusters. In our studies, the baryonic mass of BCGs is mainly estimated by photometry. The velocity dispersion profiles are explored with the integrated field unit (IFU) by Mapping Nearby Galaxies at Apache Point Observatory (MaNGA). For the first time, we reveal two significant results with 54 MaNGA BCGs: (1) the flat velocity dispersion profiles; (2) a tight empirical relation on the BCG-cluster scale together with cluster samples, i.e., MVDR, , with a tiny lognormal intrinsic scatter of . This slope is identical to the acceleration relation in galaxy clusters, which is reminiscent of the spiral galaxies, albeit at a larger characteristic acceleration scale. The residuals of the MVDR represent a Gaussian distribution, displaying no correlations with four properties: baryonic mass, scale length, surface density, and redshift. Notably, the MVDR on the BCG-cluster scale provides a strict test, which disfavors the general prediction of the slope of three in the dark matter model.
Subject headings:
Galaxy kinematics (602); Brightest cluster galaxies (181); Giant elliptical galaxies (651); Galaxy clusters (584); Dark matter (353)1. Introduction
A kinematic scaling relation is the counterpart of a dynamical scaling relation, which plays a major role in understanding fundamental physics. For examples, Kepler’s law leads to Newtonian dynamics in the Solar system. However, Kepler’s law is no longer applicable in spiral galaxies, well-known as the dark matter (DM) problem. Instead, a different kinematic relation was discovered between the baryonic mass and the flat rotation velocity, called the baryonic Tully-Fisher relation (BTFR, McGaugh et al., 2000; Verheijen, 2001; McGaugh, 2011; Lelli et al., 2016, 2019). Similarly in elliptical galaxies and galaxy clusters, such a correlation was found between the baryonic mass and the velocity dispersion, called the baryonic Faber-Jackson relation (BFJR, Sanders, 2010; Famaey & McGaugh, 2012).
In galaxies, the BTFR and the BFJR can be implied by the radial acceleration relation (RAR) in the low acceleration approximation. Not long ago, McGaugh et al. (2016) have explored a tight correlation between the observed acceleration and the baryonic acceleration as
| (1) |
with an acceleration scale m s-2. In addition, the RAR implied for the BTFR and for the BFJR (Lelli et al., 2017; McGaugh, 2020; Milgrom, 2020). Particularly, those correlations were clearly described in Modified Newtonian Dynamics (MOND, Milgrom, 1983) about four decades ago. Furthermore, MOND has been tested in gravitational lensing effects (Tian et al., 2009; Tian & Ko, 2019; Brouwer et al., 2021). However, MOND found a residual missing mass in galaxy clusters (Sanders, 2003; Famaey & McGaugh, 2012), which questioned the validity of the RAR on the cluster scale.
Recently, Tian et al. (2020) investigated the existence of a radial acceleration relation on cluster scales using the Cluster Lensing and Supernova survey with Hubble (CLASH, Postman et al., 2012). In the CLASH sample, was measured by strong-lensing, weak-lensing shear-and-magnification data (Umetsu et al., 2016), while was calculated with X-ray data sets (Donahue et al., 2014) plus the estimated stellar mass from the empirical gas fraction (Chiu et al., 2018). The result is a parallel RAR (CLASH RAR):
| (2) |
with a larger acceleration scale m s-2 than observed in rotating galaxies. The CLASH RAR is a tight correlation with a small intrinsic scatter . Other works also demonstrate a similar acceleration scale in galaxy clusters (Pradyumna et al., 2021).
While supposing the validity of the CLASH RAR in dynamics, one can derive mass-velocity dispersion relation (MVDR), , on the BCG-cluster scale. Moreover, its implications include a flat velocity dispersion profile in both BCGs and clusters. This similarity is reminiscent of the RAR in galaxies, albeit with a larger acceleration scale .
Recently, Tian et al. (2021) have quantified the MVDR with 29 galaxy clusters in the HIghest X-ray FLUx Galaxy Cluster Sample (HIFLUGCS). In their studies, the baryonic mass was dominated by X-ray gas (Zhang et al., 2011) plus the stellar mass estimated on the scaling relation (Giodini et al., 2009). All 29 HIFLUGCS clusters illustrated a flat tail in the line-of-sight (los) velocity dispersion profile. By Bayesian statistics, Tian et al. (2021) have obtained the MVDR in galaxy cluster as
| (3) |
with a small intrinsic scatter of . In addition, this intercept implied a consistent acceleration scale of the CLASH RAR. Consequently, the success of an MVDR in galaxy clusters raises the same issue in BCGs.
Although the kinematic scaling relations were widely studied in BCGs such as the Faber-Jackson relation and the fundamental plane (e.g., see Oegerle & Hoessel, 1991; Zaritsky et al., 2006; Bernardi et al., 2007; Samir et al., 2020), it has never been clear if there is continuity in a single MVDR from the scale of individual BCGs to clusters of galaxies (Sanders, 1994). As for the flat profiles of BCGs, it has been a lack of systematic studies of the velocity dispersion profiles. Besides, there is only one BCG per cluster, and sufficiently sensitive, spatially resolved observations have been rare until now.
In this work, we investigate the MVDR with 54 MaNGA BCGs and compare them with 29 HIFLUGCS clusters. The paper is organized as follows. In section 2, we introduce the data in the MaNGA BCG sample and the method to analyze the velocity dispersion profile. In section 3, we inspect the MVDR on the BCG-cluster scale by Bayesian statistics and calculate the residuals against four galaxy-cluster properties. In section 4, we discuss our results with the consistency of the CLASH RAR and the implications for the dark matter problems. Finally, we summarize our work in section 5. Throughout this paper, we assume a flat cold dark matter (CDM) cosmology with , , and a Hubble constant of km s-1 Mpc-1.
2. Data and Methods
To study the MVDR in BCGs, we estimated the baryonic mass and analyzed their velocity dispersion profiles at the outermost radius. The baryonic mass is composed of the stellar mass and the gas mass of BCGs. Since BCGs are elliptical galaxies, stars are usually concentrated in their center. So, it is difficult to measure their velocity far from the center.
Investigating the internal kinematics structure has motivated some observations with IFUs, which employed spatially resolved spectroscopy. Among them, MaNGA is the largest survey targeted with an unprecedented sample of 10,000 nearby galaxies (Bundy et al., 2015).
In this work, we exploited BCGs in public MaNGA Product Lunch-6 (MPL-6), which contained a total number of 4824 currently. This data set corresponds to SDSS Data Release Fifteen (DR15, Aguado et al., 2019). By combining both data of DR15 and MPL-6, we got sufficient information of the baryonic mass and internal kinematics profile for this work.
2.1. BCG samples
Because BCGs are the brightest galaxies usually positioned at the center of a galaxy cluster, they can be identified by given memberships. The BCG samples of SDSS has been systematically explored in Yang et al. (2007). They obtained lots of groups by developing the halo-based group finder in Data Release Seventh (DR7). When matching Yang’s catalog with MPL-6, 73 samples in MaNGA were re-identified as BCGs by the color-magnitude and the membership distribution diagrams. In total, we got 76 BCGs when including three additional samples labeled by MaNGA.
In our studies, both complete spectra and IFU measurements are necessary for calculating the baryonic mass and the flat velocity dispersion. Among the samples, six out of them lack sufficient MaNGA IFU data and 16 cases are without the SDSS spectra. Therefore, only 54 MaNGA BCGs meet the specific requirements of the MVDR. Their galactic properties are listed in Table 1, such as ID, redshift, baryonic mass , and the flat los velocity dispersion .
| plateifu | aaRedshifts are from MaNGA Pipe3D. | bbThe baryonic mass including total stellar mass estimated by model photometry in SDSS DR15 and the measured gas mass in MaNGA marked with on the plateifu ID. | ccThe flat los velocity dispersion from MaNGA IFU in this work. |
|---|---|---|---|
| () | (km/s) | ||
| 8625-12704∗ | 0.027 | 11.541 | 298 |
| 9181-12702∗ | 0.041 | 11.622 | 266 |
| 9492-9101 | 0.053 | 11.785 | 291 |
| 8258-3703 | 0.059 | 11.246 | 190 |
| 8331-12701 | 0.061 | 11.231 | 195 |
| 8600-12703∗ | 0.061 | 11.332 | 220 |
| 8977-3703∗ | 0.074 | 11.475 | 246 |
| 8591-3704 | 0.075 | 11.506 | 281 |
| 8591-6102 | 0.076 | 11.435 | 262 |
| 8335-6103 | 0.082 | 11.575 | 313 |
| 9888-12703 | 0.083 | 11.542 | 300 |
| 9043-3704∗ | 0.084 | 11.473 | 226 |
| 9042-3702 | 0.084 | 11.050 | 251 |
| 8943-9102∗ | 0.085 | 11.442 | 135 |
| 8613-6102 | 0.086 | 11.807 | 331 |
| 9002-3703 | 0.088 | 11.171 | 203 |
| 8939-6104 | 0.088 | 11.309 | 271 |
| 8455-12703∗ | 0.092 | 11.559 | 206 |
| 9025-9101 | 0.096 | 11.813 | 277 |
| 8239-6103 | 0.097 | 11.361 | 236 |
| 9486-6103 | 0.098 | 11.401 | 241 |
| 8613-12705 | 0.099 | 12.029 | 377 |
| 9000-9101 | 0.105 | 11.225 | 202 |
| 8447-3702 | 0.109 | 11.596 | 250 |
| 9891-9101 | 0.111 | 11.609 | 261 |
| 8466-6104 | 0.113 | 11.552 | 210 |
| 9891-3701 | 0.114 | 11.462 | 212 |
| 8081-3701 | 0.115 | 11.556 | 281 |
| 9044-12703 | 0.117 | 11.414 | 316 |
| 8131-3703 | 0.119 | 11.592 | 272 |
| 9891-12701 | 0.120 | 11.442 | 323 |
| 9085-6102 | 0.120 | 11.702 | 307 |
| 9506-6103∗ | 0.120 | 11.578 | 297 |
| 8943-3704 | 0.124 | 11.697 | 266 |
| 9490-9102 | 0.125 | 11.619 | 278 |
| 9043-9101 | 0.127 | 11.582 | 336 |
| 8725-12704 | 0.129 | 12.068 | 504 |
| 8989-12704 | 0.129 | 11.758 | 285 |
| 8989-12703 | 0.130 | 11.644 | 279 |
| 8728-3703 | 0.131 | 11.596 | 226 |
| 9865-12703 | 0.131 | 11.498 | 211 |
| 8717-1901 | 0.131 | 11.493 | 268 |
| 8991-6102 | 0.133 | 11.654 | 270 |
| 8555-3702 | 0.133 | 11.457 | 240 |
| 8554-6103 | 0.133 | 11.594 | 297 |
| 8995-6103 | 0.133 | 11.458 | 208 |
| 8720-12705 | 0.135 | 11.236 | 228 |
| 8615-12704 | 0.135 | 11.572 | 471 |
| 8554-6102 | 0.136 | 11.775 | 304 |
| 8616-12703 | 0.138 | 11.884 | 308 |
| 8616-3702 | 0.138 | 11.581 | 284 |
| 8247-9102∗ | 0.140 | 11.734 | 330 |
| 9888-6104 | 0.147 | 11.729 | 265 |
| 8725-6104 | 0.148 | 11.614 | 270 |
2.2. The Baryonic Mass
Because BCGs are usually elliptical galaxies, the baryonic mass is dominated by their stellar mass. The total stellar mass of 54 MaNGA BCGs can be estimated by model photometry in SDSS DR15. We adopt uncertainties that average over the occasional asymmetry in the photometric stellar mass estimates. The gas mass of BCGs is subdominant to stars. Only nine galaxies have measured gas masses in MaNGA (e.g., see the star marker of plateifu ID in Table 1), with the gas fraction in our samples ranging from of the baryonic mass. Moreover, the hot gas contribution in the inner region (within the effective radius ) is insignificant compared to the stellar mass of BCG (e.g., Sartoris et al., 2020; Tian et al., 2020).
2.3. The Flat Velocity Dispersion
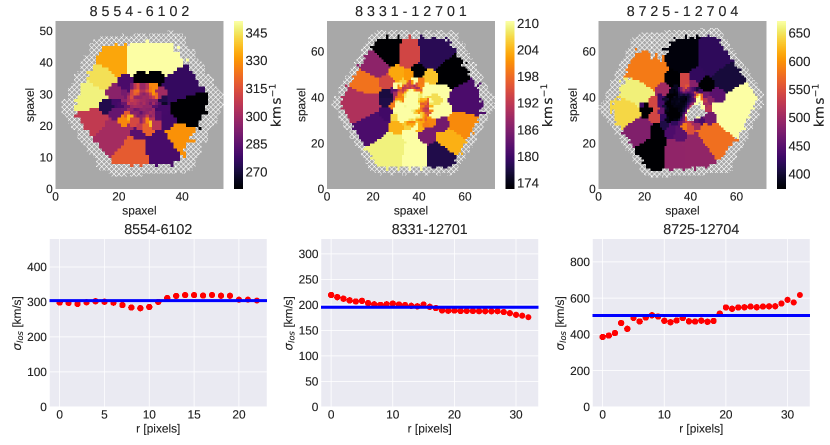
The flat los velocity dispersion of BCGs can be calculated by its one-dimensional profile relative to their centers. We apply Marvin developed in Python (Cherinka et al., 2019) to access and analyze MaNGA Spaxel data for the los stellar velocity dispersion (Figure 1). All data below 20 km s-1 are discarded, because those are considered unreliable (Bundy et al., 2015; Durazo et al., 2018). We calculate the mean los velocity dispersion of each circle. We find the velocity dispersion profiles of BCGs to be remarkably flat. Only one BCG in our sample ‘8943-9102’ exhibits a strongly declining profile. We therefore adopt the average as the characteristic value for each galaxy (blue lines in Figure 1).
3. Results
Our main goal is to explore the empirical kinematic scaling relation between two independent measurements in BCGs: the baryonic mass and the flat los velocity dispersion of stellar components. In addition to the tightness and the correlations among the galactic properties, we also study the intrinsic scatter and the residuals with Bayesian statistics. The relation and the residuals are elucidated in the following subsections.
3.1. MVDR with Bayesian Statistics
In the logarithmic plane of the MVDR, 54 MaNGA BCGs are distributed as a linear relation. We model them by introducing with two independent variables: and . With Bayesian statistics, we implement a Markov Chain Monte Carlo (MCMC) analysis with the orthogonal-distance-regression (ODR) method suggested in Lelli et al. (2019); Tian et al. (2021).
The log-likelihood function is written as
| (4) |
with
| (5) |
where runs over all data points, and includes the observational uncertainties and the lognormal intrinsic scatter ,
| (6) |
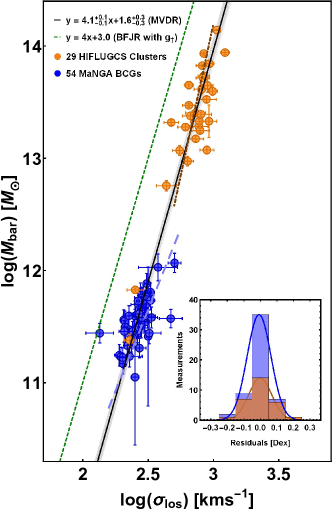
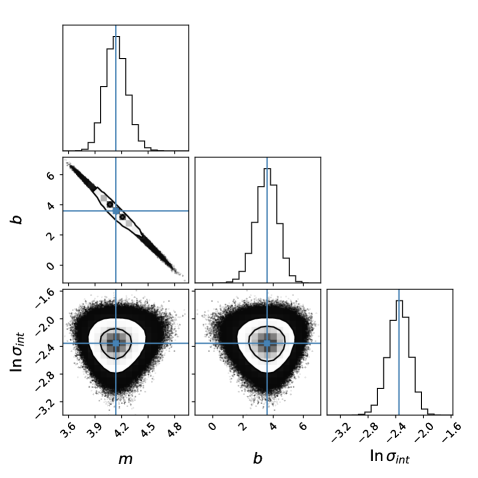
We perform the ODR MCMC analysis for the slope and the intercept implemented in Python (emcee; Foreman-Mackey et al., 2013, 2019). While employing non-informative flat priors on the slope and the intercept within the interval of , and the intrinsic scatter , we discover a tighter correlation by
| (7) |
with a tiny error of the lognormal intrinsic scatter of . We present the regression parameters with the posteriors distribution in the right panel of Figure 2.
To justify the initial assumption of a Gaussian intrinsic scatter perpendicular to the fitting line, we examine the histogram of the orthogonal residuals with respect to Equation (7) (see the inset panel of Figure 2). The distributions of the residuals demonstrate a Gaussian distribution with a tiny half-width (0.07 dex) for both BCGs and clusters.
To derive the precise value of the acceleration scale by the intercept, we apply a fixed slope () and perform the ODR MCMC method again. It gives
| (8) |
with the same lognormal intrinsic scatter . Accordingly, the intercept implies an acceleration scale of m s-2 by assuming Jeans factor (for detail see, e.g., section 4.1 in Tian et al., 2021). This is consistent with that of the CLASH RAR, but larger than observed in spirals (McGaugh et al., 2016).
We also consider the fitting results of BCGs and clusters separately. Two distinct distributions can be divided as 54 MaNGA BCGs and 27 HIFLUGCS clusters. By implementing the same method, we get a different MVDR of BCGs with and . In addition, the other case has been analyzed before: and (e.g., see the section 3.1 in Tian et al., 2021). Two results are illustrated with the blue dashed and the brown dot-dashed line in Figure 2, respectively. Conversely, the uncertainty of the slopes and intercepts are much larger than the full samples due to the narrow dynamical range. Consequently, the two relations are consistent with being drawn from a single underlying relation spanning the entire range from BCGs to clusters.
To estimate the difference in another common fitting method, we calculate the intrinsic scatter along the vertical direction (e.g., see appendix A in Lelli et al., 2019). While performing the vertical MCMC method, we find a similar relation as , albeit with a much larger lognormal intrinsic scatter . Regardless of the scatter, the difference in the slope is negligible between the two methods.
3.2. Residuals
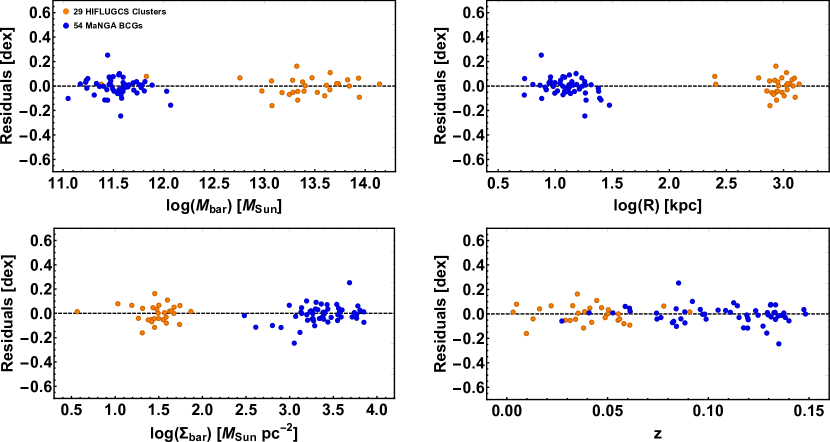
To examine the deviation of the dependence on some major properties of galaxies and clusters, we consider the orthogonal residuals after subtracting Equation (7) against four global quantities: baryonic mass, scale length ( for galaxies; for clusters), surface density, and redshift in Figure 3. The residuals of all samples are distributed within a tiny range from to dex. Moreover, all diagrams display insignificant correlations with four galaxy-cluster properties, which is reminiscent of the BTFR for individual galaxies. Only the mass and velocity dispersion seem to matter. There is no obvious second parameter.
4. Discussions
For the first time, we reveal a tight empirical kinematic correlation, i.e. MVDR, on the BCG-cluster scale. The MVDR is a counterpart of a dynamical relation rather than a coincidence, which can be derived by the CLASH RAR (Tian et al., 2020). As a new discovery of a strong correlation, the MVDR can provide a crucial test for the dark matter problem.
4.1. Consistency with the CLASH RAR
The CLASH RAR derive three implications of the kinematics in BCGs and clusters (Tian et al., 2020, 2021): (1) the flat velocity dispersion profile in BCGs; (2) the flat velocity dispersion profile in galaxy clusters; (3) the MVDR on the BCG-cluster scale as . Initially, the implications in galaxy clusters were first confirmed in Tian et al. (2021) for (2) and partially (3), see Equation (3). Subsequently, our studies examine the rest of (1) and (3) in MaNGA BCGs and validate all the implications of the CLASH RAR. In addition, the MVDR on the BCG-cluster scale is identical to that in HIFLUGCS clusters, see Equation (7) and Equation (3).
A larger acceleration scale also determines a smaller scale length of a flat velocity dispersion profile. In pressure supported systems, Milgrom (1984) defined a scale parameter as , for a flat velocity dispersion. When calculating with instead, we found kpc in MaNGA BCGs. Moreover, this scale is much smaller than a typical kpc (e.g., see Tian et al., 2020), which indicates a flat velocity dispersion even in the innermost region of BCGs.
Besides all the success of our results, one exception in our samples needs to be stressed. BCG ‘8943-9102’ displays a declining profile and contributes the smallest velocity dispersion among the sample. This exception raises an interesting issue on BCGs: whether it appertains to a flat profile inherently.
4.2. Implications for Dark Matter Problems
The CDM model implied the slope of three for the MVDR on the BCG-cluster scale, by assuming a constant baryon fraction (e.g., see section 4.2 in Tian et al., 2021). According their studies, the prediction in the CDM model demonstrated a discrepancy for smaller galaxy clusters. Coincidentally, MaNGA BCGs also disfavors the CDM model with the same offset. On the contrary, the BFJR of elliptical galaxies were explained by adopting the abundance matching relation (e.g., see the discussions in Desmond & Wechsler, 2017; Navarro et al., 2017). Regardless, it still remains a mystery of such an explanation on the BCG-cluster scale.
MOND naturally explained the slope of four for the MVDR on the BCG-cluster scale, although a larger acceleration scale needs to be explained. One conceivable interpretation is the acceleration scale depending on the depth of the potential well (Zhao & Famaey, 2012; Hodson & Zhao, 2017). Besides, two characteristic scales could imply an underlying phase transition mechanism behind. Nevertheless, our discoveries provide a strict test for the attempts on the fundamental theory in MOND paradigm.
5. Summary
In the galactic systems, the acceleration scale dominated in three empirical scaling relations: the RAR, the BTFR and the BFJR. Among them, a tight dynamical relation, the RAR, can infer two kinematic counterparts of the BTFR and the BFJR, and vice versa. In addition, the acceleration scale determined a scale distance for a flat rotation curve and a flat velocity dispersion profile.
On the BCG-cluster scale, our studies filled the gap with such empirical scaling relation, the MVDR, albeit with a larger acceleration scale . The MVDR can be implied by the CLASH RAR as its kinematic relation, and vice versa. While investigating 54 MaNGA BCGs with IFU measurements, our works indicated a flat dispersion profile among all samples except one. Moreover, the flat tail can be determined by according to .
In summary, the consistency between the CLASH RAR and the MVDR was confirmed by three different data sets: CLASH samples, HIFLUGCS clusters, and MaNGA BCGs. Both tight empirical correlations demonstrated tiny intrinsic scatters calculated by Bayesian statistics. Coincidentally, it raises an issue on such similarity between a galaxy and a cluster scale with two different acceleration scales: and , respectively. Nevertheless, the consistency of these relations provides a strict test for the dark matter problem.
ACKNOWLEDGMENTS
We thank Yen-Ting Lin and Shemile Loriega Poblete for the assistance of MaNGA data. We also thank the anonymous reviewer for valuable comments to improve the clarity of this paper. YT, HC, and CMK are supported by the Taiwan Ministry of Science and Technology grant MOST 109-2112-M-008-005. YT is also supported in part by grant MOST 110-2112-M-008-015-MY3. SSM is supported in part by NASA ADAP grant 80NSSC19k0570 and NSF PHY-1911909. YHH is supported by the Ministry of Science & Technology of Taiwan under grant MOST 109-2112-M-001-005 and a Career Development Award from Academia Sinica (AS-CDA-106-M01).
References
- Aguado et al. (2019) Aguado, D. S., Ahumada, R., Almeida, A., et al. 2019, ApJS, 240, 23
- Bernardi et al. (2007) Bernardi, M., Hyde, J. B., Sheth, R. K., Miller, C. J., & Nichol, R. C. 2007, AJ, 133, 1741
- Brouwer et al. (2021) Brouwer, M. M., Oman, K. A., Valentijn, E. A., et al. 2021, A&A, 650, A113
- Bundy et al. (2015) Bundy, K., Bershady, M. A., Law, D. R., et al. 2015, ApJ, 798, 7
- Cherinka et al. (2019) Cherinka, B., Andrews, B. H., Sánchez-Gallego, J., et al. 2019, AJ, 158, 74
- Chiu et al. (2018) Chiu, I., Mohr, J. J., McDonald, M., et al. 2018, MNRAS, 478, 3072
- Desmond & Wechsler (2017) Desmond, H., & Wechsler, R. H. 2017, MNRAS, 465, 820
- Donahue et al. (2014) Donahue, M., Voit, G. M., Mahdavi, A., et al. 2014, ApJ, 794, 136
- Durazo et al. (2018) Durazo, R., Hernandez, X., Cervantes Sodi, B., & Sanchez, S. F. 2018, ApJ, 863, 107
- Famaey & McGaugh (2012) Famaey, B., & McGaugh, S. S. 2012, Living Reviews in Relativity, 15, 10
- Foreman-Mackey et al. (2013) Foreman-Mackey, D., Hogg, D. W., Lang, D., & Goodman, J. 2013, PASP, 125, 306
- Foreman-Mackey et al. (2019) Foreman-Mackey, D., Farr, W., Sinha, M., et al. 2019, The Journal of Open Source Software, 4, 1864
- Giodini et al. (2009) Giodini, S., Pierini, D., Finoguenov, A., et al. 2009, ApJ, 703, 982
- Hodson & Zhao (2017) Hodson, A. O., & Zhao, H. 2017, A&A, 598, A127
- Lelli et al. (2016) Lelli, F., McGaugh, S. S., & Schombert, J. M. 2016, ApJ, 816, L14
- Lelli et al. (2019) Lelli, F., McGaugh, S. S., Schombert, J. M., Desmond, H., & Katz, H. 2019, MNRAS, 484, 3267
- Lelli et al. (2017) Lelli, F., McGaugh, S. S., Schombert, J. M., & Pawlowski, M. S. 2017, ApJ, 836, 152
- McGaugh (2011) McGaugh, S. S. 2011, Phys. Rev. Lett., 106, 121303
- McGaugh (2020) —. 2020, Galaxies, 8, 35
- McGaugh et al. (2016) McGaugh, S. S., Lelli, F., & Schombert, J. M. 2016, Phys. Rev. Lett., 117, 201101
- McGaugh et al. (2000) McGaugh, S. S., Schombert, J. M., Bothun, G. D., & de Blok, W. J. G. 2000, ApJ, 533, L99
- Milgrom (1983) Milgrom, M. 1983, ApJ, 270, 365
- Milgrom (1984) —. 1984, ApJ, 287, 571
- Milgrom (2020) —. 2020, Studies in the History and Philosophy of Modern Physics, 71, 170
- Navarro et al. (2017) Navarro, J. F., Benítez-Llambay, A., Fattahi, A., et al. 2017, MNRAS, 471, 1841
- Oegerle & Hoessel (1991) Oegerle, W. R., & Hoessel, J. G. 1991, ApJ, 375, 15
- Postman et al. (2012) Postman, M., Coe, D., Benítez, N., et al. 2012, ApJS, 199, 25
- Pradyumna et al. (2021) Pradyumna, S., Gupta, S., Seeram, S., & Desai, S. 2021, Physics of the Dark Universe, 31, 100765
- Samir et al. (2020) Samir, R. M., Takey, A., & Shaker, A. A. 2020, Ap&SS, 365, 142
- Sanders (1994) Sanders, R. H. 1994, A&A, 284, L31
- Sanders (2003) —. 2003, MNRAS, 342, 901
- Sanders (2010) —. 2010, MNRAS, 407, 1128
- Sartoris et al. (2020) Sartoris, B., Biviano, A., Rosati, P., et al. 2020, A&A, 637, A34
- Tian et al. (2009) Tian, L., Hoekstra, H., & Zhao, H. 2009, MNRAS, 393, 885
- Tian & Ko (2019) Tian, Y., & Ko, C.-M. 2019, MNRAS, 488, L41
- Tian et al. (2020) Tian, Y., Umetsu, K., Ko, C.-M., Donahue, M., & Chiu, I. N. 2020, ApJ, 896, 70
- Tian et al. (2021) Tian, Y., Yu, P.-C., Li, P., McGaugh, S. S., & Ko, C.-M. 2021, ApJ, 910, 56
- Umetsu et al. (2016) Umetsu, K., Zitrin, A., Gruen, D., et al. 2016, ApJ, 821, 116
- Verheijen (2001) Verheijen, M. A. W. 2001, ApJ, 563, 694
- Yang et al. (2007) Yang, X., Mo, H. J., van den Bosch, F. C., et al. 2007, ApJ, 671, 153
- Zaritsky et al. (2006) Zaritsky, D., Gonzalez, A. H., & Zabludoff, A. I. 2006, ApJ, 638, 725
- Zhang et al. (2011) Zhang, Y. Y., Andernach, H., Caretta, C. A., et al. 2011, A&A, 526, A105
- Zhao & Famaey (2012) Zhao, H., & Famaey, B. 2012, Phys. Rev. D, 86, 067301