FSNet: A Failure Detection Framework for Semantic Segmentation
Abstract
Semantic segmentation is an important task that helps autonomous vehicles understand their surroundings and navigate safely. However, during deployment, even the most mature segmentation models are vulnerable to various external factors that can degrade the segmentation performance with potentially catastrophic consequences for the vehicle and its surroundings. To address this issue, we propose a failure detection framework to identify pixel-level misclassification. We do so by exploiting internal features of the segmentation model and training it simultaneously with a failure detection network. During deployment, the failure detector flags areas in the image where the segmentation model has failed to segment correctly. We evaluate the proposed approach against state-of-the-art methods and achieve , , and performance improvement in the AUPR-Error metric for Cityscapes, BDD100k, and Mapillary semantic segmentation datasets.
I Introduction
Semantic segmentation using deep learning has become crucial for many safety-critical systems such as vision-based self-driving cars [1, 2] and robot-assisted surgery [3, 4]. For instance, semantic segmentation is a significant component for any self-driving car for safety, reliability, and scene understanding [5, 6]. Besides, it plays a substantial role in navigation [7, 8] and obstacle avoidance [9, 10] by segmenting critical objects such as pedestrians and other vehicles in real-time from the visual sensory. Due to its importance, there is ongoing research [11, 12, 13] to improve the overall performance of semantic segmentation to meet the safety-critical demand in robotic vision.
State-of-the-art research in semantic segmentation commonly assumes that the images encountered during training and later during deployment follow a similar distribution. However, this cannot be guaranteed for applications on autonomous vehicles that operate in the open, unconstrained world. The segmentation model will inevitably encounter situations (objects, object configurations, textures), environmental conditions (weather), or imaging conditions (motion blur, illumination, and exposure effects) that were never seen during training. As a result, a severe drop in segmentation performance could occur without prior warning, posing an extreme risk for the vehicle and its surroundings.


The ideal solution to achieve consistent semantic segmentation performance in all conditions is a highly effective, robust, and domain agnostic model trained using all possible scenarios that it will encounter during the deployment phase. However, these requirements are infeasible for a practical scenario. Another approach is to identify and remove inputs that can decrease segmentation accuracy. Out-of-distribution [14] and open-set [15] detection are examples of this approach. However, these approaches still can not scale to the complex semantic scenes and structure in which an autonomous vehicle operates [16].
Similarly, uncertainty and confidence estimation can be used to detect incorrect semantic segmentation. However, recent works from [16] and [17] show that these approaches alone are not effective enough to detect perception failure in semantic segmentation. Instead, [18, 19, 16] have argued in favor of using a specifically trained model to identify the incorrect perception of a target model without depending on approaches such as out-of-distribution, open-set, novelty detection, uncertainty, and confidence estimation.
In the context of semantic segmentation, several approaches such as failure prediction [20, 16], introspective perception [18, 17], and quality prediction [21, 22, 23] train a separate model to identify the semantic segmentation failure. Most of these works are not applicable in autonomous vehicle scenarios, considering the complexity and significant variance of visual sensor inputs encountered by the semantic segmentation network during the deployment. Moreover, these works separately train the segmentation and the failure detection network from each other. Hence, the failure detection network can not access the potentially rich convolutional features of the segmentation network. Besides, a failure-dataset [16, 17] is used to train the failure detection network. The failure-dataset is generated from a relatively smaller holdout set of the initial semantic segmentation training dataset. For example, [17] uses of the segmentation dataset as failure-dataset to train the failure detection network. Therefore, the failure detector cannot exploit the available segmentation dataset and may lack generalizability.
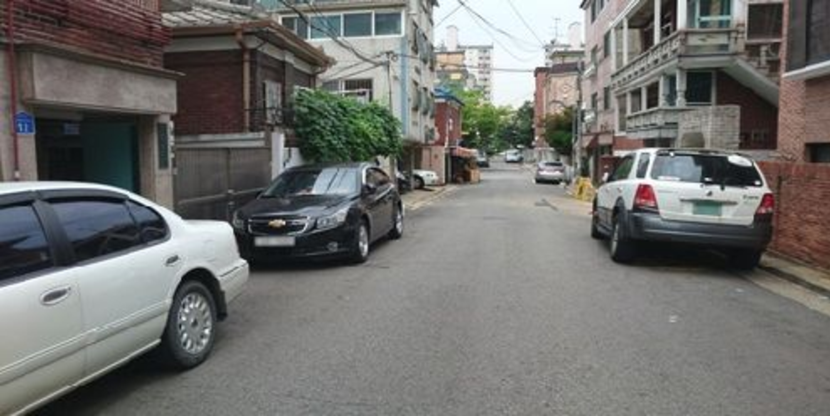
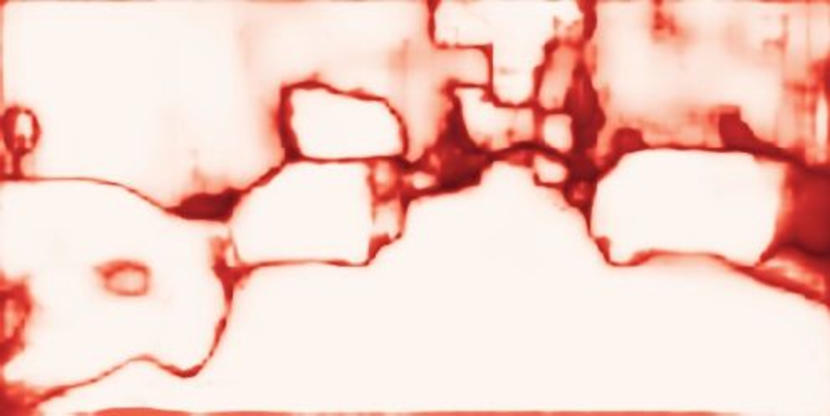
This paper proposes a novel framework, FSNet, consisting of semantic segmentation and a corresponding failure detection network. In contrast to existing works, both of these networks are connected and trained simultaneously. This architecture allows the failure detector to exploit the internal convolutional features of the semantic segmentation network, leading to better failure detection performance. Besides, FSNet uses a joint learning technique to train both networks using the available semantic segmentation dataset. Hence, we can train the failure detection network using the entire segmentation dataset rather than relying on a failure-dataset. We evaluate FSNet against the current SOTA methods using multiple datasets representing in and out-distribution scenarios. Although the segmentation and failure detection networks are connected and trained jointly, our framework does not impede the segmentation accuracy. Our experimental results show that the accuracy of our jointly trained segmentation network is similar to a separately trained network. At the same time, the jointly trained failure detection network outperforms all existing approaches. Figure 1 shows an example of semantic segmentation, the mismatch between the predicted segmentation and ground-truth, and how FSNet can identify that incorrect segmentation.
II Related Works
Failure detection or introspection is an essential requirement in robotics to ensure safety and reliability [24]. Morris [25] first proposed a robotic introspection framework to monitor operational state of robot for decision making purpose. Later [26, 27] extended this idea for semantic mapping and obstacle avoidance in robotics. Zhang et al. [18] introduced alert – a framework that predicts the failure of another model. A similar approach has been used by [19] for failure prediction in MAV, hardness predictor [28] for image classifier, and performance monitoring [23] for robot perception system. In this work, we focus on detecting the failure of a semantic segmentation model in the autonomous vehicle context.
The study of failure detection or identifying the erroneous prediction of a model is closely related to uncertainty and confidence estimation. Hendrycks et al. [29] used Maximum Softmax Probability (MSP) derived from the softmax layer for detecting a failure in classification tasks. This work is considered as the standard baseline in related literature. However, MSP suffers drawbacks such as failure to distinguish between in and out-distribution samples and improper calibration. To reduce the risk of making incorrect classification, Geifman et al. [30] introduced selective classifier. This approach controls and guarantees the risk level of a classifier by using thresholds on pre-defined confidence functions, e.g., MSP. Heinrich et al. [31] introduced trust score that compares the prediction between a classifier and a modified nearest neighbor classifier to measure classifier reliability. Most recently, Corbiere et al. [20] has presented true class probability to improve the unreliable ranking of confidence score. Besides, MC Dropout based techniques have become popular for failure detection in classification. However, Xia et al. [16] has argued that these approaches are not applicable in semantic segmentation because of the lack of information on semantic structure and contexts.
Failure detection in the context of semantic image segmentation is being studied extensively in recent years. Kohlberger et al. [32] used a novel space of segmentation features to predict overlap error and the Dice coefficient of an organ segmentation model. Later, Valindria et al. [33] have introduced reverse classification accuracy to predict segmentation quality of medical image segmentation. Huang et al. [34] showed that segmentation quality could be predicted using QualityNet. [35, 21] showed the application of Bayesian CNN for predicting semantic segmentation failure. [36, 37] used unsupervised learning to quantify the quality of semantic segmentation tasks. However, because providing image-level segmentation quality rather than pixel-level failure detection, these works do not apply to identifying the areas where semantic segmentation is incorrect.
Xia et al. [16] have introduced SynthCP to predict pixel-level failure in semantic segmentation. They also demonstrated the usage of [29, 20, 38, 17] for a similar task. Here, [16] and [17] do not access the internal convolutional features of the segmentation network during the training or inference phase. Besides, these works explicitly use a failure-dataset to train the failure detector and consequently can not exploit the entire segmentation dataset. [29, 38, 20] use indirect approaches of using segmentation confidence and entropy for failure detection, which is suboptimal [16, 17].
Our proposed framework FSNet focuses on addressing the shortcomings of the current research. Firstly, this framework enables the failure detector to access the convolutional features of the segmentation network. Secondly, FSNet jointly trains its networks using the entire segmentation dataset without requiring the explicit failure-dataset. Both of these techniques contribute to the better performance of FSNet than all other existing approaches.
III Approach Overview
This section introduces our failure detection framework FSNet for semantic segmentation. FSNet consists of two connected components – one semantic segmentation network and one failure detection network. We will describe both of these networks and how they work jointly to detect the failure of semantic segmentation.
III-A Module Architecture
| Layer | Operation | Description |
|---|---|---|
| Conv1x1(l) | Applies 2D convolution on with kernel size . | |
| Max(Softmax(l)) | Extracts maximum softmax value across each channel of . | |
| Sigmoid(Entropy(l)) | Uses sigmoid normalization after getting channelwise entropy of . | |
| ArgMax(l) | Returns indices of the maximum value across each channel of . Same as segmentation label. |
FSNet uses a joint architecture to connect the semantic segmentation and corresponding failure detection network and trains these networks end-to-end using the semantic segmentation dataset. FSNet also allows the failure detection network to access internal features of the segmentation network during training and inference.
Let be a basic semantic segmentation network combining a convolutional encoder and decoder . classifies each pixel of a given image of shape into a particular label from a set . uses the convolutional features from the last layer of to generate logits of size . Here and . Based on architectural choice, may exploit features from different layers of . Later, a softmax function is applied on to generate the predicted label map .
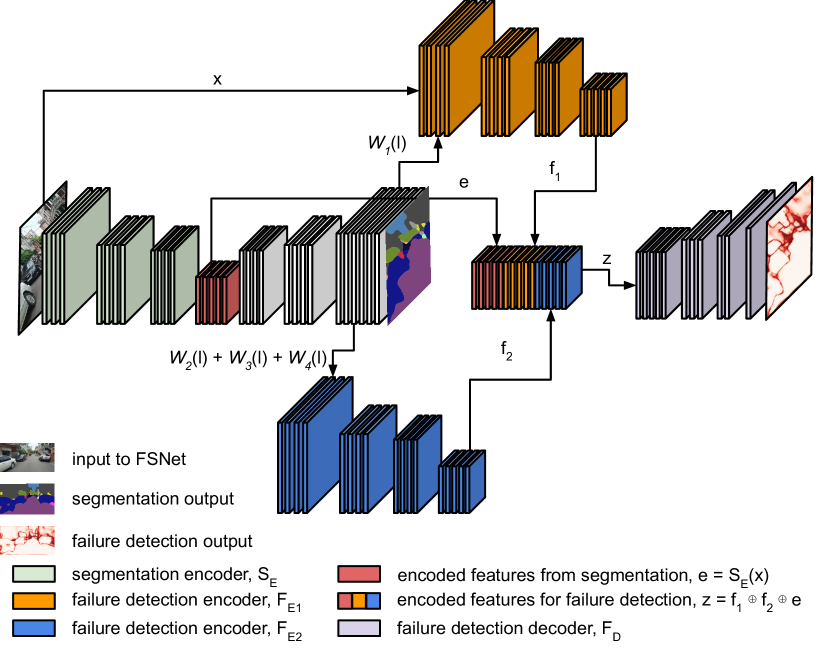
We are proposing a failure detection network to predict , a failure map of size indicating the pixels where is incorrect. consists of two encoders and , and a decoder . These encoders take as input after preprocessed by four different layers listed in Table I. First, uses as its input and produces the encoded feature . Meanwhile, generates encoded feature from . Here, represents channel-wise concatenation operation. Later, using Equation 1, , and are concatenated to generate feature for the failure detection decoder .
| (1) |
takes as input and upsamples it to generate the failure map of size . represents the confidence of that has misclassified . Figure 2 shows an overview of FSNet and the inter-connection among its different components.
III-B Training Procedure
We use a single dataset and two different loss functions – segmentation loss and failure detection loss – to jointly train the semantic segmentation network and the failure detection network of FSNet. Let, for each input , predict the label as . The cross-entropy loss function in Equation 2 is used to calculate the segmentation loss from ground-truth and label prediction .
| (2) |
The task of is to predict the failure of . Therefore, a ground truth is required to represent that failure, so that we can train . Here, is a binary label of size . Each pixel of is either one or zero, indicating the difference or similarity between and . We apply Equation 3 to generate this failure detection ground-truth . During training, is optimized to predict the . Assuming as the output of the failure detection network, we use the balanced binary cross-entropy loss of Equation 4 to calculate the failure detection loss where is the weight balancing factor.
| (3) |
| (4) |
There are two steps in the training procedure. At first, we backpropagate only the loss into FSNet until the segmentation network is converged. This step only trains to perform semantic segmentation. After the convergence of , is used as the new loss. As and are connected, this step jointly optimizes semantic segmentation and failure detection networks. Our experiment shows that without converging first, we can not jointly optimize both networks of FSNet.
IV Experimental Setup
This section describes the experimental setup used for FSNet evaluation. First, we will discuss the in- and out-distribution dataset settings. Later, existing approaches, evaluation metrics, and implementation will be detailed.
In- and Out-Distribution Dataset. We used a training dataset of 2974 images from the Cityscapes [39] dataset to train FSNet and other approaches. There are two settings in the experimental setup. The first one is the in-distribution, where the training and testing data come from the same distribution. We used a testing dataset of 500 images from the Cityscapes for evaluation. In the out-distribution setting, the testing data comes from a different dataset. We used 1000 images from the BDD100k [40] and randomly selected 1000 images from the Mapillary [41] semantic segmentation dataset. All the segmentation networks are trained to segment the 19 classes available in the Cityscapes dataset.
Methods to Compare We compare FSNet failure detection network to multiple methods – MSP [29], MCDropout [38], TCP [20], Direct-prediction [17] and SynthCP [16]. MSP and MCDropout are standard baselines for pixel-level failure detection. Direct-prediction, TCP, and SynthCP use a separate failure-dataset to train the failure detection network. Using this new dataset Direct-prediction uses a separate network to train their failure detector. TCP trains a network to predict the true class probability as a failure indicator. Most recently, SynthCP used a conditional GAN and a comparison module to train a model that identifies the failure of semantic segmentation. SynthCP is the SOTA approach among these works.
In contrast to existing approaches, FSNet jointly trains the semantic segmentation and the corresponding failure detection network. Although jointly trained, FSNet segmentation network should perform similarly to the individually trained segmentation network. To ensure this, we will compare FSNet segmentation network accuracy with the individually trained SynthCP segmentation network.
| Dataset | Methods | FCN8 | DeepLabV2 | ||
|---|---|---|---|---|---|
| mIOU | Cls-Acc | mIOU | Cls-Acc | ||
| Cityscapes | SynthCP | 29.84 | 35.19 | 32.98 | 37.76 |
| in-distribution | FSNet | 29.92 | 39.23 | 33.22 | 41.70 |
| BD100k | SynthCP | 19.42 | 24.52 | 23.97 | 28.46 |
| out-distribution | FSNet | 19.55 | 25.95 | 23.54 | 30.25 |
| Mapillary | SynthCP | 18.90 | 25.28 | 23.40 | 29.05 |
| out-distribution | FSNet | 19.32 | 26.97 | 23.01 | 30.76 |
Evaluation Metrics. Following [20, 16], we used AP-Err, AP-Suc, AUC, and FPR95 as evaluation metrics. AP-Err considers incorrect prediction as positive class and computes the Area Under the Precision-Recall (AUPR) curve. AP-Suc computes AUPR too but considers correct prediction as to the positive class. AUC calculates the area under the Receiver Operating Characteristics, and FPR95 computes False-Positive Rate at 95% True-Positive Rate. FSNet segmentation network is compared with the SynthCP segmentation network using mean Intersection over Union (mIOU) and per-class accuracy (Cls-Acc). mIOU first calculates the IOU for each class and then calculates the average over classes. Cls-Acc measures the percentage of correctly labeled pixels for each semantic class and then averages over the classes.
| Test Dataset | Methods | FCN8 | DeepLabV2 | ||||||
|---|---|---|---|---|---|---|---|---|---|
| AP-Err | AP-Suc | AUC | FPR95 | AP-Err | AP-Suc | AUC | FPR95 | ||
| Cityscapes in-distribution | SynthCP[16] | 55.53 | 99.18 | 92.92 | 22.47 | 49.99 | 99.34 | 92.98 | 21.69 |
| MCDropout[38] | 49.23 | 99.02 | 91.47 | 25.16 | 47.85 | 99.23 | 92.19 | 24.68 | |
| MSP[29] | 50.31 | 99.01 | 91,54 | 25.34 | 48.46 | 99.24 | 92.26 | 24.41 | |
| Direct[17] | 52.16 | 99.14 | 92.55 | 22.34 | 48.76 | 99.34 | 92.94 | 21.56 | |
| TCP[20] | 48.54 | 98.82 | 90.29 | 32.20 | 45.57 | 98.84 | 89.14 | 36.98 | |
| FSNet (Ours) | 67.83 | 98.98 | 94.35 | 21.52 | 57.84 | 99.13 | 93.97 | 21.39 | |
| BDD100k out-distribution | SynthCP [16] | 62.83 | 84.44 | 76.58 | 64.21 | 53.60 | 88.46 | 75.71 | 61.55 |
| MCDropout [38] | 59.77 | 83.78 | 74.85 | 64.68 | 38.26 | 84.18 | 66.27 | 70.10 | |
| MSP [29] | 60.40 | 83.65 | 75.04 | 65.14 | 54.74 | 88.72 | 76.32 | 63.06 | |
| Direct [17] | 61.77 | 84.91 | 76.85 | 62.51 | 53.18 | 88.28 | 75.53 | 61.81 | |
| TCP [20] | 57.99 | 77.54 | 70.77 | 75.66 | 47.9 | 83.02 | 67.47 | 75.10 | |
| FSNet (Ours) | 72.29 | 86.63 | 83.17 | 51.81 | 71.81 | 91.76 | 86.94 | 43.56 | |
| Mapillary out-distribution | SynthCP [16] | 58.64 | 92.97 | 82.22 | 46.91 | 49.51 | 93.72 | 79.57 | 47.05 |
| MCDropout [38] | 57.34 | 93.30 | 82.11 | 46.81 | 47.39 | 93.49 | 78.48 | 52.67 | |
| MSP [29] | 58.29 | 92.97 | 82.53 | 45.35 | 48.03 | 93.65 | 79.32 | 46.63 | |
| Direct [17] | 55.50 | 90.90 | 79.30 | 53.44 | 43.79 | 92.57 | 75.03 | 63.33 | |
| TCP [20] | 56.21 | 93.23 | 81.77 | 47.19 | 32.97 | 92.88 | 73.61 | 55.43 | |
| FSNet (Ours) | 68.29 | 93.76 | 87.75 | 40.19 | 63.19 | 95.68 | 88.95 | 37.36 | |
Implementation. Following [16], we used FCN8 [42] and DeepLabV2 [43] as the semantic segmentation networks in our framework. FCN8 and DeeplabV2 are based on VGG16 and ResNet101 backbone networks, respectively, and pretrained on the MS-COCO semantic segmentation dataset. Both encoders in the FSNet failure detection network use the ResNet18 network pretrained on the ImageNet dataset. Our training process consists of two steps. At first, the FSNet segmentation network is trained only using the segmentation loss for iterations for convergence. For this step, we follow the hyper-parameters and image augmentations used by SynthCP. Then, for the next iterations, FSNet is trained using segmentation and failure detection loss. The failure detection network uses adam optimizer with learning rate .
V Evaluation
This section evaluates the semantic segmentation and failure detection accuracy of FSNet with the existing approaches. It also shows comparative performance for in-distribution and out-distribution settings.
V-A Semantic Segmentation Evaluation
Table II shows the semantic segmentation accuracy between SynthCP and FSNet. In the in-distribution setting, the segmentation accuracy of FSNet based on FCN8 and DeepLabV2 improves by in the Cls-Acc metric. FSNet also shows better performance in the mIOU metric. Both SynthCP and FSNet demonstrated lower accuracy than the in-distribution settings as BDD100k, and Mapillary datasets were unknown to the segmentation network. However, FSNet segmentation accuracy is better than SynthCP for out-distribution setting too. This result shows that we can train segmentation and failure detection networks jointly without degrading the segmentation accuracy.
V-B Failure Detection Evaluation
Table III shows the failure detection accuracy of FSNet and all existing approaches using AP-Err, AP-Suc, AUC, and FPR95 metrics. These metrics are averaged over 19 classes of the Cityscapes dataset. For the in-distribution setting, FSNet failure detection network achieves in AP-Err for identifying failure of FCN8, which is higher than the SOTA – SynthCP. It also outperforms SynthCP in AUC and FPR95. However, FSNet is inferior to SynthCP in the AP-Suc metric. In contrast to SynthCP, FSNet uses a balanced binary cross-entropy loss function to train the failure detection network. It has improved FSNet AP-Err by a large margin for a negligible performance reduction in the AP-Suc. In the same settings, FSNet for DeepLabV2 demonstrates a similar trend by outperforming SynthCP in the AP-Err metric by .
Table III also shows FSNet failure detection accuracy for FCN8 and DeepLabV2 in out-distribution setting. Here, we trained FSNet using the Cityscapes dataset and evaluated using the BDD100k and Mapillary datasets. These experiments illustrate the FSNet generalization capability. In four metrics and two datasets, FSNet outperforms all the existing methods.
We see higher AP-Err in out-distribution than in the in-distribution setting. The reason is the lower semantic segmentation accuracy for out-distribution (see Table II). As the segmentation networks make more label prediction errors in the out-distribution setting, the failure detection network can identify these errors and hence shows better performance in out-distribution than in-distribution.
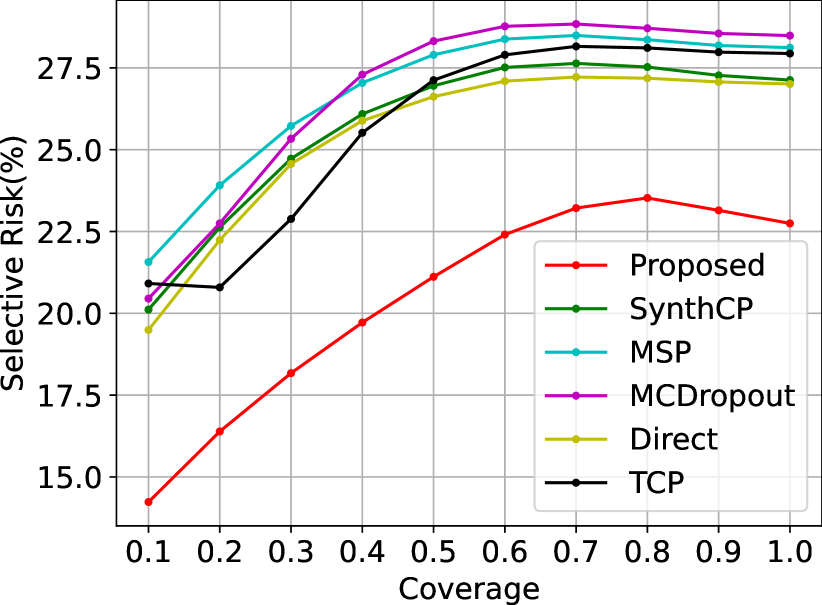
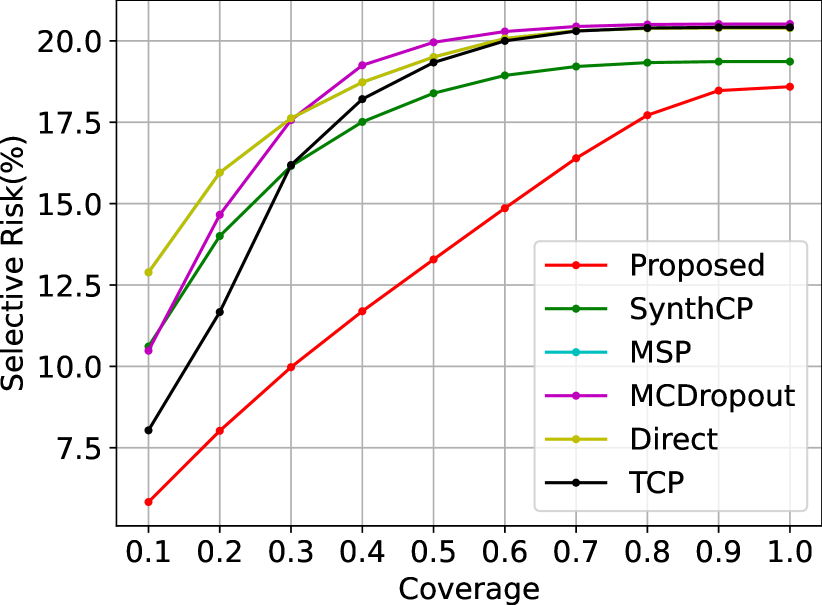
V-C Risk-Coverage Evaluation
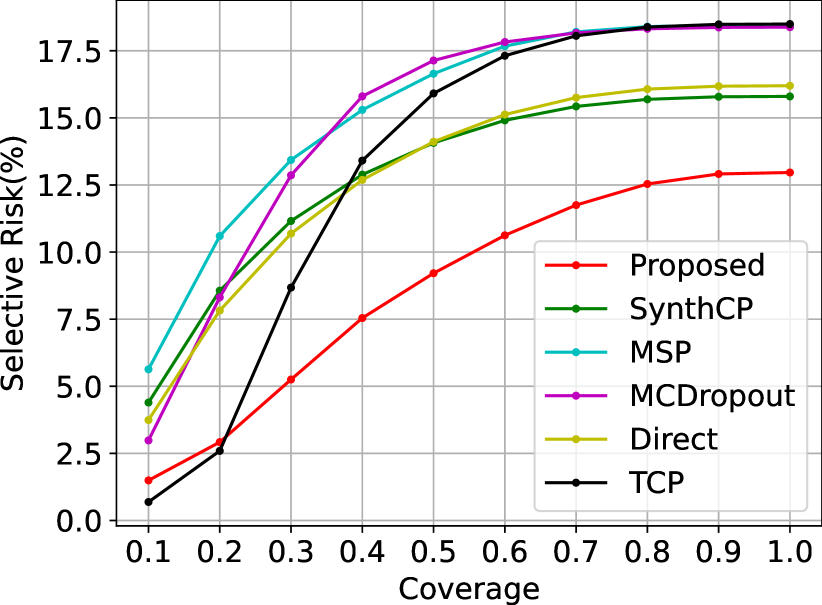
We use the Risk-Coverage [30] curve to evaluate the impact after detecting semantic segmentation failure. Here, Coverage is the percentage of predicted pixel labels that are not flagged as a failure by FSNet, and Risk is the percentage of misclassification error in those predictions. Based on this metric, FSNet can reject the segmentation network’s prediction to achieve the desired risk level.
Figure 3(a) shows Risk-Coverage curves for all approaches while detecting the failure of FCN8 on Cityscapes dataset for in-distribution setting. We plot these curves using ten different Coverage levels. Here FSNet demonstrates lower risk than all existing approaches. As an example, for coverage, risk means FSNet has rejected segmentation prediction assuming that the prediction is incorrect, keeping the coverage . In this coverage, pixels have been incorrectly classified. All other methods show risk levels from to . For DeepLabV2 and in-distribution setting, FSNet risk of failure is for coverage while other existing approach’s risk varies from to .
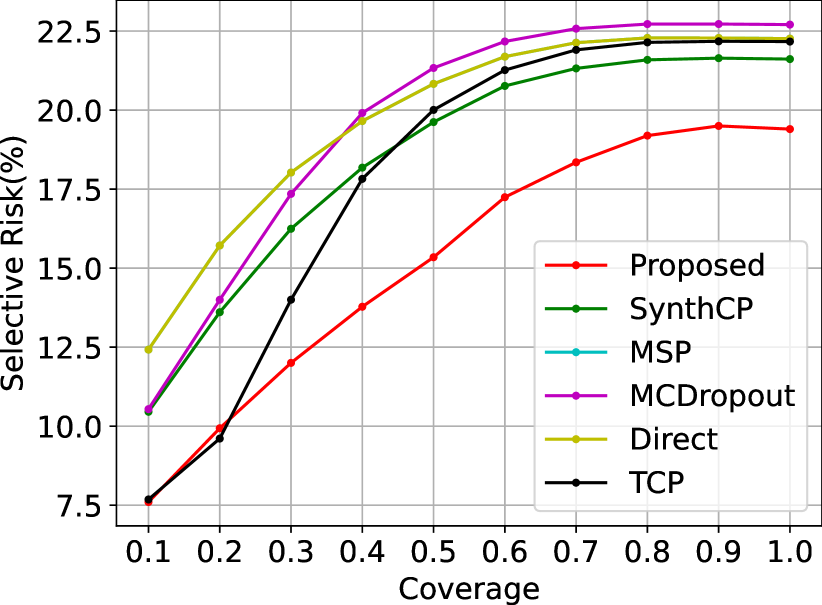
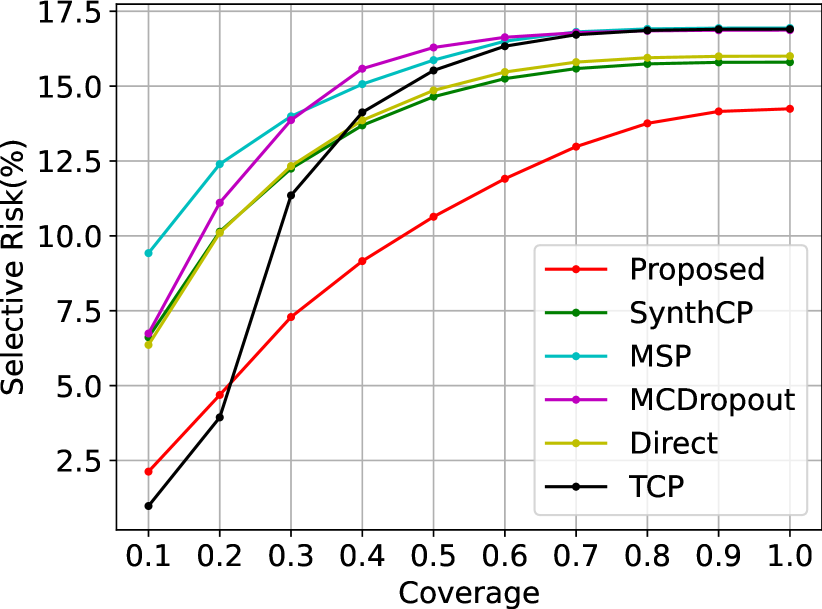
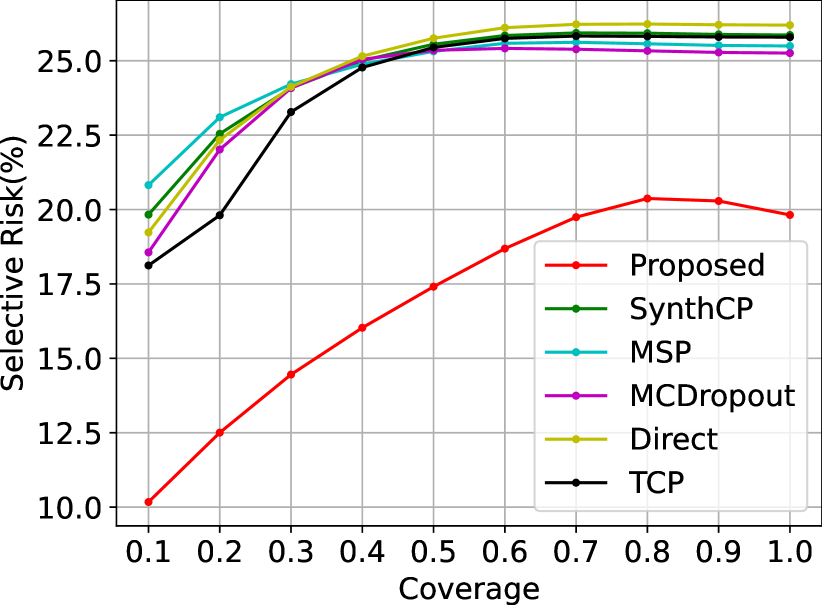
Figure 3(b) and Figure 3(c) show risk-coverage curves for FCN8 in out-distributions setting. In both cases, FSNet show lower risk level than all exisiting methods for all coverage levels. Figure 3(e) and Figure 3(f) show risk-coverage curve for DeepLabV2 in out-distribution settings with the similar trend where FSNet outperforms all existing approaches.
Figure 4 shows qualitative results and the comparison between FSNet and SynthCP for detecting the failure of semantic segmentation.
V-D Discussion
| Dataset | Multi Branch | Full Dataset | Removed Feature | FCN8 | Deeplabv2 | ||||||
|---|---|---|---|---|---|---|---|---|---|---|---|
| AP-Err | AP-Suc | AUC | FPR95 | AP-Err | AP-Suc | AUC | FPR95 | ||||
| Cityscapes | ✓ | ✓ | 60.01 | 98.78 | 92.83 | 24.37 | 52.17 | 99.08 | 93.17 | 22.85 | |
| ✓ | ✓ | 51.40 | 98.04 | 89.37 | 39.42 | 45.53 | 98.34 | 89.49 | 42.44 | ||
| ✓ | ✓ | 61.88 | 98.73 | 92.69 | 25.24 | 50.51 | 99.00 | 92.55 | 24.63 | ||
| ✓ | ✓ | 67.20 | 98.96 | 94.17 | 21.99 | 53.19 | 99.08 | 93.25 | 23.24 | ||
| ✓ | ✓ | 45.85 | 96.11 | 79.85 | 62.31 | 36.19 | 96.50 | 76.67 | 64.90 | ||
| in-distribution | ✓ | ✓ | 52.77 | 98.54 | 91.26 | 26.75 | 54.78 | 99.13 | 93.65 | 22.39 | |
| ✓ | ✓ | - | 67.83 | 98.98 | 94.35 | 21.52 | 57.84 | 99.13 | 93.97 | 21.39 | |
| ✗ | ✓ | - | 65.92 | 98.99 | 94.37 | 20.29 | 54.96 | 99.14 | 93.63 | 22.63 | |
| ✓ | ✗ | - | 65.48 | 98.90 | 93.83 | 23.59 | 50.64 | 99.03 | 92.70 | 26.05 | |
| BDD100k | ✓ | ✓ | 67.75 | 85.36 | 80.59 | 55.15 | 70.09 | 91.74 | 86.71 | 43.83 | |
| ✓ | ✓ | 62.38 | 82.01 | 75.55 | 64.44 | 67.10 | 91.10 | 85.18 | 51.26 | ||
| ✓ | ✓ | 67.02 | 85.39 | 80.74 | 54.43 | 67.86 | 91.38 | 85.73 | 45.48 | ||
| ✓ | ✓ | 71.81 | 86.38 | 82.83 | 52.73 | 69.96 | 91.15 | 86.18 | 47.32 | ||
| ✓ | ✓ | 65.37 | 85.24 | 79.09 | 58.70 | 65.03 | 90.58 | 82.80 | 56.50 | ||
| out-distribution | ✓ | ✓ | 64.27 | 83.80 | 78.25 | 59.23 | 70.76 | 91.85 | 87.01 | 43.68 | |
| ✓ | ✓ | - | 72.29 | 86.63 | 83.17 | 51.81 | 71.81 | 91.76 | 86.94 | 43.56 | |
| ✗ | ✓ | - | 69.63 | 85.27 | 81.12 | 55.51 | 68.14 | 90.74 | 85.32 | 48.29 | |
| ✓ | ✗ | - | 72.00 | 85.67 | 83.05 | 52.95 | 66.67 | 90.67 | 84.87 | 49.92 | |
| Mapillary | ✓ | ✓ | 65.08 | 93.75 | 87.12 | 39.00 | 59.45 | 95.40 | 87.66 | 40.54 | |
| ✓ | ✓ | 59.57 | 91.25 | 82.68 | 51.93 | 56.46 | 95.87 | 87.41 | 41.71 | ||
| ✓ | ✓ | 59.86 | 92.68 | 84.92 | 43.41 | 56.26 | 95.16 | 86.60 | 43.24 | ||
| ✓ | ✓ | 67.68 | 93.78 | 87.57 | 40.60 | 58.61 | 94.97 | 86.84 | 44.04 | ||
| ✓ | ✓ | 61.18 | 93.30 | 84.13 | 48.67 | 53.69 | 95.78 | 84.90 | 47.48 | ||
| out-distribution | ✓ | ✓ | 61.57 | 92.82 | 85.35 | 42.41 | 59.84 | 95.43 | 87.77 | 40.77 | |
| ✓ | ✓ | - | 68.29 | 93.76 | 87.75 | 40.19 | 63.19 | 95.68 | 88.95 | 37.36 | |
| ✗ | ✓ | - | 66.22 | 92.99 | 86.83 | 41.37 | 58.70 | 95.38 | 87.45 | 41.52 | |
| ✓ | ✗ | - | 68.03 | 92.62 | 86.53 | 44.08 | 54.35 | 94.37 | 84.89 | 49.02 | |
Based on experimental results, FSNet outperforms SynthCP and other existing approaches. In the ablation study, we experimented with multiple configurations to find critical components of FSNet. These configurations include single and multi-branch architecture, full and partial-dataset. In a single-branch setting, we used only a single encoder to extract features from the input and logits of the segmentation network. In a multi-branch (see Figure 2), FSNet used two encoders to extract features from the input and logits output. We tested how the dataset size impacts FSNet using full-dataset and partial-dataset comprising and randomly selected Cityscapes training images to train FSNet.
As described in the literature, SynthCP, Direct-prediction, and TCP train a segmentation network and apply that network on an unseen dataset to create a failure-dataset for failure detection training. Hence, the failure-dataset size is significantly smaller, which is - of the segmentation dataset. Therefore, these approaches can not take advantage of the entire available segmentation dataset. On the contrary, FSNet introduces a joint architecture and simultaneously uses the full semantic segmentation dataset to train the segmentation and failure detection networks. Table IV shows the FSNet accuracy for full-dataset and partial-dataset settings. In all cases, the full-dataset setting performs better than the partial-dataset setting.
Table IV shows that the multi-branch network performs better than the single-branch network. This accuracy gain is possible by using separate encoders to extract more informative features from the image and logits output of the segmentation network.
In all existing approaches, either semantic segmentation or a separate network is used for failure detection. However, FSNet failure detection network exploits multiple features from the segmentation network for failure detection. Figure 2 shows how these features are extracted from the segmentation network. We have removed one feature at a time from the FSNet multi-branch failure detection network to study the impact of different features. In Table IV, we have listed the feature name which is removed and the accuracy of FSNet in all metrics after removing them. It shows that the FSNet accuracy drops when any feature is removed from the failure detection network. Based on the ablation study, the most significant features are , and . Without these features, FSNet failure detection accuracy drops below the SynthCP. Table IV shows that our proposed joint architecture significantly improves the accuracy of FSNet for detecting the failure of semantic segmentation network.
VI Conclusion
As deep learning-based semantic segmentation becomes an essential component for autonomous vehicles, identifying the segmentation failure is paramount for ensuring safety and robustness. This paper proposes a novel joint learning framework to train a semantic segmentation and corresponding failure detection network simultaneously. This failure detection network can identify the image area at pixel-level where the segmentation network has made an incorrect prediction. Therefore, our novel framework can inform downstream components in autonomous vehicle systems about expected semantic segmentation reliability. We show the effectiveness of FSNet using multiple datasets, segmentation networks, and evaluation metrics.
References
- [1] M. Treml, J. Arjona-Medina, T. Unterthiner, R. Durgesh, F. Friedmann, P. Schuberth, A. Mayr, M. Heusel, M. Hofmarcher, M. Widrich, et al., “Speeding up Semantic Segmentation for Autonomous Driving,” in MLITS, NIPS Workshop, vol. 2, no. 7, 2016.
- [2] D. Feng, C. Haase-Schuetz, L. Rosenbaum, H. Hertlein, F. Duffhauss, C. Gläser, W. Wiesbeck, and K. Dietmayer, “Deep Multi-Modal Object Detection and Semantic Segmentation for Autonomous Driving: Datasets, Methods, and Challenges,” IEEE Transactions on Intelligent Transportation Systems, vol. 22, pp. 1341–1360, 2021.
- [3] M. Allan, A. Shvets, T. Kurmann, Z. Zhang, R. Duggal, Y.-H. Su, N. Rieke, I. Laina, N. Kalavakonda, S. Bodenstedt, et al., “2017 Robotic Instrument Segmentation Challenge,” arXiv preprint arXiv:1902.06426, 2019.
- [4] A. A. Shvets, A. Rakhlin, A. Kalinin, and V. Iglovikov, “Automatic Instrument Segmentation in Robot-Assisted Surgery using Deep Learning,” 2018 17th IEEE International Conference on Machine Learning and Applications (ICMLA), pp. 624–628, 2018.
- [5] M. Yang, K. Yu, C. Zhang, Z. Li, and K. Yang, “DenseASPP for Semantic Segmentation in Street Scenes,” 2018 IEEE/CVF Conference on Computer Vision and Pattern Recognition, pp. 3684–3692, 2018.
- [6] S. Hao, Y. Zhou, and Y. Guo, “A Brief Survey on Semantic Segmentation with Deep Learning,” Neurocomputing, vol. 406, pp. 302–321, 2020.
- [7] D. Maturana, P.-W. Chou, M. Uenoyama, and S. Scherer, “Real-Time Semantic Mapping for Autonomous Off-Road Navigation,” in Field and Service Robotics. Springer, 2018, pp. 335–350.
- [8] Y. Zhang, H. Chen, Y. He, M. Ye, X. Cai, and D. Zhang, “Road Segmentation for All-Day Outdoor Robot Navigation,” Neurocomputing, vol. 314, pp. 316–325, 2018.
- [9] M. Hua, Y. Nan, and S. Lian, “Small Obstacle Avoidance Based on RGB-D Semantic Segmentation ,” in Proceedings of the IEEE/CVF International Conference on Computer Vision Workshops, 2019, pp. 0–0.
- [10] B. Arain, C. McCool, P. Rigby, D. Cagara, and M. Dunbabin, “Improving Underwater Obstacle Detection using Semantic Image Segmentation,” 2019 International Conference on Robotics and Automation (ICRA), pp. 9271–9277, 2019.
- [11] F. Lateef and Y. Ruichek, “Survey on Semantic Segmentation Using Deep Learning Techniques,” Neurocomputing, vol. 338, pp. 321–348, 2019.
- [12] S. Minaee, Y. Boykov, F. Porikli, A. Plaza, N. Kehtarnavaz, and D. Terzopoulos, “Image Segmentation Using Deep Learning: A Survey,” IEEE transactions on pattern analysis and machine intelligence, vol. PP, 2021.
- [13] A. Garcia-Garcia, S. Orts, S. Oprea, V. Villena-Martinez, P. Martinez-Gonzalez, and J. Rodríguez, “A Survey on Deep Learning Techniques for Image and Video Semantic Segmentation,” Appl. Soft Comput., vol. 70, pp. 41–65, 2018.
- [14] L. Ruff, J. R. Kauffmann, R. A. Vandermeulen, G. Montavon, W. Samek, M. Kloft, T. G. Dietterich, and K.-R. Müller, “A Unifying Review of Deep and Shallow Anomaly Detection,” Proceedings of the IEEE, 2021.
- [15] C. Geng, S.-j. Huang, and S. Chen, “Recent Advances in Open Set Recognition: A Survey,” IEEE transactions on pattern analysis and machine intelligence, 2020.
- [16] Y. Xia, Y. Zhang, F. Liu, W. Shen, and A. L. Yuille, “Synthesize then Compare: Detecting Failures and Anomalies for Semantic Segmentation,” in European Conference on Computer Vision. Springer, 2020, pp. 145–161.
- [17] C. B. Kuhn, M. Hofbauer, S. Lee, G. Petrovic, and E. Steinbach, “Introspective Failure Prediction for Semantic Image Segmentation,” in 2020 IEEE 23rd International Conference on Intelligent Transportation Systems (ITSC), 2020, pp. 1–6.
- [18] P. Zhang, J. Wang, A. Farhadi, M. Hebert, and D. Parikh, “Predicting Failures of Vision Systems,” in Proceedings of the IEEE Conference on Computer Vision and Pattern Recognition, 2014, pp. 3566–3573.
- [19] S. Daftry, S. Zeng, J. A. Bagnell, and M. Hebert, “Introspective Perception: Learning to Predict Failures in Vision Systems,” in 2016 IEEE/RSJ International Conference on Intelligent Robots and Systems (IROS). IEEE, 2016, pp. 1743–1750.
- [20] C. Corbière, N. Thome, A. Bar-Hen, M. Cord, and P. Pérez, “Addressing Failure Prediction by Learning Model Confidence,” arXiv preprint arXiv:1910.04851, 2019.
- [21] T. Devries and G. W. Taylor, “Leveraging Uncertainty Estimates for Predicting Segmentation Quality,” ArXiv, vol. abs/1807.00502, 2018.
- [22] R. Robinson, O. Oktay, W. Bai, V. V. Valindria, M. M. Sanghvi, N. Aung, J. M. Paiva, F. Zemrak, K. Fung, E. Lukaschuk, et al., “Real-time Prediction of Segmentation Quality ,” in International Conference on Medical Image Computing and Computer-Assisted Intervention. Springer, 2018, pp. 578–585.
- [23] C. Gurău, D. Rao, C. H. Tong, and I. Posner, “Learn from Experience: Probabilistic Prediction of Perception Performance to Avoid Failure,” The International Journal of Robotics Research, vol. 37, no. 9, pp. 981–995, 2018.
- [24] Q. M. Rahman, P. Corke, and F. Dayoub, “Run-Time Monitoring of Machine Learning for Robotic Perception: A Survey of Emerging Trends,” IEEE Access, vol. 9, pp. 20 067–20 075, 2021.
- [25] A. C. Morris, “Robotic Introspection for Exploration and Mapping of Subterranean Environments,” Ph.D. dissertation, Carnegie Mellon University, Pittsburgh, PA, December 2007.
- [26] R. Triebel, H. Grimmett, R. Paul, and I. Posner, “Driven Learning for Driving: How Introspection Improves Semantic Mapping,” in Robotics Research. Springer, 2016, pp. 449–465.
- [27] H. Grimmett, R. Triebel, R. Paul, and I. Posner, “Introspective Classification for Robot Perception,” The International Journal of Robotics Research, vol. 35, no. 7, pp. 743–762, 2016.
- [28] P. Wang and N. Vasconcelos, “Towards Realistic Predictors,” in Proceedings of the European Conference on Computer Vision (ECCV), 2018, pp. 36–51.
- [29] D. Hendrycks and K. Gimpel, “A Baseline for Detecting Misclassified and Out-of-Distribution Examples in Neural Networks,” arXiv preprint arXiv:1610.02136, 2016.
- [30] Y. Geifman and R. El-Yaniv, “Selective Classification for Deep Neural Networks,” arXiv preprint arXiv:1705.08500, 2017.
- [31] H. Jiang, B. Kim, and M. R. Gupta, “To Trust Or Not To Trust A Classifier,” in NeurIPS, 2018.
- [32] T. Kohlberger, V. K. Singh, C. Alvino, C. Bahlmann, and L. Grady, “Evaluating Segmentation Error without Ground Truth,” Medical image computing and computer-assisted intervention : MICCAI … International Conference on Medical Image Computing and Computer-Assisted Intervention, vol. 15 Pt 1, pp. 528–36, 2012.
- [33] V. Valindria, I. Lavdas, W. Bai, K. Kamnitsas, E. Aboagye, A. Rockall, D. Rueckert, and B. Glocker, “Reverse Classification Accuracy: Predicting Segmentation Performance in the Absence of Ground Truth,” IEEE Transactions on Medical Imaging, vol. 36, pp. 1597–1606, 2017.
- [34] C. Huang, Q. Wu, and F. Meng, “QualityNet: Segmentation Quality Evaluation with Deep Convolutional Networks,” 2016 Visual Communications and Image Processing (VCIP), pp. 1–4, 2016.
- [35] A. Jungo, R. Meier, E. Ermis, E. Herrmann, and M. Reyes, “Uncertainty-driven Sanity Check: Application to Postoperative Brain Tumor Cavity Segmentation,” ArXiv, vol. abs/1806.03106, 2018.
- [36] S. Chabrier, B. Emile, C. Rosenberger, and H. Laurent, “Unsupervised Performance Evaluation of Image Segmentation,” EURASIP Journal on Advances in Signal Processing, vol. 2006, pp. 1–12, 2006.
- [37] H. Gao, Y. Tang, L. Jing, H. Li, and H. Ding, “A Novel Unsupervised Segmentation Quality Evaluation Method for Remote Sensing Images ,” Sensors, vol. 17, no. 10, p. 2427, 2017.
- [38] Y. Gal and Z. Ghahramani, “Dropout as a Bayesian Approximation: Representing Model Uncertainty in Deep Learning,” in international conference on machine learning. PMLR, 2016, pp. 1050–1059.
- [39] M. Cordts, M. Omran, S. Ramos, T. Rehfeld, M. Enzweiler, R. Benenson, U. Franke, S. Roth, and B. Schiele, “The Cityscapes Dataset for Semantic Urban Scene Understanding ,” in Proceedings of the IEEE conference on computer vision and pattern recognition, 2016, pp. 3213–3223.
- [40] F. Yu, W. Xian, Y. Chen, F. Liu, M. Liao, V. Madhavan, and T. Darrell, “BDD100K: A Diverse Driving Video Database with Scalable Annotation Tooling ,” arXiv preprint arXiv:1805.04687, vol. 2, no. 5, p. 6, 2018.
- [41] G. Neuhold, T. Ollmann, S. Rota Bulo, and P. Kontschieder, “The Mapillary Vistas Dataset for Semantic Understanding of Street Scenes ,” in Proceedings of the IEEE international conference on computer vision, 2017, pp. 4990–4999.
- [42] J. Long, E. Shelhamer, and T. Darrell, “Fully Convolutional Networks for Semantic Segmentation,” in Proceedings of the IEEE conference on computer vision and pattern recognition, 2015, pp. 3431–3440.
- [43] L.-C. Chen, G. Papandreou, I. Kokkinos, K. Murphy, and A. L. Yuille, “DeepLab: Semantic Image Segmentation with Deep Convolutional Nets, Atrous Convolution, and Fully Connected CRFs,” IEEE transactions on pattern analysis and machine intelligence, vol. 40, no. 4, pp. 834–848, 2017.