Also at ]School of Mathematics and Physics, Queen’s University Belfast, Belfast, BT7 1NN, United Kingdom.
Also at ]Maxwell Centre, Cavendish Laboratory, University of Cambridge, Cambridge, United Kingdom
Influence of charged walls and defects on DC resistivity and dielectric relaxations in Cu-Cl boracite
Abstract
Charged domain walls form spontaneously in Cu-Cl boracite on cooling through the phase transition. These walls exhibit changed conductivity compared to the bulk and motion consistent with the existence of negative capacitance. Here, we present the dielectric permittivity and DC resistivity of bulk Cu-Cl boracite as a function of temperature (-140 °C to 150 °C) and frequency (1 mHz to 10 MHz). The thermal behaviour of the two observed dielectric relaxations and the DC resistivity is discussed. We propose that the relaxations can be explained by the existence of point defects, most likely local complexes created by a change of valence of Cu and accompanying oxygen vacancies. In addition, the sudden change in resistivity seen at the phase transition suggests that conductive domain walls contribute significantly to the conductivity in the ferroelectric phase.
This article may be downloaded for personal use only. Any other use requires prior permission of the author and AIP Publishing. This article appeared in Appl. Phys. Lett. 119 202904 (2021) and may be found at (http://doi.org/10.1063/5.0067846)
The boracites form a class of ferroelectrics with the general formula M3B7O13X, where M is a metal and X a halide. As improper ferroelectrics, their interesting crystallography and phase transitions attracted attention in the 1960’s, 70’s and 80’s with the first coupled magnetoelectric multiferroic switching being demonstrated by Ascher et al.Ascher et al. (1966) in Ni3B7O13I and with observations indicative of potential for electro-opticSchmid and Schwarzmüller (1976) and pyroelectric applicationsSchmid et al. (1980); Smith, Rosar, and Shaulov (1981); Whatmore, Herbert, and Ainger (1980). However, the growth of large single crystalsSchmid (1965); Whatmore, Brierley, and Ainger (1980) is difficult and with the development of perovskite oxide ceramic materials possessing diverse functional properties, interest in the boracite family subsequently waned. Recently, however, the discoveries surrounding improper ferroelectricsCatalan et al. (2012); Evans et al. (2020); Feng et al. (2018) and their associated charged domain walls Guy et al. (2021); McQuaid et al. (2017) has rekindled interest in the potential of boracites as functional materials. The charged domain walls in Cu-Cl boracite are particularly remarkable: they present either enhanced conductivity (in 90° tail-to-tail walls) or reduced conductivity (in 90° head-to-head walls) relative to the bulkMcQuaid et al. (2017). Charged walls exist spontaneously in Cu-Cl boracite, to accommodate for the spontaneous shear strain developing at the phase transition, but they can also be injected and repositioned by stress and electric field, making them interesting for the future of nanoelectronicsSeidel (2012); Whyte and Gregg (2015). Uniquely, head-to-head charged walls have been shown to have an unconventional electrostatic response (moving in the opposite direction to that expected under an applied electric field), consistent with the existence of negative capacitanceGuy et al. (2021). This discovery of new properties at domain walls prompts our understanding of the intrinsic properties of boracites to be revisited.
The characterisation of the dielectric properties is particularly important, as it pertains to the unusual electrostatic response of charged domain wallsGuy et al. (2021), as well as playing a role in the piezoelectric and ferroelectric responses. Here, we focus on the characterisation of the dielectric dispersion and resistivity, as functions of temperature, of the same Cu-Cl boracite sample in which the conductivity of charged wallsMcQuaid et al. (2017) and negative capacitance were measuredGuy et al. (2021). We observe two dielectric relaxations and a strong change of resistivity at the phase transition (90 °C) between the high-temperature piezoelectric phase and the low-temperature ferroelectric phaseFernandez-Posada et al. (2021).
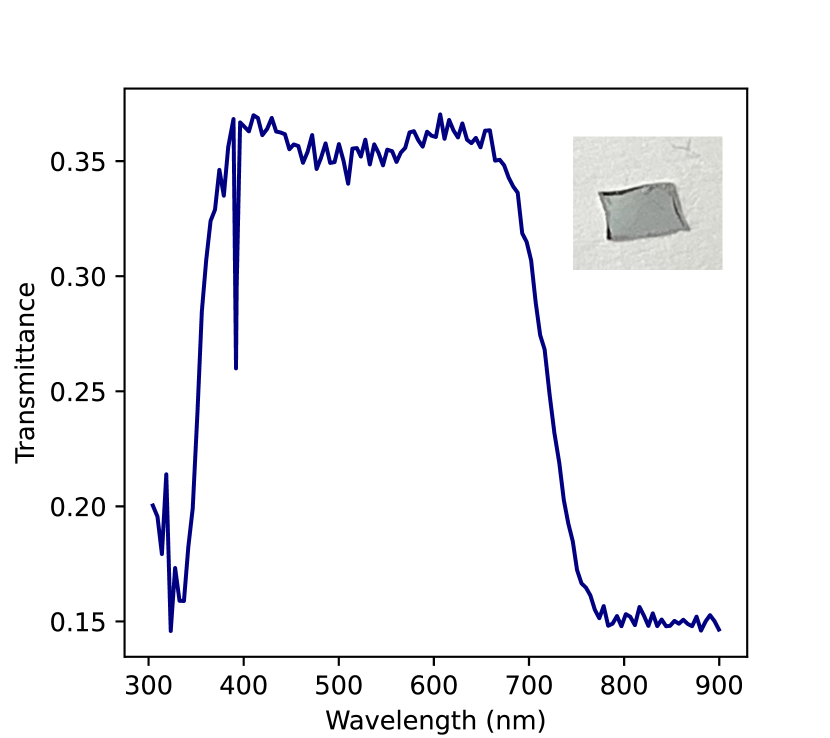
The Cu3B7O13Cl single-crystal was prepared by the phase transport techniqueWhatmore, Brierley, and Ainger (1980). The crystal is about 5x5x1mm3 mirror polished with faces parallel. The sample is transparent with a faint blue coloration. The transmission spectrum of a small piece of the sample was measured on a PerkinElmer Lambda900 spectrometer between 300 nm and 900 nm. The impedance of this crystal was measured at frequencies between 1 mHz and 10 MHz and a driving voltage of 0.5V in a large temperature range of -140 °C to 150 °C , spanning the piezoelectric-ferroelectric phase transition, with steps of 10 or 20 °C using a Novocontrol Concept 40 dielectric spectrometer with the unpoled sample directly contacted with parallel brass plates freshly polished to ensure good contacts and mounted with a mechanical spring. The complex dielectric permittivity and resistivity were calculated classically from the complex impedance.
Figure 1 presents the frequency dispersion of and at different temperatures. Piezoelectric resonances are observed at frequencies above 500 kHz. With decreasing frequency, two relaxations can be clearly observed at frequencies around 1 kHz and 100 kHz at 150 °C. Upon further lowering of frequencies, the real and imaginary parts of the dielelectric permittivity increase rapidly. This increase is consistent with the existence of a resistor in series.
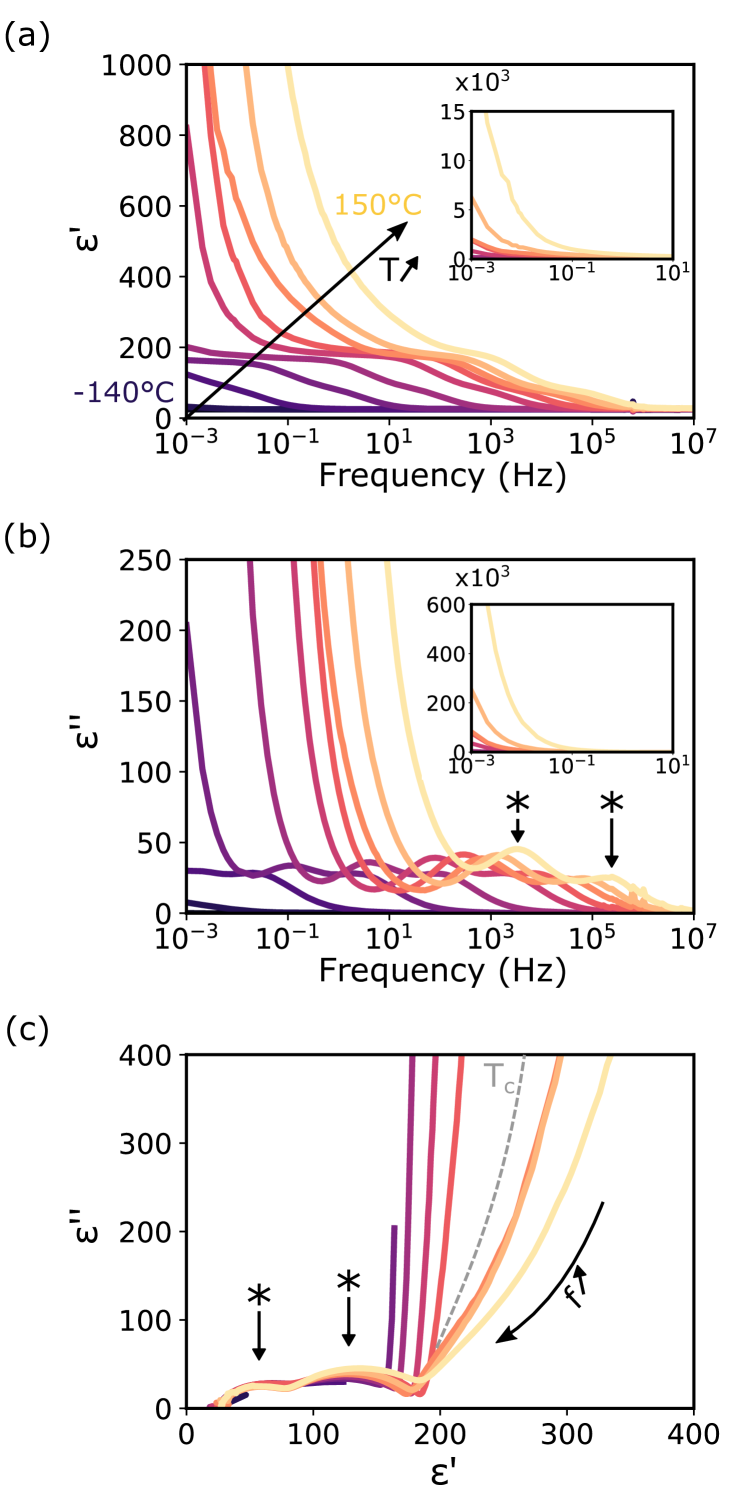
The real and imaginary part were fitted simultaneously for frequencies below piezoelectric resonances for all temperatures. The relaxations were modelled as a Cole-Cole relaxation, and a term was added to describe the low-frequency conductive behaviour, as is commonly done in ferroelectric materialsGranzow (2017)
| (1) |
where and are the amplitudes of the relaxations, and the two characteristic relaxation frequencies, and two exponents, is the DC conductivity, is an empirical constant and is the permittivity at high frequencies. Fitting the two relaxations with the empirical Havriliak-Negami functionHavriliak and Negami (1967) improves marginally the quality of the fit, whereas fitting with two simple Debye relaxations decreases the quality of the fit with respect to the conduction-dominated low-frequency part. All fits lead to similar results regarding the changes in amplitude and frequencies of the relaxations (Supplementary Fig. S1 and S2). The results of fitting at low temperatures (below -50 °C ) was not considered since the two relaxations have moved towards low frequencies and it becomes difficult to differentiate them from one another and from the low frequency conduction. The fitting parameters for the two relaxations, on the one hand, and the DC conductivity, on the other hand, are presented in Fig. 2 and Fig. 3, respectively, and will be discussed separately.
Figure 2 presents the fitted parameters using the Cole-Cole model for the two relaxations. Both relaxations have similar thermal evolution: the relaxation frequencies (Fig. 2a) continuously increase with increasing temperature, the amplitudes of the two relaxations display a jump at the phase transition(Fig. 2b) and the exponents and remain equal to 0.8 across the temperature range investigated (Supplementary Fig. S2).
The smooth continuous increase in relaxation frequencies is a strong indication that these relaxations are not related to Maxwell-Wagner polarisation. Indeed, the frequency associated with this type of relaxation are inversely proportional to the resistivity and dielectric permittivity, and both of these quantities display a sharp increase at the phase transition. This would lead to a sharp decrease of the relaxation frequencies at the phase transition which is absent here.
The temperature evolution of relaxation frequencies is often modelled using the Vogel-Fulcher law, describing an activated process of activation energy and freezing below the temperature
| (2) |
where is the Boltzmann constant and the attempt frequency. The continuous lines in Fig. 2(a) represent the results of the fit to the measured data. Fitting a Vogel-Fulcher law is never trivialCochard et al. (2016), but a few things can be said based on the fitted values shown in Table LABEL:tab:VF.
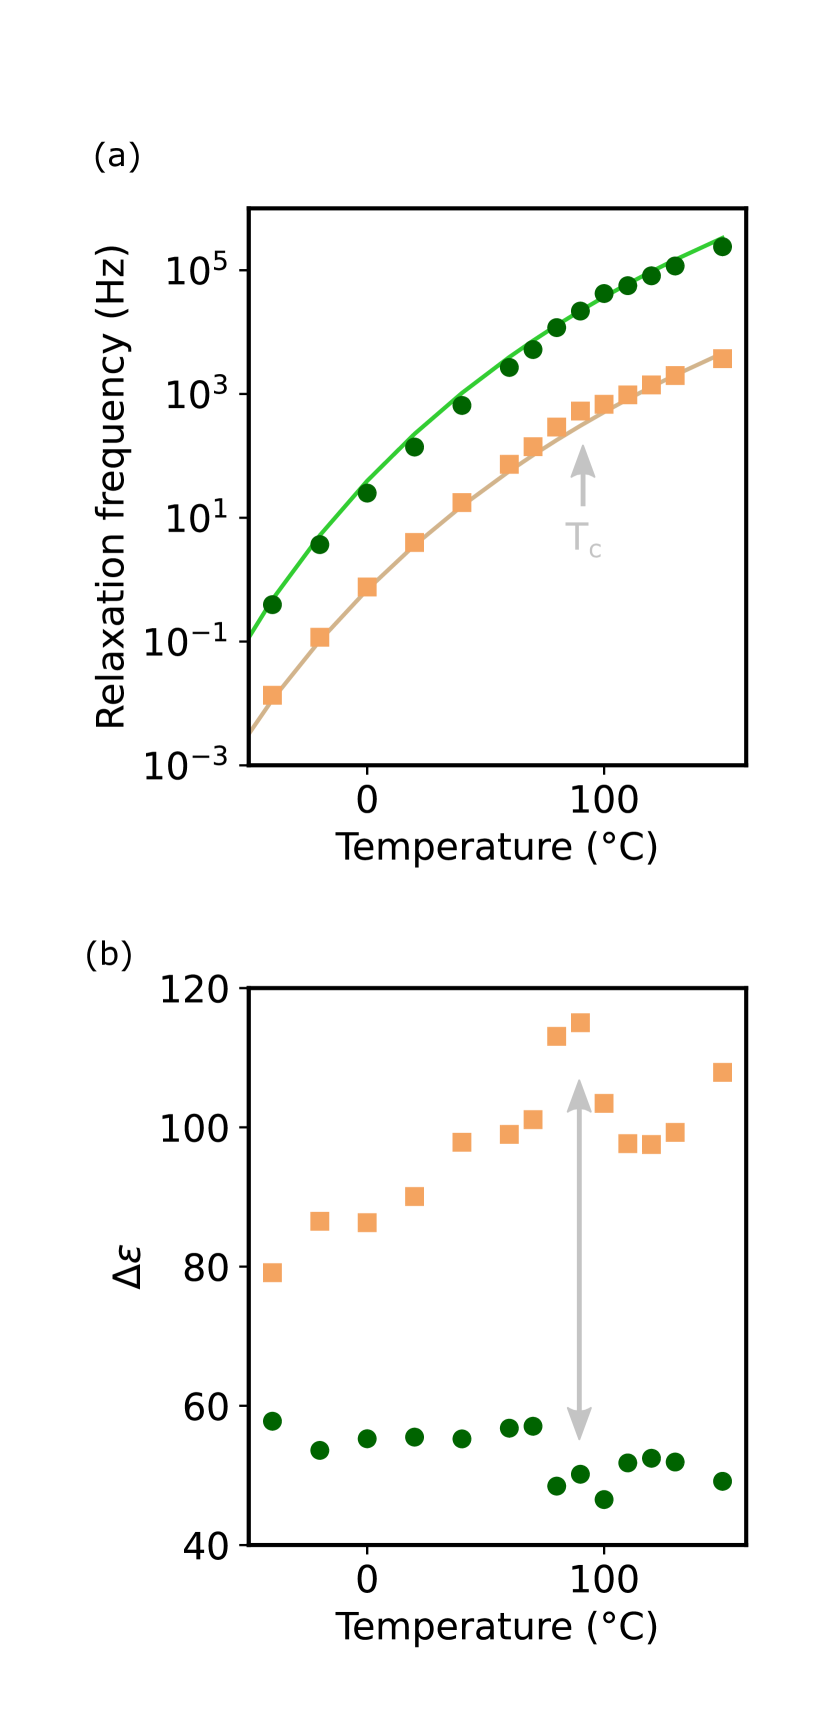
The freezing temperatures were found to be 0 K (within error), suggesting that the processes leading to the relaxations will not freeze. Fixing the freezing temperature to 0 K, i.e. assuming an Arrhenius law, leads to similar results with activation energies that are comparable to the one observed for the lower frequency relaxation, but still within the error associated with the Vogel-Fulcher fits.
A recent studyFernandez-Posada et al. (2021), focusing on the elastic properties of this sample, identified a relaxation process freezing at K, which was attributed to strain relaxation around local ferroelectric dipoles or polarons. The low freezing temperature observed could be broadly consistent with our observations; however, the minimum activation energy ( eV) associated with the strain process is more than an order of magnitude lower than that observed in this work. The differences in activation energies and freezing behaviour suggest different microscopic origins for the relaxation processes reported in the present work and the one previously observed. Specifically, the absence of freezing of the relaxation observed here suggests that the reorientations of local dipoles are independent. Indeed, in a process modelled by an Arrhenius law, there is no assumption of collective response to the applied electric field.
| (eV) | (Hz) | ||
|---|---|---|---|
| Relaxation 1 | |||
| Relaxation 2 |
Notably, the activations energies for both relaxations are the same within error ( eV). This suggests a common origin. Domain wall motion can largely be excluded, as both relaxation phenomena persist above . While a contribution from domains/domain walls below cannot be completely excluded, it is certainly not the main relaxation phenomenon at play.
Perhaps the most classical origin of dielectric relaxations in dielectrics, point defectsElissalde and Ravez (2001); Nataf et al. (2016); Pramanick et al. (2012) are the most likely mechanism for the observed dielectric relaxations. Indeed, the order of magnitude of the activation energies is very similar to that reported for defect states in perovskitesAkkopru-Akgun (2019). UV-visible optical spectroscopy (Fig. 4) indicates the existence of states in the band gap, strongly supporting point defects as a source of the dielectric relaxations. The colour of the sample and the band in the transmission spectrum at 490-540nmKim et al. (1981) both suggest a change of valence of copper Cu. To conserve charge neutrality, this change of valence is likely to be associated with positively charged point defects, such as oxygen vacancies V.
Point defects can lead to dielectric relaxations in several ways: creating a local dipole (or bound charge) that can be reoriented by the electric field, providing a free charge carrier that is moved by the electric field or through the coupling to phonons Gridnev (2002) In parenthesis, defect mobility leads to dielectric relaxations in some cases, but have usually much higher activation energies ( 2 eV in boracite glassEl-Falaky, Guirguis, and Abd El-Aal (2012)) and are rarely observed in ferroelectrics around room temperature. The similar activation energies suggest that the two relaxations “experience” a similar energy landscape. On the other hand, the difference in indicates that, at infinite temperature, the energy barrier between the minima is overcome at different frequencies. This could be explained with different effective masses of the dipoles or charges or by the coupling to two different phonon modes.
For example, the change of valence in copper creates a local dipole but can also lead to polaronic hopping between sites. These two mechanisms would probably have similar energy landscapes, but the dipole reorientation and polaron hopping would have different effective masses. Alternatively, the existence of anisotropy in some of the B-FO tetrahedra could create relaxations with different effective masses. Indeed, in half of the tetrahedra, boron is not located at the centre. This off-centring leads to the existence of local dipoles (even in the high temperature phase) pointing towards chlorine. The position of a Vvacancy would have a strong influence on this local B-O dipole and in turn change the effective mass of the dipole created directly by V. A third option would be a defect complex formed of Cu+ and V; this seems particularly likely, in terms of keeping the electroneutrality of the sample. This complex would have one activation energy, but the Cu+- dipoles and Vwould again have different effective masses. In this discussion, the polarisability of the defects was the main mechanism considered; however, defects can also lead to dielectric relaxation through the coupling to phonon modes. We believe that this coupling is less likely in the present case as the phase transition does not affect the temperature dependence of the relaxation frequency, whereas phonons would be strongly affected. At this point and
by analogy with acceptor- or donor-doped perovskiteSapper et al. (2014); Zhang et al. (2008) and the observed decrease in formation energy when a defect complex is createdEichel et al. (2008); Erhart et al. (2007), we consider that a charge transfer between the two defects is the most likely phenomenon.
Below the frequencies of the dielectric relaxations, a strong increase in both and is observed. It is attributed to the DC conductivity of the sample, which can be determined in two different ways: (i) as a result of fitting to the dielectric dispersion data and (ii) considering the low-frequency (1 mHz) value of the resistivity (Supplementary Figure
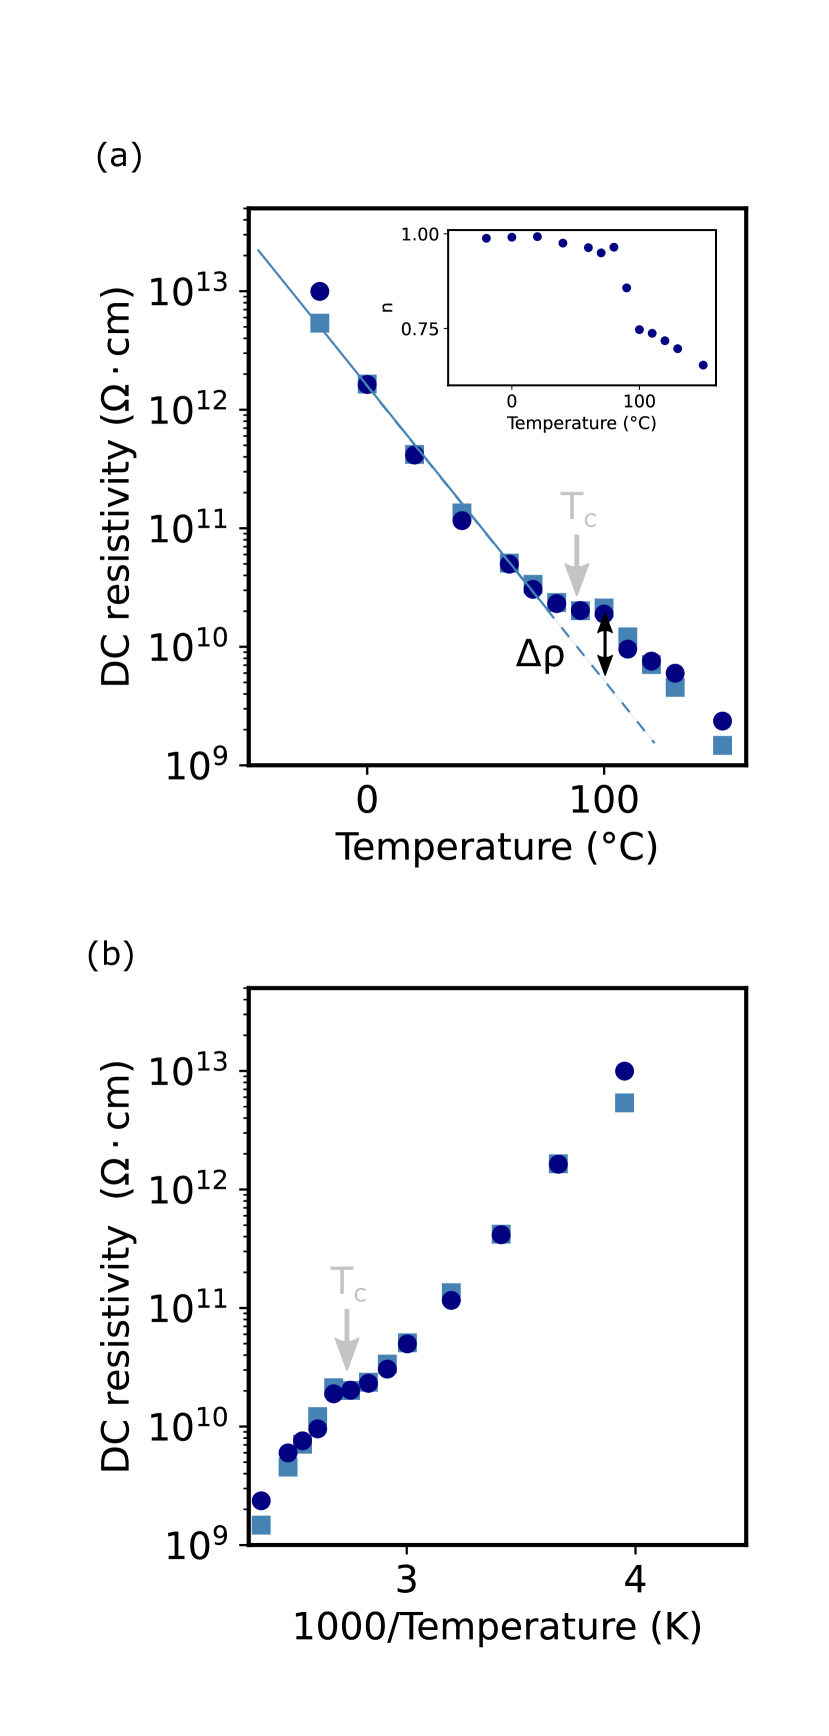
S3a). In both cases, the temperature range was limited to -50 °C and above. Figure 3 presents the thermal behaviour of resistivity determined both ways. The values are in excellent agreement and are of the order of magnitude of the resistivity previously reported in Cu-Cl boraciteSchmid and Petermann (1977), which suggests good reliability of our data.
At the phase transition, a clear jump in resistivity () of about an order of magnitude is observed. A similar step was seen in the exponent n, determined in the fitting procedure (see inset of Fig. 3(a)). This abrupt change is not an artefact, since it can be observed directly on the Cole-Cole plot (Fig. 1c): there is a clear and sudden change in the low frequency impedance across the phase transition. Schmid and PetermannSchmid and Petermann (1977) also reported a sudden change in resistivity at the phase transition, although they observed that the sign of depended on the sample and the poling state. This led the authors, in 1977, to conclude that “this may possibly be due to some spurious domain orientation […] or to a higher conduction along the walls”, even though domain wall conduction had not been experimentally observed in any ferroelectric system at that time. We observed a similar influence of the domain pattern in the DC resistivity measured at room temperature for the same sample after different thermal treatment (Supplementary Fig. S2b and S4): the highest resistivity being more than twice as large as the smallest one. However, now that enhanced or depressed conduction at domain wallsGuy et al. (2021); McQuaid et al. (2017) has been previously observed experimentally through spatially resolved current mapping, it is more likely that the domain walls influence predominantly the DC resistivity rather than “spurious domains”, since single domains samples consistently show higher resistivity than multidomain onesSchmid and Petermann (1977).
In addition to its abrupt change at the phase transition, the DC resistivity decreases with increasing temperature, which indicates an insulator/semiconductor behaviour. It is common to study the temperature dependence to get insight into the physical mechanism responsible for carrier transport. Since Cu-Cl boracite has an optical band gap of 4 eV and the observation of defects state in the band gap, a change in resistivity due to activated hopping between potential wells seems the most likely mechanism. In this case, resisitivity, follows an Arrhenius law:
| (3) |
where is a prefactor representing either the resistivity at at infinite temperature, the activation energy and the Boltzmann constant.
The activation energies were found to differ on each side of the phase transition with eV below and eV above the transition, respectively. These values of activation energies are of the same order of magnitude as the values reported in the literature for Cu-Cl boracite, although we observe the higher activation energy above . Additionally, they are also of the same order as the one reported for the temperature dependence of the electronic conductivity driven by charge transfer between Cu+ and Cu2+ in a halide double perovskiteConnor et al. (2021).
The thermal dependences of the resisitivity are of the same order of magnitude as the activation energies compared to the the one observed for the two dielectric relaxations: it would be natural to assume a similar origin. To explain the difference on each side of the phase transition, it could be hypothesized (see Supplementary Note 1) that, below the phase transition, the decrease in activation energy is due to the existence of conducting domain walls, that tend to display intrinsic semiconducting behaviourEliseev et al. (2011); Liu et al. (2015); Nataf et al. (2020).
In summary, the impedance spectra of Cu-Cl boracite were measured at different temperatures. Two dielectric relaxations and an increase of permittivity at low frequencies, consistent with the existence of a series resistor, were found. The study of the temperature evolution of the two relaxations and the low-frequency conductivity revealed the role of point defects. Based on the similarity of activation energies ( 0.6 eV) and differences in attempt frequencies ( Hz), we suggest that defect complexes, related to a change of valence of Cu and oxygen vacancies, are the most likely. Below the ferroelectric phase transition temperature, a decrease in resistivity is observed, consistent with the appearance of the conductive domain walls known in this system.
Supplementary Material
See supplementary material for the difference between Debye and Havriliak-Negami fitting, the effect of thermal treatment on the complex dielectric permittivity and the resistivity dispersion.
Acknowledgements.
The assistance of C. J. Brierley at Plessey Research (Caswell) Ltd. in growing the boracite crystals is gratefully acknowledged. The authors acknowledge funding from the Engineering and Physical Sciences Research Council (EPSRC: EP/P02453X/1; EP/P020194/1), the US-Ireland Research and Development Partnership Programme (USI 120)Author Declarations
Conflict of interest
The authors have no conflicts to disclose.
Data Availability Statement
The data that support the findings of this study are available from the corresponding author upon reasonable request.
References
- Ascher et al. (1966) E. Ascher, H. Rieder, H. Schmid, and H. Stössel, “Some Properties of Ferromagnetoelectric Nickel-Iodine Boracite, ,” Journal of Applied Physics 37, 1404–1405 (1966).
- Schmid and Schwarzmüller (1976) H. Schmid and J. Schwarzmüller, “Review of Ferroelectric Materials Usable for Passive Electro-Optic Alphanumeric Display Devices,” Ferroelectrics 10, 283–293 (1976).
- Schmid et al. (1980) H. Schmid, P. Genequand, G. Pouilly, and P. Chan, “Pyroelectricity of Fe-I and Cu-Cl boracite,” Ferroelectrics 25, 539–542 (1980).
- Smith, Rosar, and Shaulov (1981) W. A. Smith, M. E. Rosar, and A. Shaulov, “Analysis of pyroelectric and dielectric measurements on boracites,” Ferroelectrics 36, 467–470 (1981).
- Whatmore, Herbert, and Ainger (1980) R. W. Whatmore, J. M. Herbert, and F. W. Ainger, “Recent developments in ferroelectrics for infrared detectors,” Physica Status Solidi (a) 61, 73–80 (1980).
- Schmid (1965) H. Schmid, “Die synthese von boraziten mit hilfe chemischer transportreaktionen,” Journal of Physics and Chemistry of Solids 26, 973–976 (1965).
- Whatmore, Brierley, and Ainger (1980) R. W. Whatmore, C. J. Brierley, and F. W. Ainger, “Nucleation control during the growth of boracite single crystals,” Ferroelectrics 28, 329–332 (1980).
- Catalan et al. (2012) G. Catalan, J. Seidel, R. Ramesh, and J. Scott, “Domain wall nanoelectronics,” Reviews of Modern Physics 84, 119–156 (2012).
- Evans et al. (2020) D. M. Evans, C. Cochard, R. G. P. McQuaid, A. Cano, J. M. Gregg, and D. Meier, “Improper Ferroelectric Domain Walls,” in Domain Walls (Oxford University Press, 2020) p. 129–151.
- Feng et al. (2018) J. S. Feng, K. Xu, L. Bellaiche, and H. J. Xiang, “Designing switchable near room-temperature multiferroics via the discovery of a novel magnetoelectric coupling,” New Journal of Physics 20, 053025 (2018).
- Guy et al. (2021) J. G. Guy, C. Cochard, P. Aguado-Puente, E. Soergel, R. W. Whatmore, M. Conroy, K. Moore, E. Courtney, A. Harvey, U. Bangert, A. Kumar, R. G. McQuaid, and J. M. Gregg, “Anomalous Motion of Charged Domain Walls and Associated Negative Capacitance in Copper–Chlorine Boracite,” Advanced Materials 33, 2008068 (2021).
- McQuaid et al. (2017) R. G. McQuaid, M. P. Campbell, R. W. Whatmore, A. Kumar, and J. M. Gregg, “Injection and controlled motion of conducting domain walls in improper ferroelectric Cu-Cl boracite,” Nature Communications 8, 15105 (2017).
- Seidel (2012) J. Seidel, “Domain walls as nanoscale functional elements,” Journal of Physical Chemistry Letters 3, 2905–2909 (2012).
- Whyte and Gregg (2015) J. R. Whyte and J. M. Gregg, “A diode for ferroelectric domain-wall motion,” Nature Communications 6, 1–5 (2015).
- Fernandez-Posada et al. (2021) C. M. Fernandez-Posada, C. Cochard, J. M. Gregg, R. W. Whatmore, and M. A. Carpenter, “Order–disorder, ferroelasticity and mobility of domain walls in multiferroic Cu–Cl boracite,” Journal of Physics: Condensed Matter 33, 095402 (2021).
- Granzow (2017) T. Granzow, “Polaron-mediated low-frequency dielectric anomaly in reduced ,” Applied Physics Letters 111, 022903 (2017).
- Havriliak and Negami (1967) S. Havriliak and S. Negami, “A complex plane representation of dielectric and mechanical relaxation processes in some polymers,” Polymer 8, 161–210 (1967).
- Cochard et al. (2016) C. Cochard, X. Bril, O. Guedes, and P.-E. Janolin, “Interpretation of Polar Orders Based on Electric Characterizations: Example of Pb(Yb1/2Nb1/2)O3 -PbTiO3 Solid Solution,” Journal of Electronic Materials 45, 6005–6011 (2016).
- Elissalde and Ravez (2001) C. Elissalde and J. Ravez, “Ferroelectric ceramics: Defects and dielectric relaxations,” Journal of Materials Chemistry 11, 1957–1967 (2001).
- Nataf et al. (2016) G. F. Nataf, O. Aktas, T. Granzow, and E. K. Salje, “Influence of defects and domain walls on dielectric and mechanical resonances in LiNbO3,” Journal of Physics: Condensed Matter 28, 015901 (2016).
- Pramanick et al. (2012) A. Pramanick, A. D. Prewitt, J. S. Forrester, and J. L. Jones, “Domains, domain walls and defects in perovskite ferroelectric oxides: A review of present understanding and recent contributions,” Critical Reviews in Solid State and Materials Sciences 37, 243–275 (2012).
- Akkopru-Akgun (2019) B. Akkopru-Akgun, The Role of Defect Chemistry in DC Resistance Degradation of Lead Zirconate Titanate Thin Films, Ph.D. thesis (2019).
- Kim et al. (1981) Q. Kim, R. Somoano, C. Lowe Ma, L. B. Coleman, and A. Moopen, “Studies of defects in improper ferroelectrics,” Ferroelectrics 36, 435–438 (1981).
- Gridnev (2002) S. A. Gridnev, “Dielectric relaxation in disordered polar dielectrics,” Ferroelectrics 266, 171–209 (2002).
- El-Falaky, Guirguis, and Abd El-Aal (2012) G. E. El-Falaky, O. W. Guirguis, and N. S. Abd El-Aal, “A.C. conductivity and relaxation dynamics in zinc–borate glasses,” Progress in Natural Science: Materials International 22, 86–93 (2012).
- Sapper et al. (2014) E. Sapper, R. Dittmer, D. Damjanovic, E. Erdem, D. J. Keeble, W. Jo, T. Granzow, and J. Rödel, “Aging in the relaxor and ferroelectric state of Fe-doped (1-x)(Bi1/2Na1/2)TiO3-xBaTiO3 piezoelectric ceramics,” Journal of Applied Physics 116, 104102 (2014).
- Zhang et al. (2008) L. Zhang, E. Erdem, X. Ren, and R.-A. Eichel, “Reorientation of (MnV) defect dipoles in acceptor-modified BaTiO3 single crystals: An electron paramagnetic resonance study,” Applied Physics Letters 93, 202901 (2008).
- Eichel et al. (2008) R. A. Eichel, P. Erhart, P. Träskelin, K. Albe, H. Kungl, and M. J. Hoffmann, “Defect-dipole formation in copper-doped PbTiO3 ferroelectrics,” Physical Review Letters 100, 1–4 (2008).
- Erhart et al. (2007) P. Erhart, R. A. Eichel, P. Träskelin, and K. Albe, “Association of oxygen vacancies with impurity metal ions in lead titanate,” Physical Review B - Condensed Matter and Materials Physics 76, 1–12 (2007).
- Schmid and Petermann (1977) H. Schmid and L. A. Petermann, “Dielectric constant and electric resistivity of copper chlorine boracite, Cu3B7O13Cl (Cu-Cl-B),” phys. stat. sol. (a) 41, K147 (1977).
- Connor et al. (2021) B. A. Connor, R. W. Smaha, J. Li, A. Gold-Parker, A. J. Heyer, M. F. Toney, Y. S. Lee, and H. I. Karunadasa, “ Alloying a single and a double perovskite: a Cu +/2+ mixed-valence layered halide perovskite with strong optical absorption ,” Chemical Science 12, 8689–8697 (2021).
- Eliseev et al. (2011) E. A. Eliseev, A. N. Morozovska, G. S. Svechnikov, V. Gopalan, and V. Y. Shur, “Static conductivity of charged domain walls in uniaxial ferroelectric semiconductors,” Physical Review B 83, 1–8 (2011).
- Liu et al. (2015) S. Liu, F. Zheng, N. Z. Koocher, H. Takenaka, F. Wang, and A. M. Rappe, “Ferroelectric domain wall induced band gap reduction and charge separation in organometal halide perovskites,” Journal of Physical Chemistry Letters 6, 693–699 (2015).
- Nataf et al. (2020) G. F. Nataf, M. Guennou, J. M. Gregg, D. Meier, J. Hlinka, E. K. Salje, and J. Kreisel, “Domain-wall engineering and topological defects in ferroelectric and ferroelastic materials,” Nature Reviews Physics 2, 634–648 (2020).