wreich@mpifr-bonn.mpg.de, preich@mpifr-bonn.mpg.de 22institutetext: National Astronomical Observatories, Chinese Academy of Sciences, Jia-20 Datun Road, Chaoyang District, Beijing 100101, China;
xygao@nao.cas.cn33institutetext: School of Astronomy and Space Sciences, University of Chinese Academy of Sciences, Beijing 100049, China 44institutetext: CAS Key Laboratory of FAST, National Astronomical Observatories, Chinese Academy of Sciences, Beijing 100101, China
Radio properties of the optically identified supernova remnant G107.0+9.0 ††thanks: Reduced images (FITS) shown in Figs. 4-9 and Fig. 11 are available at the CDS via anonymous ftp to …
Abstract
Context. The vast majority of Galactic supernova remnants (SNRs) were detected by their synchrotron radio emission. Recently, the evolved SNR G107.0+9.0 with a diameter of about or 75 pc up to 100 pc in size was optically detected with an indication of faint associated radio emission. This SNR requires a detailed radio study.
Aims. We aim to search for radio emission from SNR G107.0+9.0 by analysing new data from the Effelsberg 100-m and the Urumqi 25-m radio telescopes in addition to available radio surveys.
Methods. Radio SNRs outside of the Galactic plane, where confusion is rare, must be very faint if they have not been identified so far. Guided by the H emission of G107.0+9.0, we separated its radio emission from the Galactic large-scale emission.
Results. Radio emission from SNR G107.0+9.0 is detected between 22 MHz and 4.8 GHz with a steep non-thermal spectrum, which confirms G107.0+9.0 as an SNR. Its surface brightness is among the lowest known for Galactic SNRs. Polarised emission is clearly detected at 1.4 GHz but is fainter at 4.8 GHz. We interpret the polarised emission as being caused by a Faraday screen associated with G107.0+9.0 and its surroundings. Its ordered magnetic field along the line of sight is below 1 G. At 4.8 GHz, we identified a depolarised filament along the western periphery of G107.0+9.0 with a magnetic field strength along the line of sight G, which requires magnetic field compression.
Conclusions. G107.0+9.0 adds to the currently small number of known, evolved, large-diameter, low-surface-brightness Galactic SNRs. We have shown that such objects can be successfully extracted from radio-continuum surveys despite the dominating large-scale diffuse Galactic emission.
Key Words.:
Radio continuum: ISM – ISM: individual objects: G107.0+9.01 Introduction
When searching for faint planetary nebula, Yuan & Liu (2013) noticed H emission from an almost spherical object with a diameter of about 3, which they proposed to be a so far unidentified supernova remnant (SNR). Fesen et al. (2020) confirmed G107.0+9.0 as an SNR based on optical imaging in several lines and spectroscopic observations, which revealed shock velocities between 70 km s-1 and 100 km s-1. Fesen et al. (2020) estimated the distance of G107.0+9.0 between 1.5 kpc and 2 kpc, implying a size of 75 pc to 100 pc. The SNR is likely in the radiative phase, expanding in a low-density interstellar medium about 235 pc to 315 pc above the Galactic plane.
Optically identified SNRs are rare, while most SNRs are identified by their non-thermal radio emission. The radio emission of new optically detected SNRs must be unusually faint or suffer from confusion with unrelated emission in the Galactic plane. Otherwise, they would already have been identified from the numerous existing all-sky or Galactic plane surveys in radio continuum. However, G107.0+9.0 is located well outside of the strong emission along the Galactic plane, where confusion with other Galactic objects at radio wavelength is low in general. Diffuse large-scale Galactic emission, however, dominates at low frequencies, so objects like G107.0+9.0 with a diameter of about are either masked or cause just small intensity fluctuations.
Fesen et al. (2020) noticed a coincidence with faint radio-continuum emission in the medium-resolution 1420-MHz northern-sky survey by Reich (1982). This indicates that radio emission should be visible in low-frequency surveys as well, and we checked the 22-MHz survey (Roger et al. 1999) and the 408-MHz survey (Haslam et al. 1982). The area of G107.0+9.0 is also covered by the high-latitude extension of the Canadian Galactic plane survey (CGPS in the following) at 408 MHz (Tung et al. 2017) and 1420 MHz (Landecker et al. 2010). These maps have arc-minute angular resolution and are corrected for missing large-scale emission by single-dish data. So far unpublished data from the Effelsberg Medium Latitude Survey (EMLS) at 1.4 GHz, which will comprise the area of the northern Galactic plane up to , and a high-latitude extension of the Sino-German 4.8-GHz survey of the Galactic plane include the area of G107.0+9.0. These surveys have an angular resolution of and and include linear polarisation.
In Sect. 2, we describe the H and radio data used in this study and present maps of G107.0+9.0 and its surrounding area. In Sect. 3, we discuss the results of flux integration of G107.0+9.0 to derive its spectrum. We analyse the observed linear polarisation in the direction of the SNR and apply a Faraday-screen model. Section 4 summarises our results.
2 H and radio data used
2.1 H emission
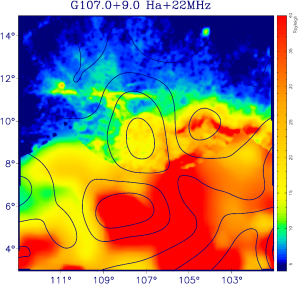
Fesen et al. (2020) presented high-quality optical images and spectra to identify G107.0+9.0 as an SNR. Here, we used the public all-sky H map with 6 angular resolution or less by Finkbeiner (2003), which is a combination of various H surveys and includes G107.0+9.0. Details are given by Finkbeiner (2003). We extracted the H map of G107.0+9.0 and its surroundings (Fig. 1), which shows faint, almost circular H emission from G107.0+9.0. Below a Galactic latitude of 8, the H data have a resolution lower than 6. We superimposed 22-MHz contours of G107.0+9.0 on the H map (Fig. 1) for clarity, because outside of G107.0+9.0, more intense, unrelated H emission is visible, which indicates the presence of thermal gas. The background-subtracted H intensity in the area of G107.0+9.0 is estimated to be between 3 Rayleigh and 7 Rayleigh, while a western filament along the periphery of G107.0+9.0 (also seen in Fig. 3 and Fig. 4) has up to about 12 Rayleigh.
2.2 22-MHz data
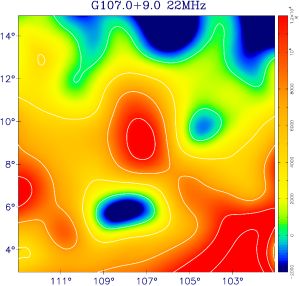
We extracted the area of G107.0+9.0 from the 22-MHz northern-sky survey conducted with the DRAO interferometer (Roger et al. 1999). The angular resolution is EW - NS secant zenith angle), which means that the 22-MHz emission from G107.0+9.0 with about in diameter is barely resolved. We applied the ‘unsharp-masking’ or ‘background-filtering’ method (Sofue & Reich 1979) to separate G107.0+9.0 emission from the dominating large-scale Galactic emission, and we show the 22-MHz map without structures exceeding in extent in Fig. 2. Centrally peaked emission at the quoted SNR position is clearly visible. We fitted the emission from G107.0+9.0 by a two-dimensional Gaussian, where a twisted plane defines the local zero-level, and we calculated a flux density of 468 60 Jy, which is based on the 22-MHz flux density of the nearby SNR Tycho with 680 54 Jy as quoted by Roger et al. (1986). We searched for strong discrete sources in the area of G107.0+9.0, which might have an influence on the flux density of G107.0+9.0. The source 4C +66.24 is in the field and appears to be excessive compared to all other compact sources listed in the area of G107.0+9.0 and its surroundings. Vollmer et al. (2010) used published flux densities of 4C +66.24 between 38 MHz and 4.85 GHz and fitted a spectrum. Its extrapolation gives a flux density at 22 MHz of about 10 Jy, which reduces the flux density of G107.0+9.0 to 458 60 Jy.
2.3 408-MHz data
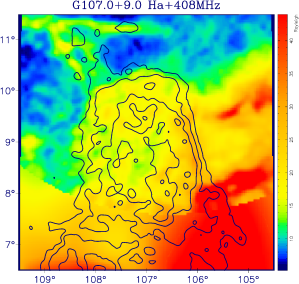
G107.0+9.0 is barely visible in the 51-resolution 408-MHz all-sky survey maps (Haslam et al. 1982). It is much better traced by the CGPS high-latitude extension at 408 MHz (Tung et al. 2017), which combines single-dish, large-scale emission from the 408-MHz all-sky survey (Haslam et al. 1982) and interferometric data. The CGPS 408-MHz survey has an angular resolution of 2 cosec(dec). We processed the CGPS 408-MHz map by removing small-scale structures, like unresolved sources, and also large-scale emission. We separated compact sources and extended emission using the background-filtering method (Sofue & Reich 1979) with a filtering beam of 5, which results in a map with small-scale structures up to 5 and a larger-scale intensity map, where the sum of both maps gives the original map. The larger scale map was processed in the same way, but now removing structures exceeding about 3. We noted a non-uniform emission gradient towards higher Galactic latitudes, which makes it difficult to trace the outer boundary of the emission from G107.0+9.0. We could partly remove this emission gradient by defining new zero-levels for each row of the map by setting the edge areas to zero. We show the result of our processing in Fig. 3, where 408-MHz contours are superimposed on the H-emission map (Fig. 1). The 408-MHz emission coincides well with the H emission from G107.0+9.0. We integrated the filtered 408-MHz emission of G107.0+9.0 up to a radius of and obtained a flux density of 23 3 Jy.
2.4 1.4-GHz data
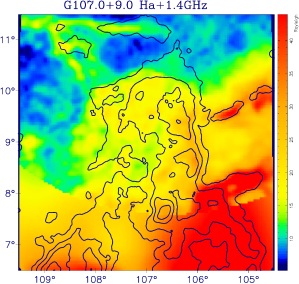
Fesen et al. (2020) (their Fig. 12) noted faint 1420-MHz continuum emission from the northern-sky survey (Reich 1982) possibly associated with G107.0+9.0. The 1420-MHz survey was carried out with the Stockert 25-m telescope with 36 angular resolution. G107.0+9.0 is clearly visible on the Effelsberg Medium Latitude Survey (EMLS) 1.4-GHz maps (Uyanıker et al. 1998, 1999; Reich et al. 2004). This section of the EMLS is not yet published. The CGPS 1420-MHz Galactic plane survey extension (Landecker et al. 2010) also covers the area of G107.0+9.0 with an angular resolution of cosec(dec). The interferometric data need the addition of large-scale structures from single-dish surveys for reliably tracing extended structures like G107.0+9.0. For the high-latitude CGPS extension, these large-scale structures were provided by the 1420-MHz Stockert survey for total intensities, and for polarisation by data from the DRAO 26-m telescope (Wolleben et al. 2006). Both single-dish surveys have comparable angular resolutions. The EMLS data were included in the CGPS 1420-MHz data of the Galactic plane, but not in its high-latitude extension, because the EMLS data were not available at that time. The missing emission from the EMLS increases the influence of baseline fluctuations from the low-resolution surveys, which lowers the quality of extended source images. In their Fig. 3, Landecker et al. (2010) showed that the data from the Effelsberg 100-m telescope are essential for baselines between 9 m and 35 m, corresponding to emission structures between about 100 and about 30 in size, while the interferometric and low-resolution surveys as part of the CGPS have a low weight and thus do not contribute much when combining all data. We added the total-intensity and linear-polarisation data from this section of the EMLS to the CGPS data in the same way as that already described by Landecker et al. (2010). The combined 1420-MHz data show structures down to about in size on an absolute zero-level for both, total intensities and linear polarisation. However, we note numerous compact unresolved sources that mask the faint emission from G107.0+9.0. We separated compact sources and extended emission in the same way as described in Sect. 2.3 with a filtering beam of 3, which results in a map with small-scale structures up to 3 and a larger-scale intensity map. The small-scale structures originate from the long-spacing data provided by the DRAO interferometer. We did not find any filamentary structures in the small-scale map, just compact sources. We convolved the small-scale map to the Effelsberg beam and subtracted it from the EMLS map, which more clearly shows the emission from the SNR G107.0+9.0. We subtracted the large-scale emission by a ’twisted’ plane, so the edge areas of the map are close to zero, and show the result in Fig. 4.
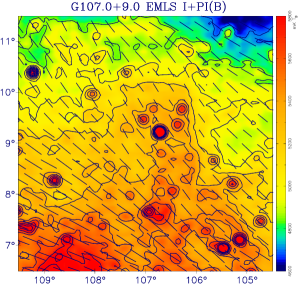
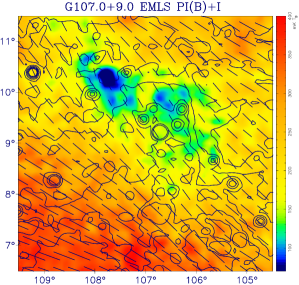
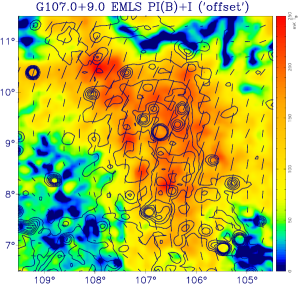
The 1.4-GHz total-intensity EMLS map at an absolute zero level with overlaid bars of polarisation angles is shown in Fig. 5. The length of the bars is proportional to , which was calculated from the observed Stokes parameter and as , including a polarisation zero-bias correction. (=r.m.s.-noise) is listed in Table 1 together with technical and calibration data for the EMLS. When adding 90 to the polarisation angle = 0.5 atan, the magnetic field direction (B-field) is indicated in the case of negligible Faraday rotation. We show the EMLS map in Fig. 6. Towards the centre of G107.0+9.0, decreases by about 120 mK, while for a few small areas outside of G107.0+9.0, the decrease is up to 200 mK when compared to its surroundings. A depression of polarised emission is unexpected for an SNR, where polarised emission is usually excessive compared to its surroundings. However, the latter case is valid for SNR maps, which typically are at a relative zero-level, where the edge areas of the observed and maps were defined to be zero. The polarisation data from the EMLS are on an absolute level, so we subtracted a twisted plane from the and maps to obtain intensities near zero for the edge areas of the maps. The resulting map is shown in Fig. 7 with overlaid contours of total intensities, which are also at a relative zero-level obtained in the same way as for and . We also show s, which deviate significantly in direction when compared with the s displayed in Fig. 6. is now stronger when compared to its surroundings and coincides with the enhanced total-intensity emission from G107.0+9.0, but also shows enhanced extending beyond the boundaries of the SNR, which is defined by its total-intensity emission. We estimated values in the range of 160 mK to 170 mK in the central area of G107.0+9.0, where total intensities are around 220 mK . This corresponds to a percentage polarisation of about 75%, which is unusually high for SNRs and close to the upper limit for synchrotron emission. The polarisation maps including the high-resolution interferometric CGPS data do not show small-scale polarised features from G107.0+9.0.
We measured an integrated 1.4-GHz flux density for G107.0+9.0 of 10.1 1.5 Jy.
| Data | Urumqi 4.8 GHz | EMLS 1.4 GHz |
|---|---|---|
| Frequency [GHz] | 4.8 | 1.4 |
| Bandwidth [MHz] | 600 | 20 |
| HPBW[] | 9.5 | 9.4 |
| Main calibrator | 3C286 | 3C286 |
| Flux density of 3C286 [Jy] | 7.5 | 14.4 |
| Polarisation percentage of 3C286 [%] | 11.3 | 9.3 |
| Polarisation angle of 3C286 [] | 33 | 32 |
| r.m.s. () [mK ] | 1.0/0.5 | 15/8 |
| Frequency [MHz] | 22 | 408 | 1400 | 4800 |
|---|---|---|---|---|
| Flux density [Jy] | 458 | 23 | 10.1 | 2.6 |
| Flux density error [Jy] | 60 | 3 | 1.5 | 0.4 |
2.5 Urumqi medium-latitude 4.8-GHz data
The Sino-German 4.8-GHz polarisation survey of the Galactic plane within latitudes of was carried out with the Urumqi 25-m telescope between 2004 and 2009 and published in a series of papers (Gao et al. 2010; Xiao et al. 2011; Sun et al. 2011). A review and summary of the 4.8-GHz survey results was given by Han et al. (2015). The survey has an angular resolution of and a r.m.s.-sensitivity as listed in Table 1, where also calibration data are listed. Observations of regions with higher Galactic latitudes were made at times when the Galactic plane was at too low elevations to allow high-quality mapping observations for the survey. The properties of the Urumqi survey, the observational set-up, and its reduction and calibration procedures were already described in detail in Sun et al. (2007) and were applied to the medium-latitude regions as well. Diffuse polarised emission requires an absolute zero-level for its correct interpretation, which is not only mandatory for interferometric data but also for single-dish maps (e.g. Reich 2006). These data were provided for the observed Urumqi polarisation data by extrapolating WMAP absolute polarisation data at 22.8 GHz (Hinshaw et al. 2009), which we also used for the high-latitude region assuming a typical temperature spectral index for Galactic synchrotron emission of = -3 with .
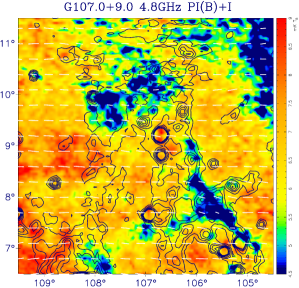
We show the total-intensity map with superimposed polarisation bars in Fig. 8. Extended total-intensity emission is faint with some stronger compact background sources in the area of G107.0+9.0. After subtraction of compact sources from the field, we obtained an integrated flux density of 2.60.4 Jy at 4.8 GHz. Polarisation is dominated by uniform large-scale Galactic emission, where s show the B-field direction to run almost parallel to the Galactic plane.
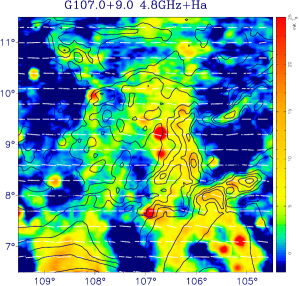
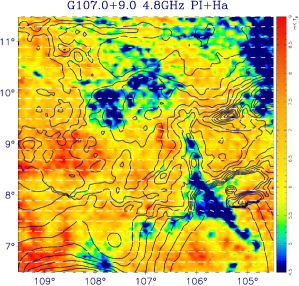
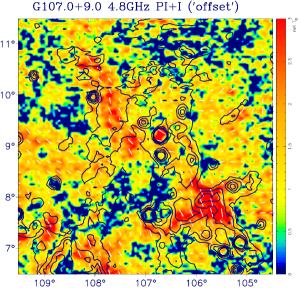
Except for a faint depolarised filament, G107.0+9.0 is not very clearly seen in polarised emission at 4.8 GHz (Fig. 9) when compared to the EMLS map (Fig. 6). Figure 10 shows the 4.8-GHz polarised emission with overlaid H intensity contours to indicate the relation between enhanced H intensities and depolarisation. This result remains unchanged after processing the 4.8-GHz polarisation data in a similar way to that done at 1.4 GHz, where , and are on a local zero level by subtracting a twisted plane defined by the edge-area intensities from the observed maps (Fig. 7). The result is shown in Fig. 11. An extended broad polarisation ridge extends across the entire map along the magnetic field direction and is not limited to the area of G107.0+9.0. This is unexpected for an SNR, and we conclude that most of the polarised emission at 1.4 GHz and 4.8 GHz does not originate from SNR G107.0+9.0 itself, but likely from an associated Faraday screen (FS) acting on the polarised Galactic background emission as discussed in Sect. 3.2.2.
2.6 Flux densities and spectrum
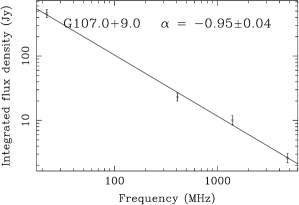
Table 2 lists the obtained integrated flux densities of G107.0+9.0, where we subtracted the flux densities of compact sources before integrating in rings up to a radius of 15 starting at the centre of G107.0+9.0. For the low-resolution 22 MHz map, we performed a Gaussian fit and subtracted 10 Jy to account for the contribution of the strong source 4C +66.24 in the field. The contributions from fainter sources in the area of G107.0+9.0 could be ignored, because their contribution is about the same for the local zero level. Figure 12 shows the resulting integrated flux-density spectrum of G107.0+9.0, which covers a wide frequency range. The spectrum is fitted well and results in a spectral index of ().
3 Discussion
3.1 Total intensities
The total-intensity spectrum of G107.0+9.0 has a non-thermal spectral index of , which is in agreement with its identification as a non-thermal SNR, where its morphology resembles an asymmetric thick-shell SNR. The spectrum of G107.0+9.0 is steeper than that of the majority of shell-type SNRs in the adiabatic phase, which is around (Dubner & Giacani 2015) and may support the view of an SNR in the radiative phase of evolution (Fesen et al. 2020). The surface brightness of G107.0+9.0 of W m-2Hz-1sr-1 at 1 GHz is among the lowest of the about 300 Galactic SNRs known at present. It is at the surface brightness level of G152.4-2.1 (Foster et al. 2013), which was the lowest SNR surface brightness known in 2013. It is about five times brighter than G181.1+9.5, a faint shell-type SNR outside of the Galactic plane, located in the Galactic anti-centre at the same latitude as G107.0+9.0. Currently, G181.1+9.5 is the SNR with the lowest known surface brightness (Kothes et al. 2017).
3.2 Polarised emission
The Effelsberg and Urumqi maps at 1.4 GHz and 4.8 GHz include linear-polarisation data. Detected polarised emission from G107.0+9.0 will strengthen its identification as an SNR. The Urumqi 4.8-GHz data do not show strong polarised emission. A depolarised filament is seen along the western periphery of G107.0+9.0. In contrast, we note a clear polarised signal across the entire area of G107.0+9.0 at 1.4 GHz. We also note enhanced polarised emission extending beyond the boundary of G107.0+9.0, which is unexpected if it is related to the SNR. We see a depression in polarised emission on the absolute zero-level EMLS map (Fig. 6). When subtracting the surrounding polarised emission in and , polarised emission from G107.0+9.0 is visible (Fig. 7) with a rather different orientation of compared to the absolute zero-level map.
This can be interpreted in two ways. Either the local magnetic field in the G107.0+9.0 area has a different orientation compared to the large-scale Galactic field, so the polarised emission we see towards G107.0+9.0 is reduced when added with the diffuse Galactic emission along the line of sight; alternatively, G107.0+9.0 hosts a regular magnetic field component along the line of sight that acts as an FS. In this case, the Galactic background emission beyond G107.0+9.0 is rotated and adds to the polarised foreground emission of G107.0+9.0 causing a depression with respect to its undisturbed surroundings.
At 1.4 GHz, we derived a percentage polarisation for G107.0+9.0 of about 75%, but do not see corresponding polarised emission at a similar percentage level at 4.8 GHz, which is unexpected because of decreasing depolarisation towards higher frequencies. Within the area of G107.0+9.0, the polarised signal is less uniform than at 1.4 GHz, showing emission patches of about 1 mK - 2 mK in . This is below the expected level of about 5 mK when extrapolating 1.4-GHz for a steep spectrum with a temperature spectral index . The maximum polarised signal in the -map at 4.8 GHz is about 3.7 mK ; however, outside of G107.0+9.0 at = 105 (Fig. 11). The morphology of the diffuse 1.4-GHz polarised emission and the rather uniform distribution of s (see Fig. 7) are untypical for shell-type SNRs. In particular, it is unusual that the polarised emission partly extends beyond the total-intensity boundaries of G107.0+9.0. This is most clearly seen towards the northeast of G107.0+9.0. From the polarisation properties at 1.4 GHz and 4.8 GHz, we conclude that the major portion of the polarised emission at 1.4 GHz results from an FS effect, most likely associated with G107.0+9.0 and its surroundings.
3.2.1 Rotation measures of extragalactic sources and pulsars in the area of G107.0+9.0
Rotation measures (s) of polarised extragalactic sources in the G107.0+9.0 area were selected from the catalogue by Xu & Han (2014)111http://zmtt.bao.ac.cn/RM/. describes the wavelength-dependent , which deviates from the intrinsic polarisation angle , via = + From = 0.81 [cm-3] G] [pc], we obtain information about the regular magnetic component along the line of sight and the thermal electron density . In general, the s of the extragalactic sources are almost all negative, with an average of about -51 rad m-2 for the area centred on G107.0+9.0 with a radius of 2 to 3. s decrease outside of the field at the same latitudes to about -37 rad m-2. Xu & Han (2014) quote an r.m.s scatter for the mean s of about 9 rad m-2. The data indicate an increase of the caused by the FS of the order of -10 rad m-2 to -20 rad m-2.
There is one pulsar with measured in the field of G107.0+9.0. PSR B2224+65 at = 108846, which is about offset from the map centre, has an of -22.99 rad m-2 (Noutsos et al. 2015). Its distance is 900 pc based on its dispersion measure. Thus, the pulsar is closer than G107.0+9.0 according to the 1.5 kpc to 2 kpc distance quoted by Fesen et al. (2020). Its smaller absolute is in accordance with that of extragalactic sources, which trace the magnetised interstellar medium throughout the entire Galactic disk, and indicate a magnetic field direction pointing away from us throughout the Galaxy.
3.2.2 Faraday-screen model for G107.0+9.0
We apply the FS model by Sun et al. (2007) to the 1.4-GHz polarisation data, which allows us to calculate the properties of an FS along the line of sight and to separate foreground (fg) and background (bg) emission components. The observed polarised emission towards the FS (‘on’-position) is compared with the emission outside (‘off’-position). The difference of the polarisation angles is also required by the model. Parameter is the ratio / and is the angle rotation caused by the FS. The parameter describes the depolarisation of the FS, where 1 stands for no and 0 for total depolarisation. Using Eq. (1), we obtained values for and , while has to be estimated:
| (1) |
varies between about and in the surroundings of G107.0+9.0. We subtracted from the map to apply Eq. 1, which holds for (see Sun et al. 2007). We measured with variations below 10 and with an uncertainty of about .
From Eq. (1), we calculated an angle rotation by the FS of about ( = 1). At 21 cm (1.4 GHz), this corresponds to rad m-2. We also calculated , which means that 67% of the observed polarised emission towards G107.0+9.0 originates in the foreground of the FS. Allowing some internal FS depolarisation, decreases to 0.65/0.62 for = 0.9/0.8, while the corresponding s are just marginally influenced and decrease to -24 rad m-2. Thus, moderate depolarisation within the FS has little influence on the result from the model. The s from the FS-model for G107.0+9.0 are in the range of the negative excess of extragalactic sources towards G107.0+9.0 (see section above). This supports the view that G107.0+9.0 and its immediate surroundings act as an FS. The effect of the FS on the 4.8-GHz polarisation is much smaller than at 1.4 GHz, because a of -25 rad m-2 causes an angle rotation of only about 6 on the background polarisation. This agrees with the observations.
The offset-subtracted H emission from G107.0+9.0 varies between 3 Rayleigh and 7 Rayleigh. An exception is the stronger H-filament at its western periphery with about 12 Rayleigh. For a distance of 1.5 kpc to 2 kpc, we find extinction values E(B-V) of around 0.4 mag based on the Eg-r values quoted by Green et al. (2019). Using Eq. 2, we obtained extinction-corrected emission measures () between 20 pc cm-6 and 50 pc cm-6 for an electron temperature of 10,000 K (). Electron temperatures of 4,000 K and 6,000 K reduce by a factor of 0.44 and 0.63, respectively. We do not know the electron temperature of the H -emitting gas and assume an of 25 pc cm-6 in the following calculations:
| (2) |
The size of G107.0+9.0 is between 75 pc and 100 pc according to Fesen et al. (2020). From , we calculated an average electron density of = 0.6 cm-3 or 0.5 cm-3. Combining with the derived of -25 rad m-2 of the FS, we calculated the regular magnetic field component of the FS along the line of sight by = 0.81 [cm-3] G] [pc] to be 0.7 G and 0.6 G for = 75 pc and 100 pc, respectively:
| (3) |
Thermal gas is not perfectly uniformly distributed, so a filling factor has to be considered. The filling factor is below 1 and increases the electron density according to Eq. (3). For instance, assuming = 0.5, raises to 0.8 cm-3 or 0.7 cm-3. A filling factor will also increase by , which for = 0.5, increases to 1.0 G or 0.85 G for = 75 pc or 100 pc, respectively. Even for a small filling factor of = 0.1, will be just about 2 G. The regular field is stronger in the case that it is inclined with respect to the line of sight. Anyway, is low for a compressed SNR magnetic field and of the order of the regular halo field according to the 3D model of Sun & Reich (2010). The positional coincidence of the FS with the SNR suggests a close connection, while it remains unclear from the present data how this magnetic field component may have been formed. If the magnetic field was preexisting, the SNR shock-accelerated electrons may have escaped and radiated in the magnetic field.
We made the same FS analysis for the depolarised filament at 4.8 GHz extending along the western periphery of G107.0+9.0. With all the uncertainties as we listed above, we estimated to be about 80 pc cm-6. The intrinsic size of the filament is about 14, which corresponds to a diameter of 6.5/8.7 pc for a 1.5/2 kpc distance. We calculated electron densities between 3.0 cm-3 and 3.5 cm-3. If this filament traced a part of the SNR shell seen edge-on, its extent along the line of sight will be larger and the electron density will decrease. Figure 10, however, shows the depolarised filament to apparently continue outside of the SNR towards l,b = 107,7, but this depolarised structure is unrelated to G107.0+9.0. For and an angle difference , the FS model results in a of about -300 rad m-2 for values of 0.6 and 0.7. The parameter is between 0.66 and 0.69 and agrees with the value we found for G107.0+9.0, what means that the filament is at about the same distance. We calculated a regular magnetic field along the line of sight of the order of 15 G, which is significantly higher than the typical magnetic field in the interstellar medium out of the Galactic disc and requires compression.
3.2.3 Synchrotron emissivity towards G107.0+9.0
From the FS model result, we found that about 67% of the observed polarised emission towards G107.0+9.0 originates in its foreground, so we can estimate the synchrotron emissivity. When the depolarisation does not increase with distance, we estimated the total-intensity component towards G107.0+9.0 by also assuming 67% of the observed signal as a lower limit. At 1.4 GHz, we measured typically about 4.9 K at 9 latitude at a few degrees in longitude ‘off’ from G107.0+9.0 with an uncertainty of about 0.2 K. Correcting by 2.8 K for the isotropic CMB and unresolved background components (Reich & Reich 1988), we have 2.1 K of Galactic emission. 67% corresponds to an emissivity of 0.94 K /kpc and 0.70 K /kpc for distances of G107.0+9.0 of 1.5 kpc and 2 kpc, respectively. These values are uncertain by about 10%, but in any case at the upper end of quoted Galactic emissivities as discussed by Wolleben & Reich (2004) and agree with the view of a locally (¡1 kpc) enhanced Galactic synchrotron emissivity (Sun et al. 2008; Sun & Reich 2010).
4 Summary
We extracted faint radio emission from the optically identified SNR G107.0+9.0 from published surveys at 22 MHz and 408 MHz and new observations at 1.4 GHz and 4.8 GHz. We found a non-thermal integrated spectral index of . This spectrum is steeper than that of typical shell-type SNRs in the adiabatic evolution phase, which have a spectral index of about . G107.0+9.0 does not show the typical morphology of a shell-type SNR and may be in the radiative phase. Its surface brightness of W m-2Hz-1sr-1 at 1 GHz is among the lowest currently known for SNRs.
G107.0+9.0 is clearly seen in depolarisation at 1.4 GHz and also at 4.8 GHz. The polarised emission extends beyond the boundaries of G107.0+9.0, so that the polarised emission is interpreted as the result of an FS hosting a faint ordered magnetic field along the line of sight. The FS scenario fits all observational data, although with significant uncertainties. The analysis of a depolarised filament at 4.8 GHz along the western periphery of G107.0+9.0 reveals a compressed regular magnetic field of about 15 G.
Acknowledgements.
This research is partly based on observations with the Effelsberg 100-m telescope of the MPIfR. X.Y. Gao is supported by the National Natural Science Foundation of China (Grant Nos. 11988101, U1831103).References
- Dubner & Giacani (2015) Dubner, G. & Giacani, E. 2015, A&A Rev., 23, 3
- Fesen et al. (2020) Fesen, R. A., Weil, K. E., Raymond, J. C., et al. 2020, MNRAS, 498, 5194
- Finkbeiner (2003) Finkbeiner, D. P. 2003, ApJS, 146, 407
- Foster et al. (2013) Foster, T. J., Cooper, B., Reich, W., Kothes, R., & West, J. 2013, A&A, 549, A107
- Gao et al. (2010) Gao, X. Y., Reich, W., Han, J. L., et al. 2010, A&A, 515, A64
- Green et al. (2019) Green, G. M., Schlafly, E., Zucker, C., Speagle, J. S., & Finkbeiner, D. 2019, ApJ, 887, 93
- Han et al. (2015) Han, J. L., Reich, W., Sun, X. H., et al. 2015, Highlights of Astronomy, 16, 394
- Haslam et al. (1982) Haslam, C. G. T., Salter, C. J., Stoffel, H., & Wilson, W. E. 1982, A&AS, 47, 1
- Hinshaw et al. (2009) Hinshaw, G., Weiland, J. L., Hill, R. S., et al. 2009, ApJS, 180, 225
- Kothes et al. (2017) Kothes, R., Reich, P., Foster, T. J., & Reich, W. 2017, A&A, 597, A116
- Landecker et al. (2010) Landecker, T. L., Reich, W., Reid, R. I., et al. 2010, A&A, 520, A80
- Noutsos et al. (2015) Noutsos, A., Sobey, C., Kondratiev, V. I., et al. 2015, A&A, 576, A62
- Reich & Reich (1988) Reich, P. & Reich, W. 1988, A&AS, 74, 7
- Reich (1982) Reich, W. 1982, A&AS, 48, 219
- Reich (2006) Reich, W. 2006, in Cosmic Polarization, ed. R. Fabbri (Research signpost), 91
- Reich et al. (2004) Reich, W., Fürst, E., Reich, P., et al. 2004, in The Magnetized Interstellar Medium, ed. B. Uyanıker, W. Reich, & R. Wielebinski (Copernicus GmbH, Katlenburg-Lindau), 45
- Roger et al. (1999) Roger, R. S., Costain, C. H., Landecker, T. L., & Swerdlyk, C. M. 1999, A&AS, 137, 7
- Roger et al. (1986) Roger, R. S., Costain, C. H., & Stewart, D. I. 1986, A&AS, 65, 485
- Sofue & Reich (1979) Sofue, Y. & Reich, W. 1979, A&AS, 38, 251
- Sun et al. (2007) Sun, X. H., Han, J. L., Reich, W., et al. 2007, A&A, 463, 993
- Sun & Reich (2010) Sun, X. H. & Reich, W. 2010, Research in Astronomy and Astrophysics, 10, 1287
- Sun et al. (2011) Sun, X. H., Reich, W., Han, J. L., et al. 2011, A&A, 527, A74
- Sun et al. (2008) Sun, X. H., Reich, W., Waelkens, A., & Enßlin, T. A. 2008, A&A, 477, 573
- Tung et al. (2017) Tung, A. K., Kothes, R., Landecker, T. L., et al. 2017, AJ, 154, 156
- Uyanıker et al. (1998) Uyanıker, B., Fürst, E., Reich, W., Reich, P., & Wielebinski, R. 1998, A&AS, 132, 401
- Uyanıker et al. (1999) Uyanıker, B., Fürst, E., Reich, W., Reich, P., & Wielebinski, R. 1999, A&AS, 138, 31
- Vollmer et al. (2010) Vollmer, B., Gassmann, B., Derrière, S., et al. 2010, A&A, 511, A53
- Wolleben et al. (2006) Wolleben, M., Landecker, T. L., Reich, W., & Wielebinski, R. 2006, A&A, 448, 411
- Wolleben & Reich (2004) Wolleben, M. & Reich, W. 2004, A&A, 427, 537
- Xiao et al. (2011) Xiao, L., Han, J. L., Reich, W., et al. 2011, A&A, 529, A15
- Xu & Han (2014) Xu, J. & Han, J.-L. 2014, Research in Astronomy and Astrophysics, 14, 942
- Yuan & Liu (2013) Yuan, H. B. & Liu, X. W. 2013, MNRAS, 436, 718