A Near-infrared Survey of UV-excited Molecular Hydrogen in Photodissociation Regions
Abstract
We present a comparative study of the near-infrared (NIR) H2 line emission from five regions near hot young stars: Sharpless 140, NGC 2023, IC 63, the Horsehead Nebula, and the Orion Bar. This emission originates in photodissociation or photon-dominated regions (PDRs), interfaces between photoionized and molecular gas near hot (O) stars or reflection nebulae illuminated by somewhat cooler (B) stars. In these environments, the dominant excitation mechanism for NIR emission lines originating from excited rotational-vibrational (rovibrational) levels of the ground electronic state is radiative or UV excitation (fluorescence), wherein absorption of far-UV photons pumps H2 molecules into excited electronic states from which they decay into the upper levels of the NIR lines. Our sources span a range of UV radiation fields (–) and gas densities (– cm-3), enabling examination of how these properties affect the emergent spectrum. We obtained high-resolution () spectra spanning – m on the 2.7m Harlan J. Smith Telescope at McDonald Observatory with the Immersion Grating INfrared Spectrometer (IGRINS), detecting up to over 170 transitions per source from excited vibrational states (–). The populations of individual rovibrational levels derived from these data clearly confirm UV excitation. Among the five PDRs in our survey, the Orion Bar shows the greatest deviation of the populations and spectrum from pure UV excitation, while Sharpless 140 shows the least deviation. However, we find that all five PDRs exhibit at least some modification of the level populations relative to their values under pure UV excitation, a result we attribute to collisional effects.
1 Introduction
Photodissociation or photon-dominated regions (PDRs) arise where non-ionizing far-UV (FUV) photons are the main driver of the physics and chemistry in interstellar gas. PDRs exist in a wide variety of environments in the interstellar medium (ISM) including the edges of large-scale regions of high-mass star formation and radiation-bounded compact H II regions, reflection nebulae around B stars, and in planetary nebulae where UV light emitted from hot post-AGB stars interacts with previously ejected neutral gas. In fact, most of the diffuse neutral ISM is essentially low-density PDR material (Hollenbach et al., 1991; Hollenbach & Tielens, 1999).
In regions where massive stars are forming, O and B stars generate plentiful FUV photons that excite and dissociate the surrounding molecular gas. When the UV radiation field is steady with time, PDRs reach a state of equilibrium with a layered structure due to the fact that different species have differing abundances and absorb UV radiation of different energy ranges (Tielens & Hollenbach, 1985). While extreme-UV (EUV) photons are absorbed by H I gas that marks the edge of the H II region (if present), FUV photons easily pass into regions dominated by H I that also contain molecules including H2 (Sternberg, 1988; Sternberg et al., 2014). In this region, absorption of FUV photons in the Lyman and Werner bands electronically excites H2 molecules, which then either dissociate or decay into excited rotational-vibrational (rovibrational) levels of the ground electronic state (Field et al., 1966; Black & Dalgarno, 1976). The dissociated H2 re-forms on dust grains via exothermic catalytic reactions, which eject the H2 back into the gas phase (Gould & Salpeter, 1963; Hollenbach & Salpeter, 1971).
H2 lacks a permanent electric dipole moment. Molecules in excited rovibrational levels of the ground electronic state can decay to the ground vibrational state only through collisions, or electric quadrupole () transitions that give rise to a rich spectrum of emission lines with wavelengths ranging from the red end of the optical spectral region to the mid-IR. Since these lines are optically thin, their fluxes are proportional to the number of molecules in the upper level of each transition. Observing many lines enables us to determine the detailed rovibrational level populations, which reflect the physical conditions within PDRs where the emission arises.
The FUV photons that excite the Lyman and Werner bands of H2 fall within a narrow range of energies from – eV ( Å). Consequently, differences in the O or B star temperature have little effect on the relative H2 level populations (Draine & Bertoldi, 1996). The PDR gas is primarily heated by collisions with grain photoelectrons and through collisional de-excitation of UV-excited H2. Other mechanisms such as cosmic rays (Pellegrini et al., 2009) and H2 formation (Le Petit et al., 2006; Le Bourlot et al., 2012) might also contribute to heating the gas. The gas cooling is dominated by radiation from atomic and ionic species. At low densities and temperatures, the emergent spectrum from UV-excited H2 is fairly invariant to detailed properties of the gas and the UV source (Black & van Dishoeck, 1987; Sternberg, 1988; Draine & Bertoldi, 1996). However at higher temperatures and/or densities, collisions between H2 and other particles modify the H2 rovibrational level populations and the emergent spectrum (Sternberg & Dalgarno, 1989). We can use the effects of collisions on the rovibrational level populations of UV-excited H2 to probe the gas temperature, gas density, and FUV field in a PDR.
A sensitive high-resolution near-IR spectrometer that covers a large wavelength range is the ideal tool for observing H2 rovibrational transitions from many different levels and probing the conditions within PDRs (Le et al., 2016; Kaplan et al., 2017, hereafter referred to as K17). However, such studies have so far been made for only a few PDRs, notably the reflection nebula NGC 7023 and the Orion Bar. The true power of this approach can be realized only by applying it to a wider variety of PDRs that cover a range of UV field intensities, gas densities, and gas temperatures. In this paper, we present new observations of four PDRs and compare their H2 spectra to each other and to the Orion Bar PDR (K17). This study provides benchmark observations of a set of reference PDRs with a range in these properties, which illustrate and constrain the effects and dependencies of the H2 emission spectrum and offer detailed tests of PDR models.
2 PDRs in the Survey
| PDR | S 140 | NGC 2023 | IC 63 | Horsehead Nebula | Orion Bar |
|---|---|---|---|---|---|
| Type | H II Region Edge | Reflection Nebula | Reflection Nebula | Dark Nebula Edge | H II Region Edge |
| Distance (pc) | aafootnotemark: | bbfootnotemark: | ccfootnotemark: | ddfootnotemark: | eefootnotemark: |
| Illuminating Star | HD 211880 | HD 37903 | Cas | Ori | Ori C |
| Spectral Type | B0.5Vfffootnotemark: | B1.5Vggfootnotemark: | B0.5IVpehhfootnotemark: | O9.5Viifootnotemark: | O7Vjjfootnotemark: |
| (K) | 29,000fffootnotemark: | 23,700ggfootnotemark: | 25,000kkfootnotemark: | 33,000llfootnotemark: | 39,000jjfootnotemark: |
| fffootnotemark: | mmfootnotemark: | nnfootnotemark: | oofootnotemark: | ppfootnotemark: | |
| (cm -3) | fffootnotemark: | mmfootnotemark: | nnfootnotemark: | oofootnotemark: | qqfootnotemark: |
| (cm3) | |||||
| R.A. (J2000) | 22h19m1340 | 05h41m3771 | 00h59m0274 | 05h40m5360 | 05h35m1973 |
| Decl. (J2000) | 63∘17′53″9 | 02∘16′50″0 | 60∘53′06″7 | 02∘28′00″0 | 05∘25′26″7 |
| Date Obs. (UT) | 2015 Nov 02 | 2015 Nov 03 | 2015 Nov 03 | 2015 Nov 01 | 2014 Oct 24 |
| Exp. Time (min.) | 100 | 70 | 80 | 55 | 30 |
| P.A. (∘) | 45 | 15 | 45 | 76 | 135 |
| Std. Star | HR 8422 | HR 1724 | HR 598 | HR 1482 | HD 34317 |
| 11 The best-fit K-band dust extinction in magnitudes (), used to extinction correct H2 line fluxes for each PDR, as described in Section 3.1. | 0.52 | 0.45 | 0.30 | 0.70 | 0.72 |
| O/P22 The best-fit ortho-to-para ratio (O/P) observed for the rovibrationally excited H2, as described in Sections 3.3 & 4.5. | |||||
| 1–0 S(1)/2–1 S(1)33 Flux ratio of the H2 1–0 S(1) to 2–1 S(1) lines in each PDR, as described in 4.2. The individual line fluxes are reported in Table 2. |
References. — aHirota et al. (2008), bGaia Collaboration et al. (2018), cPerryman et al. (1997), dCaballero (2008), eSchlafly et al. (2014), fTimmermann et al. (1996), gCompiègne et al. (2008), hShenavrin et al. (2011), iWarren & Hesser (1977), jFerland et al. (2012), kSigut & Jones (2007), lPanagia (1973), mSheffer et al. (2011), nAndrews et al. (2018), oHabart et al. (2005), pMarconi et al. (1998), qGoicoechea et al. (2016)
We selected Sharpless 140, NGC 2023, IC 63, and the Horsehead Nebula PDRs for this survey based on their observability in the northern sky, previous detections of UV-excited H2, and to ensure a set of targets with a range of properties (UV field, density, temperature, etc.). We also include our data and results for the Orion Bar from K17. Table 2 summarizes the observations and physical properties of the PDRs in this survey. We report the physical parameters from the literature which is a dimensionless measure of the UV intensity normalized to the interstellar radiation field of Habing (1968) and which is the gas density. We also report the ratio of the UV intensity to the gas density which parameterizes the effects of UV photons upon the gas.
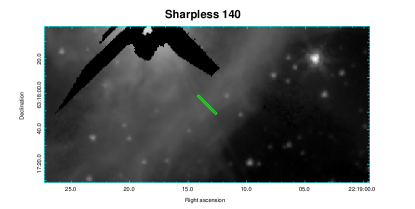
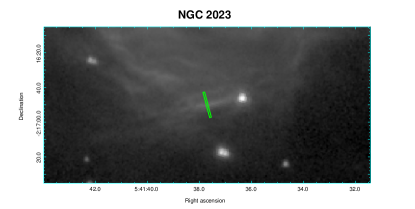
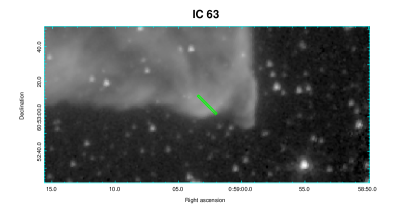
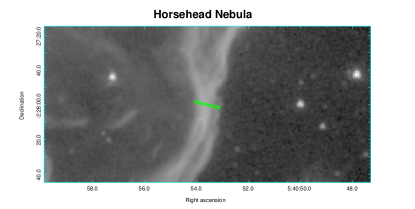
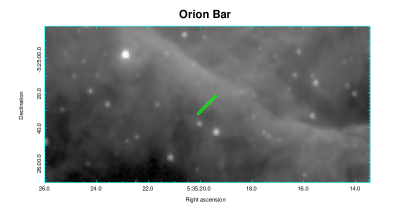
All targets were observed with the Immersion GRating INfrared Spectrometer (IGRINS) on the 2.7 m Harlan J. Smith telescope at McDonald Observatory. IGRINS is a high-resolution () cross-dispersed echelle spectrometer with separate near-IR channels for the and bands that provides simultaneous observations of a full wavelength coverage from – m (Park et al., 2014). The IGRINS slit subtends on the sky and can be rotated to any position angle (P.A.; measured counterclockwise from NE). All PDRs were observed by alternating the slit between the target position and a blank region of the sky approximately one degree offset from the target, with equal amounts of time spent on target and sky. An A0V standard star was observed at a similar airmass to each target for telluric absorption line correction and relative spectrophotometric flux calibration. Table 2 lists the coordinates of the IGRINS slit positions, date of the observations, P.A.s, integration times, and A0V standard stars used for all our observations. Figure 1 shows finder charts and the IGRINS slit positions for all targets. Below we describe the observing details for each PDR included in the survey.
2.1 S 140
Sharpless 140 (S 140) is an H II region surrounding a cluster of several B stars that includes some reflection nebulosity in the background. The brightest UV source is the B0.5V star HD 211880 (Timmermann et al., 1996). The geometry of the S 140 PDR is similar to that of the Orion Bar (i.e. it is viewed nearly edge-on), but with a less intense FUV radiation field. H2 emission was observed from S 140 with the Infrared Space Observatory by Timmermann et al. (1996) and Habart et al. (2004). We placed the IGRINS slit on the edge of the bright near-IR filament in S 140 with the slit rotated to a PA of 45∘ (measured counter-clockwise from NE), perpendicular to the H I/H2 dissociation interface.
2.2 NGC 2023
NGC 2023 is a reflection nebula surrounding the B1.5V star HD 37903 where UV radiation has carved out a bubble within the L1630 molecular cloud (Compiègne et al., 2008). It is one of the brightest and best-studied PDRs. There have been many studies of its UV-excited H2 emission: Sellgren (1986), Hasegawa et al. (1987), Takayanagi et al. (1987), Gatley et al. (1987), Black & van Dishoeck (1987), Sternberg (1988), Sternberg (1989), Tanaka et al. (1989), Hippelein & Münch (1989), Howe et al. (1990), Burton et al. (1990a), Burton (1992), Field et al. (1994), Field et al. (1998), Burton et al. (1998), Martini et al. (1999), Takami et al. (2000), Habart et al. (2004), Fleming et al. (2010), Habart et al. (2011), and Sheffer et al. (2011). We placed the IGRINS slit on the bright southern ridge with a PA of 135∘ perpendicular to the edge of the ridge.
2.3 IC 63
IC 63 is a nearby ( pc) reflection nebula near the B0.5IVpe star Cas (Perryman et al., 1997; Shenavrin et al., 2011). The H2 emission in this source has been the subject of numerous studies including Witt et al. (1989), Sternberg & Dalgarno (1989), Luhman et al. (1997b), Hurwitz (1998), Habart et al. (2004), France et al. (2005), Thi et al. (2009), and Fleming et al. (2010). In -band images, the PDR forms a “V”-shaped cloud with the tip of the V pointing southwest toward Cas. We positioned the IGRINS slit on the brightest part of the tip of the nebula nearest to Cas with the slit at a P.A. of 45∘, perpendicular to the H I/H2 dissociation interface.
2.4 Horsehead Nebula
The Horsehead Nebula is a dark portion of the L1630 molecular cloud. The PDR arises where UV light from the O9.5V star Ori (Warren & Hesser, 1977) falls upon the western-facing edge of the “head.” The UV field intensity for the Horsehead PDR is the lowest of our sample (; Abergel et al. 2003), since the illuminating star is relatively distant ( pc; Abergel et al. 2003). Like the Orion Bar and S 140, the Horsehead PDR is viewed nearly edge-on. The H2 1–0 S(1) line emission was mapped by Habart et al. (2005) and the pure rotational lines were mapped by Habart et al. (2011). We placed the IGRINS slit at the location of the brightest H2 1–0 S(1) line emission, with P.A. = 76∘, which is perpendicular to the H I/H2 dissociation interface.
2.5 Orion Bar
The Orion Bar is the southeastern illuminated edge of the Orion Nebula H II region surrounding the Trapezium star cluster in which the strongest UV source is the O7V star Ori C. e The observations of the Orion Bar included here are from K17, which covers our H2 observations and the literature in great detail. The Orion Bar has a density of cm-3 (Goicoechea et al., 2016) and a UV intensity of (Marconi et al., 1998), which is the highest density and UV intensity out of all the PDRs in this survey. We positioned the IGRINS slit on the point of brightest H2 emission with a P.A. of 135∘, perpendicular to the H I/H2 dissociation interface.
3 Analysis
3.1 Data Reduction, Extinction Correction, and Line Flux Measurements
Our data reduction, calibration, and line flux extraction procedures are described in K17. We use the public IGRINS Pipeline Package (Lee, 2015)111IGRINS Pipeline Package (PLP): https://github.com/igrins/plp for data reduction, after removing cosmic rays from the raw frames using the Python implementation of LA–Cosmic (van Dokkum, 2001)222Python implementation of LA–Cosmic by Malte Tewes: https://obswww.unige.ch/~tewes/cosmics_dot_py/. We use the code “plotspec,”333“Plotspec:”, https://github.com/kfkaplan/plotspec, which is designed for processing 2D IGRINS spectra of extended emission, for our data analysis. The 2D orders from the echellograms are combined into one long 2D spectrum. A0V standard stars are used for simultaneous telluric absorption line correction and relative spectrophotometric flux calibration. Lines are identified using the list from Roueff et al. (2019). The 2D line profiles are linearly interpolated into position-velocity space, and line fluxes are extracted using a weighted optimal extraction routine with the profile of the 1–0 S(1) line used to establish the weights. We add a 15% systematic uncertainty to all of the extracted line fluxes to account for uncertainty in the relative flux calibration, telluric correction, and extinction correction.
The extracted line fluxes for each PDR are extinction corrected using the best-fit , the dust extinction in the -band. The NIR extinction law can be approximated as a power law of the form . Historical values of range between – (see Draine, 2003, and references therein). More recent studies by Nishiyama et al. (2006, 2009) and Wang & Chen (2019) suggest a higher value of . To correct for dust extinction, we have selected . Setting or gives values that are larger or smaller, respectively. While the value of is somewhat uncertain, values for these sources are sufficiently small that the differential extinction corrections are not a significant source of uncertainty. Changing the value for has a effect on our measured line flux ratios. For each PDR, we find the value of that best matches the intrinsic flux ratios for every pair of H2 emission lines that arise from the same upper and state to their observed flux ratios and report the best-fit in Table 2. For example, 3–1 O(5) at 1.522033 m and 3–2 S(1) at 2.386547 m both arise from the , state. There are between 13–66 such pairs found in the spectra for our PDR sample that we can use as part of our determination of .
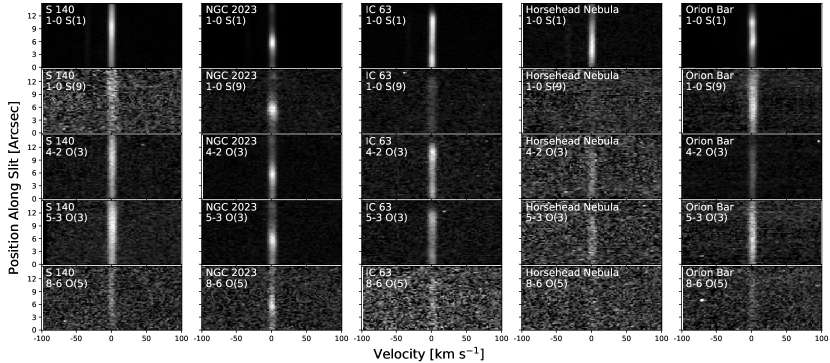
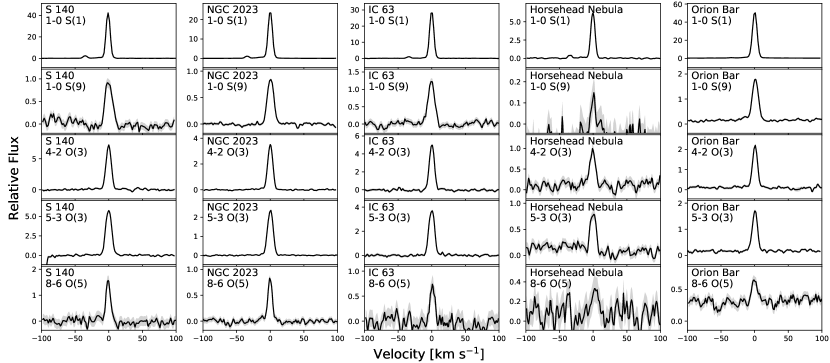
We detect a large number of lines in each PDR. Figures 2 and 3 show 2D and 1D thumbnails from a representative set of H2 lines. The lines are all quite narrow, corresponding to velocity widths of only a few km kilometers per second. This is consistent with the H2 being relatively cool and UV-excited, as opposed to arising from shocks. In shocks, we would expect to see larger velocity widths from gas motion (unless there is unfavorable alignment) and thermal broadening. The observed velocity widths place an upper limit on the gas temperature of K, lower than the expected value for shocked gas, which is typically a few thousand kelvin. Table 2 lists the extracted line fluxes for each PDR normalized to the line flux of 4–2 O(3), which is a fairly bright line seen in all of the PDRs and is uncontaminated by telluric absorption or OH emission lines. The fluxes are reported as ratios to this reference line due to variations in airmass, seeing, and observing conditions that resulted in uncertainties that prevented us from determining absolute fluxes.
| Line ID | (m) | S 140 | NGC 2023 | IC 63 | Horsehead Nebula | Orion Bar | ||
|---|---|---|---|---|---|---|---|---|
| 1–0 Q(1) | 2.406592 | 1 | 1 | |||||
| 1–0 Q(2) | 2.413439 | 1 | 2 | |||||
| 1–0 S(0) | 2.223290 | 1 | 2 | |||||
| 1–0 S(1) | 2.121834 | 1 | 3 | |||||
| 1–0 Q(3) | 2.423730 | 1 | 3 | |||||
| 1–0 Q(4) | 2.437489 | 1 | 4 | |||||
| 1–0 S(2) | 2.033758 | 1 | 4 | – | ||||
| 1–0 S(3) | 1.957559 | 1 | 5 | |||||
| 1–0 Q(6) | 2.475559 | 1 | 6 | – | ||||
| 1–0 S(6) | 1.788050 | 1 | 8 | – | – | – | – | |
| 1–0 S(7) | 1.747955 | 1 | 9 | |||||
| 1–0 S(8) | 1.714738 | 1 | 10 | – | ||||
| 1–0 S(9) | 1.687761 | 1 | 11 | |||||
| 1–0 S(10) | 1.666475 | 1 | 12 | – | ||||
| 1–0 S(11) | 1.650413 | 1 | 13 | – | – |
Note. — Undetected lines are marked with a dash.
(This table is available in its entirety in machine-readable form in the arXiv source.)
| H2 Line ID | |||||
|---|---|---|---|---|---|
| 1–0 Q(1) | 2.406592 | 1 | 1 | 6149 | -6.37 |
| 1–0 Q(2) | 2.413439 | 1 | 2 | 6471 | -6.52 |
| 1–0 S(0) | 2.223290 | 1 | 2 | 6471 | -6.60 |
| 1–0 S(1) | 2.121834 | 1 | 3 | 6951 | -6.46 |
| 1–0 Q(3) | 2.423730 | 1 | 3 | 6951 | -6.55 |
| 1–0 Q(4) | 2.437489 | 1 | 4 | 7584 | -6.57 |
| 1–0 S(2) | 2.033758 | 1 | 4 | 7584 | -6.40 |
| 1–0 S(3) | 1.957559 | 1 | 5 | 8365 | -6.38 |
| 1–0 Q(6) | 2.475559 | 1 | 6 | 9286 | -6.59 |
| 1–0 S(6) | 1.788050 | 1 | 8 | 11521 | -6.45 |
| 1–0 S(7) | 1.747955 | 1 | 9 | 12817 | -6.53 |
| 1–0 S(8) | 1.714738 | 1 | 10 | 14220 | -6.63 |
| 1–0 S(9) | 1.687761 | 1 | 11 | 15721 | -6.77 |
| 1–0 S(10) | 1.666475 | 1 | 12 | 17311 | -6.98 |
| 1–0 S(11) | 1.650413 | 1 | 13 | 18979 | -7.27 |
Note. — Values for , , and are from Roueff et al. (2019).
(This table is available in its entirety in machine-readable form in the arXiv source.)
3.2 H2 Level Populations, Excitation Diagrams, and the Effects of Collisions
We calculate the H2 rovibrational level populations from the column densities of the upper state of each observed rovibrational transition from
| (1) |
where is the flux of the transition from upper () to lower () rovibrational states, is the difference in energy between the states in units of cm-1, is the transition probability in s-1, is Planck’s constant, and is the speed of light. Table 3 lists the physical constants that we used to calculate the level populations. We use the latest theoretical molecular data on H2 from Roueff et al. (2019) for the values of , , and , which improves upon the values we previously used in K17. We normalize all of the column densities to the population of the , level derived from the 4–2 O(3) transition, the same transition we used to normalize the line fluxes. Table LABEL:tab:sf-pdr-coldens gives the derived column densities of H2 in the upper levels of each transition, , relative to that of the reference level in each PDR. It also lists the ratios of the normalized column densities to those predicted for a “pure” UV-excited Cloudy model, in which it is assumed there is negligible collisional modification of the level populations, denoted by (see § 4.3 for a detailed discussion of this model).
Competition among UV radiative excitation, spontaneous decays, and collisional excitation and de-excitation gives rise to two limiting cases for the H2 rovibrational level populations: the thermal limit and the case of “pure” UV radiative excitation (fluorescence). Figure 4 illustrates a convenient diagnostic tool for determining excitation mechanisms, the excitation diagram, which plots the logarithmic level populations normalized by the statistical weight, , against the excitation energy of the upper level of each transition. In dense gas, such as in shocks, the rovibrational levels are excited and de-excited by frequent collisions, and the level populations approach a thermal distribution. In that limit, the plotted level populations follow a monotonic decline with a (constant) linear slope of where is the kinetic temperature of the gas. On the other hand, in low-density gas exposed to UV radiation, the level populations take on a distinctive nonthermal distribution with much larger populations in the levels. Instead of a single trend that declines monotonically with increasing excitation energy, the populations on the excitation diagram are split into different rotation ladders (levels of constant ) with declining trends that are roughly parallel with each other. Observations of the rovibrational line flux ratios readily distinguish between these two limiting cases. However, in practice, many sources show excitation diagrams intermediate between the UV-excited and thermal limits. This could result either from collisional modification of the level populations following UV excitations (e.g., Sternberg & Dalgarno 1989; Burton et al. 1990b), or from the superposition of spatially distinct UV-excited and thermal components (e.g., Davis et al. 2003). Distinguishing between these possibilities may be difficult with limited data, but this may be remedied with the use of detailed high-spectral resolution observations.
Since the collision energies depend on the gas temperature and collision rates depend on both the gas density and temperature, subtle modifications of UV-excited H2 rovibrational level populations by collisions can be exploited to probe the physical conditions within a PDR. Panel (a) in Figure 4 depicts the nonthermal distribution of UV-excited H2 on the excitation diagram. Each excited rovibrational level has a (somewhat temperature dependent) critical density above which the rate of collisional de-excitation is greater than the rate of radiative de-excitation. At gas densities higher than the critical density (typically – cm-3, Sternberg & Dalgarno, 1989), collisions will dominate the excitation and de-excitation of a level, driving the level population toward the thermal limit.
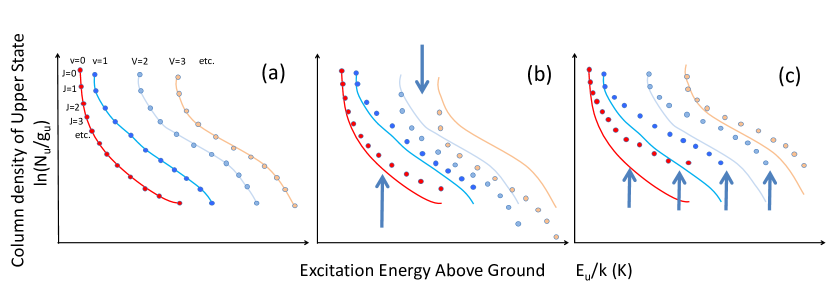
As collision rates increase due to the gas getting warmer or denser, all rovibrational levels become increasingly thermalized. Levels with lower energies ( and ) will experience increasing rates of both collisional excitation and de-excitation, while higher- levels are more strongly affected by collisional de-excitations than collisional excitations due to their higher threshold energies, decreasing the population of higher-energy levels relative to lower-energy levels. UV excitation always pumps more molecules into higher- levels than the process of thermalization, because H2 can never realistically reach kinetic temperatures high enough to significantly populate the high- levels without dissociating. As collision rates, thus thermalization, increase, the number of molecules at high will decrease. The end result is that the “vibrational temperature,” , the excitation temperature determined from the populations across different vibrational levels in the same rotation state, decreases. Panel (b) in Figure 4 illustrates this effect. A potential secondary effect, due to the moderately higher critical densities for the states than those of the states, is that a bottleneck can develop, such that the populations build up in the states.
Another effect of increasing thermalization is that the relative column densities of molecules at high increase across all levels. This is illustrated on the excitation diagram as the “rotational temperature” , the excitation temperature derived from the populations of different rotational levels in the same vibration state, increasing (i.e. each rotation ladder becomes more vertically compressed). Panel (c) in Figure 4 depicts the effect. One possible explanation involves the competition between downward radiative and collisional transitions. Downward radiative transitions have probabilities that strongly favor larger differences in energy (), selectively enhancing transitions to the lowest- levels, while downward collisional transitions do not strongly favor larger over smaller energy differences. In a purely radiative cascade, the transitions are favored over or , so tends to decrease during the cascade. As gas density or temperature increases, a larger fraction of the rovibrational transitions will be collisionally induced, diluting the tendency for to decrease, leading to larger populations in levels at high . Another possible explanation is that this effect has little to do with collisions and instead is simply a byproduct of how the level populations respond to increasing UV excitation rates compared to radiative and collisional de-excitation rates (e.g. as argued in Draine & Bertoldi, 1996). A third possible explanation, previously discussed in K17, relies on the fact that the majority of the H2 in a PDR resides in the pure rotational states (). If the levels at high- are thermalized, their relative populations will rise with the kinetic temperature of the gas. During UV excitation and the subsequent radiative cascade, quantum selection rules allow transitions between all values of but restrict the value of to 0 or . Consequently, a molecule radiatively transitioning from to an excited electronic state and cascading back to the electronic ground state can take on any level but retains some “memory” of its original rotational () quantum number. For example, if an H2 molecule is in a high level of an excited vibrational state, it cannot quickly lose this rotational energy in a singe radiative transition, but must do so in a stepwise fashion, through multiple transitions among relatively high- levels, before reaching the state. If the populations in the high- levels of are large, the imprint of the process that populates the levels (through absorption of UV photons) is retained, enhancing the populations of high- levels in all states. We have found that raising the density in PDR models with a fixed temperature results in higher rotation temperatures. This favors the first explanation where increasing collision rates raises the fraction of collisionally induced vs. radiative transitions, which are more indifferent to changes in . The latter two explanations perhaps act to amplify the effect.
3.3 The Ortho-to-para Ratio
The H2 molecular wave function allows for only odd or even levels of depending on whether the proton spins are aligned or opposite to each other. Since or for radiative transitions, these two distinct spin isomers have essentially independent sets of rovibrational levels and are known as ortho-H2 (spins aligned, odd levels) and para-H2 (spins anti-aligned, even levels). In thermal equilibrium, the statistical weights for nuclear spin give an ortho-to-para abundance ratio (O/P) equal to 3. Since radiative transitions disallow ortho-to-para conversion, the intrinsic O/P is set or modified only during H2 formation, collisions between H2 and other species such as H or H+, or selective dissociation of either ortho- or para-H2. Sternberg & Neufeld (1999) point out that while the intrinsic O/P in a PDR for H2 in the ground () state is expected to be 3, if there is enough H2 that the Lyman and Werner bands become optically thick, optical depth effects cause FUV photons to be differentially absorbed by ortho- and para-H2 leading to an observed O/P of for H2 excited by UV radiation into . Collisions can drive the observed O/P for these levels toward the thermal limit of 3. Consequently, the observed O/P might act as a probe for the collisional modification of the UV-excited H2 spectrum in a PDR, independent of the other collisional effects on the rovibrational level populations, where the degree of collisional modification drives the value from 1.7 to 3.
We leverage the large number of H2 rovibrational lines detected in each PDR to measure their observed O/P. Our motivation is twofold. First, we will correct the O/P so that the ortho- and para-H2 rovibrational levels form a single continuous sequence for each rotation ladder on the excitation diagram. Second, we aim to use the observed O/P as a probe of the collisional modification of the H2 spectrum. On an excitation diagram, we plot the level populations as where the statistical weight for the upper state of a transition for ortho-H2 is and for para-H2 is . If the observed O/P is not the thermal value of 3, there will be some vertical distance on the excitation diagram separating the ortho and para levels in a given rotation ladder. We measure the observed O/P by cross-correlating the ortho and para level populations over a range of possible O/P to find the value that results in the least vertical separation between the ortho and para levels. For each step in this cross-correlation, we apply an O/P correction to the ortho level populations and then linearly interpolate them for each rotation ladder in space. We then calculate the vertical separation between the para levels and interpolated ortho levels in each rotation ladder. The squares of the separation distances are summed to calculate the Pearson statistic at each cross-correlation step, with the minimum giving the best-fit observed O/P. We estimate the uncertainty from the standard deviation of 1000 bootstrapped samples of the cross-correlation. The best-fit observed O/P and estimated uncertainties for each PDR are reported in Table 2, and used to correct all the ortho level populations in each PDR (Table LABEL:tab:sf-pdr-coldens) to the intrinsic O/P of 3.
4 Results
4.1 Comparison Among the Observed PDRs
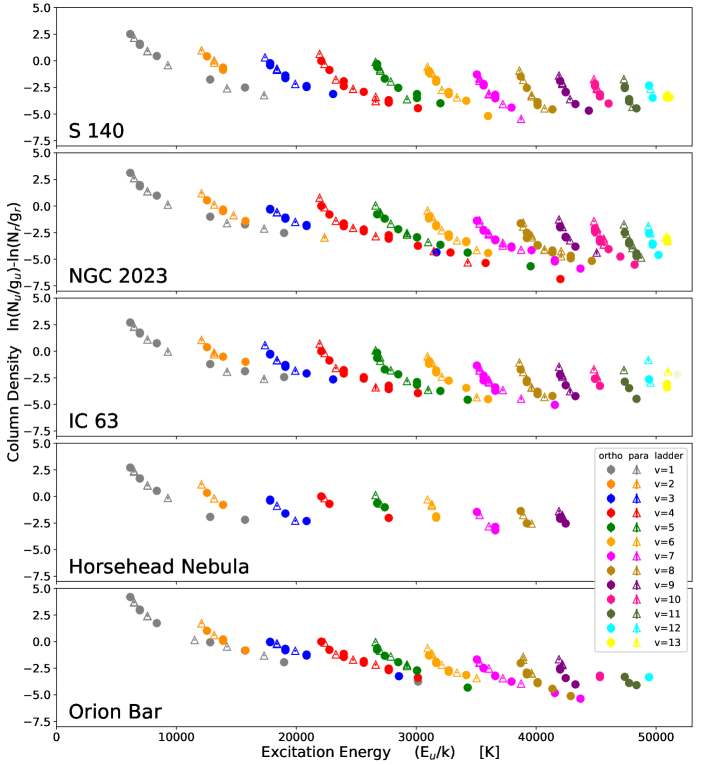
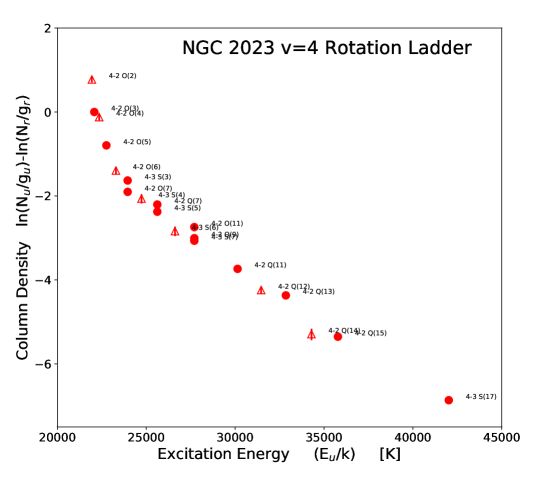
Figure 5 shows the excitation diagrams for all the PDRs in our survey. The extremely high signal-to-noise ratio (S/N) spectrum we obtained for NGC 2023 is especially impressive, with over 170 transitions detected with S/N . The rotational ladder, displayed in Figure 6, shows many transitions up to 4–3 S(17), which arises from , at an excitation energy of K. Qualitatively, the level populations seen in Table LABEL:tab:sf-pdr-coldens and Figure 5 appear similar across all the PDRs in our survey, showing the same nonthermal distribution indicative of UV excitation. This similarity is expected since the spectrum of UV-excited H2 depends mainly on known physical constants and is fairly invariant to the conditions within the gas (Black & van Dishoeck, 1987; Sternberg & Dalgarno, 1989; Shaw et al., 2005).
There are, however, subtle differences among the excitation diagrams of these PDRs, which encode information about conditions in the respective sources. The nonthermal morphology is more prominent in S 140, NGC 2023, IC 63, and the Horsehead Nebula than in the Orion Bar. In the particularly well-observed Orion Bar PDR, the jumps in column density at fixed from one level to the next are smaller, bringing the overall trend closer to a monotonic decline. For example, the for (determined from the 2–1 S(1) transition) compared to (determined from the 1–0 S(7) transition), which share similar excitation energies near K, show a difference in space of for the Orion Bar vs. a larger difference of for S 140.
Studies of the H2 line emitting region in the Orion Bar by Parmar et al. (1991), Allers et al. (2005), Shaw et al. (2009), and K17 find temperatures of – K from the H2 transitions. A high temperature and/or density increases the rate of collisions, which increases the collisional modification of UV-excited H2 rovibrational level populations as discussed in § 3.2. Steady-state PDR models underestimate the temperature at the H I/H2 dissociation interface. Prior investigations suggest that this underestimation results from either a clumpy medium (Burton et al., 1990b; Parmar et al., 1991; Meixner & Tielens, 1993; Andree-Labsch et al., 2017), an additional heating mechanism (Allers et al., 2005; Pellegrini et al., 2007, 2009; Shaw et al., 2009), higher than previously estimated H2 formation rates (Le Bourlot et al., 2012; Joblin et al., 2018), or time-dependent effects, which the steady-state models fail to account for (Hollenbach & Natta, 1995; Störzer & Hollenbach, 1998; Goicoechea et al., 2016, 2017; Wu et al., 2018). The Orion Bar is the source with the highest and in our sample of PDRs (see Table 2), so perhaps this temperature discrepancy at the H I/H2 dissociation interface between the models and observations is strongest in PDRs with the highest density and/or strongest UV fields.
4.2 The 1–0 S(1)/2–1 S(1) Line Ratio
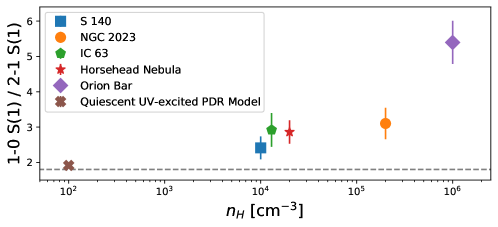
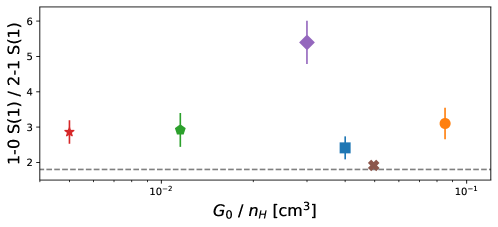
The 1–0 S(1) and 2–1 S(1) lines are bright, easy to observe, and not near any major telluric absorption features. The 1–0 S(1)/2–1 S(1) line flux ratio has been used historically as a convenient index to differentiate between shocked and UV-excited H2 (e.g., Hayashi et al. 1985; Black & van Dishoeck 1987; Burton 1992). For unmodified UV-excited H2, this line ratio is (Black & van Dishoeck, 1987). In H2-emitting regions with thermal level populations, such as shocks, the ratio can be very high. For example, 1–0 S(1)/2–1 S(1) in a 1000 K gas. Here we repurpose it as a proxy for collisional modification of the H2 rovibrational level populations. All of our observed PDRs have 1–0 S(1)/2–1 S(1) ratios , indicating some degree of collisional modification. There are two ways in which collisions can drive up the 1–0 S(1)/2–1 S(1) ratio: (1) increasing the collisional de-excitation of the level relative to , or (2) increasing the collisional excitation of the level relative to . These are the same processes depicted in panel (b) of Figure 4 (see § 3.2)
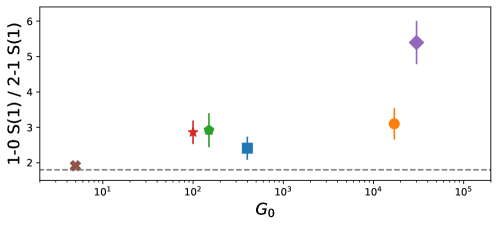
In Table 2 we report the value of 1–0 S(1)/2–1 S(1) for each PDR along with values of and from the literature. We also report the ratio, which parameterizes the number of UV photons per particle in the gas. In Figure 7, we plot 1–0 S(1)/2–1 S(1) against , , and . We note that the uncertainties for 1–0 S(1)/2–1 S(1) are high, so it is difficult to draw any definitive conclusions. We also do not include uncertainties for or because most of these values from the literature are derived from model fits and lack formal uncertainties. We expect the value of 1–0 S(1)/2–1 S(1) to increase with increasing degree of collisional modification (Sternberg & Dalgarno, 1989; Burton et al., 1990b; Draine & Bertoldi, 1996).
We explore how the value of the 1–0 S(1)/2–1 S(1) line ratio changes across our PDRs with respect to the UV field intensities and densities , following discussions of the ratio in Burton et al. (1990b) and Draine & Bertoldi (1996). 1–0 S(1)/2–1 S(1) is mostly invariant over – cm-3 and –. S 140, the Horsehead Nebula, and IC 63 lie within this range of and and have 1–0 S(1)/2–1 S(1) values between 2.41 to 2.95. At densities above cm-3, the ratio becomes sensitive to both and , and increases with both, due to increasing the collisional de-excitation of the level relative to . This trend in the 1–0 S(1)/2–1 S(1) ratio with is most noticeable. Our results are similar to Luhman et al. (1997a) who found that collisions start to affect the H2 rovibrational level populations at cm-3. NGC 2023 lies beyond these ranges with cm-3 and , and has a slightly but not significantly higher 1–0 S(1)/2–1 S(1) value of . If the density is high ( cm-3) and , the gas becomes warm enough that collisional excitation starts to populate the levels, further raising the 1–0 S(1)/2–1 S(1) ratio. The Orion Bar, where and cm-3, exhibits the largest 1–0 S(1)/2–1 S(1) value of . Some models predict an even higher 1–0 S(1)/2–1 S(1). For example, the best-fit isobaric model of the Orion Bar in Joblin et al. (2018), has a gas pressure of K cm-3 and recreates many of the observed features of the Orion Bar but overestimates 1–0 S(1)/2–1 S(1) by a factor of . This suggests that the pressure and density in the H2 emitting gas is lower than in this model. As discussed in 4.1, the H2 emission in the Orion Bar has proven difficult to properly reproduce with steady-state models, and even the model of Joblin et al. (2018) which uses the latest treatments for H2 formation (Le Bourlot et al., 2012), likely requires additional mechanisms (e.g. time-dependent effects; Goicoechea et al., 2016, 2017) to fully model the Orion Bar’s H2 emission.
4.3 Comparison to a Quiescent UV-excited PDR Model
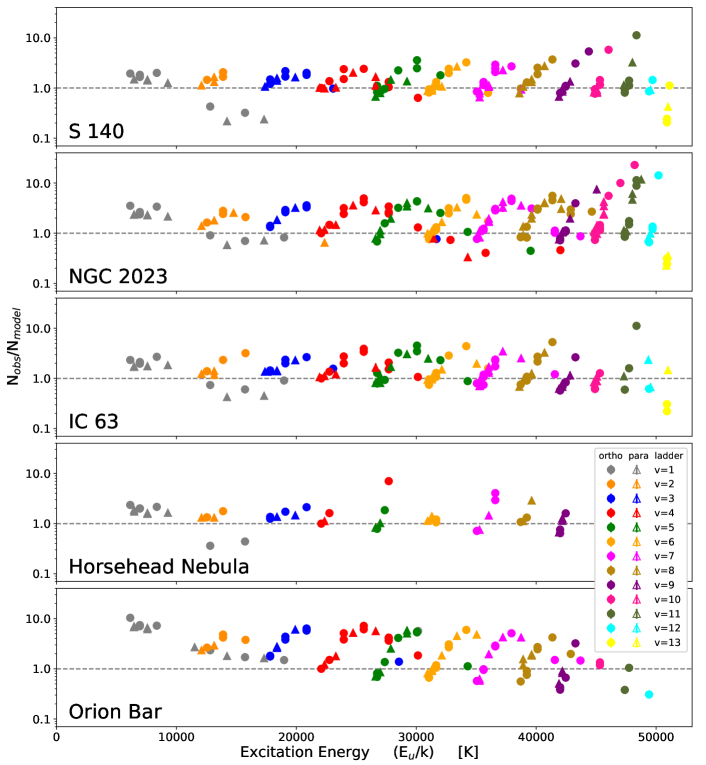
An alternative method for quantifying the effects of collisional modification of UV-excited H2 level populations that takes full advantage of the rich NIR emission spectrum is to compare all the observed level populations to a Cloudy model (Ferland et al., 2013) of a quiescent, low-density PDR. We ran a Cloudy (version C13.03) model with a constant density of cm-3, no cosmic rays, a 27,000 K blackbody illuminating star with a luminosity of , and the cloud face 5 pc from the illuminating star. We normalize the model to the column density of the , level as we have done for our PDR sample, so both the model and observations are normalized in the same manner. Table LABEL:tab:sf-pdr-coldens and Figure 8 present the ratios of the observed level populations for our PDRs to the quiescent UV-excited model.
For this model, , and the predicted 1–0 S(1)/2–1 S(1) ratio is , close to the expected value of for unmodified UV-excited H2. As can be seen in Figure 8, the effects of collisions on a purely UV-excited H2 spectrum we described in § 3.2 are readily apparent in all of our PDRs. The measured low-, level populations in our PDRs are consistently higher than those predicted by the model, and the low-, levels are consistently lower. These differences are most evident in the Orion Bar, with deviations up to an order of magnitude from the model. The dominant effects are that the collisional excitation increases the populations in the levels, and collisional de-excitation reduces the level populations for . Also, the observed PDRs consistently have high- level populations in the states that are larger than those predicted by the model. The Orion Bar shows this effect for , and S 140, NGC 2023, and IC 63 show it for the levels. The situation is less clear in the Horsehead Nebula since we do not probe to sufficiently high levels in that source.
We are unable to rule out the possibility that the observed differences between the model and PDR level populations are entirely due to collisions. For example, our model uses the Takahashi & Uehara (2001) prescription for H2 formation pumping, which sets the rovibrational level populations for newly formed H2, but this prescription might not accurately predict the initial populations resulting from the formation process. In the next section, we compare the PDRs to each other directly.
4.4 Comparison to S 140
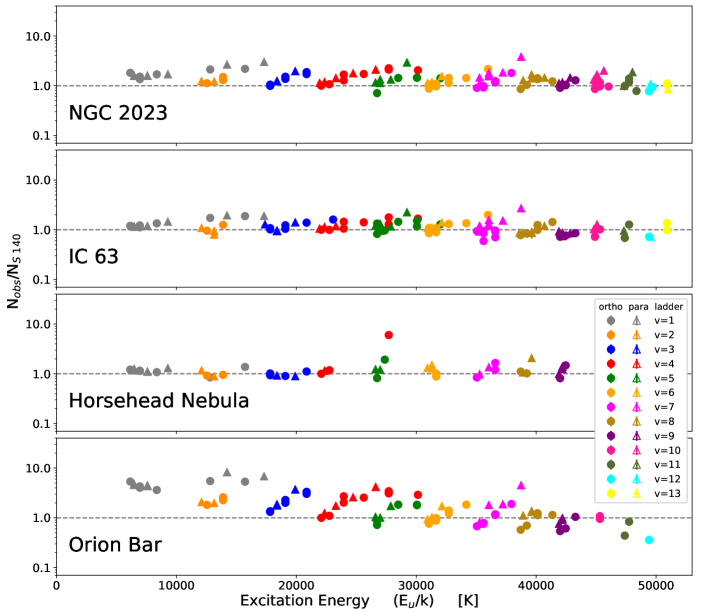
We also compare all the other PDRs in our survey to S 140. This comparison avoids the assumptions and uncertainties in the PDR physics in the models by directly comparing the level populations. We choose S 140 as our reference source because it is bright and probes a large number of H2 rovibrational levels. We can also test whether the S 140 H2 spectrum shows the least collisional modification, as implied by its low 1–0 S(1)/2–1 S(1) ratio. For this comparison, we average all column densities derived for each and level in S 140 in cases where multiple transitions arising from the same upper level were observed. We plot the ratio of the observed level populations for all the PDRs to S 140 in Figure 9.
The results are similar to the comparison to the Cloudy model. As we initially expected, most of the other PDRs show a greater degree of collisional modification in their rovibrational level populations than is found in S 140. In particular, the other PDRs show higher populations in the levels and in the high levels at all , consistent with enhancements due to collisional effects as described in § 3.2. The results are somewhat ambiguous for the Horsehead Nebula, due to the lower number of rovibrational levels detected in this relatively faint source. As we saw earlier in the comparison to the model, the Orion Bar shows the greatest degree of collisional modification to its level populations.
4.5 Ortho-to-Para Ratio Comparison
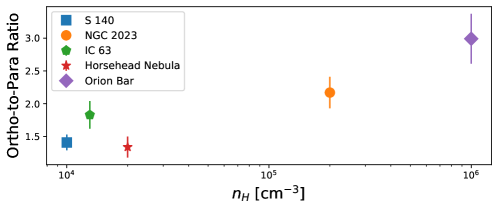
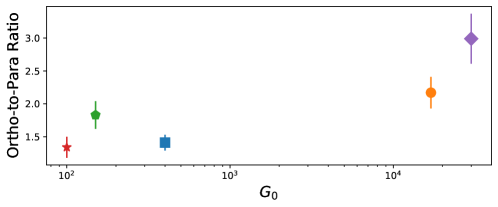
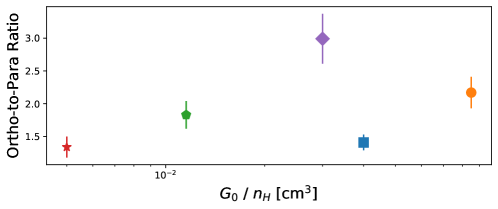
In § 3.3 we estimated the O/P ratio in each PDR and reported our results in Table 2. The expected intrinsic O/P for H2 in thermal equilibrium is 3. In quiescent PDRs where the excitation is primarily caused by UV photons, the observed O/P for rovibrationally excited H2 is due to optical depth effects of the FUV photons being differentially absorbed by ortho- and para-H2 (Sternberg & Neufeld, 1999).
In Figure 10 we plot the O/P vs. , , and . Our results for the O/P resemble our results for 1–0 S(1)/2–1 S(1) where the effects of collisions start to become noticeable in NGC 2023 and become much more prominent in the Orion Bar. S 140, the Horsehead Nebula, and IC 63 have the lowest O/P of , , and , respectively, near the expected value of . NGC 2023, with higher values of and has a higher ratio of . The Orion Bar, with the highest values of and , has the highest ratio of .
These results roughly follow the models of Draine & Bertoldi (1996) where O/P is low at when cm-3, but if the O/P will approach a value of 3 as increases. Several explanations for this trend have been suggested. Draine & Bertoldi (1996) discuss how preferential self-shielding of rovibrationally excited ortho-H2 can raise the observed O/P, even above the thermal limit of 3, although the Orion Bar’s O/P of is indistinguishable from the thermal limit. Sternberg & Neufeld (1999) discuss the effects of collisional excitation and de-excitation. Collisional excitation can raise the observed O/P in the lower-energy levels. Since we fit all levels to calculate the O/P, collisional excitation of the lower-energy levels cannot fully explain our results. Sternberg & Neufeld (1999) also discuss the possibility that collisional de-excitation during the radiative cascade can lead to ortho-para conversions and drive the observed O/P to the thermal value of 3. This explanation is consistent with the other observed trends in the H2 rovibrational level populations that we have attributed to collisions; although we cannot rule out the other effects or if unaccounted for mechanisms are affecting the observed O/P.
5 Summary and Conclusions
Dense molecular clouds respond to UV illumination from nearby hot stars by producing a rich spectrum of H2 rovibrational lines in the near-IR. We have conducted a survey of five PDRs in regions of high-mass star formation: S 140, NGC 2023, IC 63, the Horsehead Nebula, and the Orion Bar, that span a range of gas densities, UV field intensities, and illuminating star properties. The PDRs were observed with single deep IGRINS pointings to maximize the S/N. Each PDR displays a multitude of narrow H2 lines (low velocity widths) from excited rovibrational energy levels with flux ratios clearly indicative of UV (fluorescent) excitation. From these line fluxes, we calculate the detailed H2 rovibrational level populations in each PDR. The relative level populations reflect the combined effects of UV excitation and radiative de-excitation along with collisional excitation and de-excitation. As a result, they provide information about both the radiative environment and the physical conditions in the molecular gas at the PDR boundary.
We have found the following:
-
1.
In all of the PDRs we observed, the lines are narrow ( km s-1) with internal motions of only a few kilometers per second and do not show any evidence for broad components that might result from interactions with stellar winds, clump-clump collisions, or shocks. The kinematics point strongly to UV excitation (fluorescence) and radiative heating as the power behind the emission we observe.
-
2.
Many lines were observed in each PDR, with the spectrum of NGC 2023 showing over 170 H2 lines observed with S/N . This spectrum includes transitions up to very high levels, e.g. 4–3 S(17) which arise from the , level at an excitation energy of K.
-
3.
All of the observed PDRs display values of the widely used diagnostic flux ratio of the 1–0 S(1)/2–1 S(1) lines that are larger than the value for pure UV excitation, with the largest deviation seen for the Orion Bar, the source with the highest value of and . However, this simple index is insufficient to capture subtle differences in the populations of levels with higher and values for different PDRs.
-
4.
While the excitation diagrams for the PDRs all show nonthermal distributions, as one would expect from UV-excited H2, their level populations all exhibit evidence for some degree of collisional modification relative to a Cloudy model of a pure UV-excited region. This evidence is comprised of enhanced populations in the levels relative to those of the levels and of the fact that the levels within each ladder exhibit a pattern of systematically increasing population enhancements with larger . We discuss several possible mechanisms that could cause or contribute to these enhancements at high .
-
5.
Comparison of the five observed PDRs indicates that S 140 shows the least degree of collisional modification of a pure UV-excited spectrum in our sample, while the Orion Bar shows the greatest degree of modification. The effect of the trend with discussed above is less apparent when comparing the other PDRs to S 140 than when comparing to the model.
-
6.
Several of the PDRs in our sample show ortho-to-para ratios in excited rovibrational energy levels consistent with the value of predicted by Sternberg & Neufeld (1999) for pure UV-excited H2. As increases, these values approach the thermal equilibrium value of 3, with the Orion Bar’s ratio being indistinguishable from the thermal value. We discuss several possible explanations for this trend, including the effect of collisions during the radiative cascade.
-
7.
Of the PDRs in our sample, the Orion Bar shows the greatest degree of collisional modification in its level populations relative to the model and the PDRs in our survey. The Orion Bar has the highest and in our sample. The H2 rovibrational level populations in high density PDRs subject to strong UV fields, like the Orion Bar, are quantitatively different from the relative populations in lower-density PDRs illuminated by lower-intensity UV fields, showing greater effects from collisions.
-
8.
Deep high-spectral resolution measurements of the H2 emission in PDRs, such as those presented here, provide a valuable tool for probing the behavior of H2 in UV radiation fields, a ubiquitous component of the interstellar medium of galaxies. As illustrated in this survey, detailed comparisons of observed line ratios in different regions and with models can reveal dependencies on physical conditions and constrain critical aspects of molecular physical processes, which can be applied to the interpretation of future observations.
References
- Abergel et al. (2003) Abergel, A., Teyssier, D., Bernard, J. P., et al. 2003, A&A, 410, 577, doi: 10.1051/0004-6361:20030878
- Allers et al. (2005) Allers, K. N., Jaffe, D. T., Lacy, J. H., Draine, B. T., & Richter, M. J. 2005, ApJ, 630, 368, doi: 10.1086/431919
- Andree-Labsch et al. (2017) Andree-Labsch, S., Ossenkopf-Okada, V., & Röllig, M. 2017, A&A, 598, A2, doi: 10.1051/0004-6361/201424287
- Andrews et al. (2018) Andrews, H., Peeters, E., Tielens, A. G. G. M., & Okada, Y. 2018, A&A, 619, A170, doi: 10.1051/0004-6361/201832808
- Black & Dalgarno (1976) Black, J. H., & Dalgarno, A. 1976, ApJ, 203, 132, doi: 10.1086/154055
- Black & van Dishoeck (1987) Black, J. H., & van Dishoeck, E. F. 1987, ApJ, 322, 412, doi: 10.1086/165740
- Burton (1992) Burton, M. G. 1992, Australian Journal of Physics, 45, 463, doi: 10.1071/PH920463
- Burton et al. (1990a) Burton, M. G., Geballe, T. R., Brand, P. W. J. L., & Moorhouse, A. 1990a, ApJ, 352, 625, doi: 10.1086/168564
- Burton et al. (1990b) Burton, M. G., Hollenbach, D. J., & Tielens, A. G. G. M. 1990b, ApJ, 365, 620, doi: 10.1086/169516
- Burton et al. (1998) Burton, M. G., Howe, J. E., Geballe, T. R., & Brand, P. W. J. L. 1998, PASA, 15, 194, doi: 10.1071/AS98194
- Caballero (2008) Caballero, J. A. 2008, MNRAS, 383, 750, doi: 10.1111/j.1365-2966.2007.12614.x
- Compiègne et al. (2008) Compiègne, M., Abergel, A., Verstraete, L., & Habart, E. 2008, A&A, 491, 797, doi: 10.1051/0004-6361:200809850
- Davis et al. (2003) Davis, C. J., Smith, M. D., Stern, L., Kerr, T. H., & Chiar, J. E. 2003, MNRAS, 344, 262, doi: 10.1046/j.1365-8711.2003.06820.x
- Draine (2003) Draine, B. T. 2003, ARA&A, 41, 241, doi: 10.1146/annurev.astro.41.011802.094840
- Draine & Bertoldi (1996) Draine, B. T., & Bertoldi, F. 1996, ApJ, 468, 269, doi: 10.1086/177689
- Fazio et al. (2004) Fazio, G. G., Hora, J. L., Allen, L. E., et al. 2004, ApJS, 154, 10, doi: 10.1086/422843
- Ferland et al. (2012) Ferland, G. J., Henney, W. J., O’Dell, C. R., et al. 2012, ApJ, 757, 79, doi: 10.1088/0004-637X/757/1/79
- Ferland et al. (2013) Ferland, G. J., Porter, R. L., van Hoof, P. A. M., et al. 2013, RMxAA, 49, 137. https://ui.adsabs.harvard.edu/abs/2013RMxAA..49..137F
- Field et al. (1994) Field, D., Gerin, M., Leach, S., et al. 1994, A&A, 286, 909 https://ui.adsabs.harvard.edu/abs/1994A%26A...286..909F
- Field et al. (1998) Field, D., Lemaire, J. L., Pineau des Forets, G., et al. 1998, A&A, 333, 280 https://ui.adsabs.harvard.edu/abs/1998A%26A...333..280F
- Field et al. (1966) Field, G. B., Somerville, W. B., & Dressler, K. 1966, ARA&A, 4, 207, doi: 10.1146/annurev.aa.04.090166.001231
- Fleming et al. (2010) Fleming, B., France, K., Lupu, R. E., & McCandliss, S. R. 2010, ApJ, 725, 159, doi: 10.1088/0004-637X/725/1/159
- France et al. (2005) France, K., Andersson, B.-G., McCandliss, S. R., & Feldman, P. D. 2005, ApJ, 628, 750, doi: 10.1086/430878
- Gaia Collaboration et al. (2018) Gaia Collaboration, Brown, A. G. A., Vallenari, A., et al. 2018, A&A, 616, A1, doi: 10.1051/0004-6361/201833051
- Gatley et al. (1987) Gatley, I., Hasegawa, T., Suzuki, H., et al. 1987, ApJ, 318, L73, doi: 10.1086/184940
- Goicoechea et al. (2016) Goicoechea, J. R., Pety, J., Cuadrado, S., et al. 2016, Nature, 537, 207, doi: 10.1038/nature18957
- Goicoechea et al. (2017) Goicoechea, J. R., Cuadrado, S., Pety, J., et al. 2017, A&A, 601, L9, doi: 10.1051/0004-6361/201730716
- Gould & Salpeter (1963) Gould, R. J., & Salpeter, E. E. 1963, ApJ, 138, 393, doi: 10.1086/147654
- Habart et al. (2011) Habart, E., Abergel, A., Boulanger, F., et al. 2011, A&A, 527, A122, doi: 10.1051/0004-6361/20077327
- Habart et al. (2005) Habart, E., Abergel, A., Walmsley, C. M., Teyssier, D., & Pety, J. 2005, A&A, 437, 177, doi: 10.1051/0004-6361:20041546
- Habart et al. (2004) Habart, E., Boulanger, F., Verstraete, L., Walmsley, C. M., & Pineau des Forêts, G. 2004, A&A, 414, 531, doi: 10.1051/0004-6361:20031659
- Habing (1968) Habing, H. J. 1968, Bull. Astron. Inst. Netherlands, 19, 421 https://ui.adsabs.harvard.edu/abs/1968BAN....19..421H
- Hasegawa et al. (1987) Hasegawa, T., Gatley, I., Garden, R. P., et al. 1987, ApJ, 318, L77, doi: 10.1086/184941
- Hayashi et al. (1985) Hayashi, M., Hasegawa, T., Gatley, I., Garden, R., & Kaifu, N. 1985, MNRAS, 215, 31P, doi: 10.1093/mnras/215.1.31P
- Hippelein & Münch (1989) Hippelein, H. H., & Münch, G. 1989, A&A, 213, 323 https://ui.adsabs.harvard.edu/abs/1989A%26A...213..323H
- Hirota et al. (2008) Hirota, T., Ando, K., Bushimata, T., et al. 2008, PASJ, 60, 961, doi: 10.1093/pasj/60.5.961
- Hollenbach & Natta (1995) Hollenbach, D., & Natta, A. 1995, ApJ, 455, 133, doi: 10.1086/176562
- Hollenbach & Salpeter (1971) Hollenbach, D., & Salpeter, E. E. 1971, ApJ, 163, 155, doi: 10.1086/150754
- Hollenbach et al. (1991) Hollenbach, D. J., Takahashi, T., & Tielens, A. G. G. M. 1991, ApJ, 377, 192, doi: 10.1086/170347
- Hollenbach & Tielens (1999) Hollenbach, D. J., & Tielens, A. G. G. M. 1999, Reviews of Modern Physics, 71, 173, doi: 10.1103/RevModPhys.71.173
- Howe et al. (1990) Howe, J. E., Jaffe, D. T., & Geballe, T. R. 1990, in BAAS, Vol. 22, Bulletin of the American Astronomical Society, 1328 https://ui.adsabs.harvard.edu/abs/1990BAAS...22.1328H
- Hurwitz (1998) Hurwitz, M. 1998, ApJ, 500, L67, doi: 10.1086/311387
- Joblin et al. (2018) Joblin, C., Bron, E., Pinto, C., et al. 2018, A&A, 615, A129, doi: 10.1051/0004-6361/201832611
- Kaplan et al. (2017) Kaplan, K. F., Dinerstein, H. L., Oh, H., et al. 2017, The Astrophysical Journal, 838, 152 doi: 10.3847/1538-4357/aa5b9f
- Le et al. (2016) Le, H. A. N., Pak, S., Kaplan, K. F., et al. 2016, ApJ, 841, 13, doi: 10.3847/1538-4357/aa6bf7
- Le Bourlot et al. (2012) Le Bourlot, J., Le Petit, F., Pinto, C., Roueff, E., & Roy, F. 2012, A&A, 541, A76, doi: 10.1051/0004-6361/201118126
- Le Petit et al. (2006) Le Petit, F., Nehmé, C., Le Bourlot, J., & Roueff, E. 2006, ApJS, 164, 506, doi: 10.1086/503252
- Lee (2015) Lee, J.-J. 2015, plp: Version 2.0, doi: 10.5281/zenodo.18579.
- Luhman et al. (1997a) Luhman, M. L., Jaffe, D. T., Sternberg, A., Herrmann, F., & Poglitsch, A. 1997a, ApJ, 482, 298, doi: 10.1086/304128
- Luhman et al. (1997b) Luhman, M. L., Luhman, K. L., Benedict, T., Jaffe, D. T., & Fischer, J. 1997b, ApJ, 480, L133, doi: 10.1086/310627
- Marconi et al. (1998) Marconi, A., Testi, L., Natta, A., & Walmsley, C. M. 1998, A&A, 330, 696 https://ui.adsabs.harvard.edu/abs/1998A%26A...330..696M
- Martini et al. (1999) Martini, P., Sellgren, K., & DePoy, D. L. 1999, ApJ, 526, 772, doi: 10.1086/308040
- Meixner & Tielens (1993) Meixner, M., & Tielens, A. G. G. M. 1993, ApJ, 405, 216, doi: 10.1086/172355
- Nishiyama et al. (2006) Nishiyama, S., Nagata, T., Kusakabe, N., et al. 2006, ApJ, 638, 839, doi: 10.1086/499038
- Nishiyama et al. (2009) Nishiyama, S., Tamura, M., Hatano, H., et al. 2009, ApJ, 696, 1407, doi: 10.1088/0004-637X/696/2/1407
- Panagia (1973) Panagia, N. 1973, AJ, 78, 929, doi: 10.1086/111498
- Park et al. (2014) Park, C., Jaffe, D. T., Yuk, I.-S., et al. 2014, Proc. SPIE, 9147, 1, doi: 10.1117/12.2056431
- Parmar et al. (1991) Parmar, P. S., Lacy, J. H., & Achtermann, J. M. 1991, ApJ, 372, L25, doi: 10.1086/186015
- Pellegrini et al. (2007) Pellegrini, E. W., Baldwin, J. A., Brogan, C. L., et al. 2007, ApJ, 658, 1119, doi: 10.1086/511258
- Pellegrini et al. (2009) Pellegrini, E. W., Baldwin, J. A., Ferland, G. J., Shaw, G., & Heathcote, S. 2009, ApJ, 693, 285, doi: 10.1088/0004-637X/693/1/285
- Perryman et al. (1997) Perryman, M. A. C., Lindegren, L., Kovalevsky, J., et al. 1997, A&A, 323, L49 https://ui.adsabs.harvard.edu/abs/1997A%26A...323L..49P
- Roueff et al. (2019) Roueff, E., Abgrall, H., Czachorowski, P., et al. 2019, A&A, 630, A58, doi: 10.1051/0004-6361/201936249
- Schlafly et al. (2014) Schlafly, E. F., Green, G., Finkbeiner, D. P., et al. 2014, ApJ, 786, 29, doi: 10.1088/0004-637X/786/1/29
- Sellgren (1986) Sellgren, K. 1986, ApJ, 305, 399, doi: 10.1086/164255
- Shaw et al. (2005) Shaw, G., Ferland, G. J., Abel, N. P., Stancil, P. C., & van Hoof, P. A. M. 2005, ApJ, 624, 794, doi: 10.1086/429215
- Shaw et al. (2009) Shaw, G., Ferland, G. J., Henney, W. J., et al. 2009, ApJ, 701, 677, doi: 10.1088/0004-637X/701/1/677
- Sheffer et al. (2011) Sheffer, Y., Wolfire, M. G., Hollenbach, D. J., Kaufman, M. J., & Cordier, M. 2011, ApJ, 741, 45, doi: 10.1088/0004-637X/741/1/45
- Shenavrin et al. (2011) Shenavrin, V. I., Taranova, O. G., & Nadzhip, A. E. 2011, Astronomy Reports, 55, 31, doi: 10.1134/S1063772911010070
- Sigut & Jones (2007) Sigut, T. A. A., & Jones, C. E. 2007, ApJ, 668, 481, doi: 10.1086/521209
- Sternberg (1988) Sternberg, A. 1988, ApJ, 332, 400, doi: 10.1086/166664
- Sternberg (1989) —. 1989, ApJ, 347, 863, doi: 10.1086/168177
- Sternberg & Dalgarno (1989) Sternberg, A., & Dalgarno, A. 1989, ApJ, 338, 197, doi: 10.1086/167193
- Sternberg et al. (2014) Sternberg, A., Le Petit, F., Roueff, E., & Le Bourlot, J. 2014, ApJ, 790, 10, doi: 10.1088/0004-637X/790/1/10
- Sternberg & Neufeld (1999) Sternberg, A., & Neufeld, D. A. 1999, ApJ, 516, 371, doi: 10.1086/307115
- Störzer & Hollenbach (1998) Störzer, H., & Hollenbach, D. 1998, ApJ, 495, 853, doi: 10.1086/305315
- Takahashi & Uehara (2001) Takahashi, J., & Uehara, H. 2001, ApJ, 561, 843, doi: 10.1086/323364
- Takami et al. (2000) Takami, M., Usuda, T., Sugai, H., et al. 2000, ApJ, 529, 268, doi: 10.1086/308234
- Takayanagi et al. (1987) Takayanagi, K., Sakimoto, K., & Onda, K. 1987, ApJ, 318, L81, doi: 10.1086/184942
- Tanaka et al. (1989) Tanaka, M., Hasegawa, T., Hayashi, S. S., Brand, P. W. J. L., & Gatley, I. 1989, ApJ, 336, 207, doi: 10.1086/167006
- Thi et al. (2009) Thi, W.-F., van Dishoeck, E. F., Bell, T., Viti, S., & Black, J. 2009, MNRAS, 400, 622, doi: 10.1111/j.1365-2966.2009.15501.x
- Tielens & Hollenbach (1985) Tielens, A. G. G. M., & Hollenbach, D. 1985, ApJ, 291, 722, doi: 10.1086/163111
- Timmermann et al. (1996) Timmermann, R., Bertoldi, F., Wright, C. M., et al. 1996, A&A, 315, L281 https://ui.adsabs.harvard.edu/abs/1996A%26A...315L.281T
- van Dokkum (2001) van Dokkum, P. G. 2001, PASP, 113, 1420, doi: 10.1086/323894
- Wang & Chen (2019) Wang, S., & Chen, X. 2019, ApJ, 877, 116, doi: 10.3847/1538-4357/ab1c61
- Warren & Hesser (1977) Warren, Jr., W. H., & Hesser, J. E. 1977, ApJS, 34, 115, doi: 10.1086/190446
- Witt et al. (1989) Witt, A. N., Stecher, T. P., Boroson, T. A., & Bohlin, R. C. 1989, ApJ, 336, L21, doi: 10.1086/185352
- Wu et al. (2018) Wu, R., Bron, E., Onaka, T., et al. 2018, A&A, 618, A53, doi: 10.1051/0004-6361/201832595