Research on Gender-related Fingerprint Features
qiyong@sust.edu.cn
&
yanpinglics@gmail.com
&
huaweilin.cs@gmail.com
&
gaasyu.chan@gmail.com
& Huaiguang Lei 1
leihg@sust.edu.cn
Abstract
Fingerprint is an important biological feature of human body, which contains abundant gender information. At present, the academic research of fingerprint gender characteristics is generally at the level of understanding, while the standardization research is quite limited. In this work, we propose a more robust method, Dense Dilated Convolution ResNet (DDC-ResNet) to extract valid gender information from fingerprints. By replacing the normal convolution operations with the atrous convolution in the backbone, prior knowledge is provided to keep the edge details and the global reception field can be extended. We explored the results in 3 ways: 1) The efficiency of the DDC-ResNet. 6 typical methods of automatic feature extraction coupling with 9 mainstream classifiers are evaluated in our dataset with fair implementation details. Experimental results demonstrate that the combination of our approach outperforms other combinations in terms of average accuracy and separate-gender accuracy. It reaches 96.5% for average and 0.9752 (males) /0.9548 (females) for separate-gender accuracy. 2) The effect of fingers. It is found that the best performance of classifying gender with separate fingers is achieved by the right ring finger. 3) The effect of specific features. Based on the observations of the concentrations of fingerprints visualized by our approach, it can be inferred that loops and whorls (level 1), bifurcations (level 2), as well as line shapes (level 3) are connected with gender. Finally, we will open source the dataset that contains 6000 fingerprint images.††footnotetext: 1. School of Electronic Information & Artificial Intelligence, Shaanxi University of Science & Technology, Xi’an 710021, China††footnotetext: 2. Shaanxi Joint Laboratory of Artificial Intelligence (Shaanxi University of Science & Technology) , Xi’an 710021, China††footnotetext: 3. College of Computer Science and Software Engineering, Shenzhen University, Shenzhen 518060, China
Keywords Fingerprint Gender Identifications Finger Contribution Feature Visualization
1 Introduction
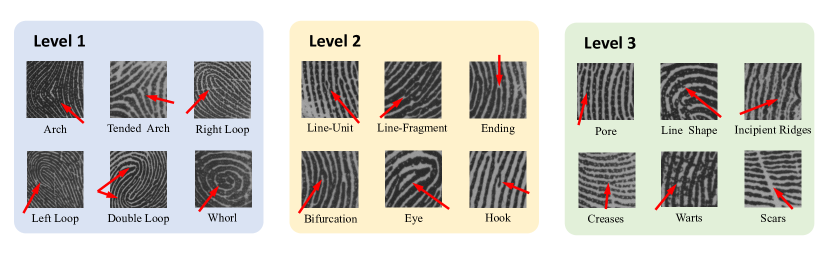
Fingerprint gender identification aims to extract gender-related features from an unidentified fingerprint to recognize one’s gender information. It can be divided into two stages, namely extracting as well as classifying Abdullah et al. (2016a, b); Gnanasivam and Muttan (2012); Gupta and Rao (2014); Mishra and Maheshwary (2017); Rekha et al. (2019); Shinde and Annadate (2015); Wedpathak et al. (2018), in which the former step is of great significance since the effectiveness of gender identification, is primarily determined by the sufficiency of gender-related features. Nowadays, Fingerprints can be classified into three levelKaru and Jain (1996)Henry (1913) as shown Figure 1. Classifying ridge-related features extracted manually has achieved fairly good results, reaching an overall accuracy for 90% for averageArun and Sarath (2011); Badawi et al. (2006); Wedpathak et al. (2018). High performances, however, depends strongly on the manual extraction of features from well-selected regionsKralik and Novotny (2003). These methods have major shortcomings, such as high error, weak robustness, and high labor consumption. So far, with the growing popularity of machine learning and deep learning, automatic feature extraction has become a major foucus.
To realize the automatic feature extraction, considerable work has been done. In machine learning, methods such as DWT, SVD, PCA as well as FFT are extensively used Gnanasivam and Muttan (2012); Kaur and Mazumdar (2012); Marasco et al. (2014). For deep learning based methods, including deep autoencoder neural networks such as VGG and ResNet,etc have been investigated Chen et al. (2017).
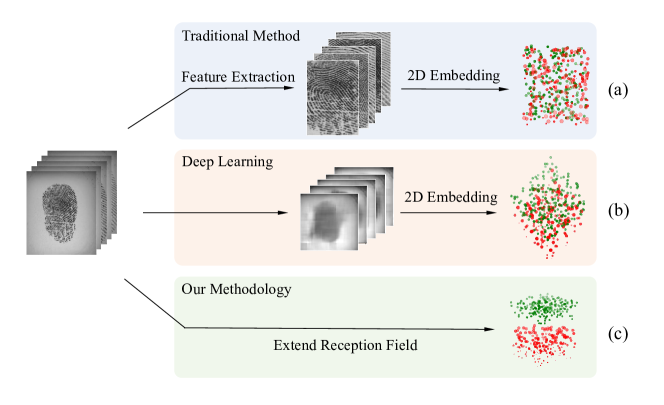
Although numerous algorithms have been proposed, there are still 2 major challenges. First, traditional approaches aquire excessive labor consumption and lack automation. Second, the automatic feature extraction method lacks robustness, which only concerns regions instead of considering the global field. Figure 2 shows the difference between the normal automatic feature extraction method and the deep neural network with global reception consideration. The latter can divide the feature space normatively. Besides, private datasets with disparate data distributions and sizes will directly influence the accuracy. Thus, because of the above challenges, we propose a global feature extraction method to improve the efficiency of gender classification.
Contributions of this paper:
1. We propose a feature extraction method of fingerprint that takes global features into account. For existing typical automatic feature extraction methods and classification methods, we make comprehensive comparisons with fair implementation details.
2. We make a comprehensive comparison to test the efficiency of our method. The finger with the richest gender-related features is detected using the highest performance method. Finally, we visualize the concentrations using the selected method, which indicates the regions with the highest contributions and their corresponding specific features in the gender identification task.
3. We will finally open source the dataset since the open-source datasets in fingerprint gender classification are limited.
The following article will be divided into 4 parts. Part 2 summarizes the development over the last few years. The introduction to automatic feature extraction and classification methods used in this article is provided in part 3. All results and discussions can be found in part 4. At last, we will conclude and outlook future work.
2 Related Work
Previous discussions have demonstrated that gender-related features have a significant impact on fingerprint gender identification. In this section, we will first go through the evolution and then review the progress in recent years in a conclusive table, which is shown in Table 1.
In 1999, AcreeAcree (1999) manually counted ridges in specific areas on the fingerprint epidermis, showing that ridge count can determine the gender. Then in 2003, the mean epidermal ridge breadth has been proposed to identify gender Kralik and Novotny (2003). Similarly in 2006, Badawi Badawi et al. (2006) manualy extracted ridge counts, ridge thickness to valley thickness ratio(RTVTR), and white lines count to determine the gender using a neural network as a classifier. Later, Gungadin Sudesh Gungadin (2007) found a threshold of the ridge density 13ridges/25mm2 in 2007, which determines the gender as male when the ridge density is lower than the threshold. In other words, the female has higher ridge density is probably due to they have lower ridge breadth Kralik and Novotny (2003).
Owing to the inevitable error and high manpower consumption of manual feature extractions, automatic fingerprint extraction has been proposed. In 2012, ridge features have been analyzed in the spatial domain using FFT, 2D-DCTT, and PSD Kaur and Mazumdar (2012), reaching an accuracy of 90% for females and 79.07% for males, respectively. In the same year, Gnanasivam Gnanasivam and Muttan (2012) proposed a method using DWT and SVD as the feature extractor. In 2014, Marasco Marasco et al. (2014) utilized LBP and LPQ on texture features and used PCA to reduce the features, then the kNN classifier was applied to the extracted features. In 2017, DWT feature extraction was applied, matching with neural network Gupta and Rao (2014). Since the presence of the deep convolution autoencoder neural network, deep learning has been widely applied in the feature extraction task especially in the biometric recognition field Chen et al. (2017).
The overview of the previous methods.
| Year | Publisher | Feature Extraction | Classifier | Results | Dataset |
| 1999 | Acree Acree (1999) | Ridge counting manually | Threshold | Female ridge density is higher | Own dataset contains 400 subjects |
| 2003 | Kralik Kralik and Novotny (2003) | Mean epidermal ridge breadth | Threshold | Ridge breadth is 9% greater in males than in females | Own dataset contains 60 subjects |
| 2006 | Badawi Badawi et al. (2006) | RTVTR, white line, ridge thickness | Neural Network | Average 88.8% | Own dataset contains 220 subjects |
| 2007 | Gungadin Sudesh Gungadin (2007) | Counting ridges in the upper portion of the radial border | Threshold | Ridge density of male’s fingerprint tend to be less than or equal to 13ridges/25mm2 | Own dataset contains 500 subjects |
| 2011 | Arun Arun and Sarath (2011) | Ridge count, ridge density, white line and RTVTR | SVM with RBF kernel | Overall 96% | Own dataset contains 150 male and 125 female images |
| 2012 | Kaur Kaur and Mazumdar (2012) | FFT, DCT, PSD | Threshold | 90% for female & 79.07% for male | Own dataset contains 220 subjects |
| 2012 | Gnanasivam Gnanasivam and Muttan (2012) | DWT+SVD | KNN | 91.67% for male & 84.69% for female | Own dataset contains 357 subjects |
| 2014 | Marasco Marasco et al. (2014) | LBP and LPQ descriptor | KNN | Overall 88.7% | Own dataset contains 494 subjects |
| 2014 | Gupta Gupta and Rao (2014) | DWT | ANN | Overall 91.45% | Own dataset contains 55 subjects |
| 2016 | Abdullah Abdullah et al. (2016a) | Ridge count, ridge density, white line and RTVTR | J48 | Overall 96.28% | Own dataset contains 296 subjects |
| 2016 | Abdullah Abdullah et al. (2016c) | Ridge count, ridge density, white line and RTVTR | MLP | Overall 97.25% | Own dataset contains 300 subjects |
| 2017 | Sheetlani Sheetlani et al. (2017) | DWT | CNN | Overall 96.60% | Own dataset contains 80 subjects |
| 2017 | Ashish Mishra Mishra and Maheshwary (2017) | minutiae, incipient ridges | SVM & NN | 76.06% for SVM and 83.7 % for female | NIST |
| 2018 | Wedpathak Wedpathak et al. (2018) | Ridge count & RTVTR | ANN | 88% for male & 78% for female | Own dataset |
| 2019 | Alam Alam et al. (2019) | DWT+SVD | KNN | 91.25% for male & 88.96% for female | Own dataset contains 42 subjects |
| 2019 | Rekha Rekha et al. (2019) | Gabor filter | KNN, SVM, Naive Bayes | ||
| 2020 | DDC-ResNet (Ours) | Autoencoder | CNN | 97.52% for male & 95.48% for female | Dataset contains 200 subjects |
3 Overview of Feature Extraction and Classification Algorithms
In this section, we will introduce our approaches and the implementation principles of automatic feature extraction methods. In addition, we will outline the classification methods utilized in this paper.
3.1 Feature Extraction
3.1.1 Discrete Wavelet Transformation
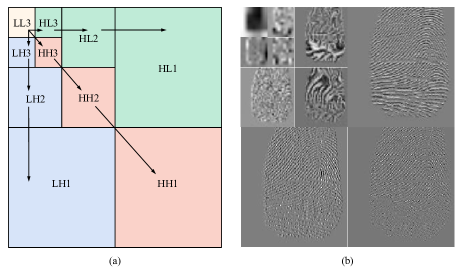
Wavelet has been extensively applied in feature extraction, soft-biometrics recognition, and denoising, etc. It decomposes an image into sub-bands containing frequency and orientation information to represent the valid signals. Specifically, a fingerprint image is decomposed into 4 sub-bands at one level, namely low-low (LL), low-high (LH), high-low (HL) and high-high (HH) which is shown in Figure 3. Typically, the LL sub-band will be decomposed repeatedly since it is thought to represent the most energy, and k refers to the repeat times. If k is set, sub-bands are available. The energy of each sub-band is calculated by equation 1, which will be used as a feature vector for gender classification (), where represents the pixel at the position and on the level. and represent the width and the height of the sub-band, respectively.
| (1) |
3.1.2 Singular Value Decomposition
The fundamental of the SVD is that any rectangular matrix can be transformed into the product of three new matrices. Specifically, given a fingerprint image matrix with rows and columns, it can be factored into , , and by using equation 2, where and and S are diagonal matrices that contain the square root eigenvalues with the size of by , which is stored for gender classification.
| (2) |
3.1.3 Fast Fourier Transform
The FFT is used to transform a fingerprint image into the frequency domain. The transformed vector contains most of the information in the spatial domain and is used for gender classification. It is presented in equation 3, where M and N represent the height and width of the fingerprint image, k and l represent frequency variables, respectively. , , , .
| (3) |
3.1.4 Our method
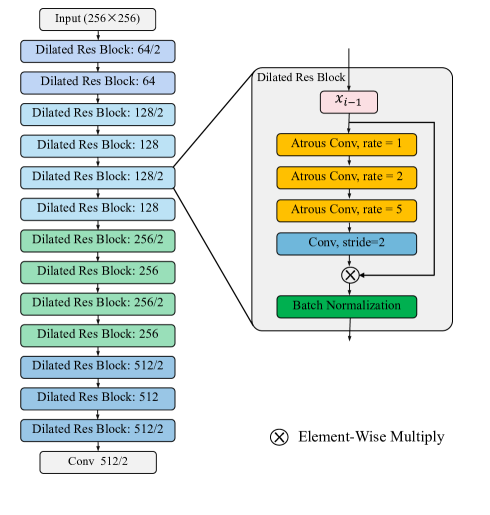
Autoencoder neural networks can be divided into the encoder and decoder. Concretely, in the encoder step, the low dimensional data will be compressed into feature vector in high dimensional space, and the decoder step is to reconstructs the original data without redundant features. The general equation is described in 4. The feature vector can be optimized by minimizing the distance between the original data and the reconstructed data, and used for gender classification. Our method utilizes ResNet as the backbone, and uses the atrous convolution operation to replace the normal convolutions, as shown in Figure 4. In the block res we utilize atrous rates as 1, 2 and 5 to prevent the gridding effect.
| (4) |
3.2 Gender Classification
To ensure fairness of experiments, we adopt commonly used 9 classifiers in gender classification problem, which are CNN, SVM (3 kernels), kNN, Adaboost, J48, ID3, and LDA. Among them the 3 kernels in SVM refer to linear, radial basis function, and polynomial, respectively. CNN is comprised of fully connected layers. These are all mainstream algorithms used in classification tasks. We threrfore only highlight their implementation details in the next section and more details of the methods are presented in section 4.1.
4 Experimental Results
In this section, we first introduce our dataset and adopted implementation details. In the experimental stage, factors that affect gender-related features will be analyzed comprehensively to provide some useful conclusions.
4.1 Experimental Setup
4.1.1 Dataset
The fingerprint dataset used in experiments is obtained from ZK fingerprint acquisition equipment with 500 dpi, containing 200 persons (102 females and 98 males) and 6000 images. Each finger is collected 3 times to guarantee the quality of the fingerprint image.
4.1.2 Implementation Details
In the preprocessing step, we resize each fingerprint image to and normalize it to . ratio is , No repetitive finger is guaranteed in both the training set and test set.
In the feature extraction stage, for DWT, each fingerprint goes through eight levels of decomposition. For SVD, each fingerprint image vector is of size 256. In VGG-Net, we apply the VGG-19 network in which 8 blocks are utilized. Each block contains 2 convolutional layers and a batch of normalization layers. ResNet-18 is applied and each block contains a residual block to prevent the vanishment of gradients. The DDC-ResNet, by replacing the normal convolutional layers with dilated convolutional layers in ResNet, lowers the loss of valid edge features Wang et al. (2018). To keep the fairness, these three types of feature extraction networks are of the vector size in the last layer. Here we set the batch size to be 10, and the iteration numbers are 10K. The optimizer we adopt is Adam, in which the learning rate is . Inspired by Maas Maas et al. (2013), the leaky relu is used as the activation function. All the codes are realized with the framework TensorFlow Abadi et al. (2016) in python. Hardware utilization includes GPU with NVIDIA TITAN Xp, and CPU with 2.8GHz, 32GB in RAM.
In the classification progress, the Adaboost is used with the , , , and . In SVM, the linear kernel is utilized with the function LinearSVC in the default configuration, and are set when applying RBF and polynomial kernels. The parameter k in kNN is set to be 1. J48 algorithm is conducted in WEKA software with the default settings Holmes et al. (1994). The CNN classifier is comprised of 3 fully connected layers with the leaky relu activation. Classification algorithms except J48 and CNN are all conducted in scikit-learn Pedregosa et al. (2011).
| Adaboost | SVM1 | SVM2 | SVM3 | KNN | J48 | CNN | ID3 | LDA | |
|---|---|---|---|---|---|---|---|---|---|
| FFT | 85.280 | 65.827 | 82.604 | 87.310 | 92.202 | 73.912 | 87.220 | 78.931 | 88.498 |
| 0.8337/0.8719 | 0.6895/0.6270 | 0.7935/0.8586 | 0.8653/0.8809 | 0.9346/0.9094 | 0.7224/0.7558 | 0.8814/0.8630 | 0.7682/0.8104 | 0.9012/0.8687 | |
| DWT | 91.494 | 70.001 | 88.275 | 88.735 | 90.460 | 90.394 | 91.360 | 90.344 | 87.192 |
| 0.9531/0.8768 | 0.7280/0.6720 | 0.9144/0.8511 | 0.9452/0.8295 | 0.9187/0.8905 | 0.8977/0.9102 | 0.9455/0.8817 | 0.8727/0.9342 | 0.8693/0.8745 | |
| SVD | 92.096 | 66.552 | 86.506 | 91.609 | 88.230 | 76.667 | 92.413 | 89.770 | 89.721 |
| 0.9294/0.9125 | 0.6839/0.6471 | 0.7910/0.9391 | 0.9248/0.9074 | 0.8917/0.8729 | 0.7296/0.8037 | 0.9350/0.9133 | 0.8856/0.9098 | 0.9411/0.8443 | |
| ResNet | 92.068 | 69.302 | 85.502 | 91.713 | 92.529 | 90.460 | 93.333 | 90.460 | 82.106 |
| 0.9334/0.9080 | 0.7202/0.6658 | 0.8210/0.8890 | 0.9220/0.9123 | 0.9072/0.9434 | 0.8979/0.9113 | 0.9463/0.9204 | 0.9149/0.8943 | 0.7966/0.8455 | |
| VGG | 94.138 | 72.454 | 88.506 | 94.713 | 93.563 | 88.220 | 93.678 | 90.459 | 89.385 |
| 0.9464/0.9364 | 0.7208/0.7283 | 0.8192/0.9509 | 0.9590/0.9353 | 0.9428/0.9285 | 0.9195/0.8449 | 0.9423/0.9313 | 0.9099/0.8993 | 0.9047/0.8830 | |
| DDCResNet | 94.253 | 73.844 | 89.576 | 95.333 | 92.759 | 89.344 | 96.500 | 91.494 | 93.599 |
| 0.9350/0.9501 | 0.7366/0.7403 | 0.8260/0.9655 | 0.9743/0.9324 | 0.8865/0.9687 | 0.8921/0.8948 | 0.9752/0.9548 | 0.9159/0.9140 | 0.9461/0.9259 |
4.2 Effect of Methods
To evaluate the effect of different methods on gender-related features, we make a benchmark for the combinations of 6 feature extraction methods coupling with 9 classifiers to compare their average and separate-gender accuracies, as shown in Table 2. In terms of the average accuracy, the DDC-ResNet extractor outperforms other extraction methods when matching with different classifiers. For the classifiers, the Adaboost, SVM with the polynomial kernel, and CNN are more outstanding. On the contrary, the SVM with the linear kernel seems not qualified for the extracted features with high dimensional space in the gender identification task. Regarding the separate-gender performance, most of the results show more correct predictions in males than in females, especially for DWT+SVM3. The difference is more than 10%, which is agreed with theShinde and Annadate (2015); Gnanasivam and Vijayarajan (2019), suggesting that fingerprints of males contain richer gender-related features in some aspects. To make a more comprehensive analysis, we also evaluate the time consumption of each combination when feeding different batch sizes of data. The result is shown in Table 4. In general, deep learning extractors consume more time than machine learning, and SVD extractor consumes the least time. However, FFT behaves oppositely which is because the transformation does not reduce the feature size. In summary, the combination of DDC-ResNet and CNN outperforms other combinations, reaching an average accuracy of 96.50% and separate-gender accuracy of 0.9743/0.9324. Moreover, males contain richer gender-related features than females. After evaluating the performance of various methods with all test fingers, we will explore how specific fingers influence the gender identification results below.
4.3 Effect of Fingers
After studying the effect of varing methods on gender-related features, we further explore the effect of each finger. We divide the testing fingerprints into 10 sets, each set of which corresponds to a specific finger containing 660 fingerprint images. We apply the DDC-ResNet coupled with CNN (best performance method above) to test the 10 sets, as listed in Table 3. The result indicates that for each specific finger, the right ring finger (R2) shows the highest accuracy, reaching 92.455%. For 5 pairs of fingers, ring fingers outperform other pairs, reaching an accuracy of 91.413%. For the overall hand, the right hand achieves a higher accuracy than the left hand, which reaches 87.872%. To better understand the effect of fingers on gender-related features, more careful studies will be carried out in the following part.
| L1 | 88.291 | : 87.078 | : 86.418 |
| R1 | 85.864 | ||
| L2 | 90.371 | : 91.413 | |
| R2 | 92.455 | ||
| L3 | 87.152 | : 89.258 | |
| R3 | 91.363 | : 87.872 | |
| L4 | 82.819 | : 84.637 | |
| R4 | 86.455 | ||
| L5 | 83.455 | : 83.340 | |
| R5 | 83.224 |
| VGG | ResNet | DDCResNet | DWT | SVD | FFT | |
| Adaboost | 3.213/3.959/19.677 | 3.776/4.213/20.581 | 6.456/6.86/26.100 | 0.184/2.652/18.693 | 0.165/1.786/14.445 | 0.130/3.994/280.162 |
| SVM1 | 3.176/3.905/16.530 | 3.739/4.159/17.434 | 6.419/6.806/22.953 | 0.160/2.013/15.674 | 0.147/1.292/13.010 | 0.184/3.207/48.925 |
| SVM2 | 3.176/3.905/16.960 | 3.739/4.159/17.864 | 6.419/6.806/23.383 | 0.143/2.412/15.108 | 0.153/1.292/12.967 | 0.029/1.688/147.075 |
| SVM3 | 3.176/3.905/16.902 | 3.739/4.159/17.806 | 6.419/6.806/23.325 | 0.296/1.609/16.883 | 0.146/1.291/12.944 | 0.028/1.665/143.031 |
| KNN | 3.180/3.904/16.602 | 3.743/4.158/17.506 | 6.423/6.805/23.025 | 0.198/1.059/18.370 | 0.162/1.294/12.889 | 0.030/1.393/89.841 |
| J48 | 3.184/3.927/16.331 | 3.747/4.181/17.235 | 6.427/6.828/22.754 | 0.184/1.477/15.854 | 0.148/1.296/12.791 | 0.858/4.822/201.731 |
| CNN | 3.189/3.903/15.963 | 3.752/4.157/16.867 | 6.432/6.804/22.386 | 0.139/1.749/17.110 | 0.156/1.300/12.756 | 1.200/4.190/341.870 |
| ID3 | 3.176/3.920/16.629 | 3.739/4.174/17.533 | 6.419/6.821/23.052 | 0.142/1.842/15.556 | 0.1467/1.291/12.897 | 0.062/1.756/43.519 |
| LDA | 3.176/3.901/16.292 | 3.739/4.154/17.196 | 6.419/6.801/22.715 | 0.148/1.466/16.770 | 0.147/1.292/12.967 | 0.138/2.478/41.830 |
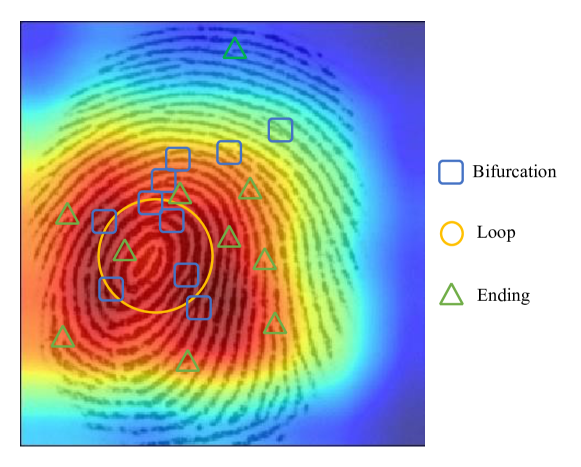
4.4 Effect of Features
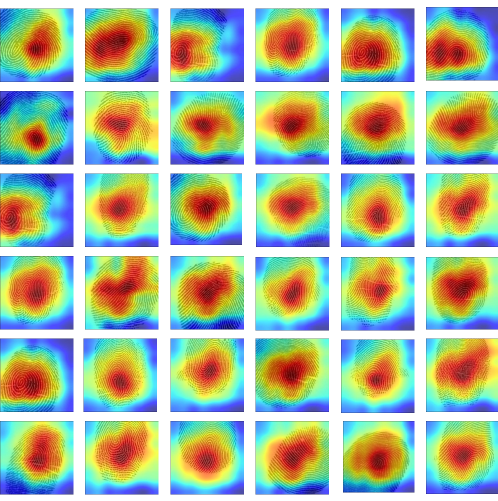
To further research on gender-related features, we apply the grad-cam Selvaraju et al. (2017) technique to visualize the heat maps, seeing which part contributes most. Specifically, based on earlier results, we visualize testing fingers by using the DDC-ResNet extractor. The overview of visualization is exhibited in Figure 5, It can be seen that concentrations are mainly on or around the center of fingerprints. Detailed observation is shown in Figure 6. The concentration covers the whorl part which belongs to the pattern features of level 1. Further observation reveals that bifurcations are gathered in concentration regions. However, we exclude the sweat pores around the bifurcations since other parts containing more remarkable sweat pores have not received attention. We also find that the concentration regions prefer to be continuous parts. Therefore, it is not hard to say that the foundation of recognition is complete ridges, which explains the reason for manual extraction of minutiae features in well-selected continuous regions.
5 Conclusion and Future work
This paper proposes an effective network considering the global reception field in the gender classification task, which is realized by replacing normal convolutions with dilated convolution in the extraction method. The experiment thoroughly explores the efficiency from three aspects. First, comparing our method with various methods with fair implementation details in our dataset. 6 typical automatic feature extraction methods like DWT, SVD, VGG, and our method coupling with 9 mainstream classifiers such as Adaboost, kNN, SVM, CNN, etc. are evaluated. Experimental results reveal that the combination of our extractor with the CNN classifier outperforms other combinations. For average accuracy, it reaches 96.50% and for separate-gender accuracy, it reaches 0.9752 (males) / 0.9548 (females). Second, we investigate the effect of fingers by classifying gender using separate fingers, and find the best-performing finger is the right ring finger, which reaches an accuracy of 92.455%. Third, we study the effect of features by visualizing concentrations of fingerprints. Depending on the analysis, loops/whorls (level 1), bifurcations (level 2) and line shapes (level 3) may have a close relationship with gender. This work not only comprehensively explores the efficiency of the proposed method, but also provides a way to observe fingerprint identification features much closer. These specific features will be quantified in the future to further explore the impact on fingerprint recognition.
References
- Abdullah et al. [2016a] SF Abdullah, AFNA Rahman, ZA Abas, and WHM Saad. Fingerprint gender classification using univariate decision tree (j48). Network (MLPNN), 96(95.27):95–95, 2016a.
- Abdullah et al. [2016b] Siti Fairuz Abdullah, AFNA Rahman, ZA Abas, and WHM Saad. Support vector machine, multilayer perceptron neural network, bayes net and k-nearest neighbor in classifying gender using fingerprint features. International Journal of Computer Science and Information Security, 14(7):336, 2016b.
- Gnanasivam and Muttan [2012] P Gnanasivam and Dr S Muttan. Fingerprint gender classification using wavelet transform and singular value decomposition. arXiv preprint arXiv:1205.6745, 2012.
- Gupta and Rao [2014] Samta Gupta and A Prabhakar Rao. Fingerprint based gender classification using discrete wavelet transform & artificial neural network. International Journal of Computer Science and mobile computing, 3(4):1289–1296, 2014.
- Mishra and Maheshwary [2017] Ashish Mishra and Preeti Maheshwary. A novel technique for fingerprint classification based on naive bayes classifier and support vector machine. International Journal of Computer Applications, 975:8887, 2017.
- Rekha et al. [2019] V Rekha, S Gurupriya, S Gayadhri, and S Sowmya. Dactyloscopy based gender classification using machine learning. In 2019 IEEE International Conference on System, Computation, Automation and Networking (ICSCAN), pages 1–5. IEEE, 2019.
- Shinde and Annadate [2015] Mangesh K Shinde and SA Annadate. Analysis of fingerprint image for gender classification or identification: using wavelet transform and singular value decomposition. In 2015 International Conference on Computing Communication Control and Automation, pages 650–654. IEEE, 2015.
- Wedpathak et al. [2018] Ganesh S Wedpathak, DG Kadam, KG Kadam, AR Mhetre, and VK Jankar. Fingerprint based gender classification using ann. International Journal of Recent Trends in Engineering & Research (IJRTER), 4(3):4, 2018.
- Karu and Jain [1996] Kalle Karu and Anil K Jain. Fingerprint classification. Pattern recognition, 29(3):389–404, 1996.
- Henry [1913] Edward Richard Henry. Classification and uses of finger prints. HM Stationery Office, printed by Darling and son, Limited, 1913.
- Arun and Sarath [2011] KS Arun and KS Sarath. A machine learning approach for fingerprint based gender identification. In 2011 IEEE Recent Advances in Intelligent Computational Systems, pages 163–167. IEEE, 2011.
- Badawi et al. [2006] Ahmed M Badawi, Mohamed Mahfouz, Rimon Tadross, and Richard Jantz. Fingerprint-based gender classification. IPCV, 6(8):l, 2006.
- Kralik and Novotny [2003] Miroslav Kralik and Vladimir Novotny. Epidermal ridge breadth: an indicator of age and sex in paleodermatoglyphics. Variability and evolution, 11(2003):5–30, 2003.
- Kaur and Mazumdar [2012] Ritu Kaur and Susmita Ghosh Mazumdar. Fingerprint based gender identification using frequency domain analysis. International Journal of Advances in Engineering & Technology, 3(1):295, 2012.
- Marasco et al. [2014] Emanuela Marasco, Luca Lugini, and Bojan Cukic. Exploiting quality and texture features to estimate age and gender from fingerprints. In Biometric and Surveillance Technology for Human and Activity Identification XI, volume 9075, page 90750F. International Society for Optics and Photonics, 2014.
- Chen et al. [2017] Min Chen, Xiaobo Shi, Yin Zhang, Di Wu, and Mohsen Guizani. Deep features learning for medical image analysis with convolutional autoencoder neural network. IEEE Transactions on Big Data, 2017.
- Acree [1999] Mark A Acree. Is there a gender difference in fingerprint ridge density? Forensic science international, 102(1):35–44, 1999.
- Sudesh Gungadin [2007] MBBS Sudesh Gungadin. Sex determination from fingerprint ridge density. Internet Journal of Medical Update, 2(2), 2007.
- Abdullah et al. [2016c] SF Abdullah, AFNA Rahman, ZA Abas, and WHM Saad. Multilayer perceptron neural network in classifying gender using fingerprint global level features. Indian Journal of Science and Technology, 9(9):1–6, 2016c.
- Sheetlani et al. [2017] Jitendra Sheetlani, Rajmohan Pardeshi, et al. Fingerprint based automatic human gender identification. Int. J. Comput. Appl, 170(7):1–4, 2017.
- Alam et al. [2019] Shadab Alam, Megha Dua, Ashutosh Gupta, et al. A comparative study of gender classification using fingerprints. In 2019 6th International Conference on Computing for Sustainable Global Development (INDIACom), pages 880–884. IEEE, 2019.
- Wang et al. [2018] Panqu Wang, Pengfei Chen, Ye Yuan, Ding Liu, Zehua Huang, Xiaodi Hou, and Garrison Cottrell. Understanding convolution for semantic segmentation. In 2018 IEEE winter conference on applications of computer vision (WACV), pages 1451–1460. IEEE, 2018.
- Maas et al. [2013] Andrew L Maas, Awni Y Hannun, Andrew Y Ng, et al. Rectifier nonlinearities improve neural network acoustic models. In Proc. icml, volume 30, page 3. Citeseer, 2013.
- Abadi et al. [2016] Martín Abadi, Ashish Agarwal, Paul Barham, Eugene Brevdo, Zhifeng Chen, Craig Citro, Greg S Corrado, Andy Davis, Jeffrey Dean, Matthieu Devin, et al. Tensorflow: Large-scale machine learning on heterogeneous distributed systems. arXiv preprint arXiv:1603.04467, 2016.
- Holmes et al. [1994] Geoffrey Holmes, Andrew Donkin, and Ian H Witten. Weka: A machine learning workbench. In Proceedings of ANZIIS’94-Australian New Zealnd Intelligent Information Systems Conference, pages 357–361. IEEE, 1994.
- Pedregosa et al. [2011] Fabian Pedregosa, Gaël Varoquaux, Alexandre Gramfort, Vincent Michel, Bertrand Thirion, Olivier Grisel, Mathieu Blondel, Peter Prettenhofer, Ron Weiss, Vincent Dubourg, et al. Scikit-learn: Machine learning in python. the Journal of machine Learning research, 12:2825–2830, 2011.
- Gnanasivam and Vijayarajan [2019] P Gnanasivam and R Vijayarajan. Gender classification from fingerprint ridge count and fingertip size using optimal score assignment. Complex & Intelligent Systems, 5(3):343–352, 2019.
- Selvaraju et al. [2017] Ramprasaath R Selvaraju, Michael Cogswell, Abhishek Das, Ramakrishna Vedantam, Devi Parikh, and Dhruv Batra. Grad-cam: Visual explanations from deep networks via gradient-based localization. In Proceedings of the IEEE international conference on computer vision, pages 618–626, 2017.