The NOvA Collaboration
Improved measurement of neutrino oscillation parameters by the NOvA experiment
Abstract
We present new , , , and oscillation measurements by the NOvA experiment, with a 50% increase in neutrino-mode beam exposure over the previously reported results. The additional data, combined with previously published neutrino and antineutrino data, are all analyzed using improved techniques and simulations. A joint fit to the , , , and candidate samples within the 3-flavor neutrino oscillation framework continues to yield a best-fit point in the normal mass ordering and the upper octant of the mixing angle, with eV2 and . The data disfavor combinations of oscillation parameters that give rise to a large asymmetry in the rates of and appearance. This includes values of the CP-violating phase in the vicinity of which are excluded by for the inverted mass ordering, and values around in the normal ordering which are disfavored at 2 confidence.
pacs:
14.60.PqI Introduction
We report new measurements of neutrino oscillation parameters using neutrino and antineutrino data from the NOvA experiment. The data include a 50% increase in neutrino-mode beam exposure over the previously reported results Acero et al. (2019). We perform a joint fit to and oscillations utilizing improvements in the analysis of these data.
Numerous experiments Fukuda et al. (1998, 2002); Ahmad et al. (2002); Eguchi et al. (2003); Michael et al. (2006); Abe et al. (2011, 2012); An et al. (2012); Ahn et al. (2012) corroborate the paradigm in which three neutrino mass eigenstates () mix to form the three flavor eigenstates (, , ). The mixing can be expressed by the unitary matrix, , named for Pontecorvo, Maki, Nakagawa, and Sakata. can be parameterized by three mixing angles () along with a phase () that, if different from 0 or , indicates violation of Charge-Parity (CP) symmetry. Neutrino mixing gives rise to oscillations from one flavor state to another, dependent on the mixing parameters and the mass splittings ().
Using the definition of as having the largest contribution, it has been established that is positive, and therefore, the mass eigenstate is heavier than . However, the sign of the larger mass splitting, , is unknown. If this term is positive, then the third mass eigenstate is the heaviest, and the mass ordering is labeled as the Normal Ordering (NO) (also referred to as Normal Hierarchy). The alternative is referred to as Inverted Ordering (IO) (or Inverted Hierarchy). Knowing the mass ordering would constrain models of neutrino masses Mohapatra and Smirnov (2006); Nunokawa et al. (2008); Altarelli and Feruglio (2010); King (2015); Petcov (2018) and could aid in the resolution of the Dirac or Majorana nature of the neutrino Pascoli and Petcov (2002); Bahcall et al. (2004).
The mass ordering affects the rates of and oscillations when neutrinos travel through the Earth as compared to a vacuum. Coherent forward scattering on electrons in the Earth’s crust enhances the rate of oscillations and suppresses for the NO while the enhancement and suppression is reversed for the IO. This matter effect Wolfenstein (1978) changes the oscillation probabilities for NOvA by . Depending on the value of and the mass ordering itself, NOvA may be able to exploit the resulting neutrino-antineutrino asymmetry to measure the sign of and thus determine the mass ordering.
NOvA also has sensitivity to , which will increase the oscillation probability if is positive and suppress oscillations if negative (the effect is reversed for antineutrinos). Additionally, a non-zero value of would identify the neutrino sector as a source of CP violation which is central to some explanations of the matter-antimatter asymmetry observed based on leptogenesis Fukugita and Yanagida (1986); Buchmuller and Plumacher (1996); Buchmuller et al. (2005a, b); Pilaftsis (1997). Since a measurement of both the mass ordering and rely on a comparison of and appearance, certain combinations of and mass ordering will be degenerate with others for NOvA’s oscillation baseline.
Finally, the angle largely determines the coupling of the and states to the mass state. In the case of maximal mixing, , and couple equally to Harrison and Scott (2002), which suggests a symmetry. If non-maximal, could lie in the upper octant (UO, ) or lower octant (LO, ) with a stronger or coupling, respectively. Current measurements of are near maximal mixing Acero et al. (2019); Michael et al. (2006); Abe et al. (2011), but significant uncertainties remain making it the least precisely measured mixing angle.
Here, we reanalyze the data taken in the antineutrino-mode beam from June 29, 2016, to February 26, 2019, with an exposure of protons on target (POT) delivered during of integrated beam-pulse time. These data are combined with an increased, and reanalyzed, neutrino-mode beam exposure of POT from of integrated beam-pulse time recorded between February 6, 2014, to March 20, 2020. During these periods, the proton source achieved an average power of , and a peak hourly-averaged power of .
In addition to the increased neutrino-mode beam exposure, this analysis introduces various improvements that will be described in detail in the following sections. There are changes to the underlying neutrino interaction simulation, particle propagation, and detector response models. The reconstruction uses a new clustering algorithm and expands the use of neural networks. Furthermore, the Near-to-Far extrapolation method has been expanded to further constrain the FD predictions, which also reduces the impact of systematic uncertainties on the analysis by up to 9% as compared to the previous method. Finally, we have improved some systematic uncertainties and introduced new ones associated with the above changes.
II The NOvA Experiment and Simulations
NOvA observes appearance and disappearance oscillations using two functionally-identical tracking calorimeters Ayres et al. (2007) deployed in Fermilab’s NuMI beam Adamson et al. (2016). Charged particle tracking is accomplished via PVC cells filled with a mineral oil-based liquid scintillator Mufson et al. (2015). The cells are in cross section and are oriented in alternating vertical and horizontal planes to achieve 3D reconstruction. The Near Detector (ND) is located underground and from the production target. The main body of the ND is followed by a muon range stack where the active planes are interleaved with steel plates. The Far Detector (FD) is located at Ash River, Minnesota, from the source. Being located on the surface with a modest rock overburden, the FD receives a cosmic-ray flux of . This analysis benefits from an updated simulation of the geometries of the detectors and their surroundings that more accurately reflects the surrounding rock composition and detectors as built.
Both detectors are centered off the beam axis and receive a narrow-band neutrino flux peaked at . Magnetic focusing horns are used to select the sign of the neutrino parents, producing a 93% (92%) pure () beam between . The majority of contamination is due to “wrong-sign” neutrinos (i.e. in a selected beam and vice versa). The neutrino flux delivered to the detectors is calculated using geant4-based simulations of particle production and transport through the beamline components Adamson et al. (2016); Agostinelli et al. (2003) reweighted to incorporate external measurements using the Package to Predict the Flux (PPFX) Aliaga et al. (2016); Paley et al. (2014); Alt et al. (2007); Abgrall et al. (2011); Barton et al. (1983); Seun (2007); Tinti (2010); Lebedev (2007); Baatar et al. (2013); Skubic et al. (1978); Denisov et al. (1973); Carroll et al. (1979); Abe et al. (2013); Gaisser et al. (1975); Cronin et al. (1957); Allaby et al. (1969); Longo and Moyer (1962); Bobchenko et al. (1979); Fedorov et al. (1978); Abrams et al. (1970).
Neutrino interactions are simulated using a custom model configuration of genie 3.0.6 Andreopoulos et al. (2010, 2015) tuned to external and NOvA ND data.111Neutrino interactions in this analysis were inadvertently simulated with event kinematics of GENIE configuration N18_10j_00_000 but integrated rates with configuration N18_10j_02_11a. These two configurations have the same model set and differ only in the tune of the resonant, non-resonant background, and DIS free nucleon cross sections, where the N18_10j_00_000 tune used inclusive neutrino scattering data and the N18_10j_02_11a tune used and production in addition to the inclusive neutrino scattering data Tena-Vidal et al. (2021); Tena-Vidal (2018). The predicted Far Detector event spectra generated using N18_10j_02_11a are consistent with the predictions used in this measurement within the systematic uncertainties. In this configuration, charged-current (CC) quasi-elastic (QE) scattering is simulated using the model of Nieves et al. Nieves et al. (2004), which includes the effects of long-range nucleon correlations calculated according to the Random Phase Approximation (RPA) Martini et al. (2009); Nieves et al. (2004); Pandey et al. (2015). The CCQE axial vector form factor is a -expansion parameterization tuned to neutrino-deuterium scattering data Meyer et al. (2016). CC interactions with two nucleons producing two holes (2p2h) are given by the IFIC València model Nieves et al. (2011); Gran et al. (2013). The initial nuclear state is represented by a local Fermi gas in both the QE and 2p2h models, and by a global relativistic Fermi gas for all other processes. Baryon resonance (RES) and coherent pion production are simulated using the Berger-Sehgal models with final-state mass effects taken into account Berger and Sehgal (2007, 2009). Deep inelastic scattering (DIS) and non-resonant background below the DIS region are described using the Bodek-Yang model Bodek and Yang (2003) with hadronization simulated by a data-driven parameterization Yang et al. (2009) coupled to pythia Sjostrand et al. (2006). Bare nucleon cross-sections for RES, DIS, and non-resonant background processes are tuned by genie to neutrino scattering data. Final state interactions (FSI) are simulated by the genie hN semi-classical intranuclear cascade model in which pion interaction probabilities are assigned according to Oset et al. Salcedo et al. (1988) and pion-nucleon scattering data.
The 2p2h and FSI models in this genie configuration are adjusted to produce a NOvA-specific neutrino interaction model tune. The 2p2h model is fit to CC inclusive scattering data from the NOvA ND. Inspired by Gran et al. Gran et al. (2018), this 2p2h tune enhances the base model as a function of energy and momentum transfer to the nucleus and is applied to all CC 2p2h interactions for both the neutrino and anti-neutrino beams. The parameters governing and FSI are adjusted to obtain agreement with on scattering data Allardyce et al. (1973); Saunders et al. (1996); Meirav et al. (1989); Levenson et al. (1983); Ashery et al. (1981, 1984); Pinzon Guerra et al. (2017).
The propagation of final state particles through the detectors is simulated by an updated version of geant4 (v10.4) Geant4 Collaboration (2017), which provides the input for the detector response simulation Aurisano et al. (2015). In addition, a custom patch to the new version implements an exact calculation of the density effect correction to the Bethe equation using Sternheimer’s method Sternheimer (1952) as opposed to the approximate parameterization used previously (a 1% or less change to the muon range and energy lost in dead material).
The absolute energy scale for both detectors is calibrated using the minimum ionizing portion of stopping cosmic-ray muon tracks Singh (2019). The calibration procedure is now applied separately to the data in shorter time periods to account for an observed 0.3% decrease in detected light per year.
III Reconstruction and Selection
11footnotetext: The FD sample efficiency, purity, and energy resolution are based on the simulated event samples at the determined best-fit point. Energy resolution is defined as the RMS of the distribution: . Wrong-sign events are treated as background for the CC samples and signal for the CC samples. For the efficiency calculations, the denominator is the number of true signal interactions in the detector with no other selection criteria applied.The first stage of reconstruction is to group hits, which are measurements of deposited energy in a cell above a preset threshold, into single-neutrino-interaction events. This clustering, performed based on hit proximity in time and space, now uses a new method that reduces the rate of mis-clustered hits in the high occupancy environment of the ND Pershey (2018). Mis-clustering had previously led to differences in data-MC selection efficiency, which are now reduced to the sub-percent level. The other reconstruction techniques remain unchanged from the previous analysis Acero et al. (2019).
For each event, initial selections are applied to ensure basic data quality. Additionally, events are required to be sufficiently far from the edges of the detector such that energy is not lost to exiting final-state particles, and so entering background events are not selected as signal. These containment criteria have been re-optimized for this analysis due to changes in the geometry model and hit grouping algorithm, but follow the same outline as described in Ref. Acero et al. (2019).
A convolutional neural network, Aurisano et al. (2016), is used to classify neutrino event candidates into CC, CC, NC, or cosmogenic background. The network is trained using simulated calibrated hits that have been clustered into single neutrino interactions, as well as cosmogenic data. Scores from are used to create two non-overlapping samples of either inclusive CC or CC candidate events. Updates to this algorithm provide improved performance and decreased dependency on calorimetric energy, the dominant source of systematic uncertainty in the results presented here. This is achieved by scaling up or down the energy of all hits while training the CNN. The scale factors used are drawn on an event-by-event basis from a normal distribution with a 1 range from 0.9 - 1.1 Groh (2021). This training procedure reduced the influence of calibration uncertainties on classification decisions to a negligible level.
| Sample bins | Energy res. | Sample purity | |
|---|---|---|---|
| Core, Low | 14.1% (13.7%) | 51% (36%) | |
| Core, High | 9.4% (8.9%) | 79% (69%) | |
| Peripheral | – | 57% (43%) | |
| Combined | 10.7% (8.8%) | 69% (58%) | |
| 1 (lowest ) | 7.8% (8.5%) | 99% (99%) | |
| 2 | 9.2% (8.9%) | 99% (99%) | |
| 3 | 10.4% (9.7%) | 97% (98%) | |
| 4 (highest ) | 11.5% (10.2%) | 92% (95%) | |
| Combined | 9.1% (8.2%) | 96% (98%) | |
Effective rejection of cosmogenic backgrounds at the FD is paramount due to the significant flux of cosmic-ray particles it receives. A new CNN, trained to identify cosmogenic backgrounds has been introduced, is applied in parallel to cosmic-identifying boosted decision trees (BDTs). The BDTs have been trained on samples selected to contain signal-like cosmogenic particles. Together the CNN and BDTs reduce the cosmic contamination in the selected samples to 5%, a total reduction of 6 orders of magnitude, comparable to the previous analysis. For fully contained events, the BDT replaces the previous cosmic rejection method, which directly used reconstructed position and kinematic event information.
Neutrino energy, , is determined using different methods for the and CC candidate events. The energies of CC candidates are parameterized using a quadratic function determined from a 2D fit to the simulated electromagnetic (EM) and hadronic calorimetric energies ( and respectively). The two components produce different detector responses and are separated using a third CNN classifier that identifies EM-like hit clusters within the event with the remaining clusters being classified as hadronic Psihas (2018). For CC candidates, is the sum of the muon energy, determined by the track length, and the total calorimetric energy of the hadronic system, . The muon is identified with a BDT that utilizes track length, multiple Coulomb scattering, and energy deposition, while the hadronic system is taken as all hits not associated with the muon track.
The selection criteria and energy estimation techniques were developed based on ND beam and FD cosmic data, along with simulated samples prior to inspecting the FD beam data distributions. The algorithms were trained separately on neutrino and antineutrino beam modes due to differences in beam purity and interactions.
The sensitivity of the oscillation fit is enhanced by splitting the fully contained and CC, “core”, samples into low and high purity bins, based on the scores output by . At the FD, the selection efficiency for signal events in the core sample is 54% (64%)††footnotemark: . To further increase the efficiency of the FD sample, a “peripheral” selection is included, consisting of events that fail the containment or cosmic rejection requirements but pass more strict selection criteria on the cosmic BDT and . This sample increases the total selection efficiency to 63% (75%)2 but is included only as an integrated rate in the oscillation fits due to possible energy bias caused by particles leaving the detector. Properties of these subsamples are summarized in Table 1.
For CC candidates, the position and amplitude of the oscillation maximum in the FD energy spectra are strongly dependent on and , respectively. To maximize the sensitivity to these parameters, the candidates are divided into four equally populated samples based on the hadronic energy fraction, , which is correlated with energy resolution and background contamination as summarized in Table 1. Sensitivity is further increased by using variably-sized bins for these samples.
IV Near-to-Far Extrapolation
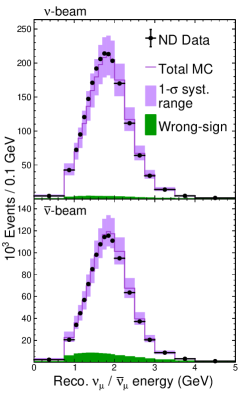
This analysis extracts oscillation parameters using data-driven predictions of the FD spectra largely derived from high statistics measurements in the ND. The disappearance and appearance signal spectra in the FD are predicted using the spectra of CC candidate events in the ND (Fig. 1a). The procedure begins with reweighting the simulation to obtain agreement with the data in each reconstructed bin of the ND CC candidate samples. Predicted rates of NC, CC, and CC interactions in the samples (0.5% total) are taken directly from the simulation and subtracted. The wrong-sign component of the samples (2.9% and 10.5% in the neutrino and antineutrino beams respectively) is also taken directly from the simulation. The resulting corrected CC reconstructed spectra are transformed to true using the simulation. The spectra are then multiplied by the appropriate far-to-near ratios of the simulated samples in bins of true . This step accounts for beam divergence, differences in selection efficiency and acceptance between the two detectors, and the differences in the and cross sections. Oscillation probabilities are applied to yield the predicted disappearance or appearance signal spectra in true at the FD. Matter effects are included in the oscillation probability calculations, with the Earth’s crust density assumed to be uniformly Bassin et al. (2000). Finally, the predicted spectra are converted back to reconstructed .
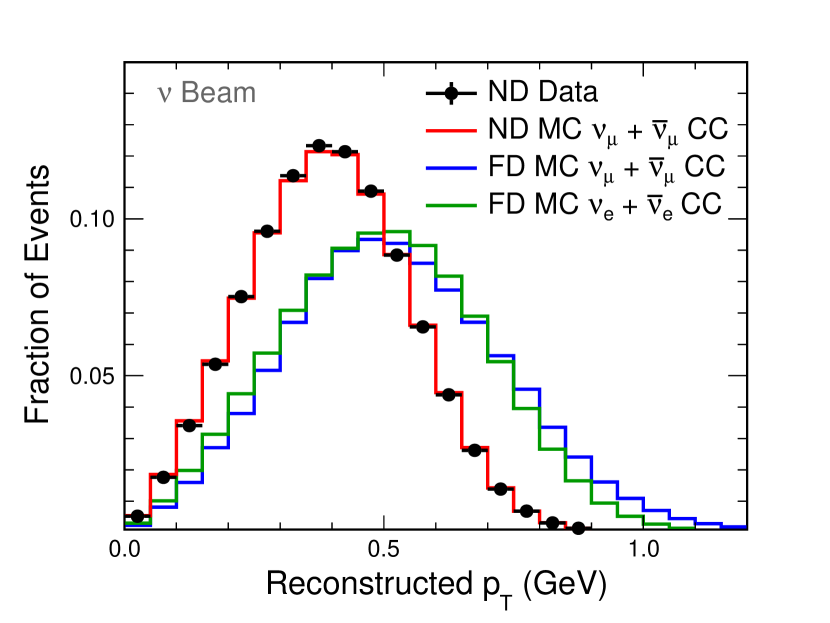
To reduce potential bias and the impact of uncertainties from the neutrino interaction model, the extrapolation to predict the disappearance and appearance signals is performed using variables in addition to . As in the previous analysis, the extrapolations for the disappearance samples are done separately in each reconstructed hadronic energy fraction range (as given in Table 1), enabling neutrino interaction processes that occur in different inelasticity regions to be constrained independently. In this analysis, the extrapolations for both disappearance and appearance samples are additionally performed separately in bins of reconstructed transverse momentum, , of the final state charged lepton. The smaller transverse extent of the ND leads to lower acceptance at higher in the ND than in the FD (Fig. 2), which results in the extrapolated predictions being sensitive to the modeling of the -dependence of the neutrino interactions. Extrapolating in bins of reduces this sensitivity by enabling the ND data to constrain the -dependence. In the ND samples, the bins divide each bin into three equal populations for the extrapolation, and the resulting FD predictions are summed over the bins for the oscillation fit.
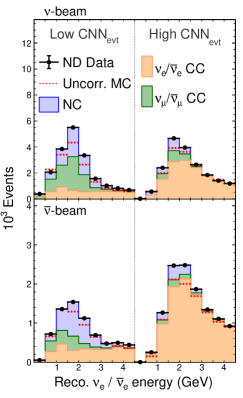
Background spectra at the FD are also predicted using data-driven techniques. Cosmogenic backgrounds in both the appearance and disappearance samples are estimated using FD data collected outside the NuMI beam time window. Beam-induced backgrounds in the appearance samples are primarily CC interactions from the irreducible component of the beam, with contributions from mis-identified NC and CC interactions. The FD spectra for these backgrounds are predicted using the spectra of CC candidate events in the ND (Fig. 1b). Since the relative event rate between the ND and FD is different for the background components, the relative contribution of the different background components in the data needs to be estimated. In neutrino beam-mode these estimates are data-driven Acero et al. (2018); Pershey (2018) while they are taken directly form the simulation in antineutrino beam-mode.
V Systematic Uncertainties
The impacts of systematic uncertainties are evaluated by varying the simulation via event reweighting or simulating alternative event samples and repeating the extrapolation procedure. Uncertainties associated with the neutrino flux, neutron modeling, and detector calibrations are unchanged from the previous analysis Acero et al. (2019).
Detector calibration uncertainties remain dominant and are driven by a 5% uncertainty in the calorimetric energy scale. Additionally, a new time-dependent calibration uncertainty is included to account for any residual differences remaining after performing the calibration over shorter time periods as mentioned previously.
Neutrino interaction model uncertainties are evaluated using the event reweighting framework in genie with additional uncertainties constructed by NOvA as follows. Uncertainties on CCQE RPA, low- RES suppression, 2p2h, and non-resonant and incoherent N production are established for the new model set using methods similar to those in Ref. Acero et al. (2020). Pion FSI uncertainties are based on comparisons to on scattering data Allardyce et al. (1973); Saunders et al. (1996); Meirav et al. (1989); Levenson et al. (1983); Ashery et al. (1981, 1984); Pinzon Guerra et al. (2017) and prior studies using an alternative neutrino interaction generator Pinzon Guerra et al. (2019). Uncertainties on the CC cross section relative to the CC cross section due to radiative corrections and possible second-class currents are unchanged from previous analyses Acero et al. (2018).
As in the previous analysis, uncertainties are included that are detector specific or account for differences between the ND and FD: the detector masses, beam exposures, kinematic acceptances, beam-induced pile-up, CC selection in the ND, and cosmogenic backgrounds in the FD. The improved hit clustering algorithm reduces pile-up effects in the ND, decreasing uncertainties for the associated data-MC selection efficiency differences. An uncertainty for kinematic acceptance differences between the detectors was overestimated in the previous analysis and is subdominant in this analysis after correction. Extrapolating in bins would have substantially reduced the effect of this uncertainty even if left uncorrected.
Uncertainties arising from the custom light model are assigned based on comparison to a more robust response model that was not fully incorporated into the simulation for this analysis. This model is constrained by a sample of ND proton candidates in addition to the muon sample used previously. Differences in the detector response between the proton and muon samples also provide a data-driven uncertainty on the relative production of Cherenkov and scintillation light in the model.
Quantities affected by lepton reconstruction uncertainties include the muon energy scale and lepton angle. The muon energy scale uncertainty now includes a detector mass uncertainty with a component that is uncorrelated between the detectors, plus a correlated component accounting for the Fermi density effect and muon range differences across models. Extrapolating in bins introduces a dependence on the reconstructed lepton angle for which a uncorrelated uncertainty is applied.
Figure 3 shows the impact of the systematic uncertainties on the measurement of , , and as evaluated at the determined best-fit point. The extrapolation method significantly reduces the impact of the detector correlated beam flux and neutrino interaction model uncertainties. In contrast, energy calibration and uncorrelated uncertainties that reflect ND-FD differences are less constrained by extrapolation. Figure 3 also shows the impact of uncertainties for extrapolation with and without bins. Extrapolating in bins reduces the interaction model uncertainty by 10-30%, and the total systematic uncertainty by up to 9%. Detector calibration, detector response, and neutron modeling uncertainties that affect the reconstructed energy of the recoiling hadronic system, which is correlated with , are more modestly reduced. The extrapolation in bins of depends on reconstructed lepton kinematics and results in a marginal increase in the associated uncertainties.
VI Results
The extrapolated predictions of the FD spectra are recomputed for varying oscillation parameters and compared to data using a Poisson negative log-likelihood ratio, . The best-fit parameters minimize . The following solar and reactor neutrino experiment constraints are used: , , and Tanabashi et al. (date). The parameters , , and are varied without constraints while the 64 systematic uncertainties are assigned penalty terms equal to the square of the number of standard deviations by which they vary from their nominal values. The value of is allowed to float similarly. Feldman-Cousins’ unified approach Feldman and Cousins (1998); Sousa et al. (2019) is used to determine the confidence intervals for the oscillation parameters. All significances given, or plotted, are FC-corrected values. The fitted parameters not shown are profiled over.
| Neutrino beam | Antineutrino beam | |||
| CC | CC | CC | CC | |
| 201.1 | 1.7 | 26.0 | 0.2 | |
| 12.6 | 0.0 | 77.2 | 0.2 | |
| 0.1 | 59.0 | 0.0 | 2.3 | |
| 0.0 | 1.0 | 0.0 | 19.2 | |
| Beam | 0.0 | 14.1 | 0.0 | 7.3 |
| NC | 2.6 | 6.3 | 0.8 | 2.2 |
| Cosmic | 5.0 | 3.1 | 0.9 | 1.6 |
| Others | 0.9 | 0.5 | 0.4 | 0.3 |
| Signal | 214.1 | 59.0 | 103.4 | 19.2 |
| Background | 8.2 | 26.8 | 2.1 | 14.0 |
| Best fit | 222.3 | 85.8 | 105.4 | 33.2 |
| Observed | 211 | 82 | 105 | 33 |
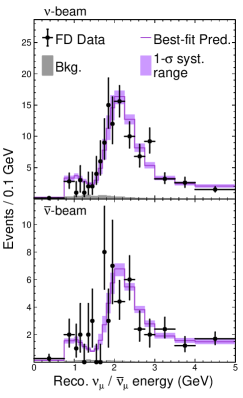
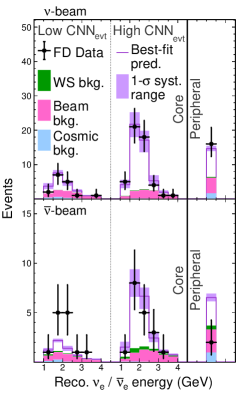
Figure 4 shows the energy spectra of the CC, CC, CC, and CC candidates recorded at the FD. The distributions are compared to the oscillation best-fit expectations. Table 2 summarizes the total event counts and estimated compositions of the selected samples. The CC candidate event samples recorded at the FD include 211 (105) observed events and 82 (33) candidate events. The latter appearance sample has an estimated background of ().
| Parameter | Normal ord. | Inverted ord. | ||
|---|---|---|---|---|
| UO | LO | UO | LO | |
| ) | ||||
| Rejection significance | - | |||
This analysis determines a best-fit in the normal mass ordering and upper octant (significance of 1.0 and 1.2 , respectively), where = 173.55 for 175 degrees of freedom (p-value of 0.705). The data disfavor combinations that lead to a strong asymmetry in the rate of versus appearance; therefore, the inverted mass ordering with is excluded at more than 3 and the normal mass ordering with is disfavored at 2 confidence. However, owing to the degeneracies, the 90% confidence level allowed regions cover all values of given permutations of mass ordering and octant. Thus, the current data do not exhibit a preference concerning CP conservation versus violation. Table 3 shows the best-fit parameter values for each choice of octant and mass ordering.
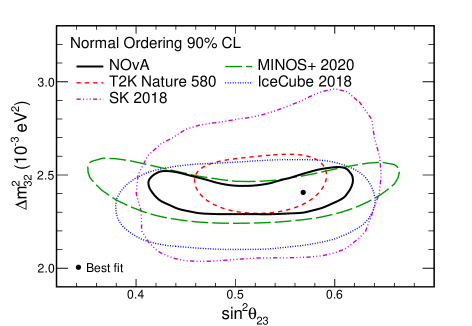
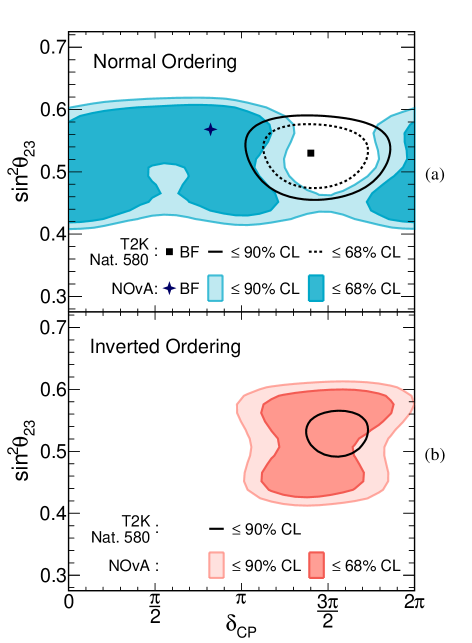
Figure 5 compares the 90% confidence level contours for and with those of other experiments Abe et al. (2020, 2018); Adamson et al. (2020); Aartsen et al. (2018)3. Allowed regions in and are shown in Fig. 6 and are compared with a recent best fit from T2K Abe et al. (2020)222While this paper was in its final internal review, an updated analysis was published by the T2K collaboration Abe et al. (2021). Compared to Ref. Abe et al. (2020), the dataset remains unchanged and the same approach is used. The conclusions drawn from the comparisons of the contours remains unchanged..
As shown in Fig. 6a, the T2K best-fit point is in the NO but lies in a region that NOvA disfavors. However, some regions of overlap remain. Figure 6b shows that for IO, the T2K allowed region at 90% confidence level is entirely contained within the corresponding NOvA allowed region. This outcome reflects in part the circumstance that T2K observes a relatively more pronounced asymmetry in versus oscillations.
Although each experiment reports a mild preference for NO, it has been suggested that a joint fit of the two experiments might converge on an IO solution Kelly et al. (2021). Some authors have also explored the possibility that the differences in the and rates seen by the experiments are explained by additional non-standard matter effects Denton et al. (2021); Chatterjee and Palazzo (2021).
In conclusion, we have presented improved measurements of oscillation parameters , , and , including an expanded data set and enhanced analysis techniques with respect to previous publications. These measurements continue to favor the normal mass ordering and upper octant of , as well as values of the oscillation parameters that do not lead to a large asymmetry in and oscillation rates.
VII Acknowledgments
This document was prepared by the NOvA collaboration using the resources of the Fermi National Accelerator Laboratory (Fermilab), a U.S. Department of Energy, Office of Science, HEP User Facility. Fermilab is managed by Fermi Research Alliance, LLC (FRA), acting under Contract No. DE-AC02-07CH11359. This work was supported by the U.S. Department of Energy; the U.S. National Science Foundation; the Department of Science and Technology, India; the European Research Council; the MSMT CR, GA UK, Czech Republic; the RAS, RFBR, RMES, RSF, and BASIS Foundation, Russia; CNPq and FAPEG, Brazil; STFC, UKRI, and the Royal Society, United Kingdom; and the State and University of Minnesota. We are grateful for the contributions of the staffs of the University of Minnesota at the Ash River Laboratory and of Fermilab.
References
- Acero et al. (2019) M. A. Acero et al. (NOvA), First Measurement of Neutrino Oscillation Parameters using Neutrinos and Antineutrinos by NOvA, Phys. Rev. Lett. 123, 151803 (2019), arXiv:1906.04907 [hep-ex] .
- Fukuda et al. (1998) Y. Fukuda et al. (Super-Kamiokande), Evidence for oscillation of atmospheric neutrinos, Phys. Rev. Lett. 81, 1562 (1998), arXiv:hep-ex/9807003 [hep-ex] .
- Fukuda et al. (2002) S. Fukuda et al. (Super-Kamiokande), Determination of solar neutrino oscillation parameters using 1496 days of Super-Kamiokande I data, Phys. Lett. B 539, 179 (2002), arXiv:hep-ex/0205075 [hep-ex] .
- Ahmad et al. (2002) Q. R. Ahmad et al. (SNO), Direct evidence for neutrino flavor transformation from neutral current interactions in the Sudbury Neutrino Observatory, Phys. Rev. Lett. 89, 011301 (2002), arXiv:nucl-ex/0204008 [nucl-ex] .
- Eguchi et al. (2003) K. Eguchi et al. (KamLAND), First results from KamLAND: Evidence for reactor anti-neutrino disappearance, Phys. Rev. Lett. 90, 021802 (2003), arXiv:hep-ex/0212021 [hep-ex] .
- Michael et al. (2006) D. G. Michael et al. (MINOS), Observation of muon neutrino disappearance with the MINOS detectors and the NuMI neutrino beam, Phys. Rev. Lett. 97, 191801 (2006), arXiv:hep-ex/0607088 [hep-ex] .
- Abe et al. (2011) K. Abe et al. (T2K), Indication of Electron Neutrino Appearance from an Accelerator-produced Off-axis Muon Neutrino Beam, Phys. Rev. Lett. 107, 041801 (2011), arXiv:1106.2822 [hep-ex] .
- Abe et al. (2012) Y. Abe et al. (Double Chooz), Indication of Reactor Disappearance in the Double Chooz Experiment, Phys. Rev. Lett. 108, 131801 (2012), arXiv:1112.6353 [hep-ex] .
- An et al. (2012) F. P. An et al. (Daya Bay), Observation of electron-antineutrino disappearance at Daya Bay, Phys. Rev. Lett. 108, 171803 (2012), arXiv:1203.1669 [hep-ex] .
- Ahn et al. (2012) J. K. Ahn et al. (RENO), Observation of Reactor Electron Antineutrino Disappearance in the RENO Experiment, Phys. Rev. Lett. 108, 191802 (2012), arXiv:1204.0626 [hep-ex] .
- Mohapatra and Smirnov (2006) R. N. Mohapatra and A. Y. Smirnov, Neutrino Mass and New Physics, Elementary particle physics. Proceedings, Corfu Summer Institute, CORFU2005, Corfu, Greece, September 4-26, 2005, Ann. Rev. Nucl. Part. Sci. 56, 569 (2006), arXiv:hep-ph/0603118 [hep-ph] .
- Nunokawa et al. (2008) H. Nunokawa, S. J. Parke, and J. W. F. Valle, CP Violation and Neutrino Oscillations, Prog. Part. Nucl. Phys. 60, 338 (2008), arXiv:0710.0554 [hep-ph] .
- Altarelli and Feruglio (2010) G. Altarelli and F. Feruglio, Discrete Flavor Symmetries and Models of Neutrino Mixing, Rev. Mod. Phys. 82, 2701 (2010), arXiv:1002.0211 [hep-ph] .
- King (2015) S. F. King, Models of Neutrino Mass, Mixing and CP Violation, J. Phys. G 42, 123001 (2015), arXiv:1510.02091 [hep-ph] .
- Petcov (2018) S. T. Petcov, Discrete Flavour Symmetries, Neutrino Mixing and Leptonic CP Violation, Eur. Phys. J. C 78, 709 (2018), arXiv:1711.10806 [hep-ph] .
- Pascoli and Petcov (2002) S. Pascoli and S. T. Petcov, The SNO solar neutrino data, neutrinoless double beta decay and neutrino mass spectrum, Phys. Lett. B 544, 239 (2002), arXiv:hep-ph/0205022 [hep-ph] .
- Bahcall et al. (2004) J. N. Bahcall, H. Murayama, and C. Pena-Garay, What can we learn from neutrinoless double beta decay experiments?, Phys. Rev. D 70, 033012 (2004), arXiv:hep-ph/0403167 [hep-ph] .
- Wolfenstein (1978) L. Wolfenstein, Neutrino Oscillations in Matter, Phys. Rev. D 17, 2369 (1978).
- Fukugita and Yanagida (1986) M. Fukugita and T. Yanagida, Baryogenesis Without Grand Unification, Phys. Lett. B 174, 45 (1986).
- Buchmuller and Plumacher (1996) W. Buchmuller and M. Plumacher, Baryon asymmetry and neutrino mixing, Phys. Lett. B 389, 73 (1996), arXiv:hep-ph/9608308 .
- Buchmuller et al. (2005a) W. Buchmuller, P. Di Bari, and M. Plumacher, Leptogenesis for pedestrians, Annals Phys. 315, 305 (2005a), arXiv:hep-ph/0401240 .
- Buchmuller et al. (2005b) W. Buchmuller, R. D. Peccei, and T. Yanagida, Leptogenesis as the origin of matter, Ann. Rev. Nucl. Part. Sci. 55, 311 (2005b), arXiv:hep-ph/0502169 .
- Pilaftsis (1997) A. Pilaftsis, CP violation and baryogenesis due to heavy Majorana neutrinos, Phys. Rev. D 56, 5431 (1997), arXiv:hep-ph/9707235 .
- Harrison and Scott (2002) P. F. Harrison and W. G. Scott, mu - tau reflection symmetry in lepton mixing and neutrino oscillations, Phys. Lett. B 547, 219 (2002), arXiv:hep-ph/0210197 .
- Ayres et al. (2007) D. S. Ayres et al. (NOvA), The NOvA Technical Design Report (2007).
- Adamson et al. (2016) P. Adamson et al., The NuMI Neutrino Beam, Nucl. Instrum. Meth. A 806, 279 (2016), arXiv:1507.06690 [physics.acc-ph] .
- Mufson et al. (2015) S. Mufson et al., Liquid scintillator production for the NOvA experiment, Nucl. Instrum. Meth. A 799, 1 (2015), arXiv:1504.04035 [physics.ins-det] .
- Agostinelli et al. (2003) S. Agostinelli et al. (GEANT4), GEANT4–a simulation toolkit, Nucl. Instrum. Meth. A 506, 250 (2003).
- Aliaga et al. (2016) L. Aliaga et al. (MINERvA), Neutrino Flux Predictions for the NuMI Beam, Phys. Rev. D 94, 092005 (2016), [Addendum: Phys. Rev.D95,no.3,039903(2017)], arXiv:1607.00704 [hep-ex] .
- Paley et al. (2014) J. M. Paley et al. (MIPP), Measurement of Charged Pion Production Yields off the NuMI Target, Phys. Rev. D 90, 032001 (2014), arXiv:1404.5882 [hep-ex] .
- Alt et al. (2007) C. Alt et al. (NA49), Inclusive production of charged pions in p+C collisions at 158-GeV/c beam momentum, Eur. Phys. J. C 49, 897 (2007), arXiv:hep-ex/0606028 [hep-ex] .
- Abgrall et al. (2011) N. Abgrall et al. (NA61/SHINE), Measurements of Cross Sections and Charged Pion Spectra in Proton-Carbon Interactions at 31 GeV/c, Phys. Rev. C 84, 034604 (2011), arXiv:1102.0983 [hep-ex] .
- Barton et al. (1983) D. S. Barton et al., Experimental Study of the a-Dependence of Inclusive Hadron Fragmentation, Phys. Rev. D 27, 2580 (1983).
- Seun (2007) S. M. Seun, Measurement of ratios from the NuMI target, Ph.D. thesis, Harvard U. (2007).
- Tinti (2010) G. M. Tinti, Sterile neutrino oscillations in MINOS and hadron production in pC collisions, Ph.D. thesis, Oxford U. (2010).
- Lebedev (2007) A. V. Lebedev, Ratio of pion kaon production in proton carbon interactions, Ph.D. thesis, Harvard U. (2007).
- Baatar et al. (2013) B. Baatar et al. (NA49), Inclusive production of protons, anti-protons, neutrons, deuterons and tritons in p+C collisions at 158 GeV/c beam momentum, Eur. Phys. J. C 73, 2364 (2013), arXiv:1207.6520 [hep-ex] .
- Skubic et al. (1978) P. Skubic et al., Neutral Strange Particle Production by 300-GeV Protons, Phys. Rev. D 18, 3115 (1978).
- Denisov et al. (1973) S. P. Denisov, S. V. Donskov, Yu. P. Gorin, R. N. Krasnokutsky, A. I. Petrukhin, Yu. D. Prokoshkin, and D. A. Stoyanova, Absorption cross-sections for pions, kaons, protons and anti-protons on complex nuclei in the 6-GeV/c to 60-GeV/c momentum range, Nucl. Phys. B 61, 62 (1973).
- Carroll et al. (1979) A. S. Carroll et al., Absorption Cross-Sections of , , p and on Nuclei Between 60 GeV/c and 280 GeV/c, Phys. Lett. B 80, 319 (1979).
- Abe et al. (2013) K. Abe et al. (T2K), T2K neutrino flux prediction, Phys. Rev. D 87, 012001 (2013), [Addendum: Phys. Rev.D87,no.1,019902(2013)], arXiv:1211.0469 [hep-ex] .
- Gaisser et al. (1975) T. K. Gaisser, G. B. Yodh, V. D. Barger, and F. Halzen, On the Relation Between Proton Proton and Proton-Nucleus Cross-Sections at Very High-Energies, in Proceedings of the 14th International Cosmic Ray Converence, Vol. 7 (1975) pp. 2161–2166.
- Cronin et al. (1957) J. W. Cronin, R. Cool, and A. Abashian, Cross Sections of Nuclei for High-Energy Pions, Phys. Rev. 107, 1121 (1957).
- Allaby et al. (1969) J. V. Allaby et al. (IHEP-CERN), Total cross-sections of pi-minus, k-minus, and anti-p on protons and deuterons in the momentum range 20-65 gev/c, Phys. Lett. 30B, 500 (1969).
- Longo and Moyer (1962) M. J. Longo and B. J. Moyer, Nucleon and Nuclear Cross Sections for Positive Pions and Protons above 1.4 Bev/c, Phys. Rev. 125, 701 (1962).
- Bobchenko et al. (1979) B. M. Bobchenko et al., Measurement of total inelastic cross-sections from proton interactions with Nuclei in the momentum range from 5 GeV/c to 9 GeV/c and pi mesons from with nuclei in the momentum range from 1.75 GeV/c to 6.5 GeV/c, Sov. J. Nucl. Phys. 30, 805 (1979), [Yad. Fiz.30,1553(1979)].
- Fedorov et al. (1978) V. B. Fedorov, Yu. G. Grishuk, M. V. Kosov, G. A. Leksin, N. A. Pivnyuk, S. V. Shevchenko, V. L. Stolin, A. V. Vlasov, and L. S. Vorobev, Total Inelastic Cross-Sections for pi Mesons on Nuclei in the 2-GeV/c to 6-GeV/c Momentum Range, Sov. J. Nucl. Phys. 27, 222 (1978), [Yad. Fiz.27,413(1978)].
- Abrams et al. (1970) R. J. Abrams, R. L. Cool, G. Giacomelli, T. F. Kycia, B. A. Leontic, K. K. Li, and D. N. Michael, Total cross-sections of K+- mesons and anti-protons on nucleons up to 3.3-GeV/c, Phys. Rev. D 1, 1917 (1970).
- Andreopoulos et al. (2010) C. Andreopoulos et al., The GENIE Neutrino Monte Carlo Generator, Nucl. Instrum. Meth. A 614, 87 (2010), arXiv:0905.2517 [hep-ph] .
- Andreopoulos et al. (2015) C. Andreopoulos, C. Barry, S. Dytman, H. Gallagher, T. Golan, R. Hatcher, G. Perdue, and J. Yarba, The GENIE Neutrino Monte Carlo Generator: Physics and User Manual (2015), arXiv:1510.05494 [hep-ph] .
- Tena-Vidal et al. (2021) J. Tena-Vidal et al. (GENIE), Neutrino-Nucleon Cross-Section Model Tuning in GENIE v3, arXiv:2104.09179 [hep-ph] (2021), FERMILAB-PUB-20-531-SCD-T.
- Tena-Vidal (2018) J. Tena-Vidal, Tuning the pion production with GENIE version 3, NuInt18, 12th International Workshop on Neutrino-Nucleus Interactions in the Few GeV Region (2018).
- Nieves et al. (2004) J. Nieves, J. E. Amaro, and M. Valverde, Inclusive quasi-elastic neutrino reactions, Phys. Rev. C 70, 055503 (2004), [Erratum: Phys. Rev.C72,019902(2005)], arXiv:nucl-th/0408005 [nucl-th] .
- Martini et al. (2009) M. Martini, M. Ericson, G. Chanfray, and J. Marteau, A Unified approach for nucleon knock-out, coherent and incoherent pion production in neutrino interactions with nuclei, Phys. Rev. C 80, 065501 (2009), arXiv:0910.2622 [nucl-th] .
- Pandey et al. (2015) V. Pandey, N. Jachowicz, T. Van Cuyck, J. Ryckebusch, and M. Martini, Low-energy excitations and quasielastic contribution to electron-nucleus and neutrino-nucleus scattering in the continuum random-phase approximation, Phys. Rev. C 92, 024606 (2015), arXiv:1412.4624 [nucl-th] .
- Meyer et al. (2016) A. S. Meyer, M. Betancourt, R. Gran, and R. J. Hill, Deuterium target data for precision neutrino-nucleus cross sections, Phys. Rev. D 93, 113015 (2016), arXiv:1603.03048 [hep-ph] .
- Nieves et al. (2011) J. Nieves, I. Ruiz Simo, and M. J. Vicente Vacas, Inclusive Charged–Current Neutrino–Nucleus Reactions, Phys. Rev. C 83, 045501 (2011), arXiv:1102.2777 [hep-ph] .
- Gran et al. (2013) R. Gran, J. Nieves, F. Sanchez, and M. J. Vicente Vacas, Neutrino-nucleus quasi-elastic and 2p2h interactions up to 10 GeV, Phys. Rev. D 88, 113007 (2013), arXiv:1307.8105 [hep-ph] .
- Berger and Sehgal (2007) C. Berger and L. M. Sehgal, Lepton mass effects in single pion production by neutrinos, Phys. Rev. D 76, 113004 (2007), arXiv:0709.4378 [hep-ph] .
- Berger and Sehgal (2009) C. Berger and L. M. Sehgal, PCAC and coherent pion production by low energy neutrinos, Phys. Rev. D 79, 053003 (2009), arXiv:0812.2653 [hep-ph] .
- Bodek and Yang (2003) A. Bodek and U. K. Yang, Higher twist, xi(omega) scaling, and effective LO PDFs for lepton scattering in the few GeV region, Neutrino factories. Proceedings, 4th International Workshop, NuFact’02, London, UK, July 1-6, 2002, J. Phys. G 29, 1899 (2003), arXiv:hep-ex/0210024 [hep-ex] .
- Yang et al. (2009) T. Yang, C. Andreopoulos, H. Gallagher, K. Hoffmann, and P. Kehayias, A Hadronization Model for Few-GeV Neutrino Interactions, Eur. Phys. J. C 63, 1 (2009), arXiv:0904.4043 [hep-ph] .
- Sjostrand et al. (2006) T. Sjostrand, S. Mrenna, and P. Z. Skands, PYTHIA 6.4 Physics and Manual, JHEP 05, 26, arXiv:hep-ph/0603175 [hep-ph] .
- Salcedo et al. (1988) L. L. Salcedo, E. Oset, M. J. Vicente-Vacas, and C. Garcia-Recio, Computer Simulation of Inclusive Pion Nuclear Reactions, Nucl. Phys. A 484, 557 (1988).
- Gran et al. (2018) R. Gran et al. (MINERvA), Antineutrino Charged-Current Reactions on Hydrocarbon with Low Momentum Transfer, Phys. Rev. Lett. 120, 221805 (2018), arXiv:1803.09377 [hep-ex] .
- Allardyce et al. (1973) B. W. Allardyce et al., Pion reaction cross-sections and nuclear sizes, Nucl. Phys. A 209, 1 (1973).
- Saunders et al. (1996) A. Saunders, S. Hoeibraten, J. J. Kraushaar, B. J. Kriss, R. J. Peterson, R. A. Ristinen, J. T. Brack, G. Hofman, E. F. Gibson, and C. L. Morris, Reaction and total cross-sections for low-energy pi+ and pi- on isospin zero nuclei, Phys. Rev. C 53, 1745 (1996).
- Meirav et al. (1989) O. Meirav, E. Friedman, R. R. Johnson, R. Olszewski, and P. Weber, Low-energy Pion - Nucleus Potentials From Differential and Integral Data, Phys. Rev. C 40, 843 (1989).
- Levenson et al. (1983) S. M. Levenson et al., Inclusive pion scattering in the delta (1232) region, Phys. Rev. C 28, 326 (1983).
- Ashery et al. (1981) D. Ashery, I. Navon, G. Azuelos, H. K. Walter, H. J. Pfeiffer, and F. W. Schleputz, True Absorption and Scattering of Pions on Nuclei, Phys. Rev. C 23, 2173 (1981).
- Ashery et al. (1984) D. Ashery et al., Inclusive pion single charge exchange reactions, Phys. Rev. C 30, 946 (1984).
- Pinzon Guerra et al. (2017) E. S. Pinzon Guerra et al. (DUET), Measurement of and of on carbon by the Dual Use Experiment at TRIUMF (DUET), Phys. Rev. C 95, 045203 (2017), arXiv:1611.05612 [hep-ex] .
- Geant4 Collaboration (2017) Geant4 Collaboration, Geant4 10.4 release notes, geant4-data.web.cern.ch, https://geant4-data.web.cern.ch/ ReleaseNotes/ReleaseNotes4.10.4.html (2017).
- Aurisano et al. (2015) A. Aurisano, C. Backhouse, R. Hatcher, N. Mayer, J. Musser, R. Patterson, R. Schroeter, and A. Sousa (NOvA), The NOvA simulation chain, Proceedings, 21st International Conference on Computing in High Energy and Nuclear Physics (CHEP 2015): Okinawa, Japan, April 13-17, 2015, J. Phys. Conf. Ser. 664, 072002 (2015).
- Sternheimer (1952) R. M. Sternheimer, The Density Effect for Ionization Loss in Materials, Phys. Rev. 88, 851 (1952).
- Singh (2019) P. Singh, Extraction of Neutrino Oscillation Parameters using a Simultaneous Fit of Disappearance and Appearance data with the NOvA Experiment, Ph.D. thesis, Delhi U. (2019).
- Pershey (2018) D. S. Pershey, A Measurement of Appearance and Disappearance Neutrino Oscillations with the NOvA Experiment, Ph.D. thesis, Caltech (2018).
- Aurisano et al. (2016) A. Aurisano, A. Radovic, D. Rocco, A. Himmel, M. D. Messier, E. Niner, G. Pawloski, F. Psihas, A. Sousa, and P. Vahle, A Convolutional Neural Network Neutrino Event Classifier, JINST 11 (09), P09001, arXiv:1604.01444 [hep-ex] .
- Groh (2021) M. Groh, Constraints on Neutrino Oscillation Parameters from Neutrinos and Antineutrinos with Machine Learning, Ph.D. thesis, Indiana U., Bloomington (main) (2021).
- Psihas (2018) F. Psihas, Measurement of Long Baseline Neutrino Oscillations and Improvements from Deep Learning, Ph.D. thesis, Indiana U. (2018).
- Bassin et al. (2000) C. Bassin, G. Laske, and G. Masters, The current limits of resolution for surface wave tomography in north america, EOS Trans AGU 81, F897 (2000).
- sup (2021a) See Supplemental Material at [[To be inserted by publisher] for the muon neutrino distributions in each quartile of hadronic energy fraction (2021a).
- Acero et al. (2018) M. A. Acero et al. (NOvA), New constraints on oscillation parameters from appearance and disappearance in the NOvA experiment, Phys. Rev. D 98, 032012 (2018), arXiv:1806.00096 [hep-ex] .
- Acero et al. (2020) M. A. Acero et al. (NOvA), Adjusting neutrino interaction models and evaluating uncertainties using NOvA near detector data, Eur. Phys. J. C 80, 1119 (2020), arXiv:2006.08727 [hep-ex] .
- Pinzon Guerra et al. (2019) E. S. Pinzon Guerra et al., Using world charged nucleus scattering data to constrain an intranuclear cascade model, Phys. Rev. D 99, 052007 (2019), arXiv:1812.06912 [hep-ex] .
- Tanabashi et al. (date) M. Tanabashi et al. (Particle Data Group), Review of particle physics, Phys. Rev. D 98, 030001 (2018 and the 2019 update).
- Feldman and Cousins (1998) G. J. Feldman and R. D. Cousins, A Unified approach to the classical statistical analysis of small signals, Phys. Rev. D 57, 3873 (1998), arXiv:physics/9711021 [physics.data-an] .
- Sousa et al. (2019) A. Sousa, N. Buchanan, S. Calvez, P. Ding, D. Doyle, A. Himmel, B. Holzman, J. Kowalkowski, A. Norman, and T. Peterka, Implementation of Feldman-Cousins Corrections and Oscillation Calculations in the HPC Environment for the NOvA Experiment, EPJ Web Conf. 214, 05012 (2019).
- sup (2021b) See Supplemental Material at [to be inserted by publisher] for the uncertainties on all choices of the mass ordering (Normal or Inverted) and upper or lower octant (UO, LO) (2021b).
- sup (2021c) See Supplemental Material at [to be inserted by publisher] for the profiles of these surfaces on the and axes as well as the surfaces computed for the inverted hierarchy case (2021c).
- Abe et al. (2020) K. Abe et al. (T2K), Constraint on the matter–antimatter symmetry-violating phase in neutrino oscillations, Nature 580, 339 (2020), [Erratum: Nature 583, E16 (2020)], arXiv:1910.03887 [hep-ex] .
- Abe et al. (2018) K. Abe et al. (Super-Kamiokande), Atmospheric neutrino oscillation analysis with external constraints in Super-Kamiokande I-IV, Phys. Rev. D 97, 072001 (2018), arXiv:1710.09126 [hep-ex] .
- Adamson et al. (2020) P. Adamson et al. (MINOS+), Precision Constraints for Three-Flavor Neutrino Oscillations from the Full MINOS+ and MINOS Dataset, Phys. Rev. Lett. 125, 131802 (2020), arXiv:2006.15208 [hep-ex] .
- Aartsen et al. (2018) M. G. Aartsen et al. (IceCube), Measurement of Atmospheric Neutrino Oscillations at 6–56 GeV with IceCube DeepCore, Phys. Rev. Lett. 120, 071801 (2018), arXiv:1707.07081 [hep-ex] .
- sup (2021d) See Supplemental Material at [To be inserted by publisher] for profiles of these surfaces on the axis (2021d).
- Abe et al. (2021) K. Abe et al. (T2K), Improved constraints on neutrino mixing from the T2K experiment with protons on target, Phys. Rev. D 103, 112008 (2021), arXiv:2101.03779 [hep-ex] .
- Kelly et al. (2021) K. J. Kelly, P. A. Machado, S. J. Parke, Y. F. Perez Gonzalez, and R. Zukanovich-Funchal, Back to (Mass-)Square(d) One: The Neutrino Mass Ordering in Light of Recent Data, Phys. Rev. D 103, 013004 (2021), arXiv:2007.08526 [hep-ph] .
- Denton et al. (2021) P. B. Denton, J. Gehrlein, and R. Pestes, -Violating Neutrino Nonstandard Interactions in Long-Baseline-Accelerator Data, Phys. Rev. Lett. 126, 051801 (2021), arXiv:2008.01110 [hep-ph] .
- Chatterjee and Palazzo (2021) S. S. Chatterjee and A. Palazzo, Non-standard neutrino interactions as a solution to the NOA and T2K discrepancy, Phys. Rev. Lett. 126, 051802 (2021), arXiv:2008.04161 [hep-ph] .