Why North Korean Refugees are Reluctant to Compete: The Roles of Cognitive Ability††thanks: We would like to thank Il Myoung Hwang, an associate editor and four anonymous referees for very helpful comments as well as Philip Jang for his excellent research assistance. The research reported in this paper was approved on 3 June 2015 by the Institutional Review Board of Seoul National University (IRB No. 1506/002-001). This work was supported in part by the National Research Foundation of Korea Grant funded by the Korean Government (NRF-2013S1A5A2A03044461), by Creative-Pioneering Researchers Program through Seoul National University, by the European Research Council (ERC-2014-CoG- 646917-ROMIA) and by the UK Economic and Social Research Council (ESRC) through research grant (ES/P008909/1) to the CeMMAP.
Abstract
The study compares the competitiveness of three Korean groups raised in different institutional environments: South Korea, North Korea, and China. Laboratory experiments reveal that North Korean refugees are less likely to participate in competitive tournaments than South Koreans and Korean-Chinese immigrants. Analysis using a choice model with probability weighting suggests that lower cognitive ability may lead to lower expected performance, more pessimistic beliefs, and greater aversion to competition.
JEL Classification: C92, P20.
Keywords: Piece Rate; Tournament; North Korea; Institution; Laboratory Experiment.
1 Introduction
Competitiveness, defined as the willingness to engage in competitions, is an important trait for success in a capitalist society. It can be heterogeneous across different individuals because they grew up in different environments and/or because they have different individual characteristics that could also be affected by where they grew up. In this paper, we ask the following questions:
-
•
Would growing up within distinct environments affect competitiveness?
-
•
If it is such a case, what is a factor that leads to such a difference?
Answering these questions generates two critical challenges. First, it is difficult to find comparable groups of people who were exposed to different environments. This is due to the fact that people with different backgrounds are also different in many other regards. Second, we need to define and measure competitiveness quantitatively.
In our study, we attempt to overcome the first challenge by comparing three Korean groups in South Korea, born and raised in three countries with distinct environments: South Korea, North Korea, and China. These three groups are ethnically identical, possess the same historical origin, use a common language, and currently live in South Korea. However, their origin countries are starkly different. South Korea is the country based on a market economy and democracy, while North Korea is based on a centrally planned economy and dictatorship. China is politically a one-party communist country but economically based on a market economy.
To address the second challenge of measuring competitiveness as a distinct trait, we adapt the design of Niederle and Vesterlund (2007), further used by Bartling, Fehr, Marechal, and Schunk (2009) and Dohmen and Falk (2011) among others, with the addition of a random bonus. The random bonus is a novel feature in our experimental design. Because there are likely to be non-negligible differences in performance among the three Korean groups, we introduce an exogenous individual-level variation via a random bonus that helps low performers select into the tournament. The purposes of the random bonus are two-fold: (i) it enlarges the support of the performance distribution especially for North Korean subjects,555We found a substantial score gap in the Raven test between North Korean and South Korean subjects in our previous work (Choi, Kim, Lee, and Lee, 2020)., and (ii) it helps us to disentangle channels through which competitiveness is varied across individuals.
To explore the mechanisms in which different factors translate into competitiveness, we measure standard determinants for entry to the tournament: namely, subjective winning probability, risk aversion, and cognitive ability. First, upon completing the three rounds of the real-effort experiment, we elicit subjects’ beliefs of winning probability under the tournament. The method of belief elicitation is based on the binarized socring rule of Hossain and Okui (2013). Next, we elicit subjects’ risk preferences using the multiple price list design of Holt and Laury (2002). Then, we measure the cognitive skills of subjects using an abbreviated version of the Raven’s Progressive Matrices Test.666In economics, Raven test scores have been previous used in, for example, Burks, Carpenter, Goette, and Rustichini (2009), Charness, Rustichini, and van de Ven (2011) and Gill and Prowse (2016) among others. The three subject groups in our experiments have substantially different life experiences and received completely different schooling. In view of that, the Raven test is appropriate for our study because it is a classical and leading test of analytic intelligence.777In psychology, analytic intelligence is referred as “the ability to reason and solve problems involving new information without relying extensively on an explicit base of declarative knowledge derived from either schooling or previous experience” (Carpenter, Just, and Shell, 1990; Nisbett, Aronson, Blair, Dickens, Flynn, Halpern, and Turkheimer, 2012).
In summary, we find that North Korean refugees are significantly less likely to select into the tournament scheme. The unconditional probability of North Korean subjects’ selecting into tournament is about 20 percentage points lower than that for South Korean natives. The gap remains substantial (about 10 percentage points) even after controlling for the degree of risk aversion and their task performance measured prior to the choice of compensation scheme. Similarly, we find that North Koreans hold a significantly lower expectation of winning the competition. On the contrary, it turns out that Korean-Chinese immigrants are not significantly different from South Korean natives in terms of selection into the tournament as well as subjective expectation about winning the competition. Remarkably, we find that the South-North Korean gap becomes statistically and economically insignificant once we control for the cognitive ability measured by the Raven test. In fact, it turns out that once the Raven test is controlled for, North Korean refugees are more competitive than South Korean natives in terms of point estimates.
We do not find any kind of experience in North Korea, such as educational attainment in North Korea or the Communist party membership which is proxy for a socioeconomic status in North Korea, to have any significant effect on competitiveness. Following the recent discussions in the literature about what drives the variations of willingness to compete (Gillen, Snowberg, and Yariv, 2019; Van Veldhuizen, 2022), we analyze how cognitive ability is associated with distinct components shaping competitiveness including performance, subject beliefs about winning competition and aversion to competition, through the lens of a choice model with probability weighting. We instrument subjective winning probability with the random bonus to deal with measurement errors. Our results suggest that lower cognitive ability may be associated with lower levels of expected performance, more pessimistic subject beliefs and greater aversion to competition.
Our findings call for possible explanations but it is challenging to provide definite answers. First, South Korean natives, North Korean refugees and Korean-Chinese immigrants should differ along important observed and unobserved dimensions other than their institutional backgrounds. Therefore, it is difficult to causally attribute any inter-Korean differences in competitiveness solely to the differences in their institutional experiences. Second, North Korean refugees are a selected sample of the North Korean population, thereby implying that our sample is unlikely to be a representative sample of North Koreans living in North Korea. Therefore, we cannot exclude an alternative explanation that the lack of competitiveness and the lower cognitive ability of North Korean refugees are driven by negative selection. In view of this concern, we do not intend to reach a decisive conclusion about North Koreans in general.888See our previous work (Kim, Choi, Lee, Lee, and Choi, 2017) for details on comparison between North Korean refugees and the North Korean population. Third, a potential explanation for the reduced inclination of North Korean refugees to participate in tournaments could be rooted in their inherent mistrust of both authorities and fellow citizens within South Korea. For example, they might have concerns about the integrity of the tournaments, with suspicions that those conducting the experiments might manipulate the rules. We cannot rule out this possibility. Fourth, we only identify the total effects of the environmental differences due to the division of Korea. Specifically, we cannot differentiate the effect of communism from the impact of dictatorship because North Korean regime is a mix of the two. Furthermore, we cannot quantify the impacts of poverty, malnutrition, and education quality as potential explanations. These concerns limit our ability to pinpoint the exact mechanisms underlying our findings. However, we believe this paper adds a unique case study to the literature. North Korea is unique in that the current regime has lasted more than 70 years, keeping its citizens totally isolated from the rest of the world. In view of this, our findings are not directly comparable to those in the literature. We postpone discussion of the literature to Section 6.
The remainder of the paper proceeds as follows. In Section 2, we briefly review distinct characteristics of three groups of Koreans. In Section 3, we describe the sampling and experimental design of our study. In Section 4, we firstly provide the summary statistics of baseline variables and Raven test scores across the three groups and then present experimental results. In Section 5, we develop a choice model between the piece-rate and tournament schemes and examine different channels through which the Raven score can matter for selection into competition. In Section 6, we relate our study to several stands of the literature. Section 7 concludes. Online appendix includes detailed experimental instructions in Korean and English.
2 Background
In our study, we compare native-born South Koreans with two groups of immigrants living in South Korea: North Korean refugees and Korean Chinese. These two groups are similar to native-born Koreans in their shared language and long-lasting cultural intersections. In this section, we review their distinct characteristics.
North Korean Refugees One critical contrast between South and North Koreans may amount to differences in institutions, that is, capitalism and democracy in the South and communism and dictatorship in the North, which were exogenously installed in the late 1940s and intensified after the end of the Korean War (Acemoglu, Johnson, and Robinson, 2005; Kim, Choi, Lee, Lee, and Choi, 2017).
Socialist institutions, based on state ownership of productive assets and cooperation-oriented ideology, are believed to repress competition. The theorists powering these institutions viewed capitalist competition as a cause of anarchy and self-destruction (Marx, 1993; Hilferding, 1910). This ideology suggests a hypothesis claiming that North Korean refugees are less competitive than South Koreans because of little exposure to a market economy and anti-competition ideology. However, some scholars claim that communism succeeded in harnessing competition by using shock-worker movement, speed battles, and races in achieving production targets (Prokhorov, 1981). In principle, it is difficult to accept that communism, an egalitarian society, had competitive elements. However, from the beginning of communism, it was found that harnessing competition was indispensable for economic growth. Socialism responded this dilemma by asserting that communist competition is different from capitalist one. The former is motivated by unselfish commitment to building communism and the latter by the pursuit of own self-interest. As mentioned in Introduction, the Stakhanovite movement in the Soviet Union during the late 1930s was one example. The Soviet authorities utilized this case to start a movement of breaking this record and to urge to build a great communist country as fast as possible. A North Korean version of such a movement is called Chullima (a horse running 400 kilo meters without a break) movement. Such competition in the form of speed battles has continued until today (Kim, 2017). In a communist society, competition might be for the sake of the state, which might not be as potent as individual competition, but it nevertheless might serve as a basis for productive competition. Ultimately, it is an empirical question as to whether North Korean refugees shy away from competition.
As we mentioned in the introduction, North Korean refugees are a selected sample of the North Korean population. North Korean refugees are more likely to be female, from bordering provinces, and not married than the North Korean population (Kim, Choi, Lee, Lee, and Choi, 2017, Table 2). Furthermore, South and North Koreans should differ along important observed and unobserved dimensions other than their institutional backgrounds. Therefore, it is difficult to causally attribute any inter-Korean differences in competitiveness to the differences in their institutional experiences. To mitigate this concern, we oversample low-income South Koreans to match them as much as possible to North Koreans in terms of incomes and control for a rich set of demographic and socioeconomic characteristics in regression analyses.
Korean-Chinese Immigrants Korean-Chinese immigrants living in South Korea are the descendants of Korean emigrants into China from the late 19th and the first half of the 20th century. Most of the Korean-Chinese spent their childhood and received education in China but came to South Korea during the last twenty years mainly for economic opportunities. Therefore, they are influenced by Chinese institutions which can be characterized as being politically centralized but economically decentralized (Xu, 2011). This means that while Korean-Chinese immigrants, like North Korean refugees, are immigrants in South Korea, they should be closer to native-born South Koreans in terms of their institutional background, especially regarding the exposure to a market economy. Moreover, the Korean-Chinese are almost indistinguishable from North Koreans in terms of their accent or appearances. If past experiences of economic institutions in the home country matter for competitiveness, we expect to find that the Korean-Chinese are similarly competitive to South Koreans.
3 Sampling and Study Design
3.1 Sampling
Our study involved three distinct groups of Korean people in terms of their countries of origin. We used the stratified sampling method to recruit 191 North Korean refugees who were representative of the population of North Korean refugees in South Korea in terms of gender, age (at least 20 years old), and year of entry.999According the 2014 official statistics of the Ministry of Unification in South Korea, the population of North Korean refugees consists of about 28% in their twenties, 30% in their thirties, 16% in their forties, and 10% in their fifties or above. About 28% of them entered at South Korea prior to 2005, 27% between 2006 and 2008, 29% between 2009 and 2011, and the rest since 2012. In addition, we recruited 193 South Korean adults and 72 Korean Chinese in South Korea to match the composition of North Korean refugee subjects with regard to gender and age. To reduce income differences between South Korean and North Korean subjects, we oversampled low-income South Korean subjects by restricting the one-third of all South Korean subjects to those from low-income households making less than about 2,200 USD in terms of monthly income.
In recruiting these three subject groups and implementing our experiments, we collaborated with a branch of a global survey company, the Nielsen Company in Korea, which had accumulated experiences in conducting surveys with a representative sample of South Korean adults and North Korean refugees in South Korea.
3.2 Study Design
We ran 12 experimental sessions in June 2015 at the Nielsen Company in Korea. In each session, all three Korean groups were proportionally invited to the total number of subjects. That is, in each session, the number of North Korean refugees was about the same magnitude as that of native-born South Koreans and was larger than that of Korean-Chinese immigrants. Our study design is broadly depicted in Figure 1.
3.2.1 Individual Real-Effort Experiments
Individual Real-Effort Tasks At the first stage, subjects conducted a series of individual real-effort tasks under two different payment schemes. The task in each scheme involved counting ’s in a table of containing ’s and ’s (see, e.g., Abeler, Falk, Goette, and Huffman, 2011). Specifically, subjects received 20 of these tables in an envelope, counted ’s and input answers in a computer within 5 minutes.
Subjects performed this task under a noncompetitive piece-rate incentive scheme as well as under a competitive tournament scheme. In the piece-rate incentive scheme, the subject was paid 1,000 KRW (about one USD) for each correct table. For example, the subject was paid 12,000 KRW if the answers for 12 tables were correct. Under the tournament incentive scheme, subjects were informed that each person would be randomly matched with an anonymous partner at the end of the session and would earn 2,000 KRW for each correct table if the number of correct tables made by the subject was higher than that by his/her partner or if the subject was randomly selected in case of a tie. Otherwise, the subject received nothing. For example, suppose that subject A answered 9 tables correctly. If partner B had 8 correct tables, then A earned 18,000 KRW and B nothing; if B had 10 correct tables, then A earned nothing and B 20,000 KRW; if B had 9 correct tables, then a random winner (A or B) earned 18,000 KRW.
We randomized the order of the two schemes among subjects. At the end of the task under each payment scheme, individual subjects were informed of the number of correct answers they made. Under the tournament scheme, whether the individual won or not was revealed after they finished all tasks, including the post-experimental survey.
Choice of Incentive Schemes After completing the real-effort tasks under the two incentive schemes, subjects were asked to choose an incentive scheme under which they performed the same task of counting ’s with a new set of 20 such tables as in the first two rounds. Since there might have been performance differences among three Korean groups, we introduced an exogenous variation in the task performance by randomly giving an individual an integer bonus point between 0 and 10. If the piece-rate scheme was selected, the individual obtained total earnings as the sum of the number of correct answers and the bonus point, multiplied by 1,000 KRW. If the tournament was selected, the individual received the total earnings of the sum of the number of correct answers and the bonus point, multiplied by 2,000 KRW, if the individual won and nothing otherwise. Under the tournament incentive scheme, the individual with a bonus point competed with the opponent matched in the previous round under tournament. In deciding the winner, the opponent did not have a bonus point. Subjects were informed of this information.
One of the main research questions in the paper is whether North Korean refugees shy away from competition. They may choose the piece-rate scheme not only because they are unwilling to undertake competition (that is, due to competition aversion) but also because they are on average low performers relative to South Koreans or Korean-Chinese (that is, due to low skills). The random allocation of bonus points allows us to separate the former from the latter in the choice experiment.
Elicitation of Winning Probability Upon completing the three rounds of the real-effort experiment, we elicited subjects’ beliefs of winning probability using the method of Hossain and Okui (2013). Subjects were reminded of the number of correct answers under the incentive scheme they chose as well as the bonus point assigned to themselves, and that their opponent in the stage of belief elicitation was another participant who was matched under the tournament scheme and had no bonus point. In the case where the piece-rate scheme was chosen, the subject was asked for his or her beliefs of the winning probability if he or she had chosen the tournament instead. Subjects were asked to choose beliefs of their winning probability in the range between 0% and 100% with 10% increments. We computed a prediction error based on whether they won and their elicited beliefs. The computed prediction error was compared with a random number generated between 0 and 1. If the prediction error was lower than a random number, the subject received 2,000 KRW and nothing otherwise. Figure 2 presents the flow chart of individual real-effort experiments.101010After elicitation of winning probability, we had team-level real efforts experiments. Specifically, we formed random groups of three subjects each of which conducted a joint real-effort task under an exogenously given payment scheme. The details of the experimental results at the team level will be reported in a separate outlet since they are not directly related to the main research question in the current paper.
3.2.2 Other Measurements
Elicitation of Risk Preferences After team-level experiments, we elicited subjects’ risk preferences. Specifically, we used the multiple price list design of Holt and Laury (2002) for the elicitation of risk preferences. The design involves ten choices between the paired lotteries. One lottery in the pair (‘safe’ choice) involves 5,000 KRW with probability and 4,000 KRW with probability , whereas the other lottery (‘risky’ choice) entails 10,000 KRW with probability and 0 KRW with probability . The probability of the high-payoff outcome begins with and increases by as the decision goes down along the list. The expected payoff difference between the safe and risky lotteries is in 1,000 KRW; therefore, as a benchmark, a risk-neutral subject’s optimal behavior is to make the first four safe choices and then to switch to six risky lotteries.
Raven’s Progressive Matrices Test At the end of experiments, we measure the cognitive ability of subjects using an abbreviated version of the Raven’s Progressive Matrices Test. Subjects solved 24 questions within 15 minutes. We did not provide any monetary incentives for completing the Raven test, which is conventional in the psychology and psychometric literature (Gill and Prowse, 2016).
Survey At the end of each session, the participants completed a survey which collected information on their demographic and socioeconomic characteristics. We asked several additional questions for North Korean refugees and Chinese Korean participants.
4 Empirical Results
In this section, we firstly provide the summary statistics of baseline variables and Raven test scores across the three groups and then present experimental results. For brevity, we will abbreviate native-born South-born Koreans, North Korean refugees and Korean-Chinese immigrants to SK, NK and KC, respectively.
4.1 Summary Statistics of Baseline Variables
| NK | SK | KC | p-value | |
| Female | .66 | .71 | .708 | .533 |
| Age | 37.5 | 34.8 | 33.6 | .00376 |
| Post-secondary education | .262 | .85 | .597 | .001 |
| Married | .298 | .425 | .306 | .0246 |
| Subject health status: not healthy | .304 | .14 | .125 | .001 |
| Religious affiliation | .597 | .585 | .417 | .023 |
| Number of household members | 2.38 | 3.15 | 2.9 | .001 |
| Employed | .639 | .798 | .792 | .00126 |
| Unemployed | .136 | .0777 | .111 | .174 |
| Out of labor force | .225 | .124 | .0972 | .00884 |
| Stock market participation | .0838 | .275 | .139 | .001 |
| Credit card holding | .382 | .705 | .333 | .001 |
| Online shopping | .429 | .933 | .611 | .001 |
| Monthly household income | 1.5 | 4.42 | 2.12 | .001 |
| Monthly household income per person | .794 | 1.64 | 1.01 | .001 |
| Monthly household expenditure | 1.05 | 3.34 | 1.54 | .001 |
| Household wealth | 133 | 352 | 185 | .0577 |
Notes: The table shows the mean of each variable for North Korean refugees (NK), native-born South Koreans (SK) and Korean-Chinese immigrants (KC) separately. The last column shows the p-value for testing the joint significance of group indicators in regressing each variable on group indicators. The omitted group is SK in the regression. Household income, expenditure and wealth are measured in 1 million KRW. The variables with are binary indicator variables. The labor force status consists of employed, unemployed and out of labor force.
The basic sociodemographic characteristics of the three subject groups are reported in Tables 1, disaggregated by the country of origin (SK, NK, and KC). A significant majority of each group are female: 66% of the NK subjects and about 71% of each of the SK and KC subjects. The NK subjects are on average 38 years old, while the SK subjects and the KC subjects are 35 years old and 34 years old, respectively.
The three Korean groups are different on many observables. Less than 30 percent of the NK subjects were post-secondary educated in contrast to 85 percent for the SK subjects and 60 percent of the KC subjects. Compared to SK, the NK and KC subjects were less likely to be married. About 30 percent of the NK subjects assessed subjectively that they were unhealthy—much higher than SK and KC. The KC subjects are noticeably less affiliated with religion than both NK and SK. The NK subjects had fewer household members. In terms of labor force status, NK were least likely to be employed while there was no difference between SK and CK. Relative to SK, both NK and KC were less likely to participate in the stock market, to hold a credit card and to shop online. In short, as immigrants, both NK and KC were less engaged with various economic aspects than the native SK. Although we oversampled lower-income SK, their average household income, expenditure and wealth were significantly higher than those of NK and KC.
4.2 Raven Test Results
All subjects took the Raven test at the end of experiments. Test results are presented in Table 2 and Figure 3. Specifically, the summary statistics are given in Table 2; Panel A of Figure 3 plots the histograms of the test scores and Panel B shows the age profiles that are obtained by local linear estimates. The results reveal that there exists an staggering gap between the NK and SK subjects in terms of cognitive ability. The average z-score of the SK subjects is 0.724, whereas the average score of the NK subjects is only -0.771. The average score of the KC subjects is between those of SK and NK—slightly above zero. The Raven test results for SK and NK are quantitatively similar to those reported in our previous work (Choi, Kim, Lee, and Lee, 2020), where the Raven test is used as source of income in dictator games. Some works based on data from Germany suggest that the cognitive ability of East Germans lagged behind that of West Germans before the German unification. The average intelligence quotient (IQ) of military recruits from West Germany was 101 while that from East Germans was 95; nevertheless, East German military recruits gained by 0.66 points in IQ in each year after the unification (Roivainen, 2012). In a similar vein, the difference between Raven test scores between West and East Germans was substantial: the former recorded 70 on average but the latter did only 50 (Brouwers, Van de Vijver, and Van Hemert, 2009).
| mean | SD | min | max | |
|---|---|---|---|---|
| NK | -.771 | .79 | -1.96 | 1.13 |
| SK | .724 | .572 | -1.52 | 1.57 |
| KC | .104 | .904 | -1.82 | 1.43 |
| Total | 0 | 1 | -1.96 | 1.57 |
A. Histogram of Test Scores by Group
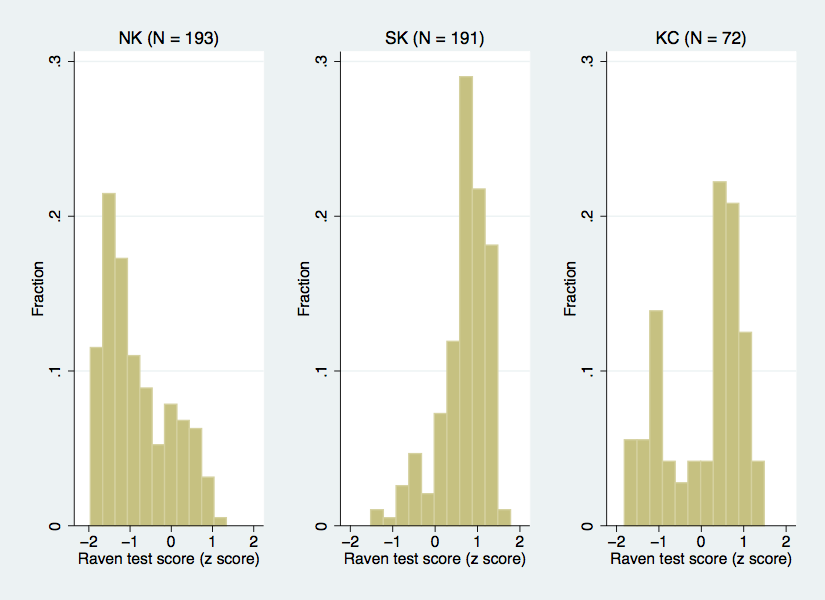
B. Age Profile of Test Scores by Group
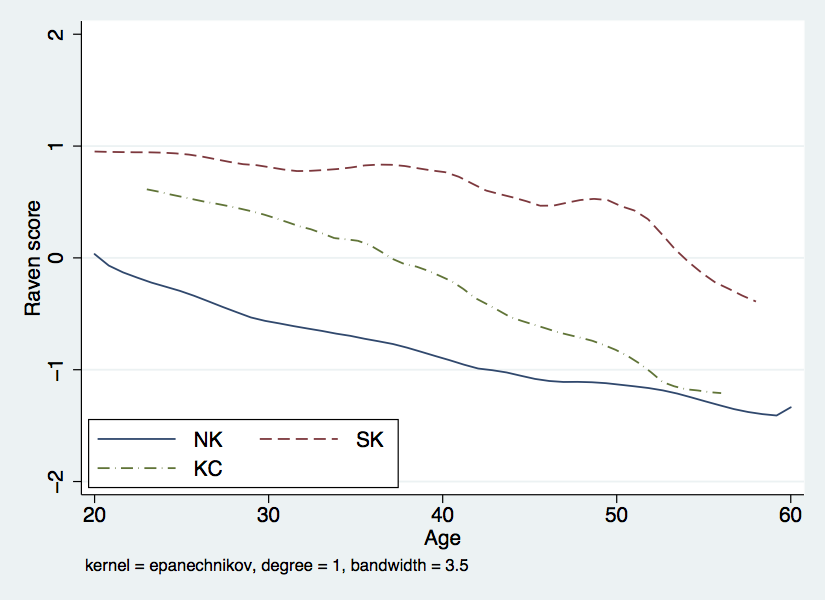
In Figure 3, the estimated age profiles exhibit that the SK-NK gap is uniformly persistent across different ages and the KC subjects are again between the NK and SK subjects. Interestingly, the gradient for KC seems steeper. This could be due to the fact that economic development in China occurred mainly after 1990s. Improvement in Chinese’s cognitive ability might be accounted for by better nutrition, expansion in education, and heightened quality of education. Economic growth influences cognitive ability through more nutritious diets. Increases in enrollment ratio in secondary and tertiary education might have played an important role in higher cognitive ability. Education quality has improved not only in the areas of better infrastructure and teacher-pupil ratios but also in the form of curriculum reform (Wu, 2010; Jianjun, 2012). In addition, labor market reform has increased return to education and thus motivated individuals to pursue better and higher education (Heckman, 2002).
4.3 Experimental Results
Table 3 gives central empirical results at the individual level. Panel A of Table 3 summarizes individual performance by compensation scheme. Subjects performed the real-effort task twice under two alternative compensation schemes. We randomized the order of the compensation schemes by session; therefore, about 50% of subjects of each country of origin performed under the piece rate scheme first and under the tournament scheme later (54% for NK, 50% for KC and 49% for SK). Under the piece rate scheme, on average, the NK subjects scored about 11 out of 20, which was 2 points below the average scores of SK and KC. Under the tournament scheme, the NK subjects performed slightly better; however, the SK subjects scored above 13, keeping the gap between SK and NK at about 2 points. Under both schemes, on average, the SK subjects performed best, while the NK subjects performed worst. The KC subjects are between SK and NK. The difference between NK and SK is statistically significant at the 1% significance level. The performance gap is about 18% in both schemes. There is no significant gap between SK and KC under the piece rate scheme (less than 0.5%); however, the gap becomes marginally significant (7%) under the tournament scheme.
| NK | SK | KC | p-value-NK | p-value-KC | |
| A. Real effort task performance | |||||
| Piece rate first | .539 | .487 | .5 | .307 | .852 |
| Score at piece rate | 10.8 | 12.9 | 12.9 | 2.16e-08 | .905 |
| Score at tournament | 11.4 | 13.6 | 12.7 | 9.37e-10 | .0507 |
| B. Compensation scheme choice | |||||
| Bonus | 4.91 | 4.74 | 5.13 | .616 | .358 |
| Choice of tournament | .45 | .648 | .625 | .0000898 | .735 |
| Score at the chosen scheme | 12.4 | 15.2 | 14 | 3.75e-13 | .0176 |
| C. Belief elicitation | |||||
| Subjective winning probability | .601 | .781 | .749 | 6.41e-10 | .356 |
| Subjectiveempirical prob. gap | -.119 | -.0449 | -.0844 | .0116 | .264 |
| D. Lottery choice | |||||
| Number of safe lottery choices | 4.62 | 5.51 | 4.74 | .000498 | .0291 |
| Inconsistent lottery choices | .429 | .104 | .236 | 7.06e-14 | .0161 |
| E. Cognitive ability | |||||
| Raven test score | -.771 | .724 | .104 | 7.25e-70 | 8.53e-08 |
Notes: The table shows the mean of each variable for North Korean refugees (NK), native-born South Koreans (SK) and Korean-Chinese immigrants (KC) separately. The p-value-NK and p-value-KC are p-values for testing the significance of NK and KC indicators, respectively, in regressing each variable on group indicators. The omitted group is SK in the regression.
Panel B of Table 3 presents the compensation scheme choice results and task performance outcomes under the selected scheme. As explained above, subjects were randomly given some bonus points before choosing a compensation scheme. The bonus point is a random integer between 0 and 10. Thus, the average is 5 for all three groups, and there is no statistical difference. The most important finding in Panel B is that the NK subjects were less likely to choose the tournament scheme than the SK or KC subjects. 45% of the NK subjects selected the tournament scheme, whereas 65% of SK subjects and 63% of KC subjects chose the tournament scheme. The difference between SK and NK or between NK and KC is significantly different from zero at the 1% significance level. If we interpret the choice of tournament as a measure of competitiveness, the results are consistent with the hypothesis that the NK subjects are less competitive than the SK or KC subjects. Panel B also shows how well subjects performed in their selected compensation scheme. It is found that subjects performed better in the selected scheme, compared to the results in Panel A. This is partly because of learning as they repeated the same kind of the task and partly because of self-selection into the preferred compensation scheme. As in Panel A, the NK subjects performed worst, while the SK and KC subjects scored 15 and 14 on average, respectively.
Panel C of Table 3 reports elicited subjective winning probability across three groups. The NK subjects, on average, assessed their chance of winning with a bonus point at 60%; whereas the average winning probability was 78% and 75% for SK and KC, respectively. The average gap between the subjective and ex post empirical winning probability was negative for all the groups; NK showed the most pessimistic self-evaluation of the likelihood of winning. It is interesting to note that NK are less likely to select into tournament and gauge the odds of winning more unfavorably: that is, aversion to competition seems linked to a doubtful view of winning.
Panel D of Table 3 summarizes the empirical results of the elicitation of risk preferences. Out of ten choices between paired lotteries, all three groups selected about 5 safe lotteries with a bit higher number for SK. The more noticeable difference is that the incidence of inconsistent lottery choice due to multiple switching is much more frequent for NK than SK and KC: 82 out of 191 NK subjects made an inconsistent lottery choice—only 57% of NK were consistent—whereas, only 20 out of 193 SK subjects made an inconsistent lottery choice. Like many other variables, the result for KC is somewhat between SK and NK. In view of the Raven test results reported in the previous subsection, the prevalence in inconsistency for the NK subjects might be due to their low level of cognitive ability. The results for the Raven test score is reproduced in Panel E for the sake of simple comparison.
4.4 Determinants for Selection into Tournament
| (1) | (2) | (3) | (4) | (5) | |
| NK | -.171 | -.156 | -.11 | .0893 | .122 |
| (.0384) | (.0346) | (.0441) | (.0561) | (.0647) | |
| KC | -.0513 | -.0525 | -.0285 | .0644 | .107 |
| (.0901) | (.0823) | (.0777) | (.07) | (.0799) | |
| Age | -.0139 | -.0131 | -.0112 | -.00659 | -.00582 |
| (.0032) | (.00325) | (.00329) | (.00302) | (.0027) | |
| Female | -.109 | -.0862 | -.0925 | -.0757 | -.0971 |
| (.054) | (.0551) | (.0543) | (.0504) | (.0555) | |
| Bonus | .0321 | .0308 | .0306 | .0327 | .0348 |
| (.00529) | (.00506) | (.00491) | (.00503) | (.00556) | |
| Number of safe lottery choices | -.0219 | -.0216 | -.0198 | -.0198 | |
| (.00859) | (.00824) | (.00794) | (.00706) | ||
| Inconsistent lottery choices | -.107 | -.103 | -.0532 | -.0403 | |
| (.0504) | (.0547) | (.0561) | (.06) | ||
| Pre-choice tournament score | .0231 | .0161 | .0135 | ||
| (.00589) | (.00606) | (.00681) | |||
| Raven test score | .162 | .16 | |||
| (.0359) | (.0351) | ||||
| Further sociodemographic variables | No | No | No | No | Yes |
| Observations | 456 | 456 | 456 | 456 | 423 |
| R-squared | .165 | .185 | .211 | .25 | .29 |
Notes: Linear probability models. The dependent variable is an indicator of whether the subject selects the tournament scheme. Further sociodemographic variables include post-secondary education, marital status, subjective health status, religious affiliation, number of household members, labor force status, stock market participation, credit card holding, online shopping, log monthly household income, log monthly household expenditure, and log household wealth. Robust standard errors, clustered by session, are presented in parentheses.
In view of the experiments in the previous subsection, the key question now is: What explains the differences in selection into tournament across the three Korean groups? As mentioned earlier and shown in Table 1, the three Korean groups, particularly, SK and NK, differed along important observed and unobserved dimensions. To address this concern, in the regression analysis below, we controlled for some demographic and socioeconomic characteristics. Furthermore, we elicited or measured some unobservable characteristics which were presumably relevant for the compensation scheme selection, such as risk aversion and ability. We tested for the differences in competitiveness after controlling for these characteristics.
Table 4 presents the regression results. In column (1), we controlled for age, female, and bonus points only. Then we added more and more control variables to check the robustness of the inter-group differences. Column (1) shows that the NK subjects were about 17 percentage points less likely to select the tournament scheme than the SK subjects while there was no significant difference between the SK and KC subjects. In column (2), we controlled for risk aversion; the number of safe choices and whether they made any inconsistent choices (more than one switching point). The SK-NK difference became slightly smaller to 15.6 percentage points but was still statistically significant. This result holds in column (3) where we controlled for the level of pre-choice task performance.
The SK-NK gap became statistically insignificant in column (4) once we controlled for Raven’s test score, which was a measure of general cognitive ability. In fact, the sign of the estimate for NK was reversed. It now suggests that NK refugees were more competitive than SK. The negative age effect is diluted approximately by half and insignificant with controlling for the Raven score, suggesting that the apparent age effect in columns (1)-(3) are mainly driven by cognitive ability. There was no difference between SK and KC across the board in Table 4, regardless of control variables. The results in column (4) are similar to those in column (5) where further sociodemographic variables are included additionally.
In the post-experiment survey, we asked a question about preference for competition. The exact question was “What do you think about competing with others in a usual day?" The response was from 1 (hate it very much) to 10 (like it very much).111111A general question on competition is adopted here to avoid any potential bias against NK or KC. In a different context, a general question about risk taking resulted in the best versatile predictor of risky behavior (Dohmen, Falk, Huffman, Sunde, Schupp, and Wagner, 2011). The survey results show that the average was highest for NK subjects (6.6) and lowest for SK subjects (5.5). KC subjects’ average was around the middle, 6.2. This means that NK subjects did not mind or even enjoyed competing with others. We checked whether the result holds after controlling for individual characteristics. It turns out that the result that NK subjects had a more favorable attitude toward competition holds with control variables including general cognitive ability. This corroborates our experimental finding about competitiveness and is consistent with the claim that communism aims to harness competition in achieving production targets, as was discussed in Section 2. The survey results show that the KC subjects were more favorable to competition than the SK subjects.
4.5 Determinants for Subjective Winning Probability
| (1) | (2) | (3) | (4) | (5) | |
| NK | -.167 | -.154 | -.106 | -.00794 | -.0236 |
| (.0244) | (.0264) | (.0273) | (.0279) | (.0279) | |
| KC | -.0515 | -.0469 | -.0217 | .024 | .0251 |
| (.0266) | (.0238) | (.0215) | (.0261) | (.0255) | |
| Age | -.00768 | -.00737 | -.00537 | -.00311 | -.00291 |
| (.00152) | (.00157) | (.00155) | (.00134) | (.00192) | |
| Female | -.0631 | -.057 | -.0636 | -.0554 | -.0608 |
| (.0178) | (.0183) | (.018) | (.0162) | (.0165) | |
| Bonus | .0255 | .0255 | .0252 | .0263 | .027 |
| (.00397) | (.00396) | (.00327) | (.00351) | (.00381) | |
| Number of safe lottery choices | -.00273 | -.0024 | -.00152 | -.00157 | |
| (.00422) | (.00387) | (.0044) | (.00452) | ||
| Inconsistent lottery choices | -.0477 | -.0439 | -.0192 | -.0157 | |
| (.0354) | (.0349) | (.0334) | (.0378) | ||
| Pre-choice tournament score | .0244 | .0209 | .0209 | ||
| (.00263) | (.00256) | (.00278) | |||
| Raven test score | .0794 | .0763 | |||
| (.0186) | (.0184) | ||||
| Further sociodemographic variables | No | No | No | No | Yes |
| Observations | 456 | 456 | 456 | 456 | 423 |
| R-squared | .248 | .253 | .339 | .367 | .366 |
Notes: Linear probability models. Further sociodemographic variables are the same as those in Table 4. Robust standard errors, clustered by session, are presented in parentheses.
As shown in Panel C of Table 3, the NK subjects expected to win the tournament 18 percentage points less than the SK subjects, while the KC subjects displayed no significant respective difference to the SK subjects. There are at least two possible explanations. The first explanation is based on rational expectation. Since subjects have carried out the same task under the tournament scheme, they should have good expectation about their own performance levels. That is, those who did not performed well in the previous tournament were more likely to choose the piece-rate scheme rather than the tournament scheme.121212They are limited to guess their winning probability accurately because they have little information about the distribution of ability among other subjects in their session. Since the NK subjects performed below average, they might have had a lower expectation about winning and were less likely to choose the tournament scheme. The second explanation is based on factors beyond rational expectation, such as self-confidence and aversion to competition among other things. There exists a substantial amount of heterogeneity in self-confidence (Barber and Odean, 2001). It is likely that minority groups such as women and immigrants are less confident about themselves. If the NK subjects are less self-confident or intrinsically averse to competition, then despite the probability of winning the tournament being the same, they should be less likely choose the tournament scheme. In this subsection, we report reduced-form results on the determinants of subjective winning probability. We will look into different explanations more systematically in Section 5.
In Table 5, we attempt to examine which individual characteristics can account for the NK-SK difference in their subjective winning probability. Column (1) presents the differences among the three Korean groups conditional on basic variables: age, female and bonus points. NK subjects’ subjective winning probability was on average 17 percentage points lower than SK subjects’. KC subjects’ probability was 5.2 percentage points lower but it was only marginally significant. In column (2), we controlled for two variables of risk aversion. The NK-SK gap became a bit smaller, 15.4 percentage points. In column (3), we added the variable of pre-choice task performance in view of rational expectation explanation. As expected, this variable was significant and explains a part of the NK-SK gap. After controlling for it, the gap reduced to 10.6 percentage points.131313We tried to control for two additional variables: own group strongest and own group weakest. In the post-experimental survey, we asked which group among NK, SK and KC was expected to perform best in the task and which group would perform worst, respectively. Based on the responses to the questions, we created the two variables which indicated that their own group was expected to be the best or the worst. We interpret that these variables measured the extent of group-level confidence. The results show that those who believed that their own group was the most inferior were less likely to select into the tournament. However, it turns out that these variables did not explain the NK-SK difference. However, it is still significant, indicating that factors beyond rational expectation may affect subjective winning probability.
In column (4), we controlled for the Raven test score and found that the variable explained the whole NK-SK gap in subjective winning probability. The gap became statistically insignificant and virtually zero in magnitude. It is intriguing to find that general cognitive ability plays a key role in explaining why the NK subjects had a lower expectation about winning given our previous finding that the Raven test score was also a crucial factor for explaining the NK-SK difference in tournament entry decision. As before, the inclusion of further sociodemographic variables in column (5) gives results similar to those in column (4).
4.6 Do Experiences in North Korea and in South Korea Matter?
In this subsection, we focus on the NK subjects and examine whether any experiences in North Korea and in South Korea matter for the willingness to compete. After the experiments, we conducted a detailed survey for North Korean refugees about their economic activities and experiences in North Korea. Although the North Korean society is an extremely uniform society, there exists some extent of individual heterogeneity in terms of economic and social experiences. This is partly because it is also a class society that places extreme limitations on social mobility. Therefore, the extent to which they are captured by the standard rules and social norms of North Korea might be varying across individuals.
| mean | SD | min | max | |
|---|---|---|---|---|
| Border provinces | .791 | .408 | 0 | 1 |
| Military service in NK | .147 | .355 | 0 | 1 |
| Communist party member in NK | .131 | .338 | 0 | 1 |
| Secondary job in NK | .408 | .493 | 0 | 1 |
| Years of secondary job in NK | 1.4 | 3.12 | 0 | 30 |
| Years in SK | 7.12 | 3.78 | .75 | 15 |
| Education in SK | .45 | .499 | 0 | 1 |
| Monthly household income | 1.5 | 1.48 | .1 | 12 |
Table 6 gives descriptive statistics for NK specific variables. Almost 80% of the NK subjects were born in border provinces, 15% of them participated in military service, 13% of them were communist party members, 40% of them had a secondary job—the average year of secondary job experience was 1.4 including those who had no experience at all. Specifically, a secondary job refers to income-generating activities mostly at markets: trading, production of basic consumer goods, smuggling, repair, private services, feeding the cattle and cultivating private plots (Kim, 2017). Furthermore, on average, they spent about 7 years in South Korea, 45% of them received some education in South Korea, and their average monthly household income was 1.5 million KRW.
| (1) | (2) | (3) | (4) | |
| NK | .0893 | .0537 | .0188 | -.071 |
| (.0561) | (.106) | (.0629) | (.104) | |
| KC | .0644 | .0653 | .0538 | .0541 |
| (.07) | (.0688) | (.0728) | (.0708) | |
| Age | -.00659 | -.00745 | -.00722 | -.00835 |
| (.00302) | (.00266) | (.00302) | (.00277) | |
| Female | -.0757 | -.0693 | -.0583 | -.0428 |
| (.0504) | (.0494) | (.0475) | (.0493) | |
| Bonus | .0327 | .0327 | .0359 | .0361 |
| (.00503) | (.0054) | (.0046) | (.00517) | |
| Number of safe lottery choices | -.0198 | -.0193 | -.0208 | -.0205 |
| (.00794) | (.0082) | (.00843) | (.00888) | |
| Inconsistent lottery choices | -.0532 | -.0588 | -.0545 | -.0616 |
| (.0561) | (.055) | (.0558) | (.056) | |
| Pre-choice tournament score | .0161 | .0166 | .0142 | .0149 |
| (.00606) | (.0061) | (.00634) | (.0065) | |
| Raven test score | .162 | .162 | .152 | .151 |
| (.0359) | (.0373) | (.033) | (.0342) | |
| NK (Border provinces) | .0562 | .0734 | ||
| (.0693) | (.0695) | |||
| NK (Military service in NK) | -.105 | -.0739 | ||
| (.141) | (.147) | |||
| NK (Communist party member in NK) | .178 | .211 | ||
| (.156) | (.165) | |||
| NK (Secondary job in NK) | -.08 | -.0692 | ||
| (.0735) | (.0648) | |||
| NK (Years of secondary job in NK) | .0162 | .0235 | ||
| (.0131) | (.0116) | |||
| NK (Years in SK - 7) | .0258 | .0278 | ||
| (.00725) | (.00786) | |||
| NK (Education in SK) | .0762 | .0992 | ||
| (.0533) | (.0583) | |||
| NK (log(household income in SK) - log(1.5)) | -.0544 | -.0796 | ||
| (.0491) | (.0488) | |||
| Observations | 456 | 456 | 456 | 456 |
| R-squared | .25 | .258 | .271 | .283 |
Notes: Robust standard errors, clustered by session, are presented in parentheses.
Table 7 presents the results which are basically replications of Table 4. We begin with the baseline specification in column (4) in Table 4 and add interactions between the NK indicator variable and NK-specific variables. The results in column (2) of Table 7 show that no variables representing the experiences in North Korea are significant. Not only are none of the estimated coefficients significantly different from zero but they are also jointly insignificant.141414As Abadie (2018) advocate, statistical non-significance in our empirical result can be viewed as an informative result. That is, when we designed the experiment, it was largely unexpected that none of variables representing the experiences in North Korea would be insignificant. The indicator for the Communist party membership should be correlated with socioeconomic status in North Korea. It is therefore somewhat intriguing to find that the party membership variable is not significant. Those from border provinces or those who had a secondary job should be more exposed to markets, but still none of them turn out to be significant for competitiveness. In column (3), we include NK refugees’ experiences in South Korea: the duration of residence in SK, education in SK and monthly household income. We find that the longer they live in South Korea, the more competitive they become. This could be driven by North Korean refugees’ assimilation into the South Korean society (time effect) or by the difference in the ages at which they arrive in South Korea (cohort effect). For subjective winning probability, no variables related to experiences in NK and SK are significant.
4.7 Why do North Korean refugees have lower cognitive skills?
We have found that the deficiency of competitiveness among NK refugees can be attributed to their lower cognitive abilities. Therefore, a natural question to ask is why they have lower cognitive abilities than their SK or KC comparison groups. One possible reason can be found in education. Kim and Lee (2018) compared years of schooling and Raven’s test scores across countries and found that NK’s cognitive skills are lower than comparable less-developed countries, although their length of schooling is much longer. The education system is made to cultivate the skills that people need to make their living and live as citizens in their country. It is therefore not surprising that the education in North Korea is focused on ideological indoctrination. Teachers are not incentivized to teach students mathematics or reading but make them memorize the words from their supreme leader. Also, students in North Korea are often mobilized for some collective labor work instead of regular classes, from agriculture (“weeding battle” or “fall battle” of harvesting) to construction (Institute for Unification Education, 2014).
Another reason for NK refugees’ lower abilities is malnutrition in childhood or even during their prenatal period. Kim and Lee (2018) showed that heterogeneity in cognitive abilities among NK refugees is not explained by their demographic or socioeconomic characteristics and concluded that their lower abilities are likely originated from more macro factors such as lower economic development or food shortage at the national level.
There has been a growing body of the literature finding the long-term impacts of early childhood conditions on human capital development (Currie and Almond, 2011). The living environments of NK refugees should be much worse than those of SK or KC comparison groups. There have been some attempts to collect anthropometric data on people who were born and raised in North Korea, given that height and weight are strongly correlated with childhood conditions. The data have shown some substantial gaps between South Korea and North Korea. For example, Schwekendiek and Pak (2009) found that North Korean pre-school children are about 6-7 cm shorter and 3 kg lighter than South Korean children. Also, they found that NK refugee children and adolescents are about 3-4 cm shorter and weighed less by 1 kg than their SK counterparts. Pak (2010) found that the duration in South Korea or a third country after escape from North Korea has a positive effect, suggesting a catch-up effect, although it is not large enough to cancel the disparity with SK peers.
5 Understanding the Experimental Results through the Lens of a Choice Model with Probability Weighting
In the previous section, we find that the Raven test score is a strong predictor of selecting the tournament. Following the recent discussions in the literature about the sources of the variations of willingness to compete (Gillen, Snowberg, and Yariv, 2019; Van Veldhuizen, 2022), we attempt to understand different channels through which cognitive ability can affect competitiveness in our experiment. First, we note that the Raven score can affect competitiveness because (i) it is a strong predictor of individual performance, (ii) it affects subjective beliefs about winning the tournament, as shown in Section 4.5, (iii) it could affect risk aversion, and (iv) it may have a direct effect on preference for competition, not explained through performance, beliefs or risk aversion. To understand which channels matter and how they contribute to the overall competitiveness, in this section, we analyze experimental data using a simple choice model between the piece-rate scheme () and the tournament scheme ().
Assume that subject estimates his/her performance upon observing a random bonus by
where is the predicted score for competition that is the sum of the two terms: his/her expected performance and the random bonus.
Suppose that subject ’s utility of choosing the piece-rate scheme is given by
| (5.1) |
where the utility function over money is and denotes an individual’s disutility of making an effort to solve .151515It is implicitly assumed that for every . Here, allows for individual heterogeneity via , which represents subject ’s risk aversion or preference, whereas is assumed to be homogeneous across subjects. Our choice of model specification mainly comes from the fact that we have measurements of risky lotteries but none of disutility of making the effort.
We consider the following specification for the expected utility of choosing the tournament scheme:
| (5.2) |
where and are the same as in the piece-rate scheme, is the expected performance of opponent , is a probability weighting function, and is subject ’s preference for or against competition. Just like , we allow individual heterogeneity for both and . In evaluating the probability in (5.2), is compared to because the random bonus is applied only to subject —but not to opponent —to determine a winner in the tournament. Finally, subject ’s choice, say , is determined by
equlvalently
| (5.3) |
In what follows, we describe detailed specifications of the choice model and how to estimate them.
5.1 Expected performance
To measure for each subject, we use the average number of correct answers during the first two individual real-effort tasks. The top panel of Figure 4 shows histograms of the average performance by group, while the bottom panel depicts histograms of the average performance plus the random bonus. It can be seen from the top panel that the SK and CK subjects performed noticeably better than the NK subjects. Adding the random bonus substantially diluted differences across groups.
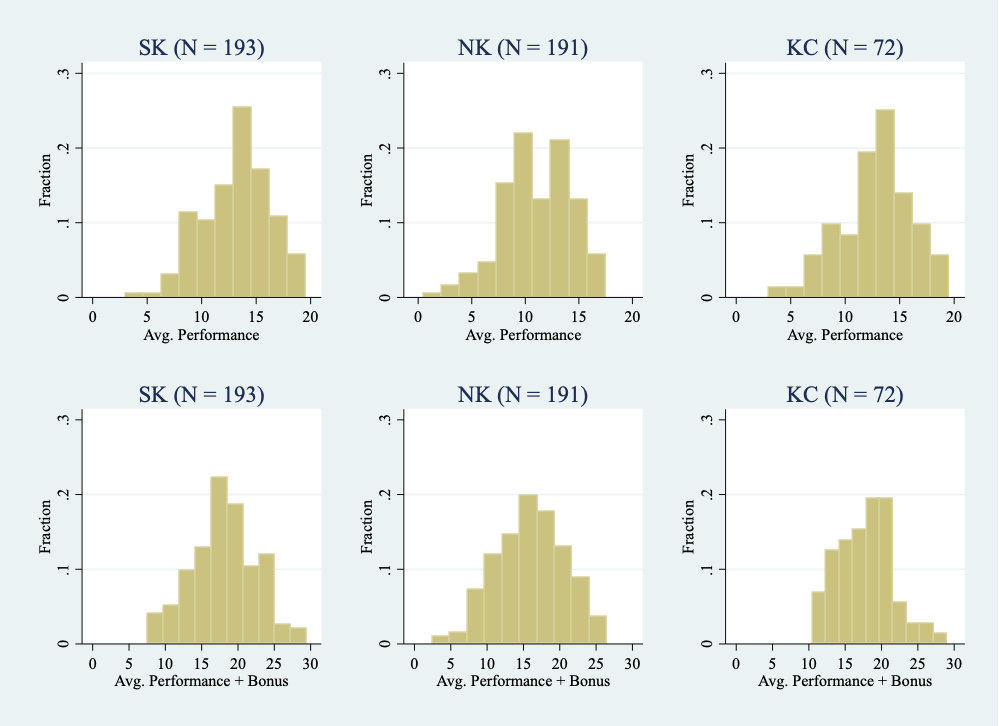
Notes: The average performance refers to the average number of correct answers during the first two individual real-effort tasks. The top panel shows histograms of the average performance by group, while the bottom panel depicts histograms of the average performance plus the random bonus by group.
| (1) | (2) | (3) | |
| Piece rate first | -.498 | -.234 | -.248 |
| (.318) | (.312) | (.305) | |
| NK | -2.17 | -1.95 | -.271 |
| (.313) | (.293) | (.316) | |
| KC | -.499 | -.6 | .185 |
| (.688) | (.63) | (.546) | |
| Age | -.0847 | -.0442 | |
| (.0178) | (.0147) | ||
| Female | .166 | .315 | |
| (.24) | (.254) | ||
| Raven test score | 1.19 | ||
| (.137) | |||
| Constant | 13.5 | 16.2 | 13.8 |
| (.228) | (.624) | (.486) | |
| Observations | 456 | 456 | 456 |
| R-squared | .1 | .158 | .21 |
Notes: The dependent variable is the average number of correct answers in the first two individual real-effort tasks. Robust standard errors, clustered by session, are presented in parentheses.
Before we move to measurements of other components in the model, in Table 8, we report regression results for the average performance. In column (1), the regressors include group dummies and an indicator variable whether the first task was the piece-rate scheme. In column (2), age and female are added and in column (3), the Raven test score is included. The NK subjects score about two less correct answers on average in columns (1) and (2) but this difference disappears once we control for the Raven test score.
5.2 Probability weighting
The crucial component in the specification of (5.2) is subject ’s subjective winning probability:
| (5.4) |
To operationalize probability weighting, we build on Goldstein and Einhorn (1987)’s functional form:
| (5.5) |
for and . Here, captures the degree of optimism and the parameter of likelihood insensitivity. We assume that can be heterogenous but is the same across subjects. When for each , the model reduces to the expected utility without probability weighting.
Let denote subject ’s winning probability measured by the method of Hossain and Okui (2013). We regard as a proxy measurement of subject ’s subjective winning probability in (5.4). Now the objective winning probability for subject is
which can be estimated for each using our experimental data. Specifically, define
where is the usual indicator function and is the sample size. Note that is the empirical winning probability using the average performance of all the subjects. The form of probability weighting in equation 5.5 suggests the following regression model:
| (5.6) |
The term is further decomposed into the two parts: observed heterogeneity () and unobserved heterogeneity (), where is a vector of covariates including cognitive ability and is the corresponding vector of parameters and is the idiosyncratic component. Choi, Kim, Lee, and Lee (2022) examine the relation between the two components of probability weighting—the degree of optimism and likelihood insensitivity—and cognitive ability. Our specification allows cognitive ability to be only mediated through the degree of optimism in relation with probability weighting. For some subjects, or can be zero or one. To have well-defined log odds, we truncate and to be always between 0.01 and 0.99. The unknown parameters and are estimated via median regression to mitigate the effect of truncation.
| (1) | (2) | (3) | |
|---|---|---|---|
| Log odds of | .565 | .501 | .543 |
| (.0835) | (.0517) | (.0561) | |
| [.445,.717] | [.416,.591] | [.425,.612] | |
| NK | -1.9 | -1.29 | -.463 |
| (.528) | (.28) | (.393) | |
| [-2.4,-.767] | [-1.84,-.958] | [-.979,.249] | |
| KC | -1.43 | -1.04 | -.558 |
| (.6) | (.393) | (.432) | |
| [-2.4,-.379] | [-1.74,-.432] | [-1.2,.187] | |
| Age | -.0465 | -.0235 | |
| (.0117) | (.0125) | ||
| [-0.0688,-.0297] | [-.0456,-.00426] | ||
| Female | -1.08 | -.813 | |
| (.249) | (.283) | ||
| [-1.38,-0.564] | [-1.22,-.26] | ||
| Raven test score | .613 | ||
| (.181) | |||
| [.397,.971] | |||
| Observations | 456 | 456 | 456 |
Notes: Median regression. The dependent variable is the log odds of subjective winning probability () and the first covariate is the log odds of empirical winning probability (). Bootstrap standard errors and 90% percentile confidence intervals are presented in parentheses and brackets, respectively.
Table 9 reports estimation results. Since the is constructed from the sample, we bootstrap the entire estimation procedure 1,000 times to obtain the standard errors and confidence intervals. In column (1), the coefficient for the log odds of empirical winning probability is , which corresponds to in (5.6). The coefficients for NK and KC are significantly negative, respectively, indicating that the NK and KC subjects are less optimistic about their chance of winning the tournament. In column (2), age and female are controlled for additionally and their coefficients are also significantly negative; however, in column (3) where the Raven test score is added, we can see that only female and the Raven score have large significant effects. In summary, the estimation results suggest that (i) individuals’ subjective beliefs about their chance of winning the tournament is aligned with the empirical winning probability; (ii) the SK subjects exhibit more optimistic patterns than the NK and KC subjects but the differences seem to be explained by the Raven score; (iii) women shy away from competition mainly because of their pessimistic view on the chance of winning the tournament. It is striking that women’s pessimism is still large even after controlling for the Raven score.
5.3 Separating competition aversion from risk aversion
We now estimate the choice model in (5.3). To capture individual heterogeneity for risk aversion or preference, we use data on ten lottery choices.
Notes: The histograms show the number of safe options in the ten paired lottery choices by group.
| (1) | (2) | (3) | |
| NK | -.89 | -.886 | -1.13 |
| (.212) | (.183) | (.281) | |
| KC | -.772 | -.76 | -.875 |
| (.299) | (.303) | (.368) | |
| Age | .00908 | .0032 | |
| (.0111) | (.0136) | ||
| Female | .57 | .548 | |
| (.285) | (.297) | ||
| Raven test score | -.173 | ||
| (.17) | |||
| Constant | 5.51 | 4.79 | 5.13 |
| (.187) | (.459) | (.717) | |
| Observations | 456 | 456 | 456 |
| R-squared | .0278 | .0399 | .0418 |
Notes: The dependent variable is the number of safe choices in the ten pairs of lotteries. Robust standard errors, clustered by session, are presented in parentheses.
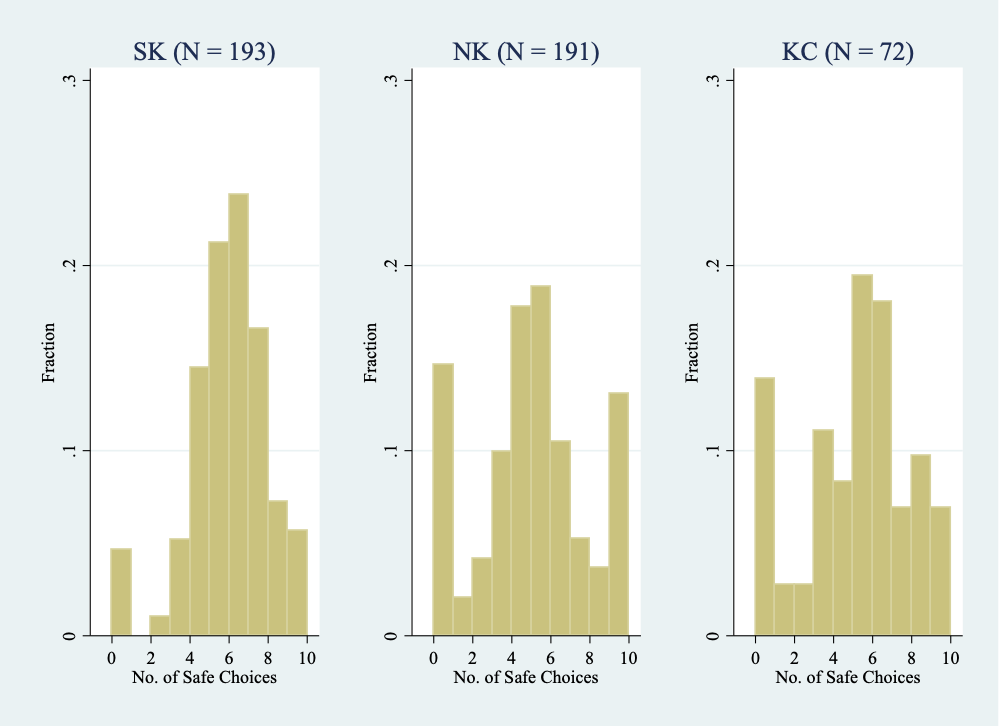
Figure 5 shows the histograms of the number of safe choices out of the ten pairs of lotteries. In each group, there is substantial heterogeneity across subjects. There are more extreme types among the NK subjects than the SK subjects: 28 NK subjects (respectively, 9 SK subjects) selected none of safe choices, while 19 NK subjects (respectively, 1 SK subject) chose all of safe choices. The KC subjects also show a high proportion of choosing all risky options (10 out of 72 KC subjects). Table 10 confirms the patterns observed in Figure 5. It is interesting to observe that the negative NK coefficient becomes even larger in the absolute value after controlling for the Raven score. In general, none of age, female and the Raven score explain the number of safe choices, resulting in the R-squared of only 0.04.161616In the literature, Dohmen, Falk, Huffman, and Sunde (2010) find that greater risk aversion is associated with lower cognitive ability, whereas Andersson, Holm, Tyran, and Wengström (2016) report evidence suggesting that this relation might be spurious. In Table 10, we do not find any evidence that the Raven test score is negatively correlated with the number of safe options. When we regress the extreme lottery choice (equals one if either or is true; zero otherwise) on the same covariates as in column (3) of Table 10, the estimated coefficient for the Raven score is with a standard error of , hinting that lower cognitive ability may be associated with extreme choice. However, our experimental design does not allow us to determine whether it is mainly due to mistakes from lower cognitive ability or genuine differences in the underlying preferences. Recall that the utility function over money is . In what follows, we do not attempt to estimate in an elaborate way, but we simply classify subjects based on the number of safe lottery choices by assigning different values of :
| (5.7) | ||||
where is the number of safe choices for subject . This utility specification is broadly in line with Holt and Laury (2002)’s risk-aversion classifications based on lottery choices (see Table 3 in their paper). The main purpose of adopting the heterogeneous utility function via (5.7) is to alleviate the misspecification issues of using a homogeneous utility function, thereby allowing us to estimate preference for competition more credibly.
| (1) | (2) | (3) | (4) | (5) | (6) | |
| OLS | IV-1 | IV-2 | OLS | IV-1 | IV-2 | |
| .298 | 3.16 | 3.54 | .278 | 3.33 | 3.21 | |
| (.0634) | (1.3) | (.856) | (.0664) | (1.36) | (.86) | |
| NK | -.174 | -.257 | -.268 | .0759 | -.0848 | -.0787 |
| (.0339) | (.0792) | (.0761) | (.054) | (.109) | (.0917) | |
| KC | -.0527 | -.184 | -.202 | .065 | -.109 | -.103 |
| (.0902) | (.192) | (.2) | (.0758) | (.196) | (.179) | |
| Age | -.0135 | -.00924 | -.00867 | -.00749 | -.00474 | -.00484 |
| (.00354) | (.0044) | (.00455) | (.00339) | (.00491) | (.00483) | |
| Female | -.107 | .00337 | .018 | -.0856 | .0253 | .0211 |
| (.0569) | (.105) | (.1) | (.0511) | (.107) | (.0929) | |
| Raven test score | .177 | .125 | .127 | |||
| (.0355) | (.0418) | (.0408) | ||||
| Constant | 1.17 | .785 | .733 | .825 | .513 | .525 |
| (.134) | (.229) | (.215) | (.123) | (.255) | (.234) | |
| First-stage | ||||||
| F-statistic | 7.48 | 25.31 | 7.52 | 27.76 | ||
| P-value | .019 | .000 | .019 | .000 | ||
| Observations | 456 | 456 | 456 | 456 | 456 | 456 |
Notes: Linear probability models. The dependent variable is an indicator of whether the subject selects the tournament scheme. is defined in (5.8) and instrumented with the random bonus () in IV-1 or with the empirical winning probability () in IV-2. Robust standard errors, clustered by session, are presented in parentheses.
In view of (5.3), the systematic component of determining the incentive scheme is
which can be approximated by the following utility difference:
| (5.8) |
Furthermore, we decompose into the two parts: observed heterogeneity () and unobserved heterogeneity (). This leads to a regression model of on and . We instrument with the random bonus () or the empirical winning probability () because it is highly likely that is measured with error.
Table 11 reports the resulting estimation results. In column (1), the OLS estimates are reported when the group dummies, age, female are included as regressors in addition to . In columns (2) and (3), the IV estimates are given. The coefficient for is about ten times larger when is instrumented, indicating that its OLS coefficient is attenuated towards zero. The coefficient of for NK in column (2) implies that the NK subjects’ probability of selecting into the tournament goes down by 26 percentage points due to aversion to competition. This magnitude is larger than the reduced-form estimates reported in Table 4. This difference may come from the fact that the risk-loving behavior of some of NK subjects is reflected in computing , thus resulting in a higher degree of aversion to competition for the NK subjects in Table 11 . Women do not show any difference in columns (2) and (3), suggesting that there is little gender-specific aversion to competition beyond the subjective utility difference measured by . This finding resounds well with the reduced-form findings in Tables 4 and 5 where we find a negative but insignificant coefficient for female in terms of selection into tournament but a significantly negative coefficient for subjective winning probability. When the Raven score is added in columns (4)-(6), the coefficients for NK become small and insignificant, echoing the reduced-form estimation results in Tables 4.
The choice model we have developed in this section allows us to disentangle between different channels through which the Raven score can matter for selection into competition. Our estimation results suggest that an individual with a high Raven test score favors competition through (i) a high level of performance in the real-effort task, (ii) optimism in assessing the chance of winning the tournament, and (iii) preference for competition. Quantitatively, one standard deviation increase in the Raven score is associated with (i) an increase of 1.2 correct answers in the real-effort task (see column (3) of Table 8), (ii) an increase of 1.85 in optimism, measured by the odds of subjective probability (; see column (3) of Table 9), and (iii) an increase of 13 percentage points in preference for competition, measured by the change in the probability of selecting into the tournament (see columns (5) and (6) of Table 11). The reduced-form impact of the Raven score—net of the effect of pre-choice tournament score—is 16 percentage points in terms of choice probability (see column (4) and (5) of Table 4). Therefore, a rough comparison implies that the reduced-form effect is due to pure preference for competition as well as optimism in assessing the chance of winning. This conclusion bodes well with the finding that the Raven score explains less winning probability than probability into the tournament in the previous section.
6 Relation to the Literature
Our paper is most closely related to recent literature in economics suggesting that the cultural, economic and political environments in which individuals grow up affect their preference, belief formation and behavior, such as their trust in financial institutions, stock market participation, preferences over social policies, willingness to take financial risks, and anti-Semitic violence, political outcomes, and corruption in courts and police. See, for instance, Alesina and Fuchs-Schündeln (2007), Guiso, Sapienza, and Zingales (2004, 2008), Osili and Paulson (2008), Malmendier and Nagel (2011), Voigtländer and Voth (2012), Grosfeld and Zhuravskaya (2015), and Becker, Boeckh, Hainz, and Woessmann (2016) among others. Alesina and Giuliano (2015) provide a review on the relationship between culture and institutions.
It is also related to a strand of research on the importance of early stage of the life cycle. The literature on immigration finds that immigrants’ home-country institutions matter for their success in the host country; the social norms in their origin country are carried over and dissimilarity from those in the host country retards economic assimilation (Friedberg, 2000; Casey and Dustmann, 2010; Bénabou and Tirole, 2011). The long-term influences of economic and political institutions can also be found in inter-generational differences over the course of history within a country. People embody different attitudes mostly during their school ages. Cantoni, Chen, Yang, Yuchtman, and Zhang (2017) find that political attitudes are instilled by textbook reforms in China. Fuchs-Schündeln and Masella (2016) compare between East Germans and West Germans after the reunification and find that longer exposure to communism is associated with lower investment in human capital and lower wages in the labor market. Fuchs-Schündeln and Schündeln (2020) analyze the long-lasting effects of communism in Eastern Europe. Becker, Mergele, and Woessmann (2020) critically examine the selection problems in the context of the separation and reunification of Germany.
Our study is also related to a growing body of the literature examining differences in competitiveness of different groups in a society or across cultures. Much attention has been paid to gender differences since women tend to underperform in the labor market relative to men with similar ability. It has been found that women are on average less competitive than men in most societies (Gneezy, Niederle, and Rustichini, 2003; Gneezy and Rustichini, 2004; Niederle and Vesterlund, 2007, 2011). However, the opposite phenomenon is observed in a matriarchal society (Gneezy, Leonard, and List, 2009). This indicates that competitiveness is a trait that is not biological but shaped by social institutions. Another piece of evidence supporting the “nurture” hypothesis is that seamen are found to be are less inclined toward competition than fishermen at a lake since the former needs cooperation while the latter tends to work alone (Gneezy, Leibbrandt, and List, 2016). Furthermore, communist reforms promoting a gender egalitarian society may increase female competitiveness in China (Booth, Fan, Meng, and Zhang, 2020; Zhang, 2019) and affect women’s attitudes toward career success in West Germany (Campa and Serafinelli, 2019).
This paper also contributes to the literature that combines traditional lab experiments with historical contexts. Ockenfels and Weimann (1999) and Brosig-Koch, Helbach, Ockenfels, and Weimann (2011) examine East-West comparison in the context of German unification. Callen, Isaqzadeh, Long, and Sprenger (2014) conduct experiments on a sample of Afghanistan civilians to investigate the relationship between violence and economic risk preferences. In our previous work (Kim, Choi, Lee, Lee, and Choi, 2017; Choi, Kim, Lee, and Lee, 2020), we find that the North Korean refugees behave very differently from South Korean natives in terms of preferences for giving in the context of the dictator games.
7 Conclusions
The role of institutions in economic development is widely acknowledged but the channels through which the former affects the latter are not fully understood. We have found that North Korean refugees are significantly less competitive than South Koreans or Korean-Chinese immigrants, and that their lower cognitive ability measured by Raven test scores is a crucial determinant for the deficiency of competitiveness. This indicates that communism failed due to not only the direct effects of institutions such as lack of property rights but also their indirect effects on development. It lagged behind capitalism in terms of individual competitiveness and thus missed an opportunity to fully harness economic efficiencies. Yet such dissimilarity in competitiveness among the three groups of ethnic Koreans is accounted for largely by cognitive ability. We have further discovered that such low cognitive ability of North Korean refugees result in low expectation on performance and winning probability together with increased aversion to competition. In this sense, this paper suggests that one fundamental weakness of communism lies in failure in improving cognitive abilities as a form of human capital. A question on why communism, in comparison with capitalism, was less successful in developing cognitive abilities still remains, which will be our agenda for future research.
References
- (1)
- Abadie (2018) Abadie, A. (2018): “Statistical Non-Significance in Empirical Economics,” Working Paper 24403, National Bureau of Economic Research.
- Abeler, Falk, Goette, and Huffman (2011) Abeler, J., A. Falk, L. Goette, and D. Huffman (2011): “Reference Points and Effort Provision,” American Economic Review, 101(2), 470–92.
- Acemoglu, Johnson, and Robinson (2005) Acemoglu, D., S. Johnson, and J. Robinson (2005): “Institutions as a Fundamental Cause of Long-Run Growth,” in Handbook of Economic Growth, ed. by P. Aghion, and S. Durlauf, vol. 1, Part A, chap. 06, pp. 385–472. Elsevier, 1 edn.
- Alesina and Fuchs-Schündeln (2007) Alesina, A., and N. Fuchs-Schündeln (2007): “Goodbye Lenin (or Not?): The Effect of Communism on People’s Preferences,” American Economic Review, 97(4), 1507–1528.
- Alesina and Giuliano (2015) Alesina, A., and P. Giuliano (2015): “Culture and Institutions,” Journal of Economic Literature, 53(4), 898–944.
- Andersson, Holm, Tyran, and Wengström (2016) Andersson, O., H. J. Holm, J.-R. Tyran, and E. Wengström (2016): “Risk Aversion Relates to Cognitive Ability: Preferences Or Noise?,” Journal of the European Economic Association, 14(5), 1129–1154.
- Barber and Odean (2001) Barber, B. M., and T. Odean (2001): “Boys will be boys: Gender, overconfidence, and common stock investment,” Quarterly Journal of Economics, 116(1), 261–292.
- Bartling, Fehr, Marechal, and Schunk (2009) Bartling, B., E. Fehr, M. A. Marechal, and D. Schunk (2009): “Egalitarianism and Competitiveness,” American Economic Review, 99(2), 93–98.
- Becker, Boeckh, Hainz, and Woessmann (2016) Becker, S. O., K. Boeckh, C. Hainz, and L. Woessmann (2016): “The Empire Is Dead, Long Live the Empire! Long-Run Persistence of Trust and Corruption in the Bureaucracy,” Economic Journal, 126(590), 40–74.
- Becker, Mergele, and Woessmann (2020) Becker, S. O., L. Mergele, and L. Woessmann (2020): “The Separation and Reunification of Germany: Rethinking a Natural Experiment Interpretation of the Enduring Effects of Communism,” Journal of Economic Perspectives, 34(2), 143–71.
- Bénabou and Tirole (2011) Bénabou, R., and J. Tirole (2011): “Identity, Morals, and Taboos: Beliefs as Assets,” Quarterly Journal of Economics, 126(2), 805–855.
- Booth, Fan, Meng, and Zhang (2020) Booth, A., E. Fan, X. Meng, and D. Zhang (2020): “Gender Differences in Willingness to Compete: The Role of Culture and Institutions,” Economic Journal, 129(618), 734–764.
- Brosig-Koch, Helbach, Ockenfels, and Weimann (2011) Brosig-Koch, J., C. Helbach, A. Ockenfels, and J. Weimann (2011): “Still different after all these years: Solidarity behavior in East and West Germany,” Journal of Public Economics, 95(11), 1373–1376.
- Brouwers, Van de Vijver, and Van Hemert (2009) Brouwers, S. A., F. J. Van de Vijver, and D. A. Van Hemert (2009): “Variation in Raven’s Progressive Matrices scores across time and place,” Learning and Individual Differences, 19(3), 330–338.
- Burks, Carpenter, Goette, and Rustichini (2009) Burks, S. V., J. P. Carpenter, L. Goette, and A. Rustichini (2009): “Cognitive skills affect economic preferences, strategic behavior, and job attachment,” Proceedings of the National Academy of Sciences, 106(19), 7745–7750.
- Callen, Isaqzadeh, Long, and Sprenger (2014) Callen, M., M. Isaqzadeh, J. D. Long, and C. Sprenger (2014): “Violence and Risk Preference: Experimental Evidence from Afghanistan,” American Economic Review, 104(1), 123–48.
- Campa and Serafinelli (2019) Campa, P., and M. Serafinelli (2019): “Politico-Economic Regimes and Attitudes: Female Workers under State Socialism,” Review of Economics and Statistics, 101(2), 233–248.
- Cantoni, Chen, Yang, Yuchtman, and Zhang (2017) Cantoni, D., Y. Chen, D. Y. Yang, N. Yuchtman, and Y. J. Zhang (2017): “Curriculum and Ideology,” Journal of Political Economy, 125(2), 338–392.
- Carpenter, Just, and Shell (1990) Carpenter, P. A., M. A. Just, and P. Shell (1990): “What one intelligence test measures: A theoretical account of the processing in the Raven Progressive Matrices Test,” Psychological Review, 97(3), 404–431.
- Casey and Dustmann (2010) Casey, T., and C. Dustmann (2010): “Immigrants’ Identity, Economic Outcomes and the Transmission of Identity across Generations,” Economic Journal, 120(542), F31–F51.
- Charness, Rustichini, and van de Ven (2011) Charness, G., A. Rustichini, and J. van de Ven (2011): “Self-Confidence and Strategic Deterrence,” Tinbergen Institute Discussion Papers 11-151/1, Tinbergen Institute.
- Choi, Kim, Lee, and Lee (2020) Choi, S., B.-Y. Kim, J. Lee, and S. Lee (2020): “A tale of two Koreas: Property rights and fairness,” Journal of Economic Behavior & Organization, 170, 112–130.
- Choi, Kim, Lee, and Lee (2022) Choi, S., J. Kim, E. Lee, and J. Lee (2022): “Probability Weighting and Cognitive Ability,” Forthcoming to Management Science.
- Currie and Almond (2011) Currie, J., and D. Almond (2011): “Chapter 15 - Human capital development before age five,” in Handbook of Labor Economics, ed. by D. Card, and O. Ashenfelter, vol. 4, pp. 1315–1486. Elsevier.
- Dohmen and Falk (2011) Dohmen, T., and A. Falk (2011): “Performance Pay and Multidimensional Sorting: Productivity, Preferences, and Gender,” American Economic Review, 101(2), 556–90.
- Dohmen, Falk, Huffman, and Sunde (2010) Dohmen, T., A. Falk, D. Huffman, and U. Sunde (2010): “Are Risk Aversion and Impatience Related to Cognitive Ability?,” American Economic Review, 100(3), 1238–60.
- Dohmen, Falk, Huffman, Sunde, Schupp, and Wagner (2011) Dohmen, T., A. Falk, D. Huffman, U. Sunde, J. Schupp, and G. G. Wagner (2011): “Individual Risk Attitudes: Measurement, Determinants, and Behavioral Consequences,” Journal of the European Economic Association, 9(3), 522–550.
- Friedberg (2000) Friedberg, R. M. (2000): “You Can’t Take It with You? Immigrant Assimilation and the Portability of Human Capital,” Journal of Labor Economics, 18(2), 221–251.
- Fuchs-Schündeln and Masella (2016) Fuchs-Schündeln, N., and P. Masella (2016): “Long-lasting effects of socialist education,” Review of Economics and Statistics, 98(3), 428–441.
- Fuchs-Schündeln and Schündeln (2020) Fuchs-Schündeln, N., and M. Schündeln (2020): “The Long-Term Effects of Communism in Eastern Europe,” Journal of Economic Perspectives, 34(2), 172–91.
- Gill and Prowse (2016) Gill, D., and V. Prowse (2016): “Cognitive Ability, Character Skills, and Learning to Play Equilibrium: A Level-k Analysis,” Journal of Political Economy, 124(6), 1619–1676.
- Gillen, Snowberg, and Yariv (2019) Gillen, B., E. Snowberg, and L. Yariv (2019): “Experimenting with measurement error: Techniques with applications to the caltech cohort study,” Journal of Political Economy, 127(4), 1826–1863.
- Gneezy, Leibbrandt, and List (2016) Gneezy, U., A. Leibbrandt, and J. A. List (2016): “Ode to the Sea: Workplace Organizations and Norms of Cooperation,” Economic Journal, 126(595), 1856–1883.
- Gneezy, Leonard, and List (2009) Gneezy, U., K. L. Leonard, and J. A. List (2009): “Gender Differences in Competition: Evidence From a Matrilineal and a Patriarchal Society,” Econometrica, 77(5), 1637–1664.
- Gneezy, Niederle, and Rustichini (2003) Gneezy, U., M. Niederle, and A. Rustichini (2003): “Performance in Competitive Environments: Gender Differences,” Quarterly Journal of Economics, 118(3), 1049–1074.
- Gneezy and Rustichini (2004) Gneezy, U., and A. Rustichini (2004): “Gender and Competition at a Young Age,” American Economic Review, 94(2), 377–381.
- Goldstein and Einhorn (1987) Goldstein, W. M., and H. J. Einhorn (1987): “Expression theory and the preference reversal phenomena,” Psychological Review, 94(2), 236–254.
- Grosfeld and Zhuravskaya (2015) Grosfeld, I., and E. Zhuravskaya (2015): “Cultural vs. economic legacies of empires: Evidence from the partition of Poland,” Journal of Comparative Economics, 43(1), 55–75.
- Guiso, Sapienza, and Zingales (2004) Guiso, L., P. Sapienza, and L. Zingales (2004): “The Role of Social Capital in Financial Development,” American Economic Review, 94(3), 526–556.
- Guiso, Sapienza, and Zingales (2008) (2008): “Trusting the Stock Market,” Journal of Finance, 63(6), 2557–2600.
- Heckman (2002) Heckman, J. J. (2002): “China’s Investment in Human Capital,” Working Paper 9296, National Bureau of Economic Research.
- Hilferding (1910) Hilferding, R. (1910): Das Finanzkapital (Finance Capital). Vienna, Wiener Volksbuchhandlung, (Edited by Tom Bottomore from translations made by Morris Watnick and Sam Gordon).
- Holt and Laury (2002) Holt, C. A., and S. K. Laury (2002): “Risk Aversion and Incentive Effects,” American Economic Review, 92(5), 1644–1655.
- Hossain and Okui (2013) Hossain, T., and R. Okui (2013): “The Binarized Scoring Rule,” Review of Economic Studies, 80(3), 984–1001.
- Institute for Unification Education (2014) Institute for Unification Education (2014): “Understanding North Korea,” Discussion paper, Ministry of Unification, Republic of Korea, https://www.unikorea.go.kr/eng_unikorea/news/Publications/understandingNK/;jsessionid=eZAkNqThDjM6lbsStzuCOqJ9.unikorea21#.
- Jianjun (2012) Jianjun, W. (2012): “Curriculum Reform in Mainland China, 1978–2008,” Chinese Education & Society, 45(1), 59–68.
- Kim (2017) Kim, B.-Y. (2017): Unveiling the North Korean Economy: Collapse and Transition. Cambridge University Press, Cambridge.
- Kim, Choi, Lee, Lee, and Choi (2017) Kim, B.-Y., S. Choi, J. Lee, S. Lee, and K. Choi (2017): “Do Institutions Affect Social Preferences? Evidence from Divided Korea,” Journal of Comparative Economics, 45(4), 865–888.
- Kim and Lee (2018) Kim, B.-Y., and J. Lee (2018): “Cognitive Ability and Economic Outcomes of North Korean Refugees,” Korean Journal of Economic Research (in Korean), 66(1), 5–31.
- Malmendier and Nagel (2011) Malmendier, U., and S. Nagel (2011): “Depression Babies: Do Macroeconomic Experiences Affect Risk Taking?,” Quarterly Journal of Economics, 126(1), 373–416.
- Marx (1993) Marx, K. (1993): Grundrisse: Foundations of the Critique of Political Economy. Penguin Classics, (translated, with an introduction, by Martin Nicolaus).
- Niederle and Vesterlund (2007) Niederle, M., and L. Vesterlund (2007): “Do Women Shy Away From Competition? Do Men Compete Too Much?,” Quarterly Journal of Economics, 122(3), 1067–1101.
- Niederle and Vesterlund (2011) (2011): “Gender and Competition,” Annual Review of Economics, 3(1), 601–630.
- Nisbett, Aronson, Blair, Dickens, Flynn, Halpern, and Turkheimer (2012) Nisbett, R. E., J. Aronson, C. Blair, W. Dickens, J. Flynn, D. F. Halpern, and E. Turkheimer (2012): “Intelligence: new findings and theoretical developments,” American psychologist, 67(2), 130–159.
- Ockenfels and Weimann (1999) Ockenfels, A., and J. Weimann (1999): “Types and patterns: an experimental East-West-German comparison of cooperation and solidarity,” Journal of Public Economics, 71(2), 275–287.
- Osili and Paulson (2008) Osili, U. O., and A. L. Paulson (2008): “Institutions and Financial Development: Evidence from International Migrants in the United States,” Review of Economics and Statistics, 90(3), 498–517.
- Pak (2010) Pak, S. (2010): “The growth status of North Korean refugee children and adolescents from 6 to 19 years of age,” Economics & Human Biology, 8(3), 385–395.
- Prokhorov (1981) Prokhorov, A. M. (ed.) (1981): Great Soviet Encyclopedia. New York: Macmillan.
- Roivainen (2012) Roivainen, E. (2012): “Economic, educational, and IQ gains in eastern Germany 1990–2006,” Intelligence, 40(6), 571–575.
- Schwekendiek and Pak (2009) Schwekendiek, D., and S. Pak (2009): “Recent growth of children in the two Koreas: A meta-analysis,” Economics & Human Biology, 7(1), 109–112.
- Van Veldhuizen (2022) Van Veldhuizen, R. (2022): “Gender Differences in Tournament Choices: Risk Preferences, Overconfidence or Competitiveness,” Forthcoming to Journal of the European Economic Association.
- Voigtländer and Voth (2012) Voigtländer, N., and H.-J. Voth (2012): “Persecution Perpetuated: The Medieval Origins of Anti-Semitic Violence in Nazi Germany,” Quarterly Journal of Economics, 127(3), 1339–1392.
- Wu (2010) Wu, X. (2010): “Economic transition, school expansion and educational inequality in China, 1990–2000,” Research in Social Stratification and Mobility, 28(1), 91–108.
- Xu (2011) Xu, C. (2011): “The Fundamental Institutions of China’s Reforms and Development,” Journal of Economic Literature, 49(4), 1076–1151.
- Zhang (2019) Zhang, Y. J. (2019): “Culture, Institutions and the Gender Gap in Competitive Inclination: Evidence from the Communist Experiment in China,” Economic Journal, 129(617), 509–552.
See appendix.pdf