The 2019 outburst of the 2005 classical nova V1047 Cen:
a record breaking dwarf nova outburst or a new phenomenon?
Abstract
We present a detailed study of the 2019 outburst of the cataclysmic variable V1047 Cen, which hosted a classical nova eruption in 2005. The peculiar outburst occurred 14 years after the classical nova event and lasted for more than 400 days, reaching an amplitude of around 6 magnitudes in the optical. Early spectral follow-up revealed what could be a dwarf nova (accretion disk instability) outburst. However, the outburst duration, high velocity (2000 km s-1) features in the optical line profiles, luminous optical emission, and presence of prominent long-lasting radio emission together suggest a phenomenon more exotic and energetic than a dwarf nova outburst. The outburst amplitude, radiated energy, and spectral evolution are also not consistent with a classical nova eruption. There are similarities between V1047 Cen’s 2019 outburst and those of classical symbiotic stars, but pre-2005 images of the field of V1047 Cen indicate that the system likely hosts a dwarf companion, implying a typical cataclysmic variable system. Based on our multi-wavelength observations, we suggest that the outburst may have started with a brightening of the disk due to enhanced mass transfer or disk instability, possibly leading to enhanced nuclear shell burning on the white dwarf, which was already experiencing some level of quasi-steady shell burning. This eventually led to the generation of a wind and/or bipolar, collimated outflows. The 2019 outburst of V1047 Cen appears to be unique, and nothing similar has been observed in a typical cataclysmic variable system before, hinting at a potentially new astrophysical phenomenon.
1 Introduction
Cataclysmic Variables (CVs) are interacting binary systems, each consisting of a white dwarf accreting material from a Roche-lobe-filling companion. The material flowing from the companion forms an accretion disk around the white dwarf before being dumped on its surface. In the case of a highly-magnetized white dwarf ( G), the magnetic field of the white dwarf truncates the inner regions of the disk or even completely prevents it from being formed. In this case the material follows the magnetic field lines onto the surface of the white dwarf. These are known as magnetic CVs (see Warner 1995 for a review). CVs experience several types of cataclysmic events and thermonuclear explosions, hence the name. One of these events is called a dwarf nova (DN) and is a viscosity-induced instability in the accretion disk, resulting in a temporary increase in mass transfer rate and heating the whole disk. DNe manifest as relatively low amplitude outbursts, typically mag up to 9 – 10 mag in some extreme cases (Kawash et al., 2021).
While material builds up on the surface of the white dwarf through secular accretion, the pressure and density increases in its surface layers. Once a critical density is reached, a thermonuclear runaway is triggered on the surface of the white dwarf, leading to an increase in the brightness of the system by up to 15 mag or more in a matter of a few days (Starrfield et al., 1972; Yaron et al., 2005). These events are known as classical novae (see Gallagher & Starrfield 1978; Bode & Evans 2008; Wou 2014; Della Valle & Izzo 2020; Chomiuk et al. 2020 for reviews) and their recurrence timescale is typically thousands of years (Yaron et al., 2005). In some cases, novae recur on shorter timescales – short enough to be recorded more than once. These are called recurrent novae and these systems are usually characterized by a high mass transfer rate, often due to the presence of an evolved secondary (Schaefer, 2010).
After a classical nova event, the mass transfer rate is expected to be high enough to keep the disk in a hot, ionized state, temporarily preventing DNe in the system. Theoretically, DNe are only expected hundreds/thousands of years later, when the mass transfer rate becomes low enough for the disk to cool and again become susceptible to disk instability events. This is implied by the hibernation scenario of CVs (Shara et al., 1986), which suggests that CVs go through cycles of low and high states of mass transfer rate. In this scenario, the states are mostly determined by the irradiation of the secondary by a nova event (which increases the mass transfer rate) and the growing separation between the two stars (which decreases the mass transfer rate). However, several CV systems have shown DN outbursts after classical nova eruptions; e.g., GK Per (Sabbadin & Bianchini, 1983; Bianchini et al., 1986; Zemko et al., 2017; Williams & Darnley, 2018), V1017 Sgr (Sekiguchi, 1992; Salazar et al., 2017), and V446 Her (Honeycutt et al., 1995, 2011) (see Table A.9 for a full list).
1.1 V1047 Cen – the 2019 outburst
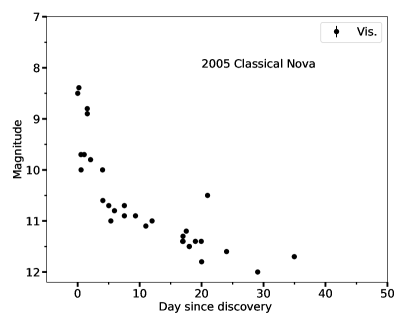
V1047 Cen (Nova Cen 2005) was discovered as a Galactic transient on 2005 September 1.03 at a visual magnitude of around 8.5 (left panel of Figure 1) and later classified spectroscopically as a classical nova eruption (Liller et al., 2005). Walter et al. (2012) reported spectroscopic follow up taken approximately 5 and 7 days after discovery. The spectra showed typical lines of Balmer, Fe ii, and [O i], which are characteristic of a classical nova near optical peak. The Balmer lines showed multiple P Cygni absorption components with blueshifted velocities of around 750 and 1800 km s-1.
Otherwise, V1047 Cen was not extensively observed during the 2005 eruption, and little else is known about the classical nova eruption. Archival observations of the system, taken by the Inner Galactic Disk with MIPS (MIPSGAL; Carey et al. 2009) Survey in the 24 and 70 micron bands, yield a 24-micron average magnitude of 0.72 0.02 mag (Gutermuth & Heyer, 2015). The MIPSGAL survey data were collected between September 2005 and October 2006. The system was also observed by the Wide-field Infrared Survey Explorer (WISE) on February 2010 with IR magnitudes = 11.2, = 9.5, = 4.2, and = 2.2. The high IR brightness early after the outburst could indicate a dust formation event, which are common among classical novae (see, e.g., Strope et al. 2010), as well as, extinction along the line of sight. Additional archival observations by the VISTA Variables in the Via Lactea (VVV) survey between March 2010 and August 2011, show the nova fading from =12.84 to =13.11 (Saito et al., 2012). The Neil Gehrels Swift Observatory (hereafter Swift; Gehrels et al. 2004) observed the classical nova eruption between 2005 and 2008 (Ness et al., 2007). The observations obtained in November 2005 and January 2006 resulted in detections of hard X-rays from strongly absorbed shock emission, which are typically seen in novae during the early weeks/months of the eruption (see, e.g., Mukai et al. 2008; Schwarz et al. 2011; Gordon et al. 2021). The Swift observations obtained in 2008 led to a non-detection in X-rays.
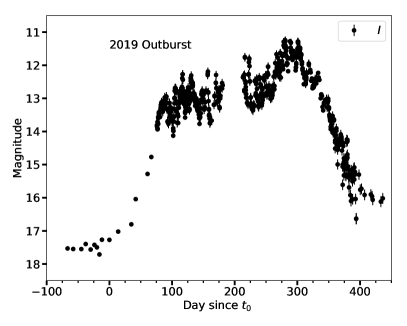
Fourteen years after the 2005 nova eruption, Delgado et al. (2019) reported the discovery of an astronomical transient AT2019hik/Gaia19cfn possibly associated with V1047 Cen on 2019 June 11.6, with a discovery magnitude of 16.2 in the -band. Based on regular monitoring by the Optical Gravitational Lensing Experiment (OGLE; Udalski et al. 2015) survey, Mroz & Udalski (2019) confirmed that the FK5 J2000 equatorial coordinates of the transient ( = [13h20m49s.78, –62∘37′50″.6]) were consistent with those of V1047 Cen. They found that the re-brightening of the system started as early as 2019 April 6.11 (HJD 2458579.61; right panel of Figure 1). This date is considered as the outburst start () throughout this paper. Mroz & Udalski (2019) noted that the slow re-brightening of the system was inconsistent with a recurrent nova eruption. The re-brightening of the system triggered follow-up observations across the electromagnetic spectrum. Aydi et al. (2019a) reported optical spectroscopy, which showed DN outburst spectral features superimposed on the spectral features of a classical nova nebula. Geballe et al. (2019) reported infrared spectroscopy of the then ongoing outburst, during its first 160 days, concluding that the event was possibly a DN outburst. However, upon further follow-up, the 2019 outburst of V1047 Cen seems to be a more exotic phenomenon.
Here we report on multi-wavelength follow-up of the 2019 outburst of V1047 Cen spanning the spectrum from X-ray to radio. In Section 2 we present the observations and data reduction. In Section 3 we show our results, while in Section 4 we offer discussion about the nature of the event and its peculiar observational features. Our conclusions are given in Section 5.
2 Observations and data reduction
2.1 Optical and near-IR photometry
V1047 Cen has been observed by the OGLE sky survey (Udalski et al., 2015) since May 2013, several years before the outburst, as part of the OGLE Galaxy Variability Survey (GVS). All data were taken in the band with an exposure time of 30 s, and they were reduced and calibrated using the standard OGLE pipeline (Udalski et al., 2015). A sample of the observations is listed in Table A.1.
Optical photometry between days 76 and 437 was performed in the bands by several observers from the American Association of Variable Star Observers (AAVSO; Kafka 2020). The bulk of the multi-band photometry comes from two observers, Gordon Meyer and Josch Hambsch. A sample of the observations is listed in Table A.2.
We obtained SMARTS Andicam photometry in the , and bands on 29 nights between days 80 and 117. Data reduction is described in Walter et al. (2012). A sample of the observations is listed in Table A.3. The Andicam instrument was retired on 2019 August 1 (day 117). We also make use of IR photometry from the enhanced Wide-field Infrared Survey Explorer (NEOWISE; Mainzer et al. 2011) covering only three epochs during the outburst in the (3.35 m) and (4.60 m) bands. A log of the observations is listed in Table A.4.
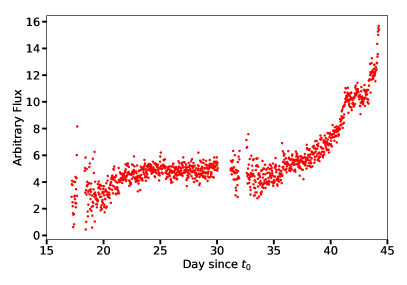
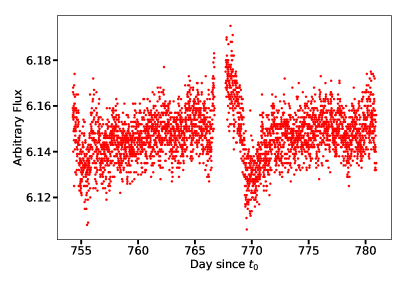
The field of V1047 Cen was observed by the Transiting Exoplanet Survey Satellite (TESS; Ricker et al. 2015) during sectors 11, which covers the early rise of the 2019 outburst between days 17 and 44, and sector 38 covering the post-outburst period between days 753 and 781. We used the open-source tool ELEANOR (Feinstein et al., 2019) to extract light curves from the TESS full-frame images, opting to utilize the corrected flux light curve and to only include data that are not associated with a quality flag.
All the data will be available as online material. All multi-band photometry is calibrated using the Vega system zero points.
2.2 Optical and IR spectroscopy
We obtained optical and IR spectroscopic observations of the 2019 outburst between days 74 and 643 using a diverse group of telescopes and instruments. A log of the spectral observations is presented in Table A.5.
We obtained spectra using the High Resolution Spectrograph (HRS; Barnes et al. 2008; Bramall et al. 2010, 2012; Crause et al. 2014) and the Robert Stobie Spectrograph (RSS; Burgh et al. 2003; Kobulnicky et al. 2003) mounted on the Southern African Large Telescope (SALT; Buckley et al. 2006; O’Donoghue et al. 2006) in Sutherland, South Africa. HRS was used in the low resolution LR mode, yielding a resolving power 14,000 over the range 4000 – 9000 Å. The primary reduction of the HRS spectroscopy was conducted using the SALT science pipeline (Crawford et al., 2010), which includes over-scan correction, bias subtraction, and gain correction. The rest of the reduction was done using the MIDAS FEROS (Stahl et al., 1999) and (Ballester, 1992) packages. The reduction procedure is described by Kniazev et al. (2016). RSS was used in long-slit mode with the 1.5 arcsec slit and the PG900 grating, resulting in a resolving power . The spectra were first reduced using the PySALT pipeline (Crawford et al., 2010), which involves bias subtraction, cross-talk correction, scattered light removal, bad pixel masking, and flat-fielding. The wavelength calibration, background subtraction, and spectral extraction were done using the Image Reduction and Analysis Facility (IRAF; Tody 1986).
We also carried out low- and medium-resolution optical spectroscopy using the Goodman spectrograph (Clemens et al., 2004) on the 4.1 m Southern Astrophysical Research (SOAR) telescope located on Cerro Pachón, Chile. The observations were carried out in two setups: one setup using the 400 l mm-1 grating and a 0.95″ slit, yielding a resolving power 1000 over the wavelength range 3820–7850 Å. Another setup was used with a 2100 l mm-1 grating and a 0.95″ slit, yielding a resolving power 5000 in a region centered on H that is 570 Å wide. The spectra were reduced and optimally extracted using the apall package in IRAF.
Four high-resolution spectra were also obtained using the Chiron fiber-fed echelle spectrograph (Tokovinin et al., 2013) mounted on the CTIO 1.5m telescope. Integration times were 20 minutes, with three integrations per night summed for 1 hour net exposure time. All spectra were taken in “fiber mode”, with 4x4 on-chip binning yielding a resolving power 27,800. The data were reduced using a pipeline coded in IDL (Walter 2017)111http://www.astro.sunysb.edu/fwalter/SMARTS/CHIRON/ch_reduce.pdf.
2.3 Infrared spectroscopy
Near-infrared spectra of V1047 Cen were obtained at the Gemini South Telescope on Cerro Pachon in Chile on days 223 and 230 using the facility instrument FLAMINGOS-2, for program GS-2020A-Q-201. The observations are summarized in Table A.6,. The 0.36” wide slit and R3000 grism were employed to obtain spectra at resolving powers, , of up to 3000 in portions of the and windows. The JH R1200 grism was used with the same slit to obtain a spectrum covering 0.89-1.75 m. Note that for each grism there is considerable variation in across each wavelength interval. (see Ref.222http://www.gemini.edu/instrumentation/flamingos-2/components#Grisms). Data reduction employed standard near-infrared techniques utilizing both Gemini/IRAF and Figaro commands (Shortridge et al., 1992). Flux calibrations, derived from spectra of the standard stars listed in Table A.6 and are accurate to 30%.
NASA SOFIA (Stratospheric Observatory for Infrared Astronomy; Young et al., 2012) airborne observations of V1047 Cen were obtained with the the Faint Object InfraRed CAmera (FORCAST; Herter et al., 2018), the dual-channel mid-infrared imager and grism spectrometer operating from 5 to 40 µm on two separate, consecutive flight series on 2019 July 02.542 UT (F0589) 03.559 UT (F0590), days 88 and 89, using the G111 and G227 grisms with the instrument configured using a long-slit (47 191″), yielding a spectral resolving power 140–300. the G111 grating was used to observe V1047 Cen both nights. Standard pipeline processed and flux calibrated data (for details of the reduction processes see Clarke et al., 2015) were retrieved for science analysis from the Infrared Processing and Analysis Center (IPAC) Infrared Science Archives (IRSA). The data products contain a computed atmospheric transmission model appropriate for the flight altitudes which were used to mask-out spectral points in the observed spectral energy distributions where the atmospheric transmission was 70%. Within the statistical errors, no variations between the G111 data sets obtained on the two different nights were noted, hence these data were averaged into a single resultant spectrum.
2.4 MeerKAT observations
We observed the field of V1047 Cen with the MeerKAT radio interferometer (Jonas & MeerKAT Team, 2016) 15 times between days 277 and 700. Observations were taken with the 64 antenna array at a central frequency of with a bandwidth. Each observation consisted of 15 minutes integration on the field of V1047 Cen with two minutes on the phase calibrator J1424–4913 before and after. J1939–6342 was used to set the flux scale and calibrate the bandpass response of the instrument. Data were reduced using the OxKAT (see Heywood 2020 for details) reduction scripts, which include recipes for both phase reference and amplitude and phase self-calibration. The typical noise in a region of our images without obvious emission is 35 /beam. A log of the MeerKAT observations is given in Table A.7
2.5 Swift observations
Observations of V1047 Cen with Swift commenced on 2019 June 24, 79 days after the re-brightening start. The UV/Optical Telescope (UVOT; Roming et al. 2005) detected emission across all three UV filters (: central wavelength of 2600 Å; : 2246 Å; : 1928 Å; a sample of the observations is listed in Table A.8). No X-ray emission was detected with the X-ray Telescope (XRT; Burrows et al. 2005), however. A second observation was performed a month later (day 109), followed by approximately weekly observations from day 123 until day 420 after the start of the outburst. Throughout this time, a variable UV source was detected, while no individual observations showed significant X-ray emission. Co-adding the full 50 ks of XRT data, a faint X-ray source with a count rate of 2.8 10-4 count s-1 was detected. However, with only 16 counts in the source extraction region, no spectral analysis can be sensibly performed.
3 Results
3.1 Optical/UV light curves
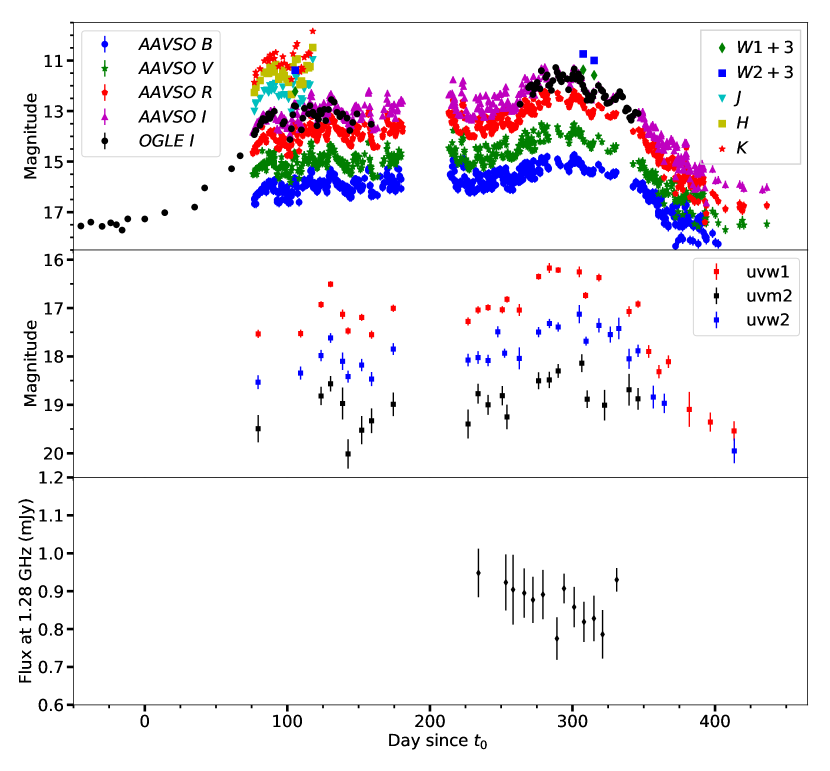
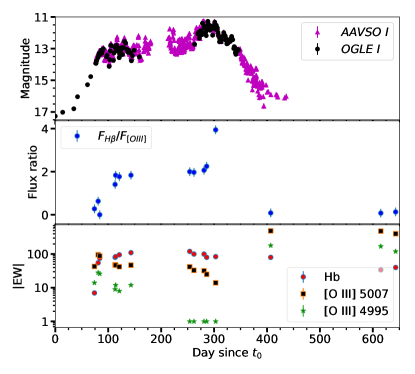
The AAVSO (), OGLE , and Swift UV light curves of V1047 Cen are presented in Figure 2. The data reveal peculiar behavior, with the outburst lasting for around 400 days. There is a general trend of increased brightness between days 0 and 310, before the brightness of the system starts decreasing. Throughout the 400 day outburst, the light curves show variability on timescales of a few days and with amplitude of 1 magnitude. Based on the OGLE data the amplitude of the outburst reached 6.2 magnitudes (Figure 1).
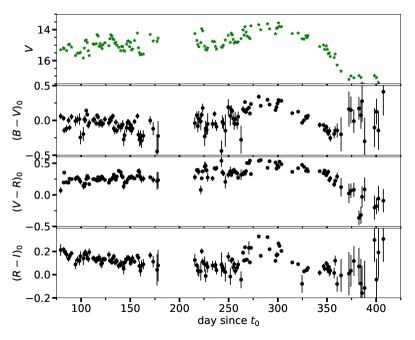
The evolution of the optical broadband colors , , and is presented in Figure 3. We applied a reddening correction based on the extinction derived in Section 4.1. The colors show random fluctuations around a mean value throughout the majority of the outburst. However, on day 250, the three colors show a noticeable redward trend, coincident with a bump in the optical light curves. This is followed by a blueward trend after day 300, as the outburst ends.
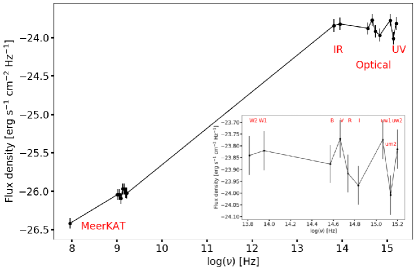
We have near-IR photometry only for a short period near the start of the plateau. Aside from a trend toward redder colors as the source brightened (between days 76 and 82, corresponding to late part of the rising phase), the near-IR colors were fairly stable, at , , and . We use our data to create multi-wavelength SED of V1047 Cen during the 2019 outburst. Despite our extensive coverage of the outburst, we do not have simultaneous optical, IR, UV, and radio data except for one day (day 308), where we have simultaneous optical, UV, and NEOWISE NIR photometry, along with MeerKAT radio data (see Figure 4). Since the brightness of the system shows variability, up to 1 mag in a couple of days, we avoid any interpolation of the light curve to create SEDs on other days. We attempted blackbody fit to the multi-wavelength SED, but no blackbody model can result in a reasonable fit to the data and we end up with poor fitting even in the case of multiple blackbody components. This indicates complex emission, possibly from multiple sources (e.g, the nebula of the 2005 nova event, the white dwarf surface, the accretion disk, and ejected material/outflow during the 2019 outburst). Similarly, we attempted disk model fitting to the multi-wavelength SED, but no disk model with reasonable parameters (e.g., mass accretion rate and disk radius) could fit the data, particularly due to the high brightness of V1047 Cen during outburst relative to accreting white dwarf systems. Whether we include the MeerKAT data or not, the mass accretion rate resulting from the best fit disk model to the SED is of the order of M⊙ yr-1, which is not physically reasonable. This shows that accretion alone is not enough to explain the emission during the outburst, again raising questions about its nature.
The sector 11 TESS light curve of V1047 Cen, presented in Figure 5 (left panel), shows the early rise of the outburst between days 17 and 44. Aydi et al. (2019b) reported a period of 0.36 days in the TESS light curve. However, after extracting the data using different techniques and performing period analysis on the different light curves, we failed to find the period in some of these light curves. This indicates that the 0.36 days period is possibly an artifact introduced by the extraction technique or it is caused by emission leaking into the aperture from background, unresolved sources. This period is also not present in the TESS data from sector 38 (Figure 5, right panel), which covers the post-outburst period between days 753 and 781.
3.2 Radio light curve and spectral indices
The MeerKAT radio light curve is plotted in Figure 2. The -band (900 - 1670 MHz) flux shows variability between 0.7 and 1.0 mJy during the optical outburst. There is no obvious correlation between the optical and radio emission. At day 700, ten months after the end of the optical outburst, the radio emission from the system is still bright at 0.91 mJy (Figure 6).
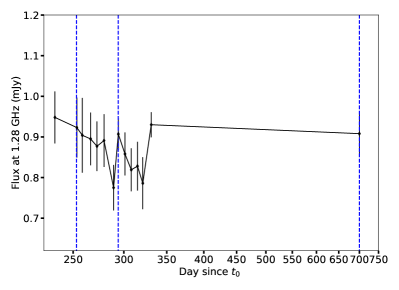
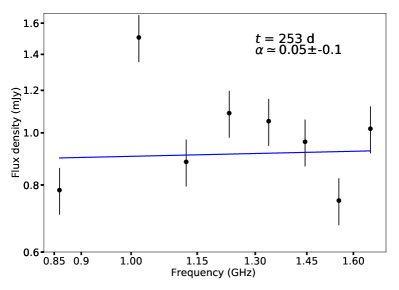
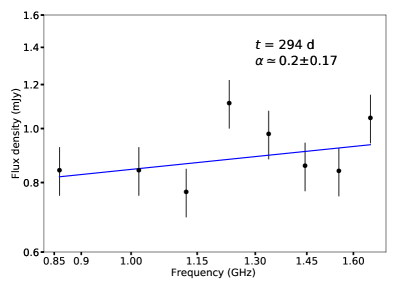
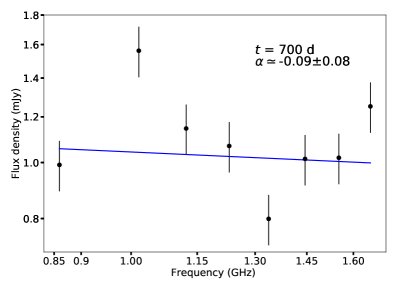
We derived the spectral indices of the MeerKAT observations on days 258, 301, and 421 (Figure 6). To do that, we divided the data into eight frequency intervals centered at 859 MHz, 1.016 GHz, 1.123 GHz, 1.230 GHz, 1.337 GHz, 1.444 GHz, 1.551 GHz, and 1.658 GHz, allowing us to measure the flux density of the source at each sub-band. Consequently we calculated the spectral index, , by fitting a single power law to the radio spectra that is represented as: . We note that the sub-band calibration for MeerKAT is still an active area of exploration, and hence the systematic uncertainties on the sub-band flux densities may yet be underestimated. While the spectrum is mostly flat, given the large uncertainties in the spectral indices, caution is required when interpreting these indices. Overall, it is hard to draw strong conclusions from these values, other than that the radio emission is not optically thick. We elaborate more on the origin of the radio emission in Section 4.
3.3 Optical spectral evolution
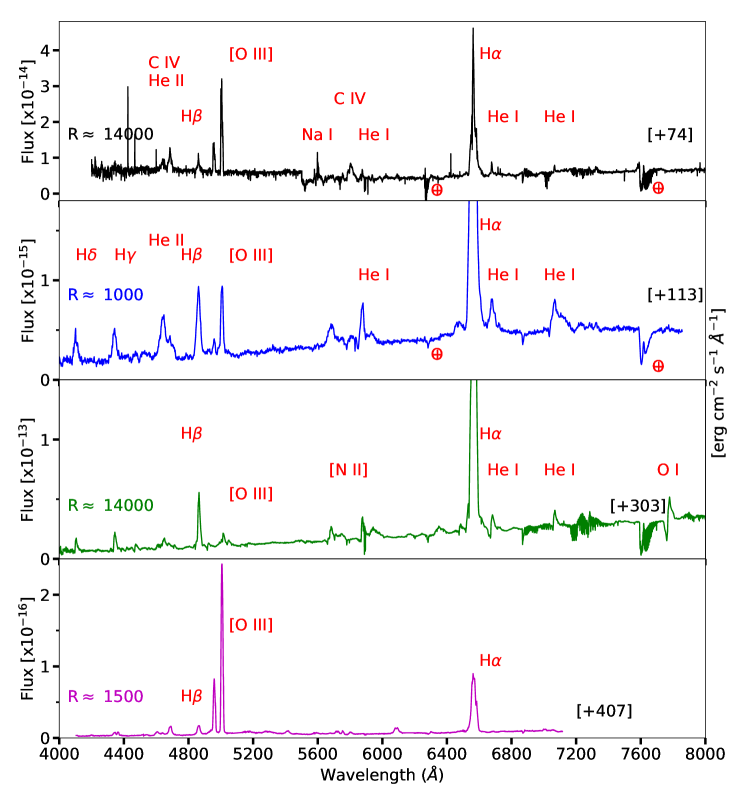
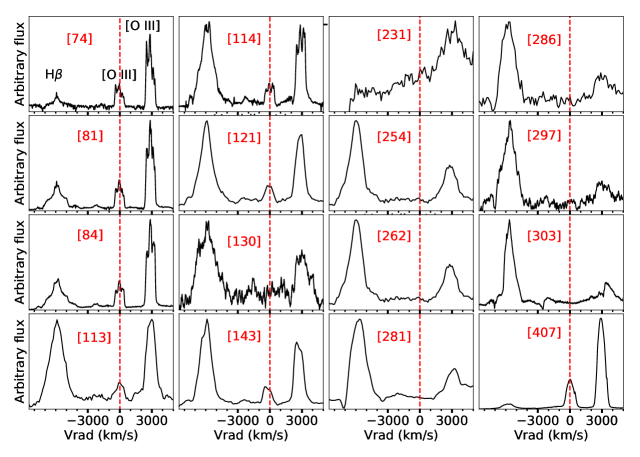
In Figure 7 we present a sample of the optical spectra, evolving throughout the outburst of V1047 Cen and covering three stages: the rise (day 74), the plateau phase (days 113 and 303), and the post-outburst (day 407). The full spectral evolution is presented in Figures A.1 to A.5. The first spectrum, obtained 74 days after the start of the outburst, shows relatively narrow emission lines of H (Balmer), He i and He ii, with Full Widths at Half Maximum (FWHMs) 300 km s-1 and Full Widths at Zero intensity (FWZIs) of around 500 km s-1, which are typical features of a DN outburst (e.g., Morales-Rueda & Marsh 2002) and low for classical nova eruptions. These features co-exist and are superimposed on top of broader emission lines of H, [O iii], and C vi, with FWZIs of around 2500 km s-1 for the Balmer lines and 1100 km s-1 for the [O iii] lines, which are characteristic of a classical nova nebula (likely arising in the remnant of the 2005 nova eruption). We also identify an even narrower feature in the Balmer lines, during the first two spectral epochs (days 74 and 81), characterized by FWHMs of 40 km s-1 (see Figures 8 and A.8). We do not have a definite explanation for the origin of these narrow features.
By day 113, the fluxes of the Balmer lines had increased significantly relative to the [O iii] lines; compare on day 74 with 15 on day 113 (e.g., increased from 0.35 on day 74 to 3.1 on day 113; see Figure 9 for a direct comparison between the evolution of H and the [O iii] lines). The high-resolution spectra show that the Balmer and [O iii] line profiles are very different from one another, with the [O iii] lines (in the high-resolution spectra) having rectangular shapes and jagged tops, characteristic of nova nebular lines. In contrast, H shows complex profiles which vary throughout the outburst. The Balmer lines also had significantly broadened from day 113, with the FWZIs increasing by a factor of 2 compared to day 74, reaching 4000 – 4500 km s-1 (Figures 8 and 9). Note that a broad base in H can be observed as early as day 81 but it becomes prominent from day 113 onwards.
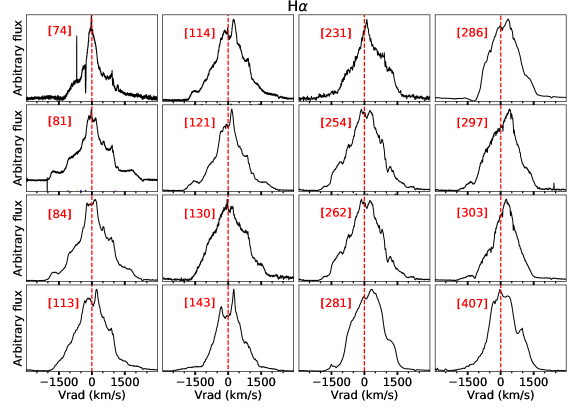
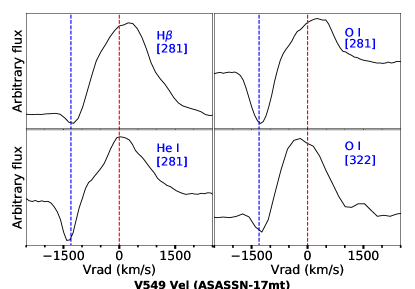
From day 130, some of the He i emission lines show P Cygni profiles with absorption troughs at blueshifted velocities of around 1400 km s-1 (Figures A.2 and A.3).
Between days 262 and 303 O i and N ii emission lines emerge, while the [O iii] nebular lines fade relative to the other spectral lines. At this stage, in addition to the He i emission lines, Balmer, N ii and O i emission lines also show P Cygni profiles with absorption troughs at velocities of around to km s-1 (Figure 10). During the same period, particularly on days 281 and 286, the optical spectra which extend above 8000 show broad double-peaked emission of O i at 8446 with FWZIs of around 3600 km s-1 (Figure A.7). The O i P Cygni profile at 7773 and the double-peaked O i 8446 are not typical features of DN outbursts (Morales-Rueda & Marsh, 2002).
After the end of the optical outburst, the spectrum obtained on day 407 shows substantial changes (Figure 7), with the [O iii] emission lines now dominating the spectrum relative to the Balmer lines. In Figure 11 we show the evolution of the line ratio between the [O iii] line at 5007 and H and the evolution of the equivalent width of H, [O iii] 5007 , and [O iii] 4995 emission lines. It is remarkable how the [O iii] lines were still relatively strong during the rise of the 2019 outburst, but fade throughout the outburst, before strengthening again relative to the Balmer lines by the end of the outburst.
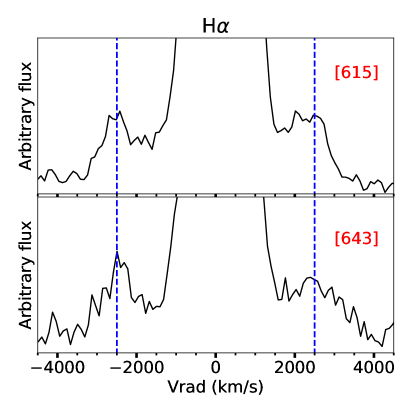
Half a year later, our spectra on days 615 and 643 still show strong [O iii] lines, in addition to other lines, which likely originate in the 2005 classical nova nebula, such as [O ii] 7320 , [N ii] 5755 , and high ionization [Fe vii] lines (Figure A.5).
Our last spectrum taken on day 774, more than 2 years after the start of the 2019 outburst, shows in addition to the 2005 nova nebular lines, weak lines from high ionization transitions of He, N, O, and C, such as the He ii lines at 4686 and 5412 , N v 4603 , O v 5920 , C iv 5802 , and O iv 7713 or Ne iv 7716 (Figure A.6). Such lines have been observed in systems like V617 Sgr and V Sge and are associated with nuclear shell burning (e.g., Herbig et al. 1965; Cieslinski et al. 1999; Steiner et al. 1999).
3.4 IR spectral evolution
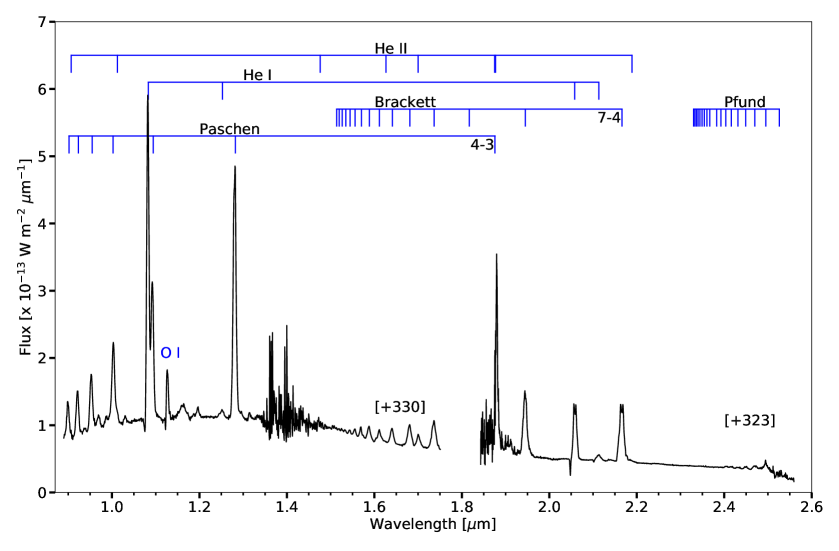
The Gemini and SOFIA IR spectra are represented in Figures 13 and 14, respectively. A detailed description and analysis of the IR spectral evolution during the first 120 days of the outburst is presented in Geballe et al. (2019). The Gemini spectra obtained on day 323 show emission lines of H i (Paschen, Brackett, and Pfund series), He i, He ii, and O i. The FWZIs of the lines are around 4000 km s-1, similar to the ones measured from the optical spectral lines. The O i line at 1.1289m and some of the H i and He i lines show P Cygni profiles with absorption troughs at blue-shifted velocities of 1100 to 1800 km s-1, also comparable to the ones measured for optical lines (Figure 10).
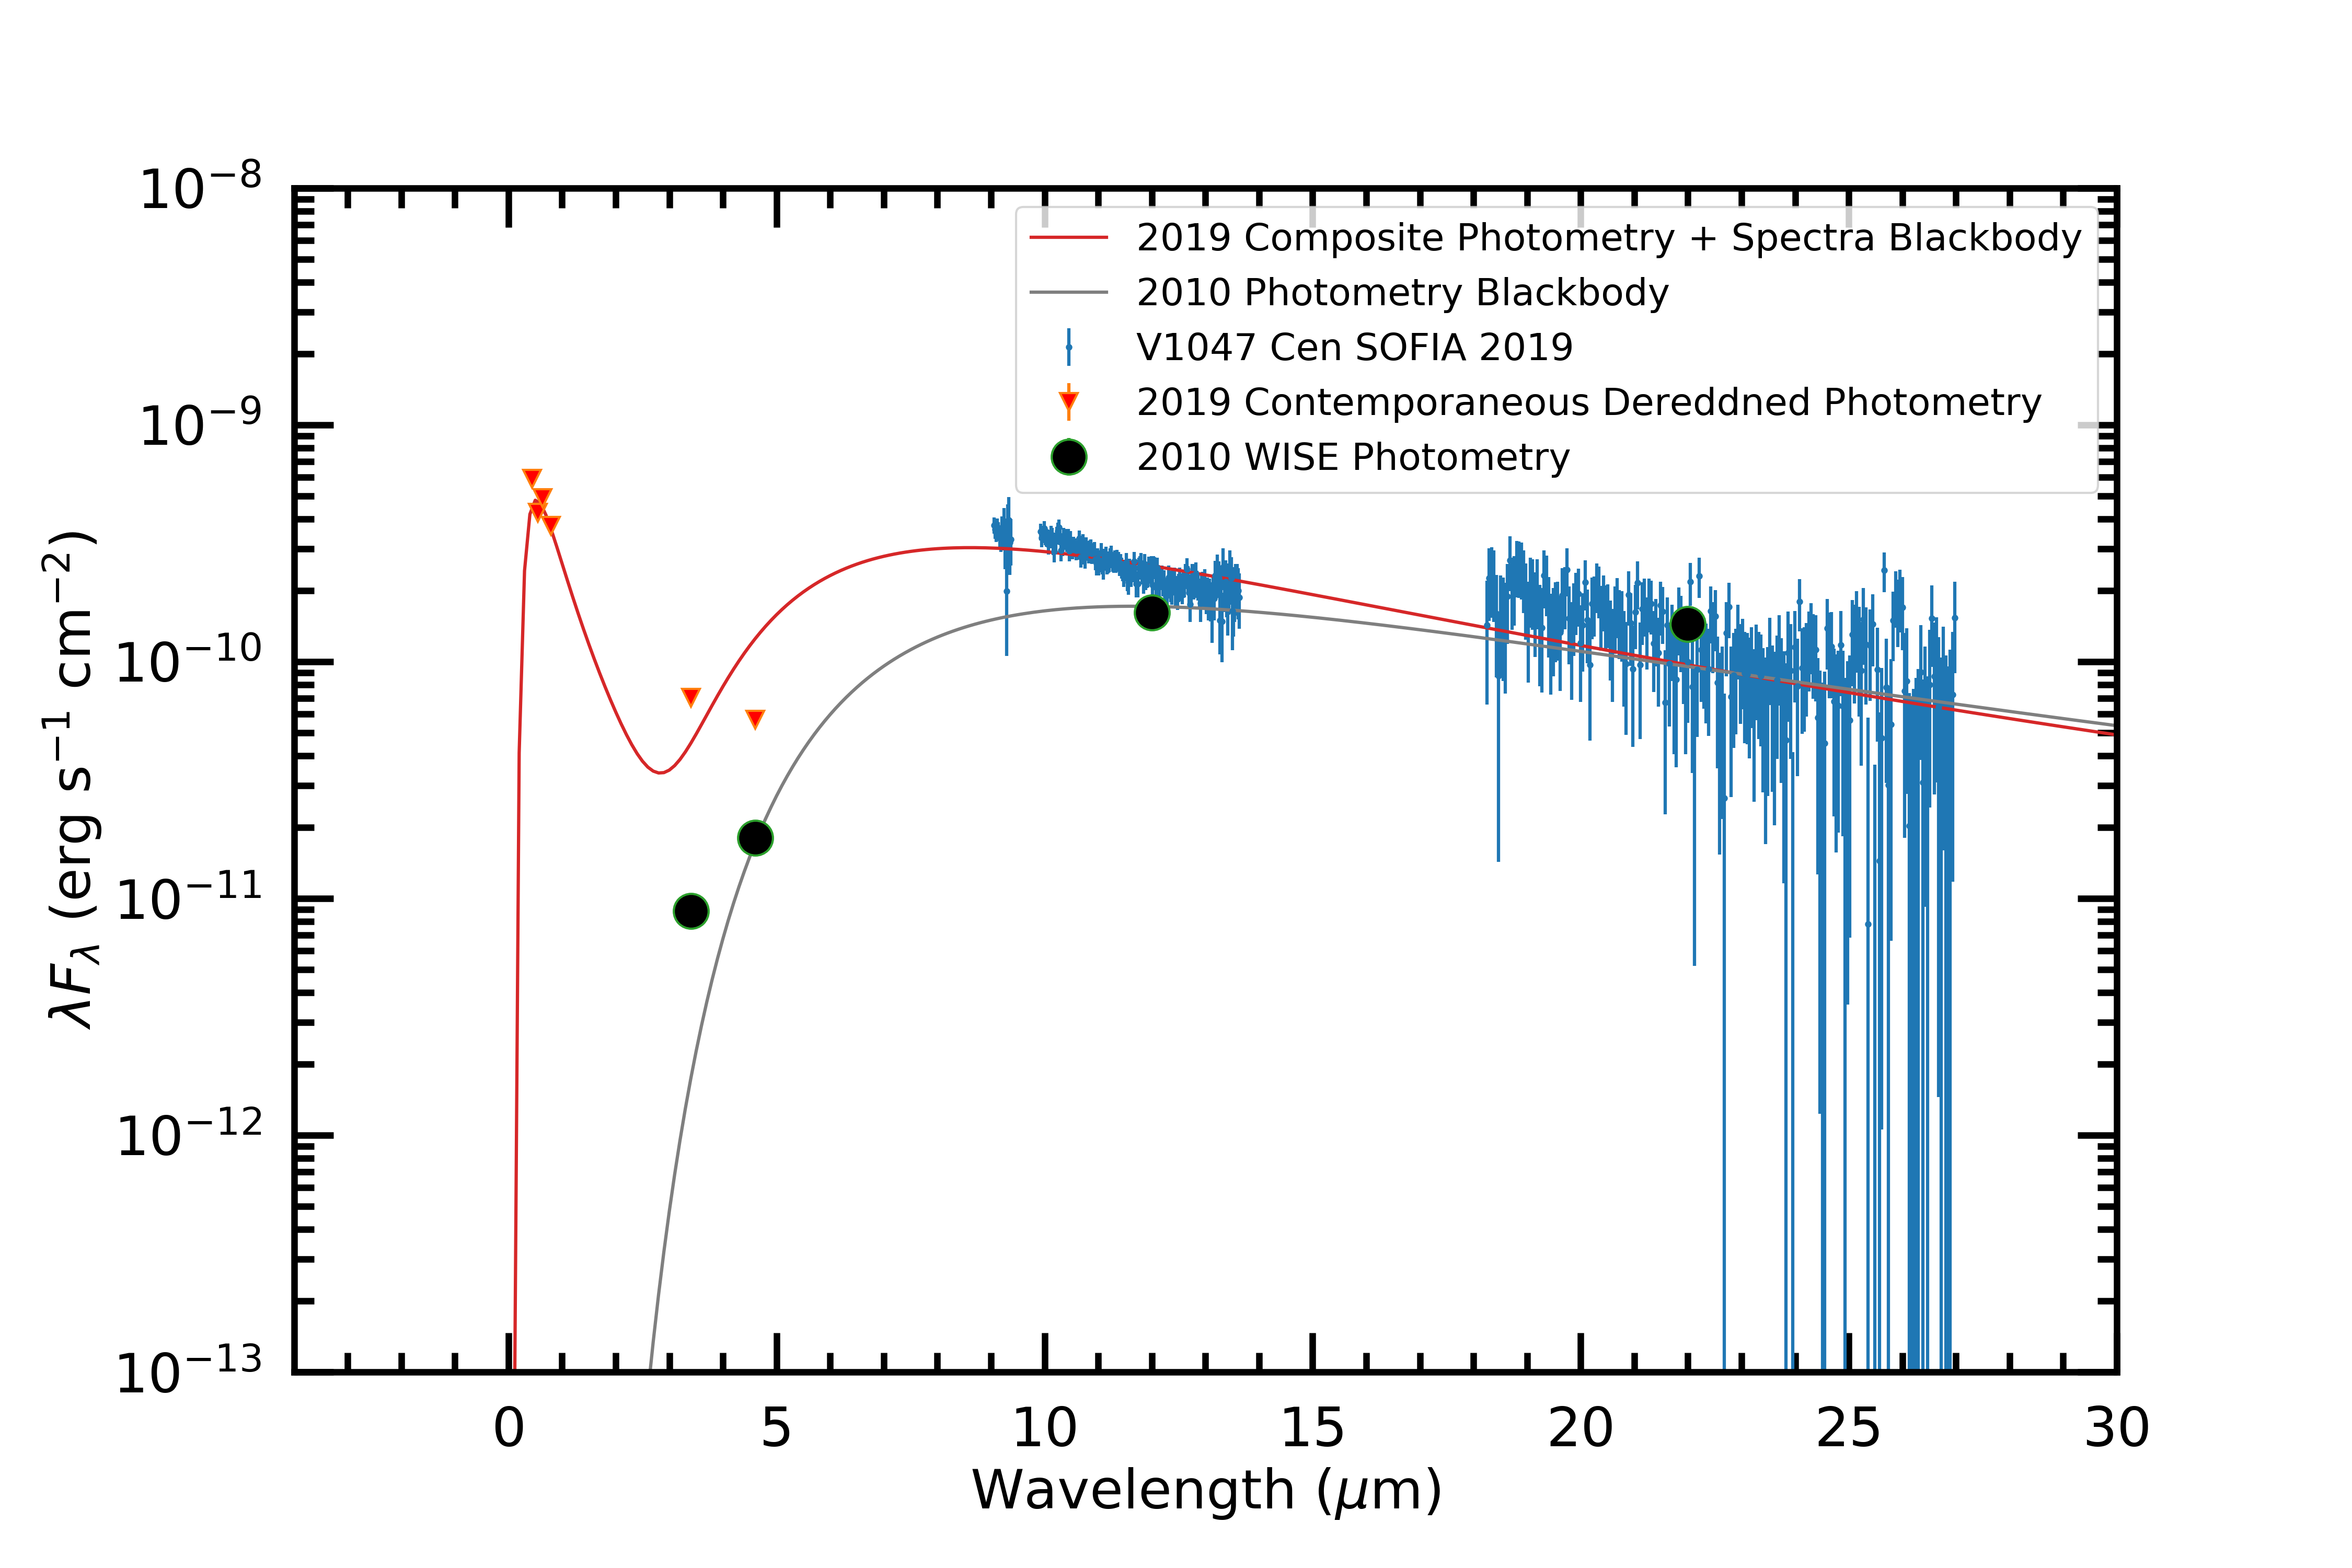
Figure 14 presents the SOFIA composite spectra obtained on day 87, including contemporaneous, dereddened (see § 4.1) photometry obtained from the AAVSO database, as well as NEOWISE photometry obtained 18 days later. A blackbody fit to the 2019 SOFIA spectra yields T K, which we interpret as thermal emission from circumstellar material heated by the outburst event. WISE photometry obtained in 2010 (prior to the eruption) is also plotted and a blackbody fit to this photometry yields a cooler temperature of T K. Thus the circumstellar material (dust, likely from the 2005 nova event) has been heated as a result of processes related to the 2019 outburst. The SOFIA spectra show no evidence for strong H or He i emission lines on day 87. However the [O IV] 25.91 µm fine structure line, frequently seen in other novae (Gehrz et al., 2015; Evans & Gehrz, 2012; Helton et al., 2012) is marginally detected. A Gaussian fit gives a line flux of . The upper level of this line is collisionally de-excited at electron densities () in excess of cm-3 (for an electron temperatures of K); the presence of the line therefore indicates that the electron density in the region where the line is produced is less than this value.
4 Discussion
4.1 Reddening and distance
In order to derive the reddening towards the system, we use the equivalent widths of several absorption lines from diffuse interstellar bands, in combination with the empirical relations from Friedman et al. (2011). We derive an average mag and mag for , in good agreement with the results of Geballe et al. (2019). We avoid using the interstellar Na i D absorption doublet due to saturation. This is much smaller than the values derived from the Galactic reddening maps of Schlafly & Finkbeiner (2011), which estimate mag towards the system. However, the measurements from Schlafly & Finkbeiner (2011)’s reddening maps should be considered an upper limit on the reddening along the line of sight. In addition, at Galactic latitude deg, which is the case for V1047 Cen, the reddening estimates of the maps are not reliable.
The Gaia parallax measurement of V1047 Cen suffers from large uncertainties. The latest Gaia EDR3 parallax of the system is 0.3380.249 mas (Gaia Collaboration et al., 2021). With a flat prior (Galactic latitude-based priors are not appropriate for novae), this implies a distance of kpc, which is not a useful constraint.
Due to the high uncertainty in the Gaia parallax, we use the three dimensional Galactic reddening maps from Chen et al. (2019) and our measured reddening value to estimate the distance to V1047 Cen. The reddening map uses measurements from the Gaia DR2, 2MASS and WISE surveys. Therefore, we converted the previously derived measurement to reddening values in the 2MASS filters and the Gaia DR2 , , and bands, using the extinction law from Wang & Chen (2019) and Chen et al. (2019). We derive , , and mag. Using these reddening values, we derive an average distance of kpc, consistent with the Gaia parallax distance within its large uncertainties. The above uncertainty for the reddening-based distance likely underestimates the systematic uncertainties in this calculation.
4.2 Evolutionary stage of the secondary
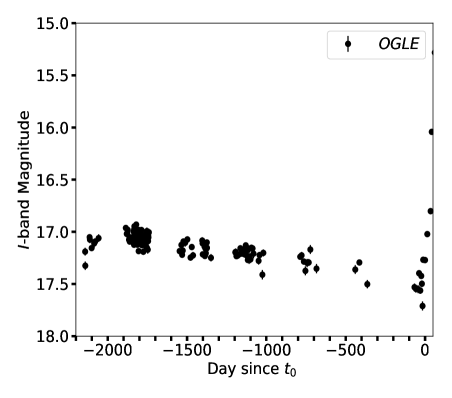
The average - and -band magnitudes as measured by OGLE long after the nova, between 2013 and 2018, are = 17.1 and = 17.5 mag. The post-nova color index is then = 0.380.07, implying , which is bluer for a typical CV system, implying a potential contribution from ongoing nuclear burning on the white dwarf. In Figure 15 we show the OGLE light curve during the six years prior to the 2019 outburst. Adopting a distance of 3.2 kpc, = 3.1 mag, and = 1.46 mag, we derive mag and mag during the post-nova period. In addition to the companion star, we also expect contributions from the accretion disk, hot spot, the 2005 nova nebula, and any possible ongoing nuclear burning. Therefore, using the optical magnitudes/colors between 2005 and 2019 to constrain the evolutionary stage of the companion star is not straightforward.
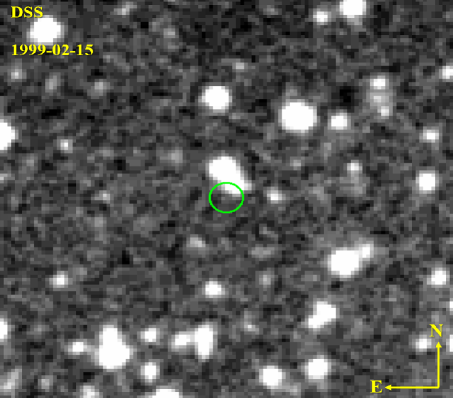
The system is not listed in the USNO-B1.0 catalog (Monet et al., 2003), and is not apparent in visual inspection of blue or red plates of the Digitized Sky Survey (DSS; Figure 15). Since the completeness level of USNO-B1.0 is roughly –21 mag, the absolute magnitude of the system during quiescence (pre-2005) should be 5 mag (at least 3 magnitudes fainter than the post-2005 nova brightness). This rules out anything more luminous than a main-sequence secondary and favors a typical CV system with an orbital period of the order of a few hours (Darnley et al., 2012). However, if the distance and extinction we derive are underestimated, the secondary star might be more evolved; If we assume a distance 6 kpc (closer to the upper limit of the distance estimated from the Gaia parallax), and 5 mag (note that the Schlafly & Finkbeiner 2011 maps estimates 35 mag in the direction of the system), we derive an absolute quiescent magnitude brighter than 2 magnitudes in the -band – implying a more evolved companion star (e.g, a sub-giant).
4.3 The 2005 eruption vs the 2019 outburst
The 2005 nova eruption reached an apparent magnitude of around 8 mag in the visual, compared to a peak -band magnitude of 13.5 for the 2019 outburst (Figures 1 and 2). These translate to an absolute visual magnitude of for the 2005 eruption and for the 2019 outburst, using and a distance of 3.2 kpc (see Section 4.1).
The energy radiated during the 2005 nova eruption can be estimated by integrating the Eddington luminosity of the WD over the period of the eruption. The Eddington luminosity of a 1 M⊙ WD is of the order of 1038 erg s-1. Novae emit close to Eddington (and in many cases super-Eddington) luminosity for months up to years (Starrfield et al., 2008). As a conservative estimate, we will assume emission at Eddington luminosity over 100 days. Note that the Swift follow up of the 2005 nova event, 5 months after the discovery, showed hard X-ray emission which is typically detected prior to the X-ray supersoft phase (see, e.g., Gordon et al. 2021). Therefore, it is likely that the nova radiated at near Eddington luminosity for longer than 100 days. Over 100 days, the amount of energy radiated by the 2005 nova event is of the order of 1045 erg. This is only the energy radiated, but a considerable portion of the energy during a nova goes into kinetic energy of the ejecta (e.g., Gallagher & Starrfield 1976). Therefore, the energy output during the 2005 nova event is at least a few times 1045 erg — a very conservative estimate. For the 2019 outburst, determining the energy output is not straightforward, given that the event might be a combination of mechanisms, starting with a disk re-brightening, due to enhanced mass transfer or disk instability, leading to ejection of material.
There is no model that describes well the emission during the 2019 event, hence, given the lack of appropriate models, we will assume blackbody emission, which should be a fair assumption for the purpose of the rough estimates we are trying to derive. At a distance of 3.2 kpc and mag, a blackbody with K and 1.5 cm should have an apparent -magnitude of 15.0. This is comparable to the average maximum -band magnitude throughout the 2019 outburst. Such a blackbody has a bolometric luminosity of a few times 1036 erg s-1. Assuming that this blackbody emission represents most of the luminosity, the total energy radiated during the 2019 outburst would be 1044 erg in 400 days. This could be an overestimate given that the peak average magnitude of 15.0 lasted for 200 days only and the outburst showed 100 days of rise and 100 days of decline. So, the actual energy radiated is possibly less than 1044 erg, based on the blackbody emission. But given the uncertainty on the Bolometric Correction and given that we do not take into account the kinetic energy of potential material ejection, we will assume 1044 erg to be a rough estimate for the total energy output of the 2019 outburst. This shows that the 2005 nova event is at least an order of magnitude more energetic than the 2019 outburst, proving that the two events are of distinct natures.
The morphology of the optical light curves are also distinctively different, with the 2005 light curve typical of a fast classical nova, while the light curve of the 2019 event plateaued at peak for around a year. The velocities measured from the spectra taken during the 2005 eruption range from 750 to 1800 km s-1. These velocities are slow to moderate in comparison to the velocities observed in classical novae. During the rise of the 2019 outburst, the velocities measured from some of the lines were around a few hundreds km s-1 (typical of CVs), but later in the outburst, the spectral lines showed velocities of 2000 km s-1, raising more questions about the nature of this event.
4.4 The 2005–2019 post-nova period
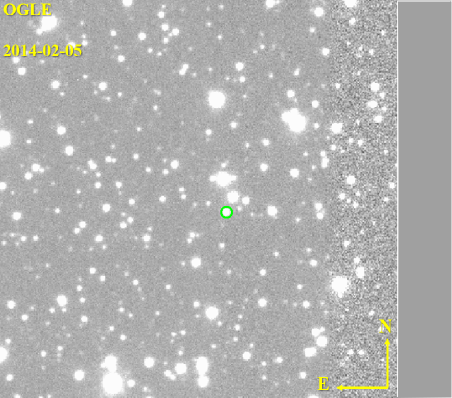
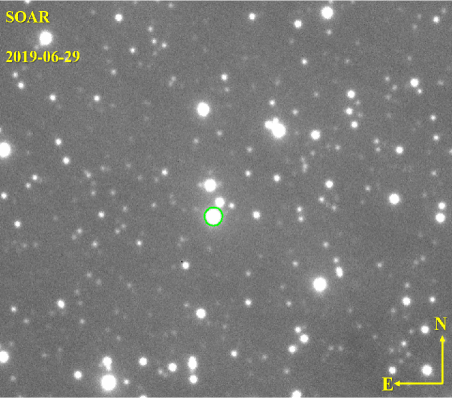
In Figure 15, we show charts of the field of V1047 Cen from DSS (red plates taken in Feb. 1999), OGLE (taken in Feb 2014), and SOAR (taken in June 2019). Clearly, there is an excess in brightness of the system in 2014, nine years after the 2005 nova eruption, compared to the pre-nova. This indicates that the system did not return to the pre-nova brightness.
The OGLE colors between 2010 and 2019 indicate a blue source with high temperatures, in excess of K. These substantially blue colors could be due to the contribution of emission lines to the spectra—particularly the [O iii ] lines from the nova nebula, whose fluxes contribute to the -band. These lines were relatively strong compared to the other lines during the early spectra of the 2019 outburst and after the end of the outburst (Figure 7). Unlike the -band, no strong nebular lines contribute to the flux in the -band (Figure A.1).
Moreover, the blue colors (implying high temperatures) are likely an indication of ongoing nuclear burning on the surface of the WD. Many nova systems have shown extended supersoft X-ray emission and continued remnant thermonuclear burning on the surface of the WD several years after nova eruptions (e.g., Schaefer & Collazzi 2010; Zemko et al. 2015, 2016). This could be remnant burning from the accreted nova envelope or due to enhanced mass transfer from an irradiated secondary post-nova Ginzburg & Quataert (2021). Stable nuclear burning from enhanced accretion onto the white dwarf has also been studied by Wolf et al. (2013). They derived the mass accretion rate needed for stable burning on a white dwarf and found that, for white dwarf masses between 0.6 and 1.3 M⊙, the mass accretion rate should be of the order of – M⊙ yr-1.
We do not have definite estimates of the WD mass in V1047 Cen. Hachisu & Kato (2007) derived a low WD mass of around 0.7 M⊙ for V1047 Cen, based on the light curve of the 2005 nova eruption. However, the values derived by Hachisu & Kato (2007) are uncertain, given that the light curve of V1047 Cen does not follow their “universal decline law”. On the other hand, the 2005 nova eruption of V1047 Cen showed a rapid decline in its optical light curve, which is indicative of an ejection of a low-mass envelope with large ejecta velocities (Starrfield et al., 2020); low mass ejecta in turn tend to be associated with eruptions occurring on massive WDs (Yaron et al., 2005). Shara et al. (2018) combined simulations of nova eruptions with optical photometric data from Strope et al. (2010) and Schaefer (2010) to estimate the masses and accretion rates of white dwarf stars in novae. Based on their relations and the parameters of the 2005 classical nova eruption of V1047 Cen — an eruption amplitude of = 13 mag and a time to decline from peak by 2 mag of 5 days — we estimate a quiescent mass accretion rate of the order of 10-10 – 10-9 M⊙ yr-1 and a white dwarf mass of around 1.2 – 1.4 M⊙. This implies that V1047 Cen possibly has a massive white dwarf. However, the ejecta velocities measured from the optical spectral lines during the 2005 classical nova are moderate (FWHM 2000 km s-1; (Liller et al., 2005), which argues against a massive WD (Shafter et al., 2011).
For a WD mass in the range of 1.2 to 1.4 M⊙, the accretion rate needed for stable burning is a few times M⊙ yr-1 (Wolf et al., 2013). This is relatively high for a typical accretion rate on a WD in a CV system. Even during a post-nova event, the mass transfer rate is usually of the order of M⊙ yr-1 (e.g., Kovetz & Prialnik 1985; Hillman et al. 2020). However, recent work by Ginzburg & Quataert (2021) showed that the post-nova mass-accretion rate could be as high as M⊙ yr-1 for several centuries. At such mass-transfer rate onto a massive WD (1.2–1.4 M⊙), the system would be a bright supersoft source (Wolf et al., 2013; Page et al., 2020), easily detectable with Swift at a distance of 3–4 kpc and with = 3.1 (implying interstellar = 8.7 cm-2 ; Bahramian et al. 2015). However, there was no X-ray detection with Swift in 2008 nor throughout the 2019 outburst.
Another alternative is that the stable nuclear burning is taking place on a low mass WD (0.6–0.8 M⊙) with emission too soft to be detected with Swift. Stable burning on such a relatively low mass WD would require a mass accretion rate of the order of M⊙ yr-1 (Wolf et al., 2013), which is a more typical post-nova mass transfer rate. Similarly, the lack of X-ray detection during the 2019 outburst is an indication that—if nuclear burning is present during the 2019 outburst—it must be taking place on a low mass white dwarf rather than a high mass white dwarf.
If the ongoing nuclear burning is from residual material from the nova eruption, this also means that the WD in nova V1047 Cen is of a low mass (0.6–0.8 M⊙), for it to lasts for several years. The residual nuclear burning on a high mass WD after a nova eruption typically lasts for a few weeks/months only (e.g., MacDonald 1996; Schwarz et al. 2011).
Regardless of the mass of the white dwarf, stable nuclear burning is likely taking place on the surface of the white dwarf between 2005 and 2019, and is responsible for the post-2005-nova brightness excess compared to the pre-nova brightness and the substantially blue colors in the OGLE data between 2013 and 2019.
4.5 The 2019 outburst of V1047 Cen - a potential record breaker?
Only a few classical novae are known to have shown DN outbursts after a nova eruption, such as GK Per (Nova Persei 1901; Sabbadin & Bianchini 1983; Bianchini et al. 1986), V1017 Sgr (Nova Sagittarii 1919; Sekiguchi 1992; Salazar et al. 2017) and V446 Her (Nova Herculis 1960; Honeycutt et al. 1995, 2011; see Table A.9 for a full list). The first DN outbursts of these novae occurred several decades after the nova eruption, with the shortest gaps being 54 years (V1017 Sgr), 47 years (GK Per), and 30 years (V446 Her). The 14 year gap between the classical nova eruption and the 2019 outburst of V1047 Cen is the shortest ever recorded, if it is indeed a DN outburst. Note that the older novae such as GK Per and V1017 Sgr might have had earlier DN outbursts that were missed due to monitoring gaps.
During the 2019 outburst of V1047 Cen, the rise to optical peak, plateau phase, and decline lasted 100, 210, and 100 days, respectively. This 400 day outburst is twice as long as the longest known DN outburst, previously recorded for V1017 Sgr and four times longer than the longest outburst recorded for GK Per (e.g., the 2006 outburst; Evans et al. 2009).
The peak absolute magnitude at -band during the 2019 outburst reached mag. This is higher than the typical absolute magnitudes of dwarf novae during outburst, which range between 3.8 and 2.6 mag (Ramsay et al., 2017). Some systems with long periods (of the order of days) such as V1017 Sgr and V630 Cas, have extremely luminous DN outbursts, with absolute magnitudes reaching and 1.4 mag, respectively. However, even these are still substantially less luminous compared to V1047 Cen. Therefore, if the 2019 outburst of V1047 Cen is a DN, it would be the most luminous outburst of a DN observed to date. Note that Kawash et al. (2021) showed that some DN outbursts could reach absolute magnitudes brighter than zero, but accurate distances and extinction values were unavailable for these systems in their study. As mentioned in Section 4.3 the peak luminosity of the 2019 outburst is more than a few times 1036 erg s, which is orders of magnitude larger than the typical luminosity of DNe (1034 erg s; Warner 1995). At a few times 1036 erg s, the outburst is too energetic to be powered by accretion alone.
All the above indicate that the 2019 outburst of V1047 Cen is either a record breaking DN outburst or—more likely—a more energetic phenomenon than a disk instability event, as we discuss below.
4.6 Origin of the spectral features
During the rise phase (days 0 to 90), the spectrum of V1047 Cen resembled that of a DN superimposed on a spectrum of an old classical nova shell, implying an origin in a bright accretion disk. However, the subsequent evolution, particularly of the Balmer lines, differed considerably from that of DNe. The widths of the Balmer lines reached velocities much larger than those of the nova’s nebular lines, with FWZIs of around 4000 km s-1 (compared to FWZIs 1100 km s-1 for the latter; see Figures 8 and 9). These velocities are also much larger than those measured for the Balmer lines during GK Per’s recent outburst (FWHM 500-650 km s-1; e.g., Wilber et al. 2015) or other DNe in outburst (Morales-Rueda & Marsh, 2002). The Balmer lines also showed substantial increases in their line fluxes relative to the nova nebular lines more than 100 days into the 2019 outburst (Figure 9). The cause of this dramatic flux increase and broadening is not clear, but it likely due to a fast, low density outflow (given that these velocities are higher than the escape velocities of a 0.8–1.3 M⊙ WD). All this indicates that, in addition to the early disk brightening, there are other mechanisms shaping the electromagnetic signatures of V1047 Cen.
Between days 262 and 310, most of the lines in the spectrum (e.g., Balmer, He i, and O i) showed P Cygni-like absorption features at velocities of around km s-1. Such features are not characteristic of a DN outburst. They probably originate in an optically thick wind/outflow. The onset of these features coincides with the start of the brightness increase between days 260 and 310 (Figure 2), supporting the possibility of a wind or shell ejection during this phase of the outburst.
The satellite emission components at 2500 km s-1 in H around 7 months after the end of the outburst (Figure 12), are reminiscent of the features observed in Z And-like classical symbiotic outbursts. They are associated with collimated bipolar flows (see e.g., Burmeister & Leedjärv 2007; Skopal et al. 2013; Tomov & Tomova 2013).
4.7 The origin of the bright radio emission
In the past decade, CVs have been established as radio emitters during both quiescent and outburst phases (e.g., Córdova et al. 1983; Coppejans et al. 2015, 2016; Barrett et al. 2017). Their radio properties are diverse, and the emission mechanisms powering CV radio luminosity are still being established.
Coppejans et al. (2015) observed several nova-like CVs and found that they are significant radio emitters. Nova-like CVs are non-magnetic CVs characterized by a sufficiently high mass transfer rate to maintain the accretion disk in a constant hot state, unlike CV systems which undergo DN outbursts. For the individual systems in their sample, Coppejans et al. (2015) found that the emission in these nova-like CVs is consistent with optically thick synchrotron, gyro-synchrotron, or cyclotron maser emission. Their 6 GHz spectral radio luminosities are erg s-1 Hz-1 (Coppejans et al., 2015).
Non-magnetic CVs which undergo DN outbursts are also known to be radio sources during outburst (Coppejans et al., 2016). The most famous of these systems is SS Cyg, which shows a radio flare during the early days of its optical outbursts, peaking at 1 mJy before fading gradually, dropping below radio detectability by the end of the optical outburst. This flaring radio emission resembles that of X-ray binaries and is suggested to be the result of synchrotron emission from a transient jet (e.g., Körding et al. 2008; Miller-Jones et al. 2011; Russell et al. 2016; Coppejans et al. 2016; Coppejans & Knigge 2020). Coppejans et al. (2016) found that the radio spectral luminosities of DNe in outburst range between 1014 and 1016 erg s-1 Hz-1 at 10 GHz.
Based on a radio survey targeting a large sample of magnetic CVs, Barrett et al. (2017) suggest that they are also radio emitters, dominated by weakly polarized gyro-synchrotron emission or highly polarized electron-cyclotron maser emission. Most of these are nearby (less than a kpc) sources and are characterized by flux densities, 20–400 Jy; the implication is radio spectral luminosities in the range erg s-1 Hz-1 (Barrett et al., 2020). Only one of them, AE Aqr, shows substantially higher flux density (5 mJy), but it is located remarkably nearby, at a distance of 90 pc (Ramsay et al., 2017).
Similar to the other observational features of V1047 Cen across the spectrum, the radio emission from this system is record breaking and puzzling. Assuming a distance of 3.2 kpc, the spectral luminosity of V1047 Cen at 2 GHz is 1019 erg s-1 Hz-1. This means that V1047 Cen is at least two orders of magnitude brighter at radio wavelengths than all other cataclysmic variables.
If the radio emission from a DN outburst is optically thick thermal emission from ionized gas at a typical brightness temperature of 104 – 105 K, then the emitting regions should have radii of 1014 – 1015 cm (assuming circular sources as projected on the sky) to produce the observed flux densities in V1047 Cen. During a DN outburst, it is reasonable to assume that the emitting gas has a size roughly equivalent to the size of the binary. CVs with orbital periods of the order of a few hours have orbital radii of 1011 cm, which is three orders of magnitude smaller in size than the optically thick emitting gas responsible for the observed fluxes. This implies that if the outburst is a DN, any emission of order the size of the orbit must be non-thermal (brightness temperature K).
One possibility is that the radio emission is non-thermal synchrotron emission from a transient radio jet, similar to the case of other DN outbursts. While the flux density of V1047 Cen equals that of SS Cyg during its short-lasting flare, the luminosity of V1047 Cen is several orders of magnitude brighter than that of SS Cyg (the distance to SS Cyg is 114 pc; Miller-Jones et al. 2013). In Figure 16 we plot V1047 Cen on the vs diagram in comparison with jet emission in other CVs, classical novae, Z And, V Sge, and other astrophysical objects such as X-ray binaries, accreting millisecond X-ray pulsars, and transitional millisecond pulsars (we multiply the spectral luminosity by 5 GHz to estimate the radio luminosity at 5 GHz assuming a flat spectrum). V1047 Cen’s 5 GHz luminosity, erg s-1, is much higher than that observed in CVs and is comparable to (or even brighter in some cases than) X-ray binaries and pulsars with compact primaries like neutron stars and black holes. Such an energetic jet should also be a bright X-ray source. We used WebPIMMS 333https://heasarc.gsfc.nasa.gov/cgi-bin/Tools/w3pimms/w3pimms.pl to derive the X-ray unabsorbed flux using the stacked Swift X-ray detection of the 2019 outburst and assuming a 5 keV thermal bremsstrahlung model and = 8.7 1021 cm-2 (we use = 2.81 1021 ; Bahramian et al. 2015). This translates to an X-ray luminosity of around 3.71031 erg s-1 at a distance of 3.2 kpc, which is comparable to the X-ray luminosity of other CVs in outburst.
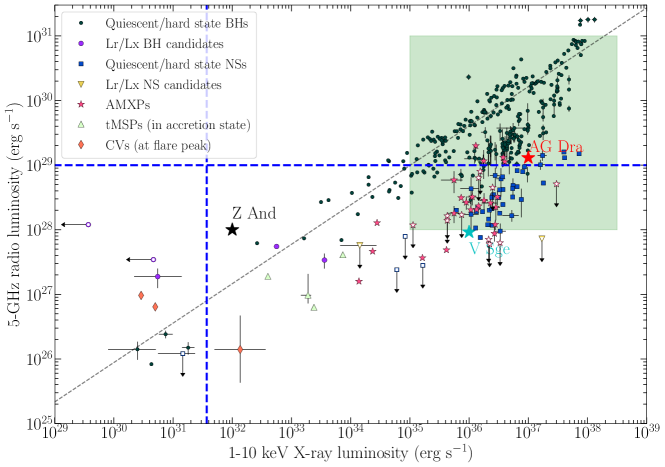
It is not possible to determine if V1047 Cen showed flaring radio emission during the early days of the outburst like SS Cyg and was an even brighter radio source at that time, or if the 1 mJy emission remained more or less constant throughout the optical outburst. Nevertheless, what is really puzzling is that at the end of the optical outburst, the radio flux did not drop. This is in contrast to the trends shown by SS Cyg and other DN outbursts, where the radio flux drops below the detection limit by the end of the optical outburst (Russell et al., 2016). This disparity between the radio behavior and energetics of V1047 Cen and other DN outbursts raises additional questions about the origin of the radio emission in V1047 Cen and if a transient synchrotron jet is an appropriate explanation.
Bode et al. (1987) conducted a radio survey of 26 classical novae observed with the VLA less than 10 years after eruption and detected only two in the sample. Both novae were detected at 5 GHz, 2 years (V4077 Sgr) and 8 years (NQ Vul) after the nova eruptions. The emission from these two novae was suggested to be thermal and had radio spectral luminosities erg s-1 Hz-1. The higher-end radio spectral luminosity of V4077 Sgr is due to the fact that the system was observed only 2 years after the nova eruption; radio emission from classical novae often peaks on timescales 1–3 yr after eruption (Chomiuk et al., 2021). In addition, given that radio emission from decade-old or older nova ejecta originates in the nova’s extended thermal remnant, it can vary only slowly, not on the weeks–months timescales observed in V1047 Cen (Chomiuk et al., 2021). Therefore, it is very unlikely that the radio emission from V1047 Cen originates in the ejecta of the 2005 classical nova eruption.
The long-lasting, luminous radio emission in V1047 Cen resembles the radio emission from Z And-like classical symbiotic, accretion-powered, outbursts (e.g., Crocker et al. 2001; Mikołajewska 2002; Brocksopp et al. 2004; Sokoloski et al. 2006). These systems are luminous radio sources ( erg s-1 Hz-1; Ogley et al. 2002; Brocksopp et al. 2004), where the emission is usually suggested to be thermal, originating from bipolar collimated jets/outflows. Classical symbiotic systems consist of giant stars, which in most cases do not fill their Roche Lobes, transferring material onto WDs; accretion can proceed via a disk or not, depending on the relative velocity of the red giant wind and the accreting WD (Livio, 1992; Mohamed & Podsiadlowski, 2007). Even out of outburst, symbiotic stars can be luminous radio emitters ( erg s-1 Hz-1), as the hot accreting white dwarf ionizes the substantial circumstellar material expelled by the giant companion (Seaquist et al., 1984; Seaquist & Taylor, 1990; Mikołajewska, 2012).
We showed earlier that if the radio emission is optically thick thermal emission from ionized gas at a typical brightness temperature of 104 – 105 K, the emitting regions should have a radius of 1014 – 1015 cm to produce the observed flux densities. If the radio emission observed from V1047 Cen proves to be transient and associated with the 2019 outburst, it might be attributed to outflows moving at velocities 2000 km s-1 (based on the optical line profiles), which will cover a radius of more than 1015 cm in less than 2 months. The variability of the radio source can then be explained as variability in the fast outflow.
4.8 The nature of the outburst
The spectroscopic follow up of V1047 Cen during the rise to peak (first 90 days) and the low-amplitude of the outburst are fairly consistent with a DN outburst; however, the 400 day long outburst, the 14 year gap between the 2005 nova eruption and the 2019 outburst, the luminous radio and optical emission, the dramatic spectral changes and high velocity spectral components are not consistent with a DN and raise questions about the nature of this event. In addition, the amplitude of the outburst ( 6 mag), the absolute peak magnitude, and the spectral evolution are not consistent with a classical nova event. Moreover, there is a striking difference between the 2005 classical nova and the 2019 outburst. All this suggests that the 2019 outburst of V1047 Cen is unique and is not consistent with common phenomena observed in CV systems, such as DNe and classical novae. A definitive explanation for what happened during the 2019 outburst has not yet arisen based on the current dataset, but we offer below several potential scenarios, while listing their pros and cons.
Many of the features observed in V1047 Cen resemble those of Z And-like classical symbiotic outbursts (Sokoloski et al., 2006). This type of events starts with a disk instability outburst, leading to the accretion of a massive accretion disk onto the white dwarf. The accretion burst is large enough to trigger enhanced nuclear burning on the surface of the white dwarf and the ejection of an optically thick outflow/shell (see also Munari 2019).
While classical symbiotic systems are characterized by orbital periods of the order of hundreds of days (Mikołajewska 2003; much longer than the potential few hours orbital period in V1047 Cen), the observational features of classical symbiotic outbursts have similarities with those of V1047 Cen (the long-lasting optical outburst, the long-lasting and luminous radio emission, the P Cygni spectral features with velocities 1500–2000 km s-1, the high ionization lines in the optical spectra, and the late satellite spectral features around the Balmer lines indicative of bipolar flows).
Therefore, one of the possibilities is that the 2019 outburst of V1047 Cen is similar in nature to classical symbiotic outbursts, starting with a DN disk instability type outburst (based on the early optical spectra), leading to the accretion of the entire accretion disk onto the white dwarf. The accretion of the disk might have led to enhanced nuclear shell burning on the surface of the white dwarf, which launched a radiation driven wind/outflow (Sokoloski et al., 2006). This scenario could explain the 400 day outburst duration in the optical (e.g., the 2000’s outburst of Z And lasted for 2 years) and the dramatic brightening and broadening of the Balmer lines. The light curve bump or re-brightening that occurred 250 days after the outburst start could mark the stage at which an optically thick outflow started. This is consistent with the development of P Cygni-like absorption features in the optical spectral lines around the same period (Figure 10). The absence of the P Cygni profiles in the spectra obtained on day 407 after the end of the optical outburst (Figure 7; note that the P Cygni profiles were present in the previous epoch on day 303) indicates that the optically thick wind/outflow dissipated rapidly and became optically thin, which is very similar to the behavior observed in the outburst of Z And (Sokoloski et al., 2006). The presence of high ionization lines of He, C, O, N, and potentially forbidden Fe in the late spectra of V1047 Cen (Figure A.6), obtained after the end of the optical outburst could indicate ongoing nuclear shell burning, which would strengthen the case for this scenario, which transitions from an accretion-powered outburst to a nuclear-powered outburst. The same high ionization lines of N v and O vi are typically observed in V Sge like stars (the Milky-Way counterparts of the supersoft sources in the Magellanic Clouds), and typically indicate nuclear shell burning (e.g., Herbig et al. 1965; Cieslinski et al. 1999; Steiner et al. 1999; Starrfield et al. 2004). Sokoloski et al. (2006) derived the luminosity of Z And a good part of the 2006 outburst to be of the order of 1036 erg s, which is close to the luminosity of V1047 Cen during the flat peak phase of the 2019 outburst.
This scenario could also explain the long-lasting, luminous radio emission. We showed in Section 4.7 that the flux densities observed in V1047 Cen could be explained as thermal emission from an outflow of ionized gas. Such radio emitting outflows/jets are characteristics of classical symbiotic outbursts (e.g, Brocksopp et al. 2004 and references therein). In addition, there is strong evidence for the presence of such collimated outflows or jets in V1047 Cen based on the satellite emission components observed in H (Figure 12), which are similar to those observed in Z And-like classical symbiotic outbursts (e.g., Munari et al. 2005; Burmeister & Leedjärv 2007; Skopal et al. 2013; Tomov & Tomova 2013). The bright radio emission in Z And like systems, is mostly due to the presence of dense circumstellar material from the evolved secondary, ionized by the outburst on the white dwarf. However, for a system like V1047 Cen, which likely hosts a dwarf companion, we do not expect a dense circumstellar environment. Unless, the medium around the system has been enriched by material from a swelled companion after the 2005 nova, during a phase of enhanced mass-transfer, coupled with mass-loss from the system. While there is no explanation for why this happens in a system like V1047 Cen specifically, it is within our attempts to explain the uniqueness of this outburst.
If strong internal shocks are not present within the outflow, bright X-ray emission might not be present, because the X-ray emission associated with the nuclear-burning on a low mass WD (see Section 4.4) would be hidden by the interstellar column density along with the puffed up photosphere and outflow during the outburst. This could explain the lack of X-ray detection in the Swift individual observations.
The energy radiated during the 2019 outburst is likely powered by different mechanisms (e.g., disk brightening and nuclear burning), making it difficult to estimate (see Section 4.3). However, if we assume that all ( 1044 erg) the energy radiated is powered by nuclear burning, the mass needed to be accreted between 2005 and 2019 to power the 1044 erg would be around 1.6 M⊙ of hydrogen, assuming a 0.7% nuclear burning efficiency (Clayton, 1968). This amount of material could be accreted onto the WD with a moderate post-nova mass transfer rate ( – M⊙ yr-1.)
While a scenario similar to a classical symbiotic outburst could indeed explain some of the observational features during the 2019 outburst, this scenario suffers from some weaknesses. Sokoloski et al. (2006) suggest that pre-existing quasi-steady shell burning on the WD surface is necessary to trigger a classical symbiotic nova. As mentioned earlier, the OGLE photometry between 2013 and 2019 indicates that quasi-stable nuclear burning on the WD surface could indeed have been ongoing prior to the 2019 outburst, with a mass accretion rate of the order of M⊙ yr-1, or remnant mass from the 2005 nova event. However, this mass accretion rate is high for a disk instability event to take place at the beginning of the 2019 outburst of V1047 Cen. While some systems like GK Per and V1017 Sgr showed DN outbursts, just a few decades after a nova eruption when the accretion rate is expected to be of the order of M⊙ yr-1, these systems are characterized by long orbital periods ( 1 d) and therefore potentially massive accretion disks, where a disk instability event could take place despite the high accretion rate. Similarly, Z And-like systems are characterized by high mass accretion rates ( M⊙ yr-1) in long orbital period systems, harboring massive disks. However, if V1047 Cen is characterized by an orbital period of less than 10 hours, a disk instability would be more difficult to take place at this high mass accretion rate.
Moreover, the potential ongoing nuclear burning on the WD surface will heat up the disk to temperatures where a disk instability is not possible to occur. If the system brightness ( mag) prior to the 2019 outburst is mostly contributed by the nuclear burning irradiating the disk, this means that the disk temperature could reach over 10,000 K, implying that disk instabilities are not possible. Therefore, despite the early spectra’s consistency with a DN outburst (Balmer and He i lines with FWHM of a few 100 km s-1 and strong He ii at 4868), a disk instability may not be the trigger of the 2019 outburst. In addition, the optical light curve of V1047 Cen is of higher-amplitude compared to typical light curves of classical symbiotic outbursts. For example, the 2006 outburst of Z And reached an amplitude of 2–3 mag compared to more than 6 magnitudes in V1047 Cen. However, it is worth noting that the amplitude of the outburst is not only related to the outburst radiated energy, but also the magnitude of the companion star. Since the companion star in Z And is a bright, giant star, the amplitudes of the outbursts in such systems are expect to be low.
If the distance and reddening estimate towards V1047 Cen are larger than the ones we derive, this would imply that the companion star is an evolved one (e.g., a sub-giant; see Section 4.2). If so, this would place V1047 Cen in the same category of GK Per and V1017 Sgr, i.e., systems characterized by a large disk and an orbital period longer than 1-2 days. This implies that a disk instability could still take place despite a high mass transfer rate. Moreover, even if the inner parts of the disk are characterized by temperatures in excess of 104 k, the outer parts of the large disk could be cold enough for instability to happen.
Based on the early spectral features, a disk brightening likely took place during the early weeks of the outburst. If this did not happen due to an instability in the disk, an alternative possibility is that the disk brightened due to enhanced mass transfer rate from the companion. Bollimpalli et al. (2018) suggested that for the 2000-2002 outburst of Z And, a disk instability could not be the trigger of the outburst. This is mainly due to the irradiation of the disk by the hot WD, implying that a dwarf nova would only be significant at very high mass transfer rates (10-6 M⊙ yr-1), which is higher than the typical mass transfer rate in such systems. Bollimpalli et al. (2018) suggest that the outburst of Z And between 2000 and 2002 might have been triggered by a mass-transfer enhancement from the giant companion, leading to an increase in nuclear burning on the WD surface. It could be that something similar took place during the early stages of the 2019 outburst of V1047 Cen. However, based on the scolors of V1047 Cen prior to 2019, there is evidence for ongoing nuclear burning on the WD surface, likely caused by post-nova enhanced mass transfer rate. Therefore, we do not have a definitive explanation for what could lead to further enhancing the mass transfer rate from the secondary into the surface of the WD.
One other possible explanation of the 2019 outburst is that the system experienced a non-ejection nova event. The extended grid of nova models by Yaron et al. (2005) shows that some combinations of parameters might lead to a thermonuclear runaway without ejecting material (see also Fujimoto 1982; Shara et al. 1977). Yaron et al. (2005) suggest that such outbursts cause only a slow increase in luminosity, followed by a slow decay, particularly in the case of low mass WDs where the timescales of the rise and decay could be thousands of days. The supersoft X-ray transient ASASSN-16oh has been suggested to be a thermonuclear runaway event without mass ejection (Hillman et al., 2019). The system showed a slowly rising (1585 days) and declining (268 days) optical light curve, with an amplitude of less than 4 magnitude. While there are similarities between the optical light curves of ASASSN-16oh and V1047 Cen, the former has been detected as a supersoft X-ray source at the distance of the Small Magellanic Cloud. This is very different from the case of V1047 Cen, which was not detected in individual epochs by Swift during the 2019 outburst despite our extensive monitoring. In the case of a thermonuclear runaway, the luminosity of the supersoft source is expected to be of the order of 1038 erg s-1, which would have been easily observed at a distance of 3.2 kpc by Swift, if the whitw dwarf is of higher mass (M⊙). The supersoft emission of ASASSN-16oh was characterized by a luminosity of around 1037 erg s-1, which is lower than that expected from the models of non-ejecting thermonuclear runaways. This low luminosity has been attributed to an optically thick accretion disk hiding most of the WD surface. While a massive accretion disk could also be blocking some of the emission from the WD surface in case of V1047 Cen, it is a less likely possibility given the Swift non-individual-detections over several months. Moreover, the optical spectral evolution is consistent with the presence of an optically thick ejection/outflow. Therefore, a non-ejection nova scenario is less likely.
In conclusion, the 2019 outburst of V1047 Cen does not resemble the common events that take place in CV systems (e.g., DNe and classical novae). Based on the multi-wavelength observational features, the outburst is likely the combination of multiple mechanisms, starting with a disk brightening, followed by the generation of an outflow. Such a unique outburst has never before been observed in a CV system that has experienced a recent classical nova eruption, indicating the possibility that we have witnessed a new astronomical phenomenon.
5 Conclusions
We have presented multi-wavelength observations of the 2019 outburst in the 2005 classical nova V1047 Cen. The outburst amplitude reached around 6 magnitudes in the optical and lasted for more than 400 days. We derive a distance of 3.20.2 kpc to the system and a peak absolute magnitude of the outburst , placing it between novae and dwarf novae. The first spectra we obtained of the system around 74 days after the start of the outburst were consistent with a disk instability dwarf nova event in a classical nova system. If V1047 Cen is a DN, the event would be a record breaker, making it the longest DN outburst on record, the shortest gap between a nova and DN in a CV system, and the most luminous optical and radio DN outburst. This, along with the different observational features across the electromagnetic spectrum point towards a phenomenon more exotic than just a DN outburst.
We therefore suggest that the event is a combination of multiple mechanisms, starting with a brightening in the disk (due to enhanced mass-transfer or less likely an instability in the disk), which then triggered enhanced nuclear shell burning on the surface of the white dwarf and eventually led to an optically thick, radiation driven wind/outflow. This scenario fits well the 400 day outburst duration, the dramatic changes in the optical line profiles and the 2000 km s-1 velocities inferred from these profiles, the P Cygni line profiles which appeared several months after the outburst start, the high peak optical brightness, and most importantly the long-lasting, superluminous radio emission, which likely originates from ionized gas (thermal emission) in collimated bipolar flows, which are characteristic of classical symbiotic outbursts. Strong evidence for such outflows can be seen in the late optical spectral line profiles. Mid-infrared observations also indicate that pre-existing dust — likely formed during the 2005 classical nova eruption — has been heated by the radiation from the 2019 outburst.
Therefore, the 2019 outburst of V1047 Cen is a unique phenomenon observed for the first time in a typical CV system, characterized by a short ( hours) orbital period and which has undergone a recent classical nova eruption.
Acknowledgments
We thank B. Schaefer for useful discussion. We thank the AAVSO observers from around the world who contributed their magnitude measurements to the AAVSO International Database used in this work.
Support for this work was provided by NASA through the NASA Hubble Fellowship grant HST-HF2-51501.001-A awarded by the Space Telescope Science Institute, which is operated by the Association of Universities for Research in Astronomy, Inc., for NASA, under contract NAS5-26555. EA, LC, and KVS acknowledge NSF award AST-1751874, NASA award 11-Fermi 80NSSC18K1746, and a Cottrell fellowship of the Research Corporation. JS was supported by the Packard Foundation. DAHB gratefully acknowledges the receipt of research grants from the National Research Foundation (NRF) of South Africa. PAW kindly acknowledges the National Research Foundation and the University of Cape Town. KLP acknowledges funding from the UK Space Agency. Nova research at Stony Brook University has been made possible by NSF award AST-1611443. MG is supported by the EU Horizon 2020 research and innovation programme under grant agreement No 101004719. A part of this work is based on observations made with the Southern African Large Telescope (SALT), with the Large Science Programme on transients 2018-2-LSP-001 (PI: DAHB). Polish participation in SALT is funded by grant no. MNiSW DIR/WK/2016/07. This paper was partially based on observations obtained at the Southern Astrophysical Research (SOAR) telescope, which is a joint project of the Ministério da Ciência, Tecnologia e Inovações (MCTI/LNA) do Brasil, the US National Science Foundation’s NOIRLab, the University of North Carolina at Chapel Hill (UNC), and Michigan State University (MSU). The OGLE project has received funding from the National Science Centre, Poland, grant MAESTRO 2014/14/A/ST9/00121 to AU. The CHIRON and instruments are managed by the Todd Henry and the SMARTS Consortium. The MeerKAT telescope is operated by the South African Radio Astronomy Observatory, which is a facility of the National Research Foundation, an agency of the Department of Science and Innovation. We acknowledge the use of the ilifu cloud computing facility - www.ilifu.ac.za, a partnership between the University of Cape Town, the University of the Western Cape, the University of Stellenbosch, Sol Plaatje University, the Cape Peninsula University of Technology and the South African Radio Astronomy Observatory. The ilifu facility is supported by contributions from the Inter-University Institute for Data Intensive Astronomy (IDIA - a partnership between the University of Cape Town, the University of Pretoria and the University of the Western Cape), the Computational Biology division at UCT and the Data Intensive Research Initiative of South Africa (DIRISA). This research is based in part on observations obtained at the international Gemini Observatory, a program of NSF’s NOIRLab, which is managed by the Association of Universities for Research in Astronomy (AURA) under a cooperative agreement with the National Science Foundation. on behalf of the Gemini Observatory partnership: the National Science Foundation (United States), National Research Council (Canada), Agencia Nacional de Investigación y Desarrollo (Chile), Ministerio de Ciencia, Tecnología e Innovación (Argentina), Ministério da Ciência, Tecnologia, Inovações e Comunicações (Brazil), and Korea Astronomy and Space Science Institute (Republic of Korea). DPKB is supported by a CSIR Emeritus Scientist grant-in-aid, which is being hosted by the Physical Research Laboratory, Ahmedabad. This work is based in part on observations made with the NASA/DLR Stratospheric Observatory for Infrared Astronomy (SOFIA). SOFIA is jointly operated by the Universities Space Re- search Association, Inc. (USRA), under NASA contract NNA17BF53C, and the Deutsches SOFIA Institut (DSI) under DLR contract 50 OK 0901 to the University of Stuttgart. Financial support for CEW/RDG related to this work was provided by NASA through award SOF07-0005 issued by USRA to the University of Minnesota. This publication makes use of data products from the Near-Earth Object Wide-field Infrared Survey Explorer (NEOWISE), which is a joint project of the Jet Propulsion Laboratory/California Institute of Technology and the University of Arizona. NEOWISE is funded by the National Aeronautics and Space Administration. VARMR acknowledges financial support from the Fundação para a Ciência e a Tecnologia (FCT) in the form of an exploratory project of reference IF/00498/2015/CP1302/CT0001, and from the Ministério da Ciência, Tecnologia e Ensino Superior (MCTES) through national funds and when applicable co-funded EU funds under the project UIDB/EEA/50008/2020, and supported by Enabling Green E-science for the Square Kilometre Array Research Infrastructure (ENGAGE-SKA), POCI-01-0145- FEDER-022217, and PHOBOS, POCI-01-0145-FEDER029932, funded by Programa Operacional Competitividade e Internacionalização (COMPETE 2020) and FCT, Portugal. Analysis made significant use of python 3.7.4, and the associated packages numpy, matplotlib,, seaborn, scipy. Data reduction made significant use of .
References
- Wou (2014) 2014, Astronomical Society of the Pacific Conference Series, Vol. 490, Stella Novae: Past and Future Decades
- Aydi et al. (2019a) Aydi, E., Buckley, H. D. A., Mroz, P., et al. 2019a, The Astronomer’s Telegram, 12885, 1
- Aydi et al. (2019b) Aydi, E., Sokolovsky, K., Chomiuk, L., et al. 2019b, The Astronomer’s Telegram, 12889, 1
- Bahramian et al. (2015) Bahramian, A., Heinke, C. O., Degenaar, N., et al. 2015, MNRAS, 452, 3475
- Bahramian et al. (2018) Bahramian, A., Miller-Jones, J., Strader, J., et al. 2018, Radio/X-ray correlation database for X-ray binaries, vv0.1, Zenodo, doi:10.5281/zenodo.1252036. https://doi.org/10.5281/zenodo.1252036
- Ballester (1992) Ballester, P. 1992, in European Southern Observatory Conference and Workshop Proceedings, Vol. 41, European Southern Observatory Conference and Workshop Proceedings, ed. P. J. Grosbøl & R. C. E. de Ruijsscher, 177
- Barnes et al. (2008) Barnes, S. I., Cottrell, P. L., Albrow, M. D., et al. 2008, in Proc. SPIE, Vol. 7014, Ground-based and Airborne Instrumentation for Astronomy II, 70140K
- Barrett et al. (2020) Barrett, P., Dieck, C., Beasley, A. J., Mason, P. A., & Singh, K. P. 2020, Advances in Space Research, 66, 1226
- Barrett et al. (2017) Barrett, P. E., Dieck, C., Beasley, A. J., Singh, K. P., & Mason, P. A. 2017, AJ, 154, 252
- Bellm et al. (2019) Bellm, E. C., Kulkarni, S. R., Graham, M. J., et al. 2019, PASP, 131, 018002
- Bianchini et al. (1986) Bianchini, A., Sabbadin, F., Favero, G. C., & Dalmeri, I. 1986, A&A, 160, 367
- Bode & Evans (2008) Bode, M. F., & Evans, A. 2008, Classical Novae
- Bode et al. (1987) Bode, M. F., Seaquist, E. R., & Evans, A. 1987, MNRAS, 228, 217
- Bollimpalli et al. (2018) Bollimpalli, D. A., Hameury, J. M., & Lasota, J. P. 2018, MNRAS, 481, 5422
- Bramall et al. (2010) Bramall, D. G., Sharples, R., Tyas, L., et al. 2010, in Proc. SPIE, Vol. 7735, Ground-based and Airborne Instrumentation for Astronomy III, 77354F
- Bramall et al. (2012) Bramall, D. G., Schmoll, J., Tyas, L. M. G., et al. 2012, in Proc. SPIE, Vol. 8446, Ground-based and Airborne Instrumentation for Astronomy IV, 84460A
- Brocksopp et al. (2004) Brocksopp, C., Sokoloski, J. L., Kaiser, C., et al. 2004, MNRAS, 347, 430
- Buckley et al. (2006) Buckley, D. A. H., Swart, G. P., & Meiring, J. G. 2006, in Proc. SPIE, Vol. 6267, Society of Photo-Optical Instrumentation Engineers (SPIE) Conference Series, 62670Z
- Burgh et al. (2003) Burgh, E. B., Nordsieck, K. H., Kobulnicky, H. A., et al. 2003, in Society of Photo-Optical Instrumentation Engineers (SPIE) Conference Series, Vol. 4841, Instrument Design and Performance for Optical/Infrared Ground-based Telescopes, ed. M. Iye & A. F. M. Moorwood, 1463–1471
- Burmeister & Leedjärv (2007) Burmeister, M., & Leedjärv, L. 2007, A&A, 461, L5
- Burrows et al. (2005) Burrows, D. N., Hill, J. E., Nousek, J. A., et al. 2005, Space Sci. Rev., 120, 165
- Carey et al. (2009) Carey, S. J., Noriega-Crespo, A., Mizuno, D. R., et al. 2009, PASP, 121, 76
- Chen et al. (2019) Chen, B. Q., Huang, Y., Yuan, H. B., et al. 2019, MNRAS, 483, 4277
- Chomiuk et al. (2020) Chomiuk, L., Metzger, B. D., & Shen, K. J. 2020, arXiv e-prints, arXiv:2011.08751
- Chomiuk et al. (2021) Chomiuk, L., Linford, J. D., Aydi, E., et al. 2021, arXiv e-prints, arXiv:2107.06251
- Cieslinski et al. (1999) Cieslinski, D., Diaz, M. P., & Steiner, J. E. 1999, AJ, 117, 534
- Clarke et al. (2015) Clarke, M., Vacca, W. D., & Shuping, R. Y. 2015, Astronomical Society of the Pacific Conference Series, Vol. 495, Redux: A Common Interface for SOFIA Data Reduction Pipelines, ed. A. R. Taylor & E. Rosolowsky, 355
- Clayton (1968) Clayton, D. D. 1968, Principles of stellar evolution and nucleosynthesis
- Clemens et al. (2004) Clemens, J. C., Crain, J. A., & Anderson, R. 2004, in Proc. SPIE, Vol. 5492, Ground-based Instrumentation for Astronomy, ed. A. F. M. Moorwood & M. Iye, 331–340
- Coppejans & Knigge (2020) Coppejans, D. L., & Knigge, C. 2020, New A Rev., 89, 101540
- Coppejans et al. (2015) Coppejans, D. L., Körding, E. G., Miller-Jones, J. C. A., et al. 2015, MNRAS, 451, 3801
- Coppejans et al. (2016) —. 2016, MNRAS, 463, 2229
- Córdova et al. (1983) Córdova, F. A., Mason, K. O., & Hjellming, R. M. 1983, PASP, 95, 69
- Cragg (1960) Cragg, T. A. 1960, PASP, 72, 475
- Crause et al. (2014) Crause, L. A., Sharples, R. M., Bramall, D. G., et al. 2014, in Proc. SPIE, Vol. 9147, Ground-based and Airborne Instrumentation for Astronomy V, 91476T
- Crawford et al. (2010) Crawford, S. M., Still, M., Schellart, P., et al. 2010, in Society of Photo-Optical Instrumentation Engineers (SPIE) Conference Series, Vol. 7737, Society of Photo-Optical Instrumentation Engineers (SPIE) Conference Series, 25
- Crocker et al. (2001) Crocker, M. M., Davis, R. J., Eyres, S. P. S., et al. 2001, MNRAS, 326, 781
- Darnley et al. (2012) Darnley, M. J., Ribeiro, V. A. R. M., Bode, M. F., Hounsell, R. A., & Williams, R. P. 2012, ApJ, 746, 61
- Delgado et al. (2019) Delgado, A., Harrison, D., Hodgkin, S., et al. 2019, Transient Name Server Discovery Report, 2019-985, 1
- Della Valle & Izzo (2020) Della Valle, M., & Izzo, L. 2020, A&A Rev., 28, 3
- Duerbeck (1987) Duerbeck, H. W. 1987, Space Sci. Rev., 45, 1
- Evans & Gehrz (2012) Evans, A., & Gehrz, R. D. 2012, Bulletin of the Astronomical Society of India, 40, 213
- Evans et al. (2009) Evans, P. A., Beardmore, A. P., Osborne, J. P., & Wynn, G. A. 2009, MNRAS, 399, 1167
- Feinstein et al. (2019) Feinstein, A. D., Montet, B. T., Foreman-Mackey, D., et al. 2019, PASP, 131, 094502
- Friedman et al. (2011) Friedman, S. D., York, D. G., McCall, B. J., et al. 2011, ApJ, 727, 33
- Fujimoto (1982) Fujimoto, M. Y. 1982, ApJ, 257, 752
- Gaia Collaboration et al. (2021) Gaia Collaboration, Brown, A. G. A., Vallenari, A., et al. 2021, A&A, 649, A1
- Gallagher & Starrfield (1976) Gallagher, J. S., & Starrfield, S. 1976, MNRAS, 176, 53
- Gallagher & Starrfield (1978) —. 1978, ARA&A, 16, 171
- Geballe et al. (2019) Geballe, T. R., Banerjee, D. P. K., Evans, A., et al. 2019, ApJ, 886, L14
- Gehrels et al. (2004) Gehrels, N., Chincarini, G., Giommi, P., et al. 2004, ApJ, 611, 1005
- Gehrz et al. (2015) Gehrz, R. D., Evans, A., Helton, L. A., et al. 2015, ApJ, 812, 132
- Ginzburg & Quataert (2021) Ginzburg, S., & Quataert, E. 2021, MNRAS, 507, 475
- Gordon et al. (2021) Gordon, A. C., Aydi, E., Page, K. L., et al. 2021, ApJ, 910, 134
- Gutermuth & Heyer (2015) Gutermuth, R. A., & Heyer, M. 2015, AJ, 149, 64
- Hachisu & Kato (2007) Hachisu, I., & Kato, M. 2007, ApJ, 662, 552
- Helton et al. (2012) Helton, L. A., Gehrz, R. D., Woodward, C. E., et al. 2012, ApJ, 755, 37
- Herbig et al. (1965) Herbig, G. H., Preston, G. W., Smak, J., & Paczynski, B. 1965, ApJ, 141, 617
- Herter et al. (2018) Herter, T. L., Adams, J. D., Gull, G. E., et al. 2018, Journal of Astronomical Instrumentation, 7, 1840005
- Heywood (2020) Heywood, I. 2020, oxkat: Semi-automated imaging of MeerKAT observations, , , ascl:2009.003
- Hillman et al. (2019) Hillman, Y., Orio, M., Prialnik, D., et al. 2019, ApJ, 879, L5
- Hillman et al. (2020) Hillman, Y., Shara, M. M., Prialnik, D., & Kovetz, A. 2020, Nature Astronomy, 4, 886
- Honeycutt et al. (2011) Honeycutt, R. K., Robertson, J. W., & Kafka, S. 2011, AJ, 141, 121
- Honeycutt et al. (1995) Honeycutt, R. K., Robertson, J. W., & Turner, G. W. 1995, ApJ, 446, 838
- Jonas & MeerKAT Team (2016) Jonas, J., & MeerKAT Team. 2016, in MeerKAT Science: On the Pathway to the SKA, 1
- Kafka (2020) Kafka, S. 2020, Observations from the AAVSO International Database, https://www.aavso.org
- Kato (2022) Kato, T. 2022, arXiv e-prints, arXiv:2203.06320
- Kawash et al. (2021) Kawash, A., Chomiuk, L., Strader, J., et al. 2021, ApJ, 910, 120
- Kniazev et al. (2016) Kniazev, A. Y., Gvaramadze, V. V., & Berdnikov, L. N. 2016, MNRAS, 459, 3068
- Kobulnicky et al. (2003) Kobulnicky, H. A., Nordsieck, K. H., Burgh, E. B., et al. 2003, in Society of Photo-Optical Instrumentation Engineers (SPIE) Conference Series, Vol. 4841, Instrument Design and Performance for Optical/Infrared Ground-based Telescopes, ed. M. Iye & A. F. M. Moorwood, 1634–1644
- Kochanek et al. (2017) Kochanek, C. S., Shappee, B. J., Stanek, K. Z., et al. 2017, PASP, 129, 104502
- Körding et al. (2008) Körding, E., Rupen, M., Knigge, C., et al. 2008, Science, 320, 1318
- Kovetz & Prialnik (1985) Kovetz, A., & Prialnik, D. 1985, ApJ, 291, 812
- Liller et al. (2005) Liller, W., Jacques, C., Pimentel, E., Aguiar, J. G. D. S., & Shida, R. Y. 2005, IAU Circ., 8596, 1
- Liu & Hu (2000) Liu, W., & Hu, J. Y. 2000, ApJS, 128, 387
- Livio (1992) Livio, M. 1992, ApJ, 393, 516
- MacDonald (1996) MacDonald, J. 1996, in Astrophysics and Space Science Library, Vol. 208, IAU Colloq. 158: Cataclysmic Variables and Related Objects, ed. A. Evans & J. H. Wood, 281
- Mainzer et al. (2011) Mainzer, A., Bauer, J., Grav, T., et al. 2011, ApJ, 731, 53
- Mikołajewska (2002) Mikołajewska, J. 2002, MNRAS, 335, L33
- Mikołajewska (2003) Mikołajewska, J. 2003, in Astronomical Society of the Pacific Conference Series, Vol. 303, Symbiotic Stars Probing Stellar Evolution, ed. R. L. M. Corradi, J. Mikolajewska, & T. J. Mahoney, 9
- Mikołajewska (2012) —. 2012, Baltic Astronomy, 21, 5
- Miller-Jones et al. (2013) Miller-Jones, J. C. A., Sivakoff, G. R., Knigge, C., et al. 2013, Science, 340, 950
- Miller-Jones et al. (2011) Miller-Jones, J. C. A., Sivakoff, G. R., Altamirano, D., et al. 2011, in Jets at All Scales, ed. G. E. Romero, R. A. Sunyaev, & T. Belloni, Vol. 275, 224–232
- Mohamed & Podsiadlowski (2007) Mohamed, S., & Podsiadlowski, P. 2007, in Astronomical Society of the Pacific Conference Series, Vol. 372, 15th European Workshop on White Dwarfs, ed. R. Napiwotzki & M. R. Burleigh, 397
- Monet et al. (2003) Monet, D. G., Levine, S. E., Canzian, B., et al. 2003, AJ, 125, 984
- Morales-Rueda & Marsh (2002) Morales-Rueda, L., & Marsh, T. R. 2002, MNRAS, 332, 814
- Mroz & Udalski (2019) Mroz, P., & Udalski, A. 2019, The Astronomer’s Telegram, 12876, 1
- Mróz et al. (2015) Mróz, P., Udalski, A., Poleski, R., et al. 2015, ApJS, 219, 26
- Mróz et al. (2016) Mróz, P., Udalski, A., Pietrukowicz, P., et al. 2016, Nature, 537, 649
- Mukai et al. (2008) Mukai, K., Orio, M., & Della Valle, M. 2008, ApJ, 677, 1248
- Munari (2019) Munari, U. 2019, arXiv e-prints, arXiv:1909.01389
- Munari et al. (2020) Munari, U., Moretti, S., & Maitan, A. 2020, A&A, 639, L10
- Munari et al. (2005) Munari, U., Siviero, A., & Henden, A. 2005, MNRAS, 360, 1257
- Murphy-Glaysher et al. (2022) Murphy-Glaysher, F. J., Darnley, M. J., Harvey, É. J., et al. 2022, MNRAS, 514, 6183
- Ness et al. (2007) Ness, J. U., Schwarz, G. J., Retter, A., et al. 2007, ApJ, 663, 505
- O’Donoghue et al. (2006) O’Donoghue, D., Buckley, D. A. H., Balona, L. A., et al. 2006, MNRAS, 372, 151
- Ogley et al. (2002) Ogley, R. N., Chaty, S., Crocker, M., et al. 2002, MNRAS, 330, 772
- Page et al. (2020) Page, K. L., Beardmore, A. P., & Osborne, J. P. 2020, Advances in Space Research, 66, 1169
- Payne-Gaposchkin (1957) Payne-Gaposchkin, C. H. P. 1957, The galactic novae., ed. I. P. . Amsterdam, North-Holland Pub. Co.; New York
- Ramsay et al. (2017) Ramsay, G., Schreiber, M. R., Gänsicke, B. T., & Wheatley, P. J. 2017, A&A, 604, A107
- Ricker et al. (2015) Ricker, G. R., Winn, J. N., Vanderspek, R., et al. 2015, Journal of Astronomical Telescopes, Instruments, and Systems, 1, 014003
- Roming et al. (2005) Roming, P. W. A., Kennedy, T. E., Mason, K. O., et al. 2005, Space Sci. Rev., 120, 95
- Russell et al. (2016) Russell, T. D., Miller-Jones, J. C. A., Sivakoff, G. R., et al. 2016, MNRAS, 460, 3720
- Sabbadin & Bianchini (1983) Sabbadin, F., & Bianchini, A. 1983, A&AS, 54, 393
- Saito et al. (2012) Saito, R. K., Hempel, M., Minniti, D., et al. 2012, A&A, 537, A107
- Salazar et al. (2017) Salazar, I. V., LeBleu, A., Schaefer, B. E., Landolt, A. U., & Dvorak, S. 2017, MNRAS, 469, 4116
- Schaefer (2010) Schaefer, B. E. 2010, ApJS, 187, 275
- Schaefer & Collazzi (2010) Schaefer, B. E., & Collazzi, A. C. 2010, AJ, 139, 1831
- Schlafly & Finkbeiner (2011) Schlafly, E. F., & Finkbeiner, D. P. 2011, ApJ, 737, 103
- Schwarz et al. (2011) Schwarz, G. J., Ness, J.-U., Osborne, J. P., et al. 2011, ApJS, 197, 31
- Seaquist & Taylor (1990) Seaquist, E. R., & Taylor, A. R. 1990, ApJ, 349, 313
- Seaquist et al. (1984) Seaquist, E. R., Taylor, A. R., & Button, S. 1984, ApJ, 284, 202
- Sekiguchi (1992) Sekiguchi, K. 1992, Nature, 358, 563
- Shafter et al. (2011) Shafter, A. W., Darnley, M. J., Hornoch, K., et al. 2011, ApJ, 734, 12
- Shara et al. (1986) Shara, M. M., Livio, M., Moffat, A. F. J., & Orio, M. 1986, ApJ, 311, 163
- Shara et al. (2012) Shara, M. M., Mizusawa, T., Wehinger, P., et al. 2012, ApJ, 758, 121
- Shara et al. (1984) Shara, M. M., Moffat, A. F. J., McGraw, J. T., et al. 1984, ApJ, 282, 763
- Shara et al. (1977) Shara, M. M., Prialnik, D., & Shaviv, G. 1977, A&A, 61, 363
- Shara et al. (2017) Shara, M. M., Iłkiewicz, K., Mikołajewska, J., et al. 2017, Nature, 548, 558
- Shara et al. (2018) Shara, M. M., Doyle, T. F., Pagnotta, A., et al. 2018, MNRAS, 474, 1746
- Shortridge et al. (1992) Shortridge, K., Meyerdierks, H., & Bridger, A. 1992, Starlink System Note, 40
- Skopal et al. (2013) Skopal, A., Tomov, N. A., & Tomova, M. T. 2013, A&A, 551, L10
- Sokoloski et al. (2006) Sokoloski, J. L., Kenyon, S. J., Espey, B. R., et al. 2006, ApJ, 636, 1002
- Stahl et al. (1999) Stahl, O., Kaufer, A., & Tubbesing, S. 1999, in Astronomical Society of the Pacific Conference Series, Vol. 188, Optical and Infrared Spectroscopy of Circumstellar Matter, ed. E. Guenther, B. Stecklum, & S. Klose, 331
- Starrfield et al. (2020) Starrfield, S., Bose, M., Iliadis, C., et al. 2020, ApJ, 895, 70
- Starrfield et al. (2008) Starrfield, S., Iliadis, C., & Hix, W. R. 2008, in Classical Novae, 2nd Edition. Edited by M.F. Bode and A. Evans. Cambridge Astrophysics Series, No. 43, Cambridge: Cambridge University Press, 2008., 77–101
- Starrfield et al. (2004) Starrfield, S., Timmes, F. X., Hix, W. R., et al. 2004, ApJ, 612, L53
- Starrfield et al. (1972) Starrfield, S., Truran, J. W., Sparks, W. M., & Kutter, G. S. 1972, ApJ, 176, 169
- Steiner et al. (1999) Steiner, J. E., Cieslinski, D., Jablonski, F. J., & Williams, R. E. 1999, A&A, 351, 1021
- Strope et al. (2010) Strope, R. J., Schaefer, B. E., & Henden, A. A. 2010, AJ, 140, 34
- Tappert et al. (2016) Tappert, C., Barria, D., Fuentes Morales, I., et al. 2016, MNRAS, 462, 1371
- Tody (1986) Tody, D. 1986, in Society of Photo-Optical Instrumentation Engineers (SPIE) Conference Series, Vol. 627, Instrumentation in astronomy VI, ed. D. L. Crawford, 733
- Tody (1993) Tody, D. 1993, in Astronomical Society of the Pacific Conference Series, Vol. 52, Astronomical Data Analysis Software and Systems II, ed. R. J. Hanisch, R. J. V. Brissenden, & J. Barnes, 173
- Tokovinin et al. (2013) Tokovinin, A., Fischer, D. A., Bonati, M., et al. 2013, PASP, 125, 1336
- Tomov & Tomova (2013) Tomov, N., & Tomova, M. 2013, Information Bulletin on Variable Stars, 6055, 1
- Udalski et al. (2015) Udalski, A., Szymański, M. K., & Szymański, G. 2015, Acta Astron., 65, 1
- Vogt et al. (2018) Vogt, N., Tappert, C., Puebla, E. C., et al. 2018, MNRAS, 478, 5427
- Walter et al. (2012) Walter, F. M., Battisti, A., Towers, S. E., Bond, H. E., & Stringfellow, G. S. 2012, PASP, 124, 1057
- Wang & Chen (2019) Wang, S., & Chen, X. 2019, ApJ, 877, 116
- Warner (1995) Warner, B. 1995, Cataclysmic variable stars, Vol. 28
- Wilber et al. (2015) Wilber, A., Neric, M., Starrfield, S., Wagner, R. M., & Woodward, C. E. 2015, The Astronomer’s Telegram, 7217, 1
- Williams & Darnley (2018) Williams, S. C., & Darnley, M. J. 2018, The Astronomer’s Telegram, 11995, 1
- Wolf et al. (2013) Wolf, W. M., Bildsten, L., Brooks, J., & Paxton, B. 2013, ApJ, 777, 136
- Yaron et al. (2005) Yaron, O., Prialnik, D., Shara, M. M., & Kovetz, A. 2005, ApJ, 623, 398
- Young et al. (2012) Young, E. T., Becklin, E. E., Marcum, P. M., et al. 2012, ApJ, 749, L17
- Zemko et al. (2015) Zemko, P., Mukai, K., & Orio, M. 2015, ApJ, 807, 61
- Zemko et al. (2017) Zemko, P., Orio, M., Luna, G. J. M., et al. 2017, MNRAS, 469, 476
- Zemko et al. (2016) Zemko, P., Orio, M., Mukai, K., et al. 2016, MNRAS, 460, 2744
Appendix A Supplementary plots and tables
In this Appendix we present supplementary plots and tables.
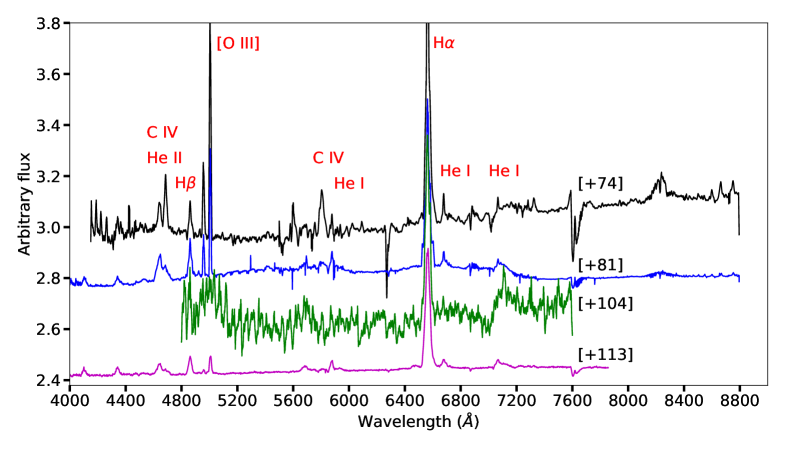
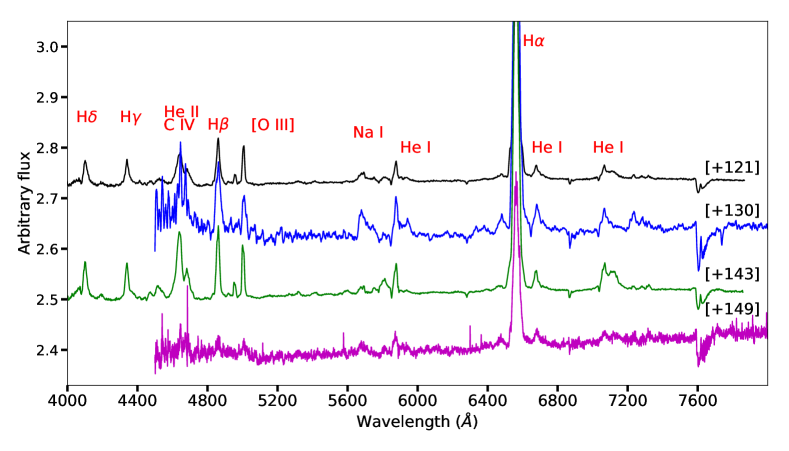
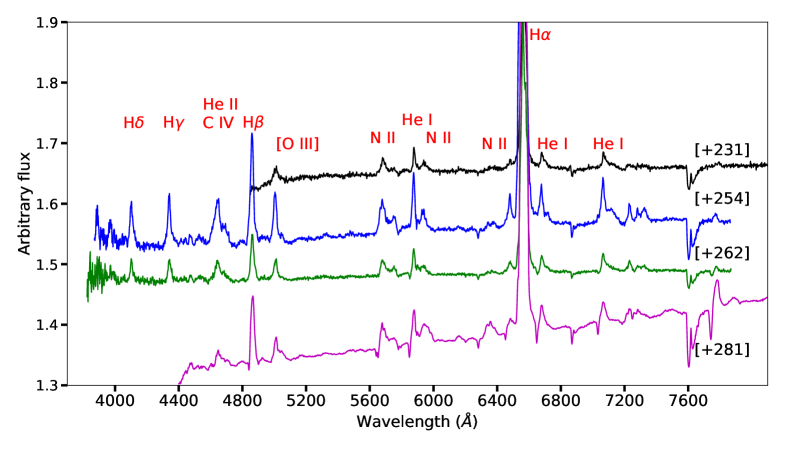
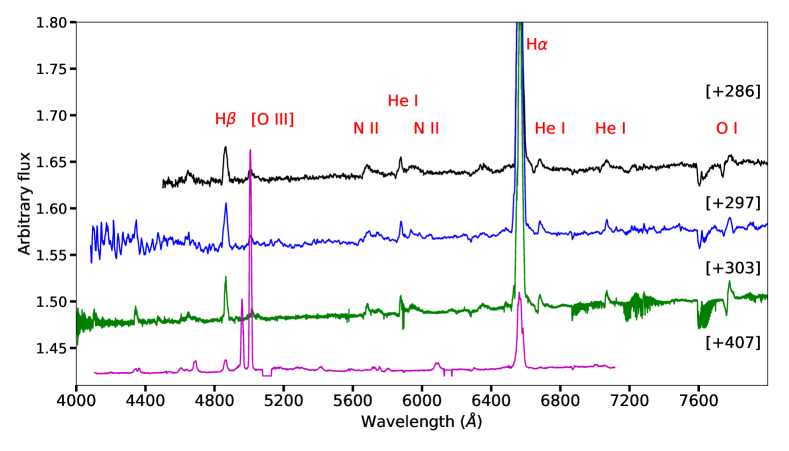
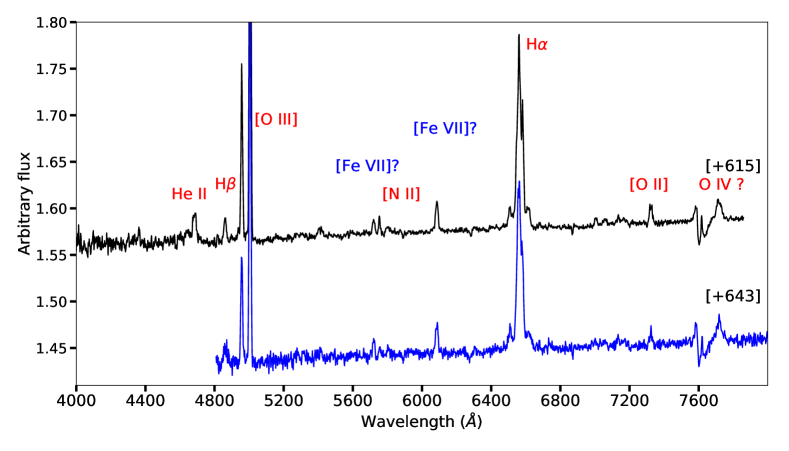
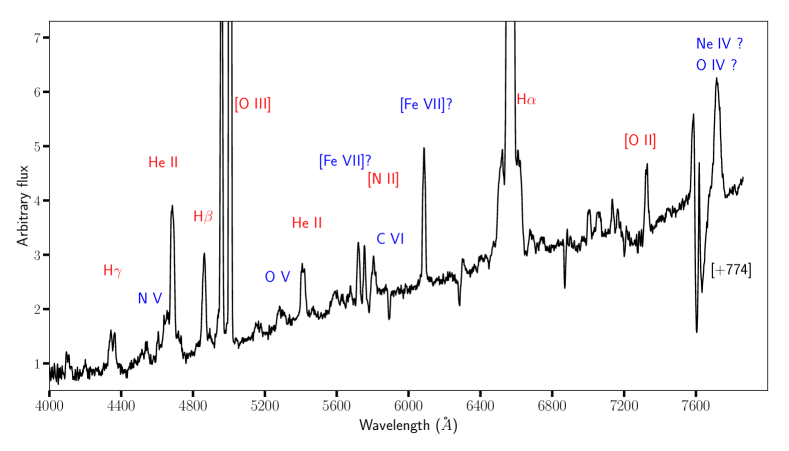
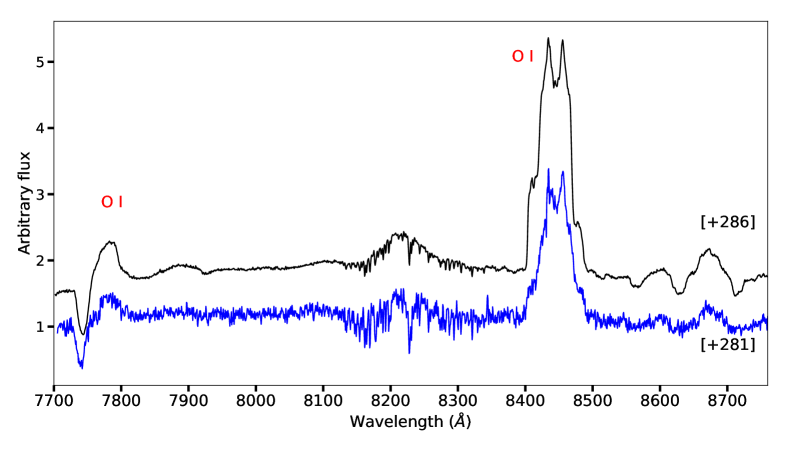
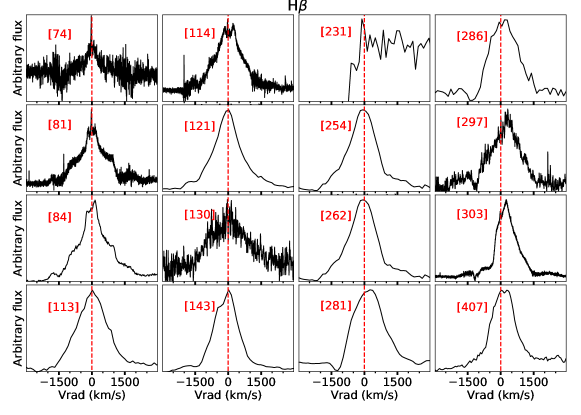
| JD | Magnitude | Err. | Band |
|---|---|---|---|
| 2456437.64553 | 17.190 | 0.037 | I |
| 2456438.65480 | 17.325 | 0.040 | I |
| 2456465.62998 | 17.052 | 0.028 | I |
| 2456467.65411 | 17.075 | 0.033 | I |
| 2456478.47615 | 17.156 | 0.025 | I |
| 2456494.56288 | 17.111 | 0.043 | I |
| 2456500.50861 | 17.094 | 0.032 | I |
| 2456522.47809 | 17.061 | 0.036 | I |
| 2456693.83993 | 16.963 | 0.017 | I |
| 2456699.82818 | 17.020 | 0.020 | I |
| 2456702.84838 | 17.012 | 0.021 | I |
| 2456705.81657 | 16.981 | 0.027 | I |
| 2456713.85601 | 17.076 | 0.021 | I |
| JD | Magnitude | Err. | Band |
|---|---|---|---|
| 2458655.4927 | 15.488 | 0.032 | V |
| 2458655.4938 | 15.503 | 0.026 | V |
| 2458655.4947 | 13.807 | 0.033 | I |
| 2458655.4954 | 13.846 | 0.038 | I |
| 2458655.4962 | 14.672 | 0.029 | R |
| 2458655.4970 | 14.636 | 0.030 | R |
| 2458656.4909 | 15.472 | 0.049 | V |
| 2458656.4911 | 16.674 | 0.065 | B |
| 2458656.4920 | 15.475 | 0.036 | V |
| 2458656.4929 | 13.718 | 0.051 | I |
| 2458656.4936 | 13.709 | 0.040 | I |
| 2458656.4945 | 14.542 | 0.032 | R |
| 2458656.4952 | 14.531 | 0.030 | R |
| 2458656.4963 | 16.497 | 0.056 | B |
| 2458656.4977 | 16.468 | 0.058 | B |
| JD | Magnitude | Err. | Band |
|---|---|---|---|
| 2458656.49902 | 12.265 | 0.016 | H |
| 2458656.50000 | 11.864 | 0.018 | K |
| 2458656.50000 | 13.014 | 0.025 | J |
| 2458657.51172 | 11.465 | 0.019 | K |
| 2458657.51172 | 11.967 | 0.013 | H |
| 2458657.51172 | 12.682 | 0.027 | J |
| 2458657.51562 | 12.057 | 0.012 | H |
| 2458657.51660 | 11.602 | 0.018 | K |
| 2458657.51660 | 12.735 | 0.025 | J |
| 2458660.50195 | 11.327 | 0.018 | K |
| JD | Magnitude | Err. | Band |
|---|---|---|---|
| 2458685.13 | 9.224 | 0.092 | W1 |
| 2458685.13 | 8.382 | 0.083 | W2 |
| 2458887.15 | 8.368 | 0.083 | W1 |
| 2458887.15 | 7.741 | 0.074 | W2 |
| 2458894.82 | 8.585 | 0.085 | W1 |
| 2458894.82 | 7.998 | 0.079 | W2 |
| 2459049.28 | 12.119 | 0.121 | W1 |
| 2459049.28 | 10.737 | 0.107 | W2 |
| Telescope | Instrument | date | Resolving power | Range | |
|---|---|---|---|---|---|
| (days) | () | ||||
| SALT | HRS | 2019-06-19 | 74 | 14000 | 4000 – 9000 |
| SALT | HRS | 2019-06-26 | 81 | 14000 | 4000 – 9000 |
| SOAR | Goodman | 2019-06-29 | 84 | 5000 | 4500 – 5170 |
| SOAR | Goodman | 2019-06-29 | 84 | 5000 | 6130 – 6710 |
| SMARTS | CHIRON | 2019-07-17 | 104 | 28000 | 4080 – 8900 |
| SOAR | Goodman | 2019-07-28 | 113 | 1000 | 3800 – 7800 |
| SOAR | Goodman | 2019-07-28 | 113 | 5000 | 6130 – 6710 |
| SALT | HRS | 2019-07-29 | 114 | 14000 | 4000 – 9000 |
| SOAR | Goodman | 2019-08-05 | 121 | 1000 | 3800 – 7800 |
| SOAR | Goodman | 2019-08-05 | 121 | 5000 | 6130 – 6710 |
| SMARTS | CHIRON | 2019-08-14 | 130 | 28000 | 4080 – 8900 |
| SOAR | Goodman | 2019-08-27 | 143 | 1000 | 3800 – 7800 |
| SOAR | Goodman | 2019-08-27 | 143 | 5000 | 6130 – 6710 |
| SMARTS | CHIRON | 2019-09-02 | 149 | 28000 | 4080 – 8900 |
| SOAR | Goodman | 2019-11-23 | 231 | 1000 | 3800 – 7800 |
| SOAR | Goodman | 2019-11-23 | 231 | 5000 | 6130 – 6710 |
| SOAR | Goodman | 2019-12-16 | 254 | 1000 | 3800 – 7800 |
| SOAR | Goodman | 2019-12-16 | 254 | 5000 | 6130 – 6710 |
| SOAR | Goodman | 2019-12-24 | 262 | 1000 | 3800 – 7800 |
| SOAR | Goodman | 2019-12-24 | 262 | 5000 | 6130 – 6710 |
| SOAR | Goodman | 2020-01-12 | 281 | 1000 | 3800 – 7800 |
| SOAR | Goodman | 2020-01-12 | 281 | 2800 | 7700 – 8870 |
| SOAR | Goodman | 2020-01-12 | 281 | 5000 | 6130 – 6710 |
| SOAR | Goodman | 2020-01-17 | 286 | 1000 | 3800 – 7800 |
| SOAR | Goodman | 2020-01-17 | 286 | 2800 | 7700 – 8870 |
| SOAR | Goodman | 2020-01-17 | 286 | 5000 | 6130 – 6710 |
| SMARTS | CHIRON | 2020-01-28 | 297 | 28000 | 4080 – 8900 |
| SALT | HRS | 2020-02-03 | 303 | 14000 | 4000 – 9000 |
| SALT | RSS | 2020-05-17 | 407 | 1500 | 4100 – 7200 |
| SOAR | Goodman | 2020-11-12 | 615 | 1000 | 3800 – 7800 |
| SOAR | Goodman | 2021-01-08 | 643 | 1000 | 3800 – 7800 |
| Date | Wavelength | Integration | airmass (mean) | standard star | ||
|---|---|---|---|---|---|---|
| (days) | (m) | / | (s) | |||
| 2020-02-23 | 323 | 1.17 – 1.30 | 3,000 | 1200 | 1.64 | (a) |
| 2020-02-23 | 323 | 1.49 – 1.78 | 3,000 | 1200 | 1.52 | HIP63036 |
| 2020-02-23 | 323 | 1.95 – 2.45 | 3,000 | 1200 | 1.42 | HIP63036 |
| 2020-03-01 | 330 | 0.89 – 1.75 | 1,200 | 120 | 1.63 | HIP63036 |
| Date | MJD | () | Peak flux | Int. fluxaaSpectra of HIP63036 and HIP67360 combined to match airmass of V1047 Cen. | |
|---|---|---|---|---|---|
| (days) | (mJy beam-1) | (mJy) | |||
| 2019-11-26 | 58813.18 | 234.07 | |||
| 2019-12-15 | 58832.40 | 253.29 | |||
| 2019-12-20 | 58837.44 | 258.33 | |||
| 2019-12-28 | 58845.28 | 266.17 | |||
| 2020-01-03 | 58851.41 | 272.30 | |||
| 2020-01-10 | 58858.42 | 279.31 | |||
| 2020-01-20 | 58868.21 | 289.10 | |||
| 2020-01-25 | 58873.18 | 294.07 | |||
| 2020-02-01 | 58880.29 | 301.18 | |||
| 2020-02-08 | 58887.20 | 308.09 | |||
| 2020-02-15 | 58894.16 | 315.05 | |||
| 2020-02-21 | 58900.25 | 321.14 | |||
| 2020-03-02 | 58910.16 | 331.05 | |||
| 2021-03-06 | 59279.20 | 700.09 |
| JD | Magnitude | Err. | Band |
|---|---|---|---|
| 2458659.1322 | 17.533 | 0.084 | uvw1 |
| 2458688.9402 | 17.525 | 0.080 | uvw1 |
| 2458703.2580 | 16.927 | 0.068 | uvw1 |
| 2458659.1284 | 19.492 | 0.281 | uvm2 |
| 2458703.2548 | 18.816 | 0.188 | uvm2 |
| 2458709.9321 | 18.564 | 0.159 | uvm2 |
| 2458718.3840 | 18.099 | 0.179 | uvw2 |
| 2458722.2083 | 18.415 | 0.122 | uvw2 |
| 2458731.7276 | 18.178 | 0.126 | uvw2 |
| Name | RAJ2000 | DECJ2000 | CN Epoch | CN peak | DN Epoch | DN Peak |
|---|---|---|---|---|---|---|
| h m s | ∘ ′ | date | mag | date | mag | |
| GK Per | 03 31 12.01 | +43 54 15.5 | 2415439/1901-02-23 | = 0.2 | 1981 | 10.2 |
| V392 Per | 04 43 21.37 | +47 21 25.9 | 2458238/2018-04-29 | =6.3 | 1999-04 | 13 |
| GI Mon | 07 26 47.11 | 06 40 29.7 | 1918 | = 5.2 | ||
| AT Cnc | 08 28 36.93 | +25 20 03.0 | 1645 | ? | 2005 | 12.5 |
| V1213 Cen | 13 31 15.81 | 63 57 38.0 | 2009-05-08 | = 8.5 | 2003 | = 19.5 |
| X Ser | 16 19 17.69 | 02 29 29.5 | 1903-03-26 | 8.9 | 2016-09-03 | 14 |
| Nova Sco 1437 | 17 01 28.15 | 43 06 12.3 | 1437 | ? | 2017-05-27 | = 13.2 |
| V2109 Oph | 17 24 16.04 | 24 36 50.0 | 1969-06-08 | = 8.9 | 2021-08-24 | = 16.5 |
| V908 Oph | 17 28 04.58 | 27 43 04.4 | 2434925/1954-07-01 | 9 | OGLE-IV 2010 | =18.2 |
| V728 Sco | 17 39 13.24 | -45 28 45.7 | 1862 | = 5.0 | 2013-2015 | 17 |
| V1017 Sgr | 18 32 04.47 | 29 23 12.6 | 1919 | = 6.4 | 1973 | 10.5 |
| V446 Her | 18 57 21.60 | 13 14 29.0 | 1960-03-03 | 2.8 | 1994 | 15.8 |
| V606 Aql | 19 20 24.29 | 00 08 07.8 | 1899-04-21 | 5.5 | 2019-10-20 | = 19 |
| WY Sge | 19 32 43.87 | +17 44 54.5 | 1783 | 5.4 | 1982-06-17 | 17.7 |
| V476 Cyg | 19 58 24.46 | +53 37 07.5 | 1920 | 2.0 | 2019-08-24 | 16.5 |
Note. — GK Per: Sabbadin & Bianchini (1983); Zemko et al. (2017); Williams & Darnley (2018), V392 Per: Liu & Hu (2000); Munari et al. (2020); Murphy-Glaysher et al. (2022), AT Cnc: Shara et al. (2012), V1017 Sgr: Salazar et al. (2017), V908 Oph: Tappert et al. (2016); Mróz et al. (2015),V606 Aql: Tappert et al. (2016); Duerbeck (1987); Bellm et al. (2019),WY Sge: Shara et al. (1984), X Ser: Payne-Gaposchkin (1957), V446 Her: Cragg (1960), Nova Sco 1437: Kochanek et al. (2017); Shara et al. (2017) V1213 Cen: Mróz et al. (2016), V728 Sco: Vogt et al. (2018); Kato (2022), V476 Cyg: Kato (2022). For systems with multiple dwarf nova outbursts, we list the brightest detected outburst found from a literature search. The objects in this table were found by searching the AAVSO Variable Star Index (VSX) for variability types containing a classical nova plus a dwarf nova identifier. It is possible that this list is not complete.