Importance of the many-body effects for structural properties of the novel iron oxide: Fe2O
Abstract
The importance of many-body effects on electronic and magnetic properties and stability of different structural phases was studied in novel iron oxide - Fe2O. It was found that while Hubbard repulsion hardly affects the electronic spectrum of this material (), but it strongly changes its phase diagram shifting critical pressures of structural transitions to much lower values. Moreover, one of the previously obtained in the density functional theory (DFT) structures (Pm1) becomes energetically unstable if many-body effects are taken into consideration. It is shown that this is an account of magnetic moment fluctuations in the DFT+DMFT approach, which strongly contributes to modification of the phase diagram of Fe2O.
pacs:
71.27.+a, 71.20.-b, 71.15.Mb, 61.50.Ks, 62.50.-pIntroduction. Substantial progress in studying and prediction of novel structures under high pressure including ones of iron oxides was achieved since methods which combine ab initio calculations with algorithms of crystal structure generation were developed. In their seminal work Weerasinghe and co-authors obtained the set of different structures for various iron oxides, which can be reliazed at high pressures Weerasinghe2015 . Some of these materials, e.g. FeO2 and Fe2O do not exist at ambient conditions. Further experimental investigations did found evidence of FeO2 formation at pressures GPa and very high temperature K exactly in previously predicted crystal structure Hu2016 . This discovery opened up the Pandora’s box, since stabilization of novel iron oxides, which physical properties can be very different from conventional ones is very important for the Geoscience. In effect, this result even led to reexamination of different geological models describing our planet, reconsideration of the water role and composition of the Earth’s core-mantle boundary Hu2016 ; Yagi2016 ; Liu2017 ; Thompson2017 ; Mao2017 ; Pushcharovsky2019 . This impressive progress induced by the first principle calculations, however, raised many questions as those related to account of other ingredients, which exist in the Earth’s interior (such as e.g hydrogen Nishi2017 ; Hu2017 ; Shorikov2018 ; Liu2019 ; Shorikov2020 ; Lu2018 ; Zhang2018 ), and others connected with applicability of the density functional theory (DFT) calculations for predictions of high-pressure phases and analysis of their physical properties. In particular it is known from long ago that strong electron Coulomb correlations, may dramatically change not only structural stability Shorikov2018b , but also electronic and magnetic properties of iron oxides and sulphides Streltsov2017b ; Ushakov2017 ; Shorikov2015a ; Skorikov2015 . Recently importance of weak Coulomb correlations for description of phase diagram was demonstrated even for elemental Ca Novoselov2020 .
In the present paper we studied this effect on example of Fe2O, which was predicted by DFT to be more stable than assemblage of conventional FeO and pure iron at pressures larger than 270 GPa Huang2018 using state-of-the art DFT+DMFT method, which was previously used for description of such materials as Fe Leonov , FeO2 Streltsov2017b , FeS Ushakov2017 and many others under pressure. We show that while there is only a relatively weak effective mass renormalization () and spectral and magnetic properties seems to be describable by the DFT, nevertheless many-body effects drastically affect phase diagram of Fe2O. In particular the Pm1 phase predicted by DFT was found unstable in the DFT+DMFT calculations. More important we found that the I4/mmm phase should be stable at much lower pressures 170 GPa and transforms into assemblage of Pnma FeO and hcp-Fe with decrease of temperature.
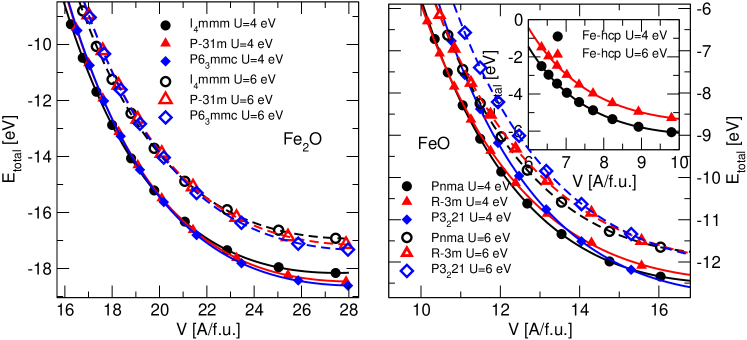
Computational details. The DFT calculations were carried out with the pseudopotential VASP package Kresse1996 using the PBE exchange-correlation functional Perdew1996 . At the first stage of our study we constructed series of Fe2O crystal structures with three different cell symmetries, namely: I4/mmm, P/mmc and Pm1 and different volumes from 8 to 14 per iron atom, FeO in Rm and Pnma and pure iron in hcp structures using full structural relaxation. Then the Wannier function projection procedure Korotin2008 was used to extract the non-interacting DFT Hamiltonian . Specific crystal structures of Fe2O results in complicated picture of band structure where both and states of iron are presented in the vicinity the Fermi level. Therefore minimal set of the Wannier functions, which has to be included to reproduce DFT bands is - and -states of Fe and -states of O.
Dynamic nature of Coulomb correlations were taken into account in frameworks of the DFT+DMFT methodAnisimov1997 . This approach was successfully used in investigating different magnetic phenomena, including spin state transitions under high pressure Dyachenko2012 ; Skorikov2015 and many others. In contrast to DFT+U method, DFT+DMFT provides more accurate treatment of Coulomb interaction considering frequency dependence of the self-energy and simulating a paramagnetic state which is expected at such high temperatures and pressures. The full many-body Hamiltonian to be solved in DFT+DMFT has the form:
| (1) |
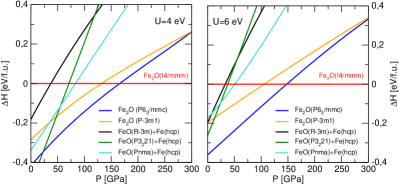
Here is the Coulomb interaction matrix and is the occupation number operator for the electrons with orbital and spin indices on the -th site. The elements of matrix are parameterized by the on-site Hubbard parameter and Hund’s intra-atomic exchange according to the procedure described in Ref Lichtenstein1998 . parameter stands for the energy cost of double occupancy of a local orbital. Its value changes the orbital localization and therefore affects on the total energy and phase stability. The value of parameter for iron oxides used in previous works varies from 4.6 eV Pickett1998 to 8 eV Leonov2020 . In our calculations we set eV and eV. These values were successfully used previously to describe electronic properties of various Fe oxides Ushakov2017 ; Anisimov2008 ; Streltsov2017b . However, it was shown that should decrease under pressure as a result of more efficient screening due to increase of hybridization strength and decrease of localization Skorikov2015 ; Dyachenko2016 . For testing the dependence of phase stability on we also performed additional calculations for eV, their results are shown in Fig. 1 (left panel) and in supplementary materials. All results, if not stated otherwise, presented below were obtained for eV.
The term in (1) stands for the so called double-counting correction i.e. the - interaction energy already accounted by DFT. We choose the double-counting term in the form Anisimov1997 . Here is the total self-consistent number of electrons obtained within the DFT+DMFT, is the average Coulomb parameter for the shell and is the identity operator.
The effective DMFT impurity problem was solved by the hybridization expansion Continuous-Time Quantum Monte-Carlo method (CT-QMC-HYB) Gull2011 as implemented in the AMULET simulation package AMULET . We apply diagonal solver with the density-density form of Coulomb correlation term. In the case of I4/mmm crystallographic axes coincide with direction to next nearest neighbours and no additional transformation were needed. All DFT Hamiltonian for P/mmc and cells were additionally diagonalized which correspond to transformation into trigonal coordinate system in which Hamiltonians become diagonal. For the sake of simplicity we used notation of orbitals from trigonal symmetry: , and . The calculations were performed for the paramagnetic state at a series of electronic temperatures () from 589 K to 2000 K. Total energy was calculated within the DFT+DMFT as described in Ref. Amadon2006 . Next, the DFT and DFT+DMFT total energies were fitted using third-order Birch-Murnaghan equation of states Birch1947 for calculating enthalpies and constructing the P-T phase diagram. To compute the spectral properties and renormalizations of the quasiparticle mass we used the real-axis self-energy obtained by the Padé analytical continuation procedure pade .
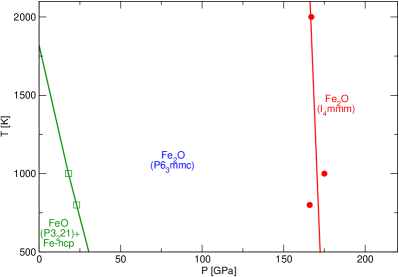
Structural stability of different phases of Fe2O. Different structural phases of Fe2O were studied by Weerasinghe et al., and Huang et al. using DFT calculations Weerasinghe2015 ; Huang2018 . According to Ref. Weerasinghe2015 Fe2O is formed at pressures 100 GPa. They found that below 180 GPa Weerasinghe2015 (212 GPa Huang2018 ) it has the P/mmc structure. Then it transforms to the Pm1 phase and finally at 288 GPa Weerasinghe2015 (266 GPa Huang2018 ) to the I4/mmm structure. It was shown in Ref. Huang2018 that above 266 GPa I4/mmm phase of Fe2O is not only statically and dynamically stable, but also becomes more energetically favourable than the assemblage of hcp-Fe and Rm-FeO. Thus, one might expect that this is Fe2O with I4/mmm symmetry that realizes at very high pressure. Our DFT results basically agree with this picture with transition pressures 150 and 250 GPa SI .
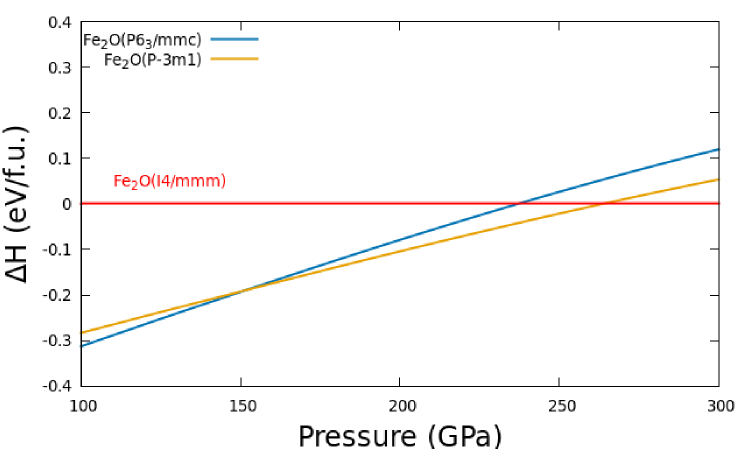
However, accounting for many-body effects in the DFT+DMFT calculation scheme substantially modifies phase diagram of Fe2O. First of all, one readily sees from Fig. 1, where relative enthalpy of different phases at K is plotted, that they decrease critical pressure for transition to the I4/mmm structure on GPa, down to 150 GPa (on GPa, down to 170 GPa for = 4 eV). Moreover, many-body effects strongly destabilize Pm1 phase so that it does not realize at investigated temperature and pressure range for any reasonable value.
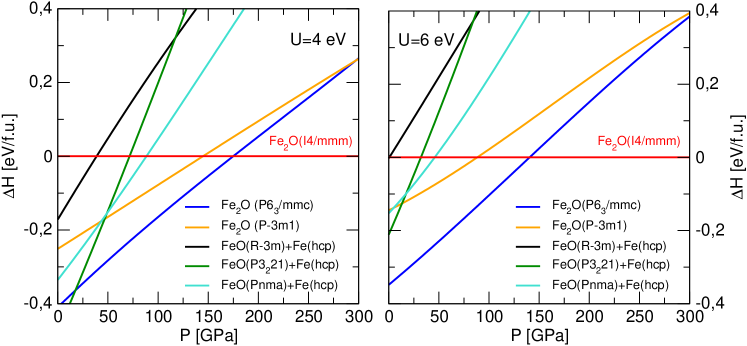
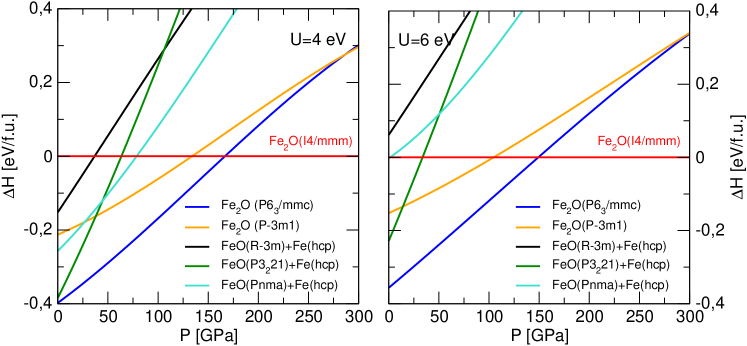
In addition to calculations of relative stability of different structures we also computed enthalphy of Fe2O formation taking similarly to Ref. Huang2018 assemblage of FeO and hcp-Fe as a reference point. Three structural phases of FeO (Rm, P3221, and Pnma) were taken into account according to Ref. Weerasinghe2015 . Corresponding enthalpies are presented again in Fig. 1. One might see that many-body effects also strongly stabilize the I4/mmm structure. E.g. according to DFT+DMFT calculations at temperatures of 600 K Fe2O can be formed only for pressures larger 150 GPa, while this critical pressure was much higher in DFT: GPa (see Fig. S1 in Ref. SI ). As it has been mentioned above this critical pressure shifts to higher values for smaller . One can also notice that for eV Fe2O decomposes onto FeO and elemental Fe at slightly smaller pressure.
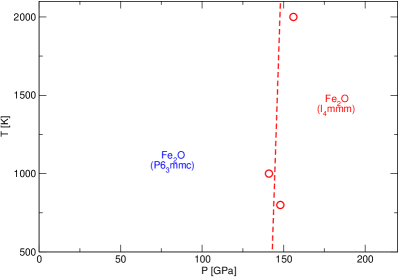
Full phase diagram is presented in Fig. 12. We see that, below GPa P/mmc phase of Fe2O turns out to be statically stable at temperatures higher than 800 K, while above this pressure Fe2O has the I4/mmm structure. Note that for lower value at lower pressure and low temperature Fe2O decomposes into mixture of FeO in P3221 structure and pure iron. Since this phase transition is sensitive to parameter choice more accurate estimation of Coulomb parameters is needed. Note also that this transition occurs at rather low temperatures, which are seemingly irrelevant for the conditions of outer Earth’s core.
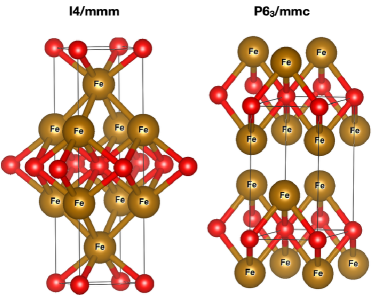
Crystal structure of stable phases. The crystal structure of the I4/mmm phase is shown in left panel of Fig. 3. Basically it can be described as two Fe square lattices sandwiched by O square lattices. These two Fe lattices are shifted with respect to each other in such a way that Fe ions of one lattice are on the top of voids of another one. It is worth mentioning that in fact distance between Fe ions within the square lattice is even larger than Fe-Fe bond distance between planes, e.g. for GPa the first one is 2.137 Å, while the second is 2.063 Å. Thus these are not two isolated planes, but a single object. It also has to be mentioned that both distances are smaller than Fe-Fe distance in metallic Fe at ambient conditions (2.482 Å Streltsov-UFN ). These Fe-Fe distance are still larger than Fe-O distance (1.88 Å), but the difference is not that large.
Crystal structure of the P/mmc phase reminds I4/mmm, see Fig. 3. There are again two planes of Fe ions, but now they form triangular (not square) lattice with Fe-Fe distance 2.352 Å and interplane Fe-Fe distance 2.252 Å at GPa. Each Fe ion stands on the top or bottom of three (four in I4/mmm) oxygens. The Fe-O distances at GPa are 1.908 Å.
Electronic and magnetic properties. While we have clearly seen that many-body effects strongly affect phase stability in Fe2O it is interesting how they change electronic and magnetic properties.
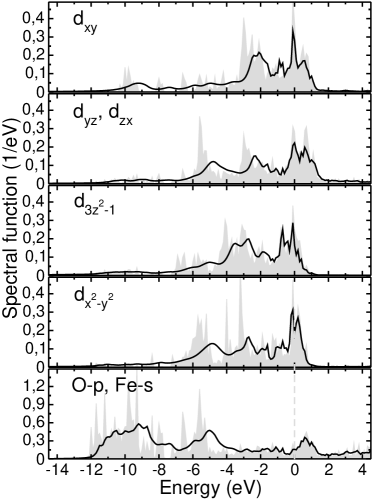
Fig. 4 shows orbitally resolved spectral function for the I4/mmm structure at 170 GPa as obtained in DFT+DMFT compared with densities of states (DOS) calculated in DFT. The Fe bandwidth exceeds 8 eV at the DFT level. The DFT+DMFT calculations demonstrate that correlations have only a minor effect on spectral spectral properties of such broad bands. Spectral function obtained in DFT+DMFT at 580 K is rather similar to the DFT density of states, but is slightly smoothed by temperature. Effect of finite temperature taken into account in DMFT leads to broadening of all bands and to smearing of narrow peaks in the spectrum. The shape of spectral function corresponding to Fe states undergoes the most dramatic changes. The peak at the Fermi level is smoothed and the width of whole the Fe band slightly decreases due to correlation effects. Table 1 shows the calculated effective mass renormalization , where . The obtained average value of effective mass enhancement is rather small (1.2) which indicates weak or intermediate correlation strength regime. One can see that Fe2O remains metallic and there is a small narrowing of spectral function, which is in agreement with values presented below.
| Phase | , | ||||
|---|---|---|---|---|---|
| I4/mmm | |||||
| Pm1 | |||||
| P/mmc |
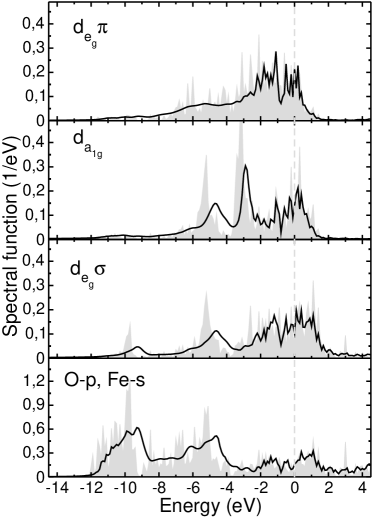
Electronic structure of the P/mmc phase is rather similar to what we had for the I4/mmm structure. The width () of bands is of order of 8-10 eV. Correlation effects are not pronounced, , and again result only in thermal broadening, see Fig. 5. It also has to be mentioned that the correlation strength in Fe2O and in FeO at pressures GPa is of the same order, in FeO .
It has to be mentioned that the difference between DFT and DFT+DMFT is not only in account of strong Hubbard correlations and the fact that effective mass renormalization is small (correlations are weak) does not contradict to a strong modification of the phase diagram in DMFT discussed previously. In addition to explicit account of on-site electronic correlation effects DMFT calculations also include various thermal and quantum fluctuations in consideration. E.g. DMFT can treat a true paramagnetic ground state with short-range spin correlations, but without any long-range magnetic order. This is very different from DFT, which simulates such states by a nonmagnetic (zero magnetic moments) state or by some ferro- or antiferromagnetic state (we do not consider here some special DFT calculations with large supercell). We will show further on that the magnetic moments do exist in Fe2O, they strongly fluctuate, but this affects the physical properties of the material under consideration.
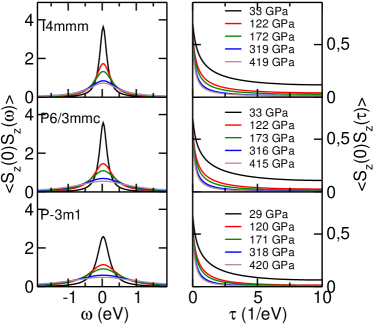
The local spin-spin correlation function on the imaginary time () axis characterizes the lifetime of the local moment: if the magnetic moments are localized, this correlation function is constant: , on the other hand, the imaginary time dependence of this correlation function indicates the delocalization of spin moments. The behavior of for three phases of Fe2O is shown in Fig. 6 (right panels). Rapid drop of this correlation function with implies that magnetic moments are almost itinerant in all phases and moreover localization degree decreases with pressure which agrees well with low value and this is exactly what one expects to have at high pressure due to bands broadening. The observed behavior of these correlation functions is traced in analytical continuation of them on real energy axis , see left panel of Fig. 6. The half-width of this function is inverse proportional to lifetime of local magnetic moment Igoshev2013 . The most interesting result is that Pm1 demonstrates substantially lower degree of localization than the I4/mmm and P/mmc phases at similar pressures. As we will see below this substantially decreases the total energy of this phase.
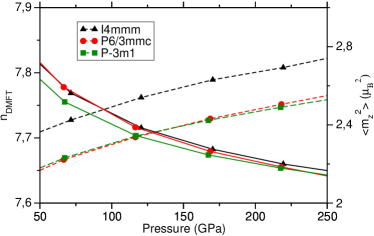
In all studied structures Fe ions were found to adopt the low spin (LS) state and the ground state is paramagnetic (no long range magnetic ordering). Fig. 7 shows pressure dependence of the instant squared magnetic moments calculated within DFT+DMFT and the total number of -electrons at K for all phases. The magnitude of average local moment decreases gradually with pressure, e.g. in the P/mmc phase it is 2.9 at ambient pressure (AP) and 2.0 at 400 GPa. Similar behavior was observed for the I4/mmm phase (2.8 and 2.0 ). The total number of -electrons increases since the band width growths with pressure as a consequence of the increase of orbital overlap implying decrease of ratio. Here again we see that Pm1 demonstrates lower magnitude of local moment than I4/mmm and P63/mmc which show slightly higher and almost equal value of .
This behavior correlates with the fact that the Pm1 phase turns out to be more itinerant at the pressure up to 220 GPa than other phases as it was explained above. This phase could have been realized in pressure range from 150 to 260 GPa in DFT, but smaller instant magnetic moment strongly destabilizes it in DMFT. Indeed for itinerant magnets contribution of the magnetic energy is known to be proportional to , where is the magnetic moment and is the Stoner parameter, which can be roughly approximated by Hund’s intra-atomic exchange, i.e. 1 eV. Taking realistic estimates of from the DFT+DMFT calculations we see that difference in magnetic energy between the Pm1 and other phases is 0.12 eV/atom. This contribution strongly increases enthalpy of the Pm1 phase and therefore explains its destabilization in DMFT calculations. While I4/mmm has the largest instant magnetic moment in pressure range from 150 to 260 GPa we can not exclude that other factors such as e.g. some specific features of the electronic structure may also affect the resultant energetics.
Conclusions. We demonstrated that accounting for many-body effects is crucial for correct description of phase stability of Fe2O at high pressures corresponding to the Earth’s outer core. The DFT+DMFT calculations show that magnetic moments in this material are nearly itinerant and electronic mass enhancement is small which implies weak or intermediate correlation strength regime. Spectral function remains almost unchanged with respect to DFT, but smoothed and narrowed in vicinity of the Fermi level. On the other hand many-effects have strong impact on the phase diagram. The stability field of the I4/mmm phase is shifted towards lower pressures on 80 GPa (with respect to DFT). The Pm1 phase becomes unstable in the whole pressure range mostly due to lower magnitude of magnetic moment and hence lower impact of magnetic energy.
Acknowledgments. The DFT+DMFT calculations were supported by the Russian Science Foundation (Project No. 19-72-30043). The calculations of phase diagram were performed within project “Quantum” No. AAAA-A18-118020190095-4 and contract 02.A03.21.0006 of the Russian Ministry of Science and High Education.
References
- (1) G. L. Weerasinghe, C. J. Pickard, and R. J. Needs, J. Phys. Condens. Matter 27, 455501 (2015).
- (2) Q. Hu, D. Y. Kim, W. Yang, L. Yang, Y. Meng, L. Zhang, and H. Mao, Nature 534, 241 (2016).
- (3) T. Yagi, Nature 534, 183 (2016).
- (4) J. Liu, Q. Hu, D. Y. Kim, Z. Wu, W. Wang, Y. Xiao, P. Chow, Y. Meng, V. B. Prakapenka, H. Mao, and W. L. Mao, Nature 551, 494 (2017).
- (5) H. K. Mao, Q. Hu, L. Yang, J. Liu, D. Y. Kim, Y. Meng, L. Zhang, V. B. Prakapenka, W. Yang, and W. L. Mao, Natl. Sci. Rev. 4, 870 (2017).
- (6) E. C. Thompson, A. J. Campbell, and J. Tsuchiya, J. Geophys. Res. 122, 5038 (2017).
- (7) D. Y. Pushcharovsky, Geochemistry Int. 57, 941 (2019).
- (8) M. Nishi, Y. Kuwayama, J. Tsuchiya, and T. Tsuchiya, Nature 547, 205 (2017).
- (9) Q. Hu, D. Young, J. Liu, Y. Meng, L. Yang, D. Zhang, and W. L. Mao, Proc. Natl. Acad. Sci. 114, 1498 (2017).
- (10) A. O. Shorikov, A. I. Poteryaev, V. I. Anisimov, and S. V Streltsov, Phys. Rev. B 98, 165145 (2018).
- (11) J. Liu, Q. Hu, W. Bi, L. Yang, Y. Xiao, P. Chow, Y. Meng, V. B. Prakapenka, H. Mao, and W. L. Mao, Nat. Commun. 10, 153 (2019).
- (12) A. O. Shorikov, S. L. Skornyakov, V. I. Anisimov, S. V. Streltsov, and A. I. Poteryaev, Molecules 25, 2211 (2020).
- (13) C Lu, M. Amsler, and C. Chen Phys. Rev. B 98, 054102 (2018)
- (14) J. Zhang, J. Lv, H. Li, X. Feng, C. Lu, S.A.T. Redfern, H. Liu, Y. Ma, Phys. Rev. Lett. 21, 255703 (2018)
- (15) A. O. Shorikov, V. V. Roizen, A.R. Oganov and V. I. Anisimov, Phys. Rev. B 98, 094112 (2018)
- (16) S. V. Streltsov, A. O. Shorikov, S. L. Skornyakov, and A. I. Poteryaev, Sci. Rep. 7, 13005 (2017).
- (17) V. I. Anisimov, D. M. Korotin, S. V. Streltsov, A. V. Kozhevnikov, J. Kunes, A. O. Shorikov, and M. A. Korotin, JETP Lett. 88, 729 (2008).
- (18) A.V. Ushakov, A.O. Shorikov, V.I. Anisimov, N.V. Baranov, S.V. Streltsov, Phys. Rev. B 95, 205116 (2017).
- (19) A. O. Shorikov, A. V. Lukoyanov, V. I. Anisimov, and S. Y. Savrasov, Phys. Rev. B 92, 035125 (2015).
- (20) N. A. Skorikov, A. O. Shorikov, S. L. Skornyakov, M. A. Korotin, and V. I. Anisimov, J. Phys.: Condens. Matter 27, 275501 (2015).
- (21) D. Novoselov, D. Korotin, A. Shorikov, A. Oganov, V. Anisimov, J. Phys: Cond. Matt. 32 445501 (2020).
- (22) I. Leonov, A. I. Poteryaev, V. I. Anisimov, and D. Vollhardt Phys. Rev. Lett. 106, 106405 (2011).
- (23) S. Huang, X. Wu and S. Qin, Scientific Reports 8, 236 (2018).
- (24) G. Kresse and J. Furthmüller, Physical Review B 54, 11169 (1996).
- (25) J.P. Perdew, K. Burke, and M. Ernzerhof, Physical Review Letters 77, 3865 (1996).
- (26) D. Korotin, A. V. Kozhevnikov, S. L. Skornyakov, I. Leonov, N. Binggeli, V. I. Anisimov, and G. Trimarchi, Eur. Phys. J. B 65, 91 (2008).
- (27) V.I. Anisimov et al., Journal of Physics: Condensed Matter 9, 7359 (1997).
- (28) A.A. Dyachenko, A.O. Shorikov, A.V. Lukoyanov and V.I. Anisimov, JETP Letters B 96, 56-60 (2012).
- (29) A. I. Lichtenstein and M. I. Katsnelson, Phys. Rev. B 57, 6884 (1998).
- (30) W.E. Pickett, S.C. Erwin and E.C. Ethridge, Phys. Rev. B 58, 1201-1209 (1998).
- (31) I. Leonov, A. O. Shorikov, V. I. Anisimov and I. A. Abrikosov, Phys. Rev. B 101, 245144 (2020).
- (32) A.A. Dyachenko, A.O. Shorikov, A.V. Lukoyanov and V.I. Anisimov, Phys. Rev. B 93, 245121 (2016).
- (33) E. Gull, A. J. Millis, A. I. Lichtenstein, A. N. Rubtsov, M. Troyer, and P. Werner, Rev. Mod. Phys. 83, 349 (2011).
- (34) A. Poteryaev, A. Belozerov, A. Dyachenko, D. Korotin, M. Korotin, A. Shorikov, N. Skorikov, S. Skornyakov, and S. Streltsov, “AMULET,” http://amulet-code.org.
- (35) B. Amadon, S. Biermann, A. Georges, F. Aryasetiawan, Physical Review Letters 96, 066402 (2006).
- (36) F. Birch, Physical Review 71, 809 (1947).
- (37) H.J. Vidberg and J.E. Serene, J. Low Temp. Phys. 29, 179 (1977)
- (38) A.O. Shorikov and S.V. Streltsov Supplemental materials.
- (39) S. V. Streltsov and D. I. Khomskii, Physics-Uspekhi 60, 1121 (2017).
- (40) P. A. Igoshev, A. V. Efremov, A. I. Poteryaev, A. A. Katanin, and V. I. Anisimov, Phys. Rev. B 88, 155120 (2013).
Supplemental information
.
.