Avalanches and Structural Change in Cyclically Sheared Silica Glass
Abstract
We investigate avalanches associated with plastic rearrangements and the nature of structural change in the prototypical strong glass, silica, computationally. Although qualitative aspects of yielding in silica are similar to other glasses, we find that the statistics of avalanches exhibits non-trivial behaviour. Investigating the statistics of avalanches and clusters in detail, we propose and verify a new relation between exponents characterizing the size distribution of avalanches and clusters. Across the yielding transition, anomalous structural change and densification, associated with a suppression of tetrahedral order, is observed to accompany strain localisation.
The mechanical response of amorphous solids such as metallic glasses, window glass, foams, emulsions, colloidal suspension etc., to external deformation or applied stress is of central importance to characterise their behaviour and determining their utility Bonn et al. (2017); Nicolas et al. (2018); Parmar and Sastry . The response for large enough deformations involves plastic rearrangements, leading eventually to yielding. The yielding transition in amorphous solids has been investigated actively in recent years through experiments Sun et al. (2010); Keim and Nagel (2011); Antonaglia et al. (2014); Keim et al. (2020); Bennin et al. (2020), numerical simulations Maloney and Lemaître (2006); Karmakar et al. (2010); Jaiswal et al. (2016); Fiocco et al. (2013); Priezjev (2013); Regev et al. (2015); Leishangthem et al. (2017); Jin et al. (2018); Ozawa et al. (2018); Parmar et al. (2019); Barbot et al. (2020) and theoretical investigations including analysis of elasto-plastic and other models Dasgupta et al. (2012); Lin et al. (2014); Parisi et al. (2017); Urbani and Zamponi (2017); Budrikis et al. (2017); Popović et al. (2018); Barlow et al. (2020); Liu et al. (2020); Sastry (2021); Khirallah et al. (2021); Mungan and Sastry (2021). Yielding has been observed to be a discontinuous transition for sufficiently well annealed glasses under uniform shear Ozawa et al. (2018) and for cyclic shear Leishangthem et al. (2017); Parmar et al. (2019); Bhaumik et al. (2021a), accompanied by a discontinuous drop in energy and stress, and by localisation of strain in shear bands Shi and Falk (2005); Martens et al. (2012); Radhakrishnan and Fielding (2016); Parmar et al. (2019).
Plasticity in amorphous solids is distinguished from that in crystalline solids Sethna et al. (2017) by the absence of well defined structural defects with which it can be associated. Thus, the structural aspects of plastic rearrangements Richard et al. (2020); Bonfanti et al. (2019); Parmar et al. (2019); Denisov et al. (2015); Vasisht et al. (2020); Mitra et al. (2021) have been a subject of investigation, to understand the structural motifs associated with plastic rearrangements below yielding, and to investigate the structural features that distinguish the regions in which plasticity is concentrated.
Another aspect of the approach to yielding and steady state flow that has received considerable attention is the distribution of avalanches corresponding to plastic rearrangements Dahmen et al. (2009); Lin et al. (2014); Regev et al. (2015); Leishangthem et al. (2017); Oyama et al. (2020), of interest also in a wide variety of phenomena exhibiting crackling noise Sethna et al. (2001). The avalanche distribution is expected to have a power-law form, with a characteristic cutoff that is finite below yielding, with a mean field prediction of for the power law exponent. The scaling form has been rationalised by several elasto-plastic models and mean-field theories constructed to pin down the scaling properties of avalanches Lin et al. (2014); Jagla (2015); Liu et al. (2016); Bouchbinder et al. (2007); Dahmen et al. (2011); Franz and Spigler (2017). In numerical simulations, the avalanche distribution is found to be different across the yielding transition for cyclic shear Leishangthem et al. (2017), and to depend on factors such as the inertia of the system Salerno et al. (2012), shear rate Liu et al. (2016), and the quantification of avalanche size (in terms of energy drops, or the size of the connected clusters of active particles) Leishangthem et al. (2017). The dependence of the characteristic size of the avalanches on system size have been analysed Karmakar et al. (2010); Leishangthem et al. (2017); Ozawa et al. (2018), with an observed scaling with the number of particles . The implication of long range interactions on the break up of avalanches into clusters, and their statistics have been investigated for crack propagation Laurson et al. (2010); Le Priol et al. (2021), but not, to our knowledge, in the context of yielding of glasses. Performing such analysis, in addition to confirming key results in Le Priol et al. (2021), we propose and verify a new relation between exponents characterising avalanches and clusters.
Computational investigations of yielding in amorphous solids described above have largely been performed for solids with particles interacting with spherically symmetric, short ranged interactions. In particular, relatively few studies Léonforte et al. (2006); Mantisi, B. et al. (2012); Renou et al. (2017); Rountree et al. (2009); Bonfanti et al. (2018, 2019) have addressed the archetypal glass, silica, which is characterised by an open, tetrahedral, local geometry, and whose interaction potential includes long range Coulomb interactions (or silicon Demkowicz and Argon (2005a, b); Argon and Demkowicz (2006); Fusco et al. (2010), which shares several geometric and thermodynamic characteristics). In the liquid state, the tetrahedral network structure of silica entails a rich spectrum of novel behavior, including density maxima Angell and Kanno (1976); Stanley (2013), a liquid-liquid phase transition Saika-Voivod et al. (2000); Chen et al. (2017) and a strong-to-fragile transition Horbach and Kob (1999); Hess et al. (1996); Saksaengwijit et al. (2004); Saika-Voivod et al. (2004). It is of interest to investigate the role of such directional, tetrahedral local geometry, and of long range interactions in the yielding behavior of silica and, in particular, the nature of avalanches and the structural changes involved in plasticity and strain localisation. The yielding behavior of silica under cyclic shear has been shown to be broadly similar to that for the Kob-Andersen binary Lennard-Jones mixture (KA-BMLJ) Bhaumik et al. (2021a), characterised by a qualitative change across a threshold temperature of (see Fig. S1 in Supplemental Material (SM) for illustration). In contrast, we show in this letter that the nature of avalanches and structural change associated with yielding display unusual features in the case of silica.
We study a version of the BKS model introduced by Saika-Voivod van Beest et al. (1990); Saika-Voivod et al. (2004) (see SM for details). We prepared several equilibrated samples by performing constant temperature (NVT) molecular dynamics simulations with an integration time step of 1fs for a wide range of temperatures that straddles the threshold temperature Bhaumik et al. (2021a) for a fixed density . Avalanche properties display significant size dependence and, for this reason, we also simulate sizes ranging from to . All the samples are equilibrated for at least , being the structural relaxation time obtained from the self intermediate scattering function . Inherent structures (energy minimum configurations) obtained from instantaneous quenches of equilibrated liquid configurations are then subjected to an athermal quasi-static shearing (AQS) protocol involving two steps: (i) affine deformation by a small strain increments of in the -plane (, , ) and (ii) energy minimization. The procedure is then repeated and the strain is varied cyclically as : . Repeating the deformation cycle for a fixed strain amplitude , the glasses are driven to the steady state wherein properties of the system remain stable with further cycles of strain. We consider samples for , 4 samples for and , and one sample for and to perform the cyclic shear. We employ the conjugate-gradient algorithm for energy minimization and execute all the numerical simulations in LAMMPS Plimpton (1995).
We investigate avalanches by computing the statistics of avalanche size (), cluster size (), and the number of clusters (). The size of the avalanches is computed as the total number of active particles during a plastic rearrangement, identified by computing the deviatoric strain for each particle. Active particles are identified as those for which , following the procedure introduced in Salerno and Robbins (2013) (see SM). We further obtain the sizes of clusters of connected active particles. Distributions of avalanche size and cluster size for several are shown in Fig. 1(a) and follow power laws with exponents close to for avalanches and for clusters, with dependent cut-offs in each case. Strikingly, the cluster size exponent () is significantly greater than the mean field value, Sethna et al. (2017), whereas is significantly smaller. The distributions of energy drops, however, follow a power-law with exponent (see SM) as also observed for the KA-BMLJ Leishangthem et al. (2017) for which .
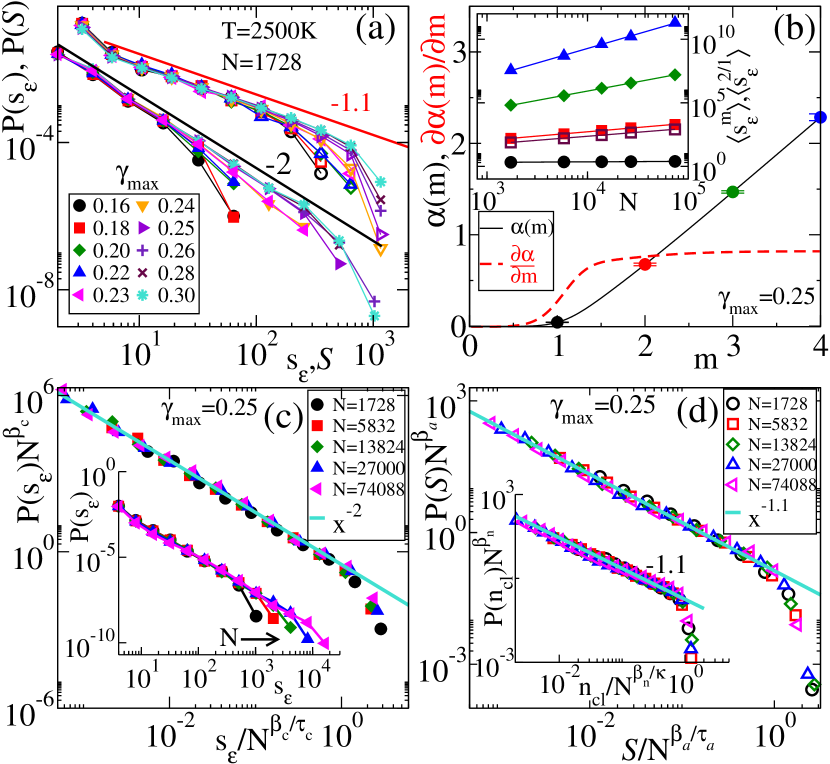
In order to confirm these exponents, we perform a finite scaling analysis of the distributions of , and , for (consistent results for other are shown in the SM). We assume a scaling form for cluster size
| (1) |
where the scaling function for , and for . This scaling form implies that the moments , where is the moment exponent De Menech et al. (1998); Chessa et al. (1999) (see SM for details). In the inset of Fig. 1(b), we show a log-log plot of against for , and , from which we obtain . In Fig. 1(b), we present and the corresponding derivative (which must equal for large ) as a function . By a linear fit of in the large range, we determine and . Fig. 1(c) shows the scaled distributions plotted against the scaled variable , using these values, for different system size to obtain the data collapse which supports the validity of the assumed scaling function. However, the collapsed data is best described by (close to, but slightly smaller than, obtained from , above) which we treat as our estimate below (see SM, Fig. S7, that further supports the value ). Assuming similar scaling forms for and , we estimate , for avalanche size, and , for number of clusters. In Fig. 1(d) we present the collapsed data for and that confirm these exponents.
We next discuss the relationship between these exponents. Considering , the number of clusters of size in an avalanche of size , we have, by defintion, and . We assume (as supported by numerical data) that up to the cutoff , but importantly, . We straight-forwardly obtain (see SM for details) with , and the mean cluster size (see also Le Priol et al. (2021)). As shown in the SM, numerically, we obtain and , leading to . Further, assuming a scaling function for the distribution of the number of clusters, we obtain
| (2) |
or, . Considering the normalised distribution and writing
| (3) |
we obtain a new relation between the avalanche and cluster size exponents,
| (4) |
The exponent values we obtain,
| (5) |
clearly satisfy the exponent relationships we describe. Such consistency is also obtained for a two dimensional glass (detailed in an accompanying paper Bhaumik et al. (2021b)). Despite such consistent analysis within the framework of Le Priol et al. (2021), the large value of is surprising. Similar values have been discussed for silica nanofibres Bonfanti et al. (2018), amorphous silicon Demkowicz and Argon (2005b) and in preliminary results for a short ranged silica-like model Coslovich and Pastore (2009). Although the details in these systems differ, we speculate that the open framework structure common to these systems may provide an explanation.
We also carry out the cluster analysis for BKS Silica by identifying active particles using non-affine displacements as reported in Leishangthem et al. (2017) for KA-BMLJ, and employ the deviatoric local strain for analysing the KA-BMLJ system. While the former analysis for silica yields , we obtain for KA-BMLJ, in agreement with Leishangthem et al. (2017) (See SM). A summary of avalanche exponents found in different models is included in the SM. Finally, we note that yields the fractal dimension . The estimated for silica ( for KA-BMLJ, for which we find ), is close to the value obtained directly using the box counting method, ( for KA-BMLJ) (see SM for details).
We next study the modification of structure under shear by considering the tetrahedrality parameter Shell et al. (2002),
| (6) |
that measures the tendency of neighboring silicon atoms to form a tetrahedral structure around a central atom and is equal to unity for a perfectly tetrahedral local environment (see SM for details). We compute the distributions for different across the yielding transition for two representative temperatures above and below the threshold temperature . The results are shown in Figs. 2(a) and 2(b) for and , respectively. For , the structure does not display any evolution below yielding and the distributions are indistinguishable for . The peak at indicates a high silicon-silicon tetrahedral order that does not vary with Shell et al. (2002), and the structure is indistinguishable from that of the initial undeformed samples. Beyond yielding, the distributions evolve and become broader with increasing amplitude . The high peak value becomes less pronounced and shoulder around appears. Interestingly, the variation of with increasing has a strong resemblance to what is observed in equilibrium when temperature is increased Shell et al. (2002). For , Fig. 2(b), the behaviour is very different. Below yielding, a strong enhancement of the tetrahedral order upon increasing is observed, with the initial undeformed glass displaying very weak tetrahedral order. This effect is reflected in the growth of the high peak which continues until the yielding amplitude is reached. Beyond yield, similarly to what is observed for the low temperature case, the peak value decreases with .
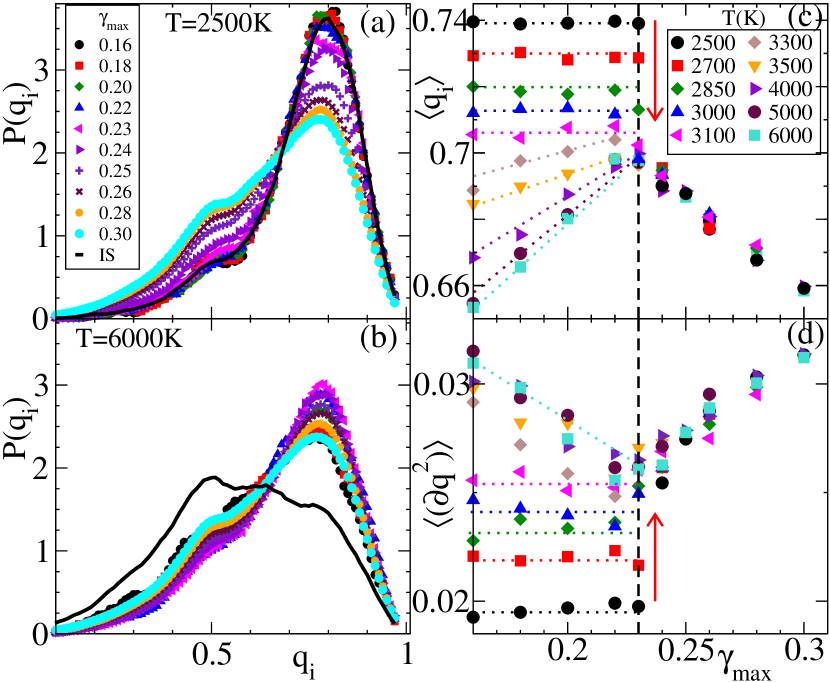
To further characterize the structural disorder induced by deformation, we study the mean and variance of as a function of strain amplitude for different as shown in Figs. 2(c) and 2(d) respectively. As expected, two very different trends are observed below and above yielding. Below yielding, we observe again two patterns. For , progressively increases with up to the the yield amplitude. Interestingly, the maximum orientational order is obtained at the yielding amplitude where, for all the cases with , it converges to which is the value of for the undeformed samples at (see Fig. S16 of SM). For , does not vary with until the yield point where it abruptly drops to the same values as for the high temperature case. Above yielding, all the curves collapse, indicating that the final structure depends only on the strain amplitude and not on the initial temperature. In this regime, decreases with , indicating a progressively less tetrahedral structure. As shown in Fig. 2(c), the fluctuation of also behaves in a similar way but in an opposite fashion. Interestingly, at the yielding point the fluctuations are at their minimum. These trends strikingly reflect the changes in the energy of the system Bhaumik et al. (2021a). The decrease of tetrahedral order in deformed silica can be explicitly linked to an increase in the population of -coordinated silicon atoms, as shown in Sec. S-7 of the SM.
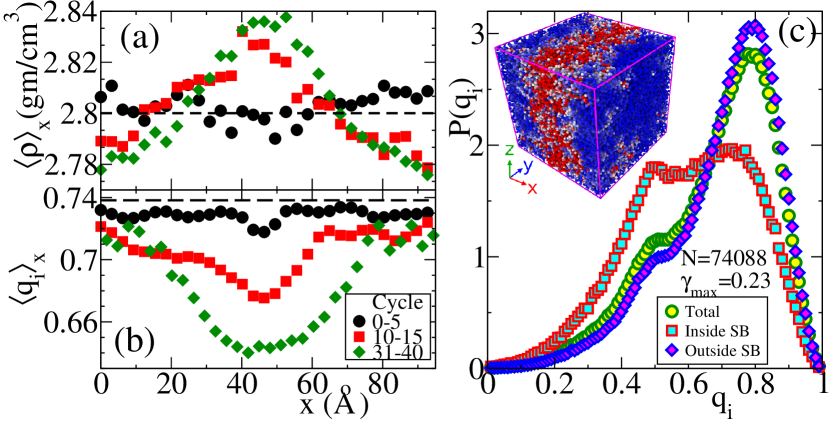
We next investigate structural features associated with strain localization Parmar et al. (2019) above the yield strain amplitude. In Fig. 3(c) (inset), we show a snapshot of a zero strain configuration for the largest system size simulated () at a strain amplitude . The color map corresponds to the deviatoric strain , computed between two consecutive stroboscopic configurations, up to a cut-off value (See SM for the discussion about this choice), highlighting the localisation of strain in a shear band. In Ref. Parmar et al., 2019; Mitra et al., 2021 the density within the shear band was shown to be less than the average density. We compute and plot the slab-wise density along -direction in Fig. 3(b). Contrary to the observation in Parmar et al. (2019); Mitra et al. (2021), we find that becomes progressively larger inside the shear band, with the number of cycles of shear. This reversal of trend is clearly a reflection of the fact that the energetically favorable tetrahedral structure of silica has lower density than more disordered structures, which leads to well-known density and other anomalies in silica Shell et al. (2002). In order to verify this expectation, we compute slab-wise averages of , which are shown in Fig. 3(c). These results clearly demonstrate that the higher density structure within the shear band also has reduced orientational order, analogous to observations in Shi and Falk (2006); Vasisht et al. (2020). The suppressed tetrahedral order within the shear band is associated with the enhancement of the fraction of -coordinated defects (See Fig. S19 of SM). We compute the distributions of within and outside the shear band, and compare with the aggregate distribution in Fig. 3(d). These distributions reveal the structure within the shear band to be comparable to high temperature undeformed glasses, whereas outside, the are comparable to low temperature glasses.
In summary, we have investigated the statistics of avalanches and clusters in silica and obtained a satisfactory analysis of the relationship between exponents within a framework Le Priol et al. (2021) that envisages the fragmentation of avalanches in the presence of long range interactions. We have further proposed and verified a new relation between avalanche and cluster exponents. How the microscopic structure may lead to the fragmentation of avalanches is an interesting question to investigate further. We have also investigated structural change across the yielding transition and differences in structure within and outside shear bands and have found that yielding and the formation of shear bands is accompanied by a reduction of tetrahedral order, which corresponds to an anomalous increase (rather than decrease) of density. Although the qualitative features of yielding in silica are analogous to other glass formers, the special features of local geometry in silica apparently lead to unusual avalanche statistics and structural change during yielding.
Acknowledgements.
We thank J. Horbach, S. Zapperi and A. Rosso for useful discussions and comments on the manuscript. We acknowledge Indo-French Center for the Promotion of Advanced Research (IFCPAR/CEFIPRA) Project 5704-1 for support, the Thematic Unit of Excellence on Computational Materials Science, and the National Supercomputing Mission facility (Param Yukti) at the Jawaharlal Nehru Center for Advanced Scientific Research for computational resources. S.S. acknowledges support through the J. C. Bose Fellowship (JBR/2020/000015) SERB, DST (India).
References
- Bonn et al. (2017) D. Bonn, M. M. Denn, L. Berthier, T. Divoux, and S. Manneville, Reviews of Modern Physics 89, 035005 (2017).
- Nicolas et al. (2018) A. Nicolas, E. E. Ferrero, K. Martens, and J.-L. Barrat, Reviews of Modern Physics 90, 045006 (2018).
- (3) A. D. S. Parmar and S. Sastry, “Mechanical behaviour of glasses and amorphous materials,” in Advances in the Chemistry and Physics of Materials, Chap. Chapter 21, pp. 503–527.
- Sun et al. (2010) B. A. Sun, H. B. Yu, W. Jiao, H. Y. Bai, D. Q. Zhao, and W. H. Wang, Phys. Rev. Lett. 105, 035501 (2010).
- Keim and Nagel (2011) N. C. Keim and S. R. Nagel, Phys. Rev. Lett. 107, 010603 (2011).
- Antonaglia et al. (2014) J. Antonaglia, W. J. Wright, X. Gu, R. R. Byer, T. C. Hufnagel, M. LeBlanc, J. T. Uhl, and K. A. Dahmen, Phys. Rev. Lett. 112, 155501 (2014).
- Keim et al. (2020) N. C. Keim, J. Hass, B. Kroger, and D. Wieker, Phys. Rev. Research 2, 012004 (2020).
- Bennin et al. (2020) T. Bennin, E. Xing, J. Ricci, and M. D. Ediger, Macromolecules 53, 8467 (2020).
- Maloney and Lemaître (2006) C. E. Maloney and A. Lemaître, Phys. Rev. E 74, 016118 (2006).
- Karmakar et al. (2010) S. Karmakar, E. Lerner, and I. Procaccia, Phys. Rev. E 82, 055103 (2010).
- Jaiswal et al. (2016) P. K. Jaiswal, I. Procaccia, C. Rainone, and M. Singh, Phys. Rev. Lett. 116, 085501 (2016).
- Fiocco et al. (2013) D. Fiocco, G. Foffi, and S. Sastry, Phys. Rev. E 88, 020301 (2013).
- Priezjev (2013) N. V. Priezjev, Phys. Rev. E 87, 052302 (2013).
- Regev et al. (2015) I. Regev, J. Weber, C. Reichhardt, K. A. Dahmen, and T. Lookman, Nature Communications 6, 8805 (2015).
- Leishangthem et al. (2017) P. Leishangthem, A. D. S. Parmar, and S. Sastry, Nature Communications 8, 14653 (2017), article.
- Jin et al. (2018) Y. Jin, P. Urbani, F. Zamponi, and H. Yoshino, Science Advances 4 (2018).
- Ozawa et al. (2018) M. Ozawa, L. Berthier, G. Biroli, A. Rosso, and G. Tarjus, Proceedings of the National Academy of Sciences 115, 6656 (2018).
- Parmar et al. (2019) A. D. S. Parmar, S. Kumar, and S. Sastry, Phys. Rev. X 9, 021018 (2019).
- Barbot et al. (2020) A. Barbot, M. Lerbinger, A. Lemaître, D. Vandembroucq, and S. Patinet, Phys. Rev. E 101, 033001 (2020).
- Dasgupta et al. (2012) R. Dasgupta, H. G. E. Hentschel, and I. Procaccia, Physical Review Letters 109, 255502 (2012).
- Lin et al. (2014) J. Lin, E. Lerner, A. Rosso, and M. Wyart, Proceedings of the National Academy of Sciences 111, 14382 (2014), https://www.pnas.org/content/111/40/14382.full.pdf .
- Parisi et al. (2017) G. Parisi, I. Procaccia, C. Rainone, and M. Singh, Proceedings of the National Academy of Sciences 114, 5577 (2017), https://www.pnas.org/content/114/22/5577.full.pdf .
- Urbani and Zamponi (2017) P. Urbani and F. Zamponi, Physical Review Letters 118, 38001 (2017).
- Budrikis et al. (2017) Z. Budrikis, D. F. Castellanos, S. Sandfeld, M. Zaiser, and S. Zapperi, Nature Communications 8, 15928 (2017).
- Popović et al. (2018) M. Popović, T. W. de Geus, and M. Wyart, Physical Review E 98, 040901 (2018).
- Barlow et al. (2020) H. J. Barlow, J. O. Cochran, and S. M. Fielding, Phys. Rev. Lett. 125, 168003 (2020).
- Liu et al. (2020) C. Liu, E. E. Ferrero, E. A. Jagla, K. Martens, A. Rosso, and L. Talon, (2020), arXiv:2012.15310 [cond-mat.soft] .
- Sastry (2021) S. Sastry, Phys. Rev. Lett. 126, 255501 (2021).
- Khirallah et al. (2021) K. Khirallah, B. Tyukodi, D. Vandembroucq, and C. E. Maloney, Phys. Rev. Lett. 126, 218005 (2021).
- Mungan and Sastry (2021) M. Mungan and S. Sastry, (2021), arXiv:2106.13069 [cond-mat.soft] .
- Bhaumik et al. (2021a) H. Bhaumik, G. Foffi, and S. Sastry, Proceedings of the National Academy of Sciences 118 (2021a), 10.1073/pnas.2100227118.
- Shi and Falk (2005) Y. Shi and M. L. Falk, Physical Review Letters 95, 95502 (2005).
- Martens et al. (2012) K. Martens, L. Bocquet, and J.-L. Barrat, Soft Matter 8, 4197 (2012).
- Radhakrishnan and Fielding (2016) R. Radhakrishnan and S. M. Fielding, Phys. Rev. Lett. 117, 188001 (2016).
- Sethna et al. (2017) J. P. Sethna, M. K. Bierbaum, K. A. Dahmen, C. P. Goodrich, J. R. Greer, L. X. Hayden, J. P. Kent-Dobias, E. D. Lee, D. B. Liarte, X. Ni, et al., Annual Review of Materials Research 47, 217 (2017).
- Richard et al. (2020) D. Richard, M. Ozawa, S. Patinet, E. Stanifer, B. Shang, S. A. Ridout, B. Xu, G. Zhang, P. K. Morse, J.-L. Barrat, L. Berthier, M. L. Falk, P. Guan, A. J. Liu, K. Martens, S. Sastry, D. Vandembroucq, E. Lerner, and M. L. Manning, Phys. Rev. Materials 4, 113609 (2020).
- Bonfanti et al. (2019) S. Bonfanti, R. Guerra, C. Mondal, I. Procaccia, and S. Zapperi, Phys. Rev. E 100, 060602 (2019).
- Denisov et al. (2015) D. V. Denisov, M. T. Dang, B. Struth, A. Zaccone, G. H. Wegdam, and P. Schall, Scientific Reports 5 (2015), 10.1038/srep14359.
- Vasisht et al. (2020) V. V. Vasisht, G. Roberts, and E. Del Gado, Phys. Rev. E 102, 010604 (2020).
- Mitra et al. (2021) S. Mitra, A. D. S. Parmar, P. Leishangthem, S. Sastry, and G. Foffi, Journal of Statistical Mechanics: Theory and Experiment 2021, 033203 (2021).
- Dahmen et al. (2009) K. A. Dahmen, Y. Ben-Zion, and J. T. Uhl, Phys. Rev. Lett. 102, 175501 (2009).
- Oyama et al. (2020) N. Oyama, H. Mizuno, and A. Ikeda, (2020), arXiv:2009.02635 [cond-mat.soft] .
- Sethna et al. (2001) J. P. Sethna, K. A. Dahmen, and C. R. Myers, Nature 410, 242 (2001).
- Jagla (2015) E. A. Jagla, Phys. Rev. E 92, 042135 (2015).
- Liu et al. (2016) C. Liu, E. E. Ferrero, F. Puosi, J.-L. Barrat, and K. Martens, Physical review letters 116, 065501 (2016).
- Bouchbinder et al. (2007) E. Bouchbinder, J. S. Langer, and I. Procaccia, Phys. Rev. E 75, 036108 (2007).
- Dahmen et al. (2011) K. A. Dahmen, Y. Ben-Zion, and J. T. Uhl, Nature Physics 7, 554 (2011).
- Franz and Spigler (2017) S. Franz and S. Spigler, Phys. Rev. E 95, 022139 (2017).
- Salerno et al. (2012) K. M. Salerno, C. E. Maloney, and M. O. Robbins, Phys. Rev. Lett. 109, 105703 (2012).
- Laurson et al. (2010) L. Laurson, S. Santucci, and S. Zapperi, Phys. Rev. E 81, 046116 (2010).
- Le Priol et al. (2021) C. Le Priol, P. Le Doussal, and A. Rosso, Phys. Rev. Lett. 126, 025702 (2021).
- Léonforte et al. (2006) F. Léonforte, A. Tanguy, J. P. Wittmer, and J.-L. Barrat, Phys. Rev. Lett. 97, 055501 (2006).
- Mantisi, B. et al. (2012) Mantisi, B., Tanguy, A., Kermouche, G., and Barthel, E., Eur. Phys. J. B 85, 304 (2012).
- Renou et al. (2017) R. Renou, L. Soulard, E. Lescoute, C. Dereure, D. Loison, and J.-P. Guin, The Journal of Physical Chemistry C 121, 13324 (2017).
- Rountree et al. (2009) C. L. Rountree, D. Vandembroucq, M. Talamali, E. Bouchaud, and S. Roux, Phys. Rev. Lett. 102, 195501 (2009).
- Bonfanti et al. (2018) S. Bonfanti, E. E. Ferrero, A. L. Sellerio, R. Guerra, and S. Zapperi, Nano Letters 18, 4100 (2018).
- Demkowicz and Argon (2005a) M. J. Demkowicz and A. S. Argon, Phys. Rev. B 72, 245205 (2005a).
- Demkowicz and Argon (2005b) M. J. Demkowicz and A. S. Argon, Phys. Rev. B 72, 245206 (2005b).
- Argon and Demkowicz (2006) A. S. Argon and M. J. Demkowicz, Philosophical Magazine 86, 4153 (2006).
- Fusco et al. (2010) C. Fusco, T. Albaret, and A. Tanguy, Phys. Rev. E 82, 066116 (2010).
- Angell and Kanno (1976) C. Angell and H. Kanno, Science 193, 1121 (1976).
- Stanley (2013) H. E. Stanley, Liquid Polymorphism (John Wiley & Sons, USA, 2013).
- Saika-Voivod et al. (2000) I. Saika-Voivod, F. Sciortino, and P. H. Poole, Phys. Rev. E 63, 011202 (2000).
- Chen et al. (2017) R. Chen, E. Lascaris, and J. C. Palmer, The Journal of Chemical Physics 146, 234503 (2017).
- Horbach and Kob (1999) J. Horbach and W. Kob, Phys. Rev. B 60, 3169 (1999).
- Hess et al. (1996) K.-U. Hess, D. Dingwell, and E. Rössler, Chemical Geology 128, 155 (1996).
- Saksaengwijit et al. (2004) A. Saksaengwijit, J. Reinisch, and A. Heuer, Physical review letters 93, 235701 (2004).
- Saika-Voivod et al. (2004) I. Saika-Voivod, F. Sciortino, and P. H. Poole, Phys. Rev. E 69, 041503 (2004).
- van Beest et al. (1990) B. W. H. van Beest, G. J. Kramer, and R. A. van Santen, Phys. Rev. Lett. 64, 1955 (1990).
- Plimpton (1995) S. Plimpton, Journal of Computational Physics 117, 1 (1995).
- Salerno and Robbins (2013) K. M. Salerno and M. O. Robbins, Phys. Rev. E 88, 062206 (2013).
- De Menech et al. (1998) M. De Menech, A. L. Stella, and C. Tebaldi, Phys. Rev. E 58, R2677 (1998).
- Chessa et al. (1999) A. Chessa, H. E. Stanley, A. Vespignani, and S. Zapperi, Physical Review E 59, R12 (1999).
- Bhaumik et al. (2021b) H. Bhaumik, G. Foffi, and S. Sastry, (preprint) (2021b).
- Coslovich and Pastore (2009) D. Coslovich and G. Pastore, Journal of Physics: Condensed Matter 21, 285107 (2009).
- Shell et al. (2002) M. S. Shell, P. G. Debenedetti, and A. Z. Panagiotopoulos, Phys. Rev. E 66, 011202 (2002).
- Shi and Falk (2006) Y. Shi and M. L. Falk, Phys. Rev. B 73, 214201 (2006).