῝λυςτερ δενςιτψ ςλοπες φρομ Δαρϰ Ματτερ-Βαρψονς Ενεργψ Τρανςφερ
Abstract
In this paper, we extend previous works on the relation between mass and the inner slope in dark matter density profiles. We calculate that relation in the mass range going from dwarf galaxies to cluster of galaxies. This was done thanks to a modeling of energy transfer via SN and AGN feedback, as well as via dynamical friction of baryon clumps. We show that, in the mass range above galaxy masses (Groups and clusters), the inner slope-mass relation changes its trend. It flattens (towards less cuspy profile) around masses corresponding to groups of galaxies and steepens again for large galaxy cluster masses. The flattening is produced by the AGN outflows (AGN feedback). The one- scatter on is approximately constant in all the mass range (). This is the first paper extending the inner density profile slope-mass relationship to clusters of galaxies, accounting for the role of baryons. The result can be used to obtain a complete density profile, also taking baryons into account. Such kind of density profile was previously only available for galaxies.
I Introduction
The content of the Universe is clearly not reduced to ordinary baryonic matter, as seen in the gravitational effects at the cosmological level (Planck Collaboration et al., 2016), mixed with astrophysical scale effects (Bertone et al., 2005; Del Popolo, 2014a), where observations strongly point towards non-baryonic mass/energy domination of mass content by a clustering component coined dark matter (DM). Cosmological observations of the Universe’s accelerated expansion (Riess et al., 1998; Perlmutter et al., 1999) further indicate overall domination by the component responsible for this acceleration called dark energy (DE).
The baryonic, DM and DE densities are measured to make up, respectively, , and of our Universe.
Our most successful model for such universe, based on the big-bang cosmology, uses the cosmological constant as DE and describes the rest with five further parameters. Designated as the CDM (Cold DM with ) model, this paradigm, although it was very successful to explain many phenomena, as found in numerous studies including (Del Popolo, 2007; Komatsu et al., 2011; Hinshaw et al., 2013; Del Popolo, 2013; Planck Collaboration et al., 2014; Del Popolo, 2014a), remains plagued with unexpected discrepancies compared with specific observations, as well as theoretical challenges: the deep theoretical challenges include what is known as the cosmological constant problems (Weinberg, 1989; Astashenok and del
Popolo, 2012), related also to the unknown natures of DE (Del Popolo et al., 2013a, b, c) and DM. From an observational perspective, anomalies accumulate at the large scales, in tensions of the Cosmic Microwave Background (CMB) Planck 2015 data with the Hubble parameter measured in type Ia SuperNovae (SNIa, or simply SN) Bolejko (2018), with the CFHTLenS weak lensing (Raveri, 2016), or with its values (Macaulay et al., 2013). At small scales, they are embodied within the so-called ”small scale problems” (galactic, and centre of galaxy clusters scales, discussed, e.g., in Del Popolo and Gambera, 2000; Del Popolo, 2002; Del Popolo and Cardone, 2012; Newman et al., 2013a, b; Del Popolo, 2014a; Del Popolo et al., 2017; Del Popolo et al., 2018). They comprise
a) the anomalous gap between observations and N-body simulations predictions on the number of galactic subhaloes (e.g. Moore et al., 1999);
b) the so-called Too-Big-To-Fail (TBTF) problem: simulated haloes produce too many, too massive and dense subhaloes, that cannot be disrupted to explain their absence in observations (Boylan-Kolchin, Bullock, and Kaplinghat, 2011, 2012).
Those two problems found a proposal for a unified solution, based on the effect of baryons within the haloes’ inner
parts (Zolotov et al., 2012; Del Popolo et al., 2014).
c) the Cusp/Core problem remains the most persistent of the CDM paradigm problems (Moore, 1994; Flores and Primack, 1994) and points at the inconsistency between LSBs and dwarf galaxies observed flat density
profiles and the cuspy profiles produced in N-body simulations, e.g.
the Navarro-Frenk-White (NFW) profile (Navarro et al., 1996a, 1997, 2010).
This paper will focus on the so-called Cusp/Core problem. The density profiles from simulations already are subjects of discussions, focussing on the slopes for the inner region of haloes: the NFW profile predicts an inner profile characterised by density , with , Moore et al. (1998) and Fukushige and Makino (2001) produced even steeper profiles, with , while other works encounter object and/or even mass dependent inner slopes (Jing and Suto, 2000; Ricotti, 2003; Ricotti and Wilkinson, 2004; Ricotti et al., 2007; Del Popolo, 2010; Cardone et al., 2011; Del Popolo, 2011; Del Popolo et al., 2013d; Di Cintio et al., 2014a). The Einasto profile, flattening towards the centre to (Stadel et al., 2009) seems to provide a better fit to simulations (Gao et al., 2008). The claim of universal density profiles have been contradicted in Polisensky and Ricotti (2015), where their initial linear density perturbation power spectra determine their shape, which also depend on their mass. This mass dependence agrees with previous works and with possible cores development in the warm DM (WDM) paradigm, however not significantly enough to explain observations.
In this debated context for the inner slope of haloes, the Cusp/Core problem resides in that dissipationless N-body simulations smallest predicted inner slopes exceed those obtained from SPH simulations (Governato et al., 2010, 2012), semi-analytical models (Del Popolo, 2009; Cardone and Del Popolo, 2012; Del Popolo, 2012a, b; Del Popolo and Hiotelis, 2014), or observations (Burkert, 1995; de Blok et al., 2003; Swaters et al., 2003; Kuzio de Naray and Kaufmann, 2011; Oh et al., 2011a, b).
Although the Cusp/Core discussion started from galaxy scale haloes, it also has impact at galaxy clusters scales. Even though clusters total mass profiles agree with NFW predictions (Sand et al., 2002, 2004; Newman et al., 2013a, b; Del Popolo et al., 2019), lensing and kinematics constraints applied in relaxed clusters’ central cD galaxies (Brightest Central Galaxies, BCG) found flatter DM profiles than the NFW.
The simple dynamical structure (bulgeless disks) of dwarf galaxies and their DM domination with low baryon fraction (de Blok and McGaugh, 1997) made them widely used in the Cusp/Core debate, as the determination of the inner density structure of larger, high surface brightness (HSB) objects is more complicated and the universality of galaxies’ cored nature is not definitely established: some authors claim HSBs are cored Spano et al. (2008) when others differ (e.g., Simon et al., 2005; de Blok et al., 2008; Del Popolo and Cardone, 2012; Del Popolo et al., 2013d; Martinsson et al., 2013). While low luminosity galaxies, , in the THINGS sample, tend to follow isothermal (ISO) profiles, cuspy or cored profiles describe equally well its galaxies with . The inner profile of dwarfs galaxies also varies Simon et al. (2005): among NGC 2976, 4605, 5949, 5693, and 6689, it ranges from 0 (NGC2976) to -1.28 (NGC5963). The confusion increases when noting that similar techniques on the same object yield different results: for, e.g., NGC2976, Simon et al. (2003) obtained for the DM slope, while Adams et al. (2012) got , Adams et al. (2014) traced with stars, or was derived using gas by (Adams et al., 2014).
This discussion reveals the difficulties associated with galaxies inner slope determination, including for dwarfs. It shows the existence of a range of slopes and the lack of agreement on their distribution despite recent kinematic maps (Simon et al., 2005; Oh et al., 2011b; Adams et al., 2014).
The confusion increases further for smaller masses (e.g. dwarf spheroidals (dSphs)) and larger masses (e.g., spiral galaxies), where stars dominate111See Section V for a wider discussion., when biases enter models (Battaglia, Helmi, and Breddels, 2013) and yields opposite outcomes.
Evaluation of central slopes of dSphs can employ different methods: as mass and stellar orbits anisotropy are degenerate in the spherical Jean’s equation model, its results strongly depend on the model’s assumptions (Evans et al., 2009); a similar drawback also plaguing the maximum likelihood method applied to Jean’s model parameter space (Wolf and Bullock, 2012; Hayashi and Chiba, 2012; Richardson and Fairbairn, 2013). Schwarzschild modelling found cored profiles for the Fornax and Sculptor profiles (Jardel and Gebhardt, 2012; Breddels et al., 2013; Jardel and Gebhardt, 2013; Jardel et al., 2013), in agreement with multiple stellar populations methods that can measure central slopes at 1 kpc (Fornax) and even 500 pc (Sculptor) (Battaglia et al., 2008; Walker and Peñarrubia, 2011; Agnello and Evans, 2012; Amorisco and Evans, 2012). However the Schwarzschild model applied to Draco found a cusp (Jardel et al., 2013). In general, there is not consensus on the inner structure of dSphs. A recent paper Hayashi et al. (2020) found different, and cuspier, halo density profiles than previous estimates. Similarly, Shao et al. (2020) showed that for Fornax, considered for a long time to harbour a 1 kpc core, a cuspy dark matter halo is probably not excluded.
Although dSphs can thus either be cored or cusped, their DM dominated dynamics should yield cuspy central profiles, at least for smaller masses.
Given observations, two kinds of approaches could solve the Cusp/Core problem:
-
1)
cosmological solutions, comprising
-
(a)
modified small scale initial spectrum (e.g. Zentner and Bullock, 2003),
- (b)
- (c)
-
(a)
-
2)
Astrophysical solutions, that reduce galaxies’ inner density from DM component expansion induced by some ”heating” mechanism, such as
- (a)
- (b)
We will concentrate here in the astrophysical solutions 2), and in particular in the DFBC 2)b, discussed further in the following sections.
The SNF model has been studied in a large number of papers, and has been shown to be most effective for galaxies smaller that the Milky Way (Navarro et al., 1996b; Governato et al., 2010, 2012; Teyssier et al., 2013; Chan et al., 2015; Tollet et al., 2016).
Although successful in some cases, the SNF model is less so in others. Its effects depend, among other things, on the nature of star formation. For instance, for the SNF, cosmological simulations with lower density thresholds for star formation, e.g. APOSTLE and Auriga (Bose et al., 2019), do not produce DM cores. Furthermore, the THINGS galaxies (de Blok et al., 2008; Walter et al., 2008) density profiles (Oh et al., 2008, 2011a, 2011b) agreed with the Governato et al. (2010) SNF model, while simulations of both disk galaxies and dwarfs from Trujillo-Gomez et al. (2015), including the SNF model along with feedback from massive stars radiation pressure, found radiation pressure to dominate SNF effects in core formation, so SNF alone cannot form cores. In general, the SNF as possible solution to CDM small scale problems has been questioned in many works (Ferrero et al., 2012; Peñarrubia et al., 2012; Garrison-Kimmel et al., 2013, 2014; Papastergis et al., 2015). Core formation is also influenced by the ratio of DM halo growth time to star formation time. Mergers happening after core formation can rejuvenate a cusp (Oñorbe et al., 2015).
Other papers, such as (Katz et al., 2017), claim an agreement between galaxies characteristics and simulations. (Katz et al., 2017) tested the prediction of Di Cintio et al. (2014a) that claims core formation when the ratio between the stellar and halo masses is of the order or smaller than 0.01, while at larger values, SNF leads DM to expand, again tending to give rise to a core. The flattest profile forms when . For larger ratios, the structure’s central stellar component deepens the gravitational potential, opposing the SNF driven expansion, resulting in a cuspier profiles. (Chan et al., 2015), using the FIRE-1 suite, and Tollet et al. (2016), by means of the NIHAO suite, confirmed the Di Cintio et al. (2014a) result.
The work of Tollet et al. (2016) was extended by Macciò et al. (2020) to include black
hole (BH) feedback, determining the mass-slope relation over eight order in magnitudes in stellar mass.
Del Popolo and Pace (2016) compared the ability of the SNF and he DFBC
mechanisms to solve the Cusp/Core problem through their theoretical predictions vs observations of the inner slopes of galaxies confrontation, with masses ranging from dSphs to normal spirals.
It found both mechanisms to give similar results.
The DFBC achievements, summarised hereafter, are also described in Sec. II. It predicted the correct shape
of galaxy
density profiles (Del Popolo, 2009; Del Popolo and Kroupa, 2009) in agreement with Governato et al. (2010, 2012)
SPH simulations. Similarly in the case of clusters, the density
profile in (Del Popolo, 2012a) matches predictions from the profiles simulated
by Martizzi et al. (2012a).
Furthermore, several galaxy clusters predictions from (Del Popolo, 2012a) are in agreement with the observations in Newman et al. (2013a, b).
The work in Del Popolo (2010) had already found the dependence of the inner slope on mass claimed later by Di Cintio et al. (2014a). Such slope-mass dependence had been reported over masses
ranging from dwarf galaxies to clusters (Del Popolo, 2009, 2010, 2012a, 2012b, 2014a).
The DFBC model found a series of additional correlations such as between
a) inner slope and
1) the baryon to halo mass ratio 222Recall encloses 500 times the critical density and a mass .
2) angular momentum333Larger mass structure collapse is reduced since their acquired angular momentum follows
the peak height in inverse proportion (Del Popolo and Gambera, 1996; Del Popolo, 2009).
as seen in (Del Popolo, 2012b), while, in agreement with Newman et al. (2013a, b), the inner slope also correlates with
(c) the Brightest Cluster Galaxy
(BCG) mass,
(d) the core radius ,
(e) the effective radius , and
b) between the DM dominated mass inside 100 kpc, and the mainly baryonic (Del Popolo, 2014b) mass inside 5 kpc.
Ref. Tollet et al. (2016) confirmed the results of Di Cintio et al. (2014a), and extended it to redshift z = 1. The FIRE-2 galaxy formation physics simulated 54 galaxy halos, which CDM density profiles were analyzed in Lazar et al. (2020). Ref. Macciò et al. (2020) added 46 new high resolution simulations of massive galaxies, including BH feedback, to the work of Tollet et al. (2016). This allowed to trace the DM halo inner slope dependence from galaxies to groups of galaxies.
In this context, Del Popolo (2010) showed the halo density profiles inner slope of spiral galaxies depend on their mass. That result was extended in Del Popolo and Pace (2016) to spheroidal galaxies. For dSphs with baryonic mass smaller than , the DM halo density profile was shown to steepen towards smaller masses. The slope shows a maximum flattening at , before steepening again for larger masses. A similar dependence was reported by Di Cintio et al. (2014a), which work was extended by Macciò et al. (2020); Tollet et al. (2016); Lazar et al. (2020). The NIHAO and FIRE results were compared in (Hayashi et al., 2020, Fig. 6) for the slope-mass relation (also see Lazar et al., 2020, Fig. 2). The Lazar et al. (2020) slope-mass relation exclusively concerned galaxies, while only Macciò et al. (2020) extended it to groups of galaxies. In this paper, we aim to extend that study to galaxy clusters, including AGN feedback effects. That purpose will lead us to improve and extend the Del Popolo and Pace (2016) model, using the Del Popolo et al. (2018) model for AGN feedback. Building a dwarf galaxies-cluster size halo mass range, including DM and baryonic effects, will enable for the first time the construction of a mass-dependent DM density profile set. Recall that the Di Cintio et al. (2014a) profiles only concerned galaxies.
This paper aims to extend some of the results of (Del Popolo and Pace, 2016), namely those related to the slope-mass relationship. Ref. (Del Popolo and Pace, 2016), among other results, showed how the slope of the inner DM density profile depends on baryonic and halo mass.
The mass range studied went from dwarf galaxies to galaxies similar to our Galaxy. The present paper extends that range to clusters of galaxy masses. To date, halo density profile taking baryons into account are only available for galaxies with mass similar to the Milky Way’s.
The importance of the present results lies in the possibility it opens to compare the observed slopes of dwarf, and ultra faint galaxies, and thus discriminate which mechanism gives rise to the inner structure of those galaxies. Indeed, the slope of our model shows a maximum flattening at stellar masses . At smaller masses the steepening reaches a value of at . Such steepening at small masses is smaller that in the case of models based on supernovae feedback, such as (Di Cintio et al., 2014a; Tollet et al., 2016). In other words, the model predicts that dwarf galaxies are less cuspy than predicted by (Di Cintio et al., 2014a; Tollet et al., 2016). Consequently, dwarf, or ultra-faint galaxies with a almost cored profile means that the DFBC mechanism is the responsible of the core formation, while a cuspy profile implies that supernovae feedback has the main role in the cusp formation.
II Theoretical Model
This section recalls the model employed in this work. The spherical collapse models (Gunn and Gott, 1972; Bertschinger, 1985; Hoffman and Shaham, 1985; Ryden and Gunn, 1987; Ascasibar et al., 2004; Williams et al., 2004) was very significant improved in (e.g. Del Popolo, 2009; Del Popolo and Kroupa, 2009) to include the effects of
and was furthered to include the consequences of
and was further refined in Del Popolo and Hiotelis (2014); Del Popolo and Pace (2016); Del Popolo (2016); Del Popolo (2016). This model produced results on
as well as a focus on
-
galaxies inner surface-density (Del Popolo, Cardone, and Belvedere, 2013d).
Although the model’s key mechanism resides in dynamical friction (DFBC), we stress out that it includes all of the above effects (including SNF) that each only contribute at the level of some %.
Its implementation occurs in several stages:
-
1.
The diffuse proto-structure of gas and DM expands, in the linear phase, to a maximum radius before DM re-collapses into a potential well, where baryons will fall.
-
2.
In their radiative clumping, baryons form stars at the halo centre.
-
3.
Then four effects happen in parallel
-
(a)
the DM central cusp increases from baryons adiabatic contraction (at in the case of galaxies (Del Popolo, 2009))
-
(b)
the galactic centre also receive clumps that collapse from baryons-DM dynamical friction (DF)
- (c)
-
(d)
the balance between adiabatic contraction and DF can result in heating cusps and forming cores, i.e. in dwarf spheroidals and spirals, while the deeper potential wells of giant galaxies keeps their profile steeper.
-
(a)
-
4.
The effect of DF adds to that of tidal torques (ordered AM), and random AM.
-
5.
Finally, the core further slightly (few percent) enlarges from the decrease of stellar density due to successive gas expulsion from supernovae explosions, and from the disruption of the smallest gas clumps, once they have partially converted to stars (see Nipoti and Binney, 2015).
II.1 Model treatment of density profile
Starting from a Hubble expansion, the spherical model of density perturbations expands linearly until reaching a turn-around maximum and reverting into collapse (Gunn, 1977; Fillmore and Goldreich, 1984). A Lagrange particle approach yields the final density profile
| (1) |
with initial and turn-around radius, resp. and , collapse factor , and turnaround density . The turn-around radius is obtained with
| (2) |
where we used for the density parameter, and for the average overdensity inside a DM and baryons shell.
The model starts with all baryons in gas form with for the ”universal baryon fraction“ (Komatsu et al., 2009) (set to 0.167 in Komatsu et al., 2011), before star formation proceeds as described below.
Tidal torque theory (TTT) allows to compute the ”specific ordered angular momentum“, , exerted on smaller scales from larger scales tidal torques (Hoyle, 1953; Peebles, 1969; White, 1984; Ryden, 1988; Eisenstein and Loeb, 1995), while the ”random angular momentum“, , is related to orbits eccentricity (Avila-Reese et al., 1998), obtained from the apocentric radius , the pericentric radius and corrected from the system’s dynamical state effects advocated by Ascasibar et al. (2004), using the spherically averaged turnaround radius and the maximum radius of the halo
| (3) |
II.2 Effects of baryons, discs, and clumps
The baryon gas halo settles into a stable, rotationally supported, disk, in the case of spiral galaxies. Their size and mass result from solving the equation of motion, and lead to a solution of the angular momentum catastrophe (AMC) (Section 3.2, Fig. 3, and 4 of Del Popolo, 2014a), obtaining realistic disc size and mass.
Notwithstanding stabilization from the shear force, Jean’s criterion shows the appearance of instability for denser discs. The condition for this appearance and subsequent clump formation was found by Toomre Toomre (1964), involving the 1-D velocity dispersion ,444 km/s in most clump hosting galaxies angular velocity , surface density , related to the adiabatic sound speed , and the epicyclic frequency
| (4) |
The solution to the perturbation dispersion relation for yields the fastest growing mode (see Binney and Tremaine (1987) or (Nipoti and Binney, 2015, Eq. 6)). That condition allows to compute the clumps radii in galaxies (Krumholz and Dekel, 2010)
| (5) |
Marginally unstable discs () with maximal velocity dispersion have a total mass three times larger than that of the cold disc, and form clumps % of their disk mass (Dekel et al., 2009).
Objects of masses few times , found in haloes at , are in a marginally unstable phase for Gyr. Generally the main properties of clumps are similar to those found by Ceverino et al. (2012).
In agreement with Ma and Boylan-Kolchin (2004); Nipoti et al. (2004); Romano-Díaz et al. (2008, 2009); Del Popolo (2009); Cole et al. (2011); Inoue and Saitoh (2011); Del Popolo and Le Delliou (2014); Nipoti and Binney (2015), energy and AM transfer from clumps to DM flatten the profile more efficiently in smaller haloes.
II.2.1 Computing the clumps life-time
Evidence for existence of the clumps produced by the model can be traced both in simulations (e.g., Ceverino et al., 2010; Perez et al., 2013; Perret et al., 2014; Ceverino et al., 2014, 2015; Bournaud et al., 2014; Behrendt et al., 2016), and observations. High redshift galaxies have been found to contain clump clusters or clumpy structures that leads to call them chain galaxies (e.g., Elmegreen et al., 2004, 2009; Genzel et al., 2011). The HST Ultra Deep Field encompasses galaxies with massive star-forming clumps (Guo et al., 2012; Wuyts et al., 2013), many at (Guo et al., 2015), some in deeper fields Elmegreen et al. (2007).
Such clumpy structures are expected to originate from self-gravity instability in very gas-rich disc, from radiative cooling in the accreting dense gas
(e.g., Noguchi, 1998, 1999; Aumer et al., 2010; Ceverino et al., 2010, 2012). Their effect on halo central density depend crucially on the clump lifetime: should their disruption through stellar feedback still allow them sufficient time
to sink to the galaxy centre, they can turn a cusp into a core. A clump’s ability to form a bound stellar system is assessed through its stellar feedback mass fraction loss,
, and its formed stars
mass fraction, . Simulations and analytical models agree that most of the mass of
such group of stars will remain bound for Baumgardt and Kroupa (2007). The radiation feedback efficiency can be estimated, using
a) the dimensionless star-formation rate efficiency . This is simply the ratio between free-fall time, , and the depletion time for a stellar mass . In its reduced version it reads ,
b) the reduced dimensionless surface density , and
c) the dimensionless reduced mass ,
to obtain the expulsion fraction (Krumholz and Dekel, 2010). Ref. (Krumholz and Tan, 2007) estimated, for a large sample of environments, densities, size and scales, that . Furthermore, and for typical clumps with masses . Therefore, the clump mass loss before they reach the centre of the galactic halo should be small. However, such conclusion and the expulsion fraction method are valid for smaller, more compact clumps in smaller galaxies. Such context only produces clumps that survive all the way to the centre.
Alternately, comparing a clump lifetime to its migration time to the centre, one can also obtain clump disruption. Migration time is the result of DF and TTT: for a clump, it yields Myrs (see Eq. 1 of Genzel et al., 2011; Nipoti and Binney, 2015, Eq. 18). Coincidents expansion and migration timescales were computed from the Sedov-Taylor solution (Genzel et al., 2011, Eqs. 8,9).
Clump lifetime has been much studied. Ceverino et al., finding clumps in Jean’s equilibrium and rotational support, from hydrodynamical simulations (Ceverino et al., 2010), construed their long lifetime ( Myr). This agrees with several approaches: in local systems forming stars and coinciding with the Kennicutt-Schmidt law, (Krumholz and Dekel, 2010) found such lifetimes. This is because as clumps retained gas, and formed bound star groups, they had time to migrate to the galactic centre. Simulations from Elmegreen et al. (2008) confirmed it. Other simulations with proper account of stellar feedback, e.g. non-thermal and radiative feedback mechanisms, also obtained long-lived clumps reaching galactic centre (SNF, radiation pressure, etc Perret et al., 2014; Bournaud et al., 2014; Ceverino et al., 2014). Finally, the same was obtained with any reasonable amount of feedback Perez et al. (2013). The expansion, gas expulsion, and metal enrichment, time scales (respectively Myrs, 170-1600 Myrs, and Myrs) obtained by Genzel et al. (2011) to estimate clump ages also bring strong evidence for long-lived clumps. Lastly, comparison between similar low and high redshift clumps observations (in radius, mass, Elmegreen et al., 2013; Garland et al., 2015; Mandelker et al., 2017) supports clump stability.
II.3 Model treatment of feedback and star formation
Star formation, reionisation, gas cooling, and SNF in the model are built along (De Lucia and Helmi, 2008; Li et al., 2010, Secs. 2.2.2 and 2.2.3).
- Reionisation
- Gas cooling
- Star formation
-
arises from gas conversion into stars when it has settled in a disk. The gas mass conversion into stars during a given time interval , which we take as the disc dynamical time , is given by
(7) where the star formation rate comes from the gas mass above the density threshold (fixed as in Di Cintio et al., 2014a) according to (see De Lucia and Helmi, 2008, for more details)
(8) - SNF
-
follows Croton et al. (2006), where SN explosions inject energy in the system. This energy can be calculated from a Chabrier IMF Chabrier (2003), using
-
the disc gas reheating energy efficiency ,
-
the available star mass ,
-
that mass conversion into SN measured with the SN number per solar mass as , and
-
the typical energy an SN explosion releases erg,
to obtain
(9) This released energy from SNs into the hot halo gas in the form of reheated disk gas then compares with the reheating energy which that same amount of gas should acquire if its injection in the halo should keep its specific energy constant, that is if the new gas would remain at equilibrium with the halo hot gas. That amount of disk gas the SN and stars radiation have reheated, , since it is produced from stars radiations, is proportional to their mass
(10) Since the halo hot gas specific energy corresponds to the Virial equilibrium specific kinetic energy , keeping this energy constant under addition of that reheated gas leads to define the equilibrium reheating energy as
(11) The comparison with the actual energy of the gas injected from the disk into the halo by SNs gives the threshold () beyond which gas is expelled, the available energy to expel the reheated gas, and thus the amount of gas ejected from that extra energy
(12)
Contrary to SNF based models such as Di Cintio et al. (2014a), our mechanism for cusp flattening initiates before the star formation epoch. Since it uses a gravitational energy source, it is thus less limited in available time and energy. Only after DF shapes the core can Stellar and SN feedback occurs, which then disrupt gas clouds in the core (similarly to Nipoti and Binney, 2015).
-
- AGN feedback
-
occurs when a central Super-Massive-Black-Hole (SMBH) is formed. We follow the prescriptions of Martizzi et al. (2012a, b), modifying the Booth and Schaye (2009) model for SMBH mass accretion and AGN feedback: a seed SMBH forms when stellar density, reduced gas density () and 3D velocity dispersion exceed the thresholds and 100 , which then accretes. Significant AGN quenching starts above (Cattaneo et al., 2006).
II.4 Model robustness
We point out that the model demonstrated its robustness in various behaviours:
-
\greekenumi.
the cusp flattening from DM heating by collapsing baryonic clumps predicted for galaxies and clusters is in agreement with following studies (El-Zant et al., 2001, 2004; Romano-Díaz et al., 2008, 2009; Cole et al., 2011; Inoue and Saitoh, 2011; Nipoti and Binney, 2015). A comparison with Governato et al. (2010)’s SPH simulations was made in (Del Popolo, 2011, Fig. 4).
-
\greekenumi.
it aforetime predicted the correct shape of galaxies density profiles (Del Popolo, 2009; Del Popolo and Kroupa, 2009), ahead of SPH simulations of Governato et al. (2010, 2012), and of clusters density profiles (Del Popolo, 2012b) anteriorly of Martizzi et al. (2013). 555Note that Governato et al. (2010, 2012) and Martizzi et al. (2013) adopted different dominant mechanisms.
- \greekenumi.
- \greekenumi.
- \greekenumi.
-
\greekenumi.
it moreover provides a comparison of the Tully-Fisher and Faber-Jackson, , relationships with simulations (Del Popolo, 2016, Figs. 4, 5).
III Summary of the steps of the simulation
Our model follows a semi-analytic approach, which is inexpensive compared with N-body/hydrodynamical simulations (such as NIHAO). This simplifies the construction of samples of galaxies, and rapid exploration of parameter space. Comparison studies of semi-analytic and N-body/hydro simulations have shown a good agreement in the studied cases (see Benson, 2012, and references therein). We use cosmological parameters as given by (Macciò et al., 2020, Section 2). Initially, the system is in gas form with the ”universal baryon fraction“ (Komatsu et al., 2009) (set to 0.167 in Komatsu et al., 2011). The way initial conditions, starting from the power spectrum, are fixed, and their ensuing evolution, is described in (Del Popolo, 2009, Appendix B). When the system reaches the non-linear regime, tidal interaction with neighbors are calculated as shown in detail in (Del Popolo, 2009, Appendix C). In the collapse phase, random angular momentum is generated and is calculated as in (Del Popolo, 2009, Appendix C). The effect of dynamical friction is calculated in (Del Popolo, 2009, Appendix D), while (Del Popolo, 2009, Appendix E) shows how the baryonic dissipative collapse happens. In the collapse the system can give either rise to a spiral structure or to a spheroid. This is described in (Del Popolo and Pace, 2016, Section A.5). Clumps characteristics and formation are described in Section II. 2 of this paper. Stars form according to the scheme described in Section II. 3 of this paper. The black hole formation, and the AGN feedback are described in the final part of Section II. 3 of this paper. The NIHAO simulation is a hydrodynamical simulation, based on GASOLINE2: as reported in (Macciò et al., 2020) it includes a series of physical effects like compton cooling, photoionisation and heating from the ultraviolet background, metal cooling, chemical enrichment, star formation and feedback from supernovae and massive stars.
IV DFBC and SNF
This paper presents DFBC and SNF results within the model of Sec. II. In particular, it focusses on DM halo inner slopes. It will not quantitatively compare those with results from Macciò et al. (2020), as 1. such comparison was already presented in (Del Popolo and Pace, 2016) for galaxies, using a large sample of data, against the (Di Cintio et al., 2014a) model, that displays results similar to Macciò et al. (2020). 2. the Macciò et al. (2020) model only extends to the mass range of groups, while clusters of galaxies inner slope estimates are available (see Newman et al., 2013a, b).
The role and importance of baryons in the Cusp/Core problem solution was suggested by Flores and Primack (Flores and Primack, 1994), and by several subsequent papers. (Navarro et al., 1996b) showed that the expulsion of gas in the halo in a single event could flatten the cusp. However, it was soon clear that a single event was not sufficient to produce observed flattening, and that repeated events were needed (Gnedin and Zhao, 2002). (Mashchenko et al., 2006, 2008), showed that random bulk motions of gas due to SN explosion could form a core. Governato (Governato et al., 2010, 2012) confirmed the result, in addition to finding a correlation between stellar mass, , and the inner slope for galaxies with . Their simulations, similarly to (Di Cintio et al., 2014a), implement SN feedback through early stellar feedback or the SN feedback. In fact, the inner slope characteristics dependence on stellar mass to halo mass ratio, , had already been found by (Del Popolo, 2010).
An alternative mechanism to flatten cusps into cores was proposed by El-Zant (El-Zant et al., 2001, 2004). The model is based on ”heating” of DM via interaction of baryons (gas clumps) with it through dynamical friction. The exchange of energy and angular momentum between clumps and dark matter can flatten the profile. The earlier the process occurs (i.e. for smaller halos), the more efficient it is. Many studies have confirmed the effectiveness of the process (Ma and Boylan-Kolchin, 2004; Nipoti et al., 2004; Romano-Díaz et al., 2008; Del Popolo, 2009; Romano-Díaz et al., 2009; Cole et al., 2011; Del Popolo, 2014a; Nipoti and Binney, 2015). In more detail, as shown by (Del Popolo, 2009, 2014a), the DM and gas proto-structure starts in the linear phase. It expands to reach a maximum radius, and then recollapse. The collapse of the DM component occurs first, forming the potential wells in which baryons will fall. Because of radiative processes, baryons form clump, which collapse to the halo centre and form stars. The collapse also comprises the so called ”adiabatic contraction” phase (Blumenthal et al., 1986; Gnedin et al., 2004), in which baryons are compressed, generating a cuspier DM profiles.
Because of dynamical friction between DM and baryons, clumps fall to the centre of the structure. During this fall, angular momentum and energy is transferred to the DM component, and the cusp is heated, giving rise to the formation of a core. This core formation occurs before stars formation. Then, stellar feedback expels a large part of the gas, leaving a lower stellar density. After a part of the clumps is transformed into stars, feedback destroys clumps, and mass distribution is dominated by DM. The model just described agrees with (El-Zant et al., 2001; Ma and Boylan-Kolchin, 2004; Nipoti et al., 2004; Romano-Díaz et al., 2008; Del Popolo, 2009; Romano-Díaz et al., 2009; Cole et al., 2011; Del Popolo, 2014a; Nipoti and Binney, 2015).
This model is the only one able to describe the correct dependence of the inner slope of the DM density profile from dwarf galaxies to clusters of galaxies (Del Popolo, 2009, 2010, 2012a, 2012b; Del Popolo and Hiotelis, 2014). Apart from this, as described in the Sec. II, the model predicted several results, later also obtained by the SNF model.
The SNF and DFBC model differ significantly in the series of steps they require. The SNF model starts from gas that forms stars. These can explode into supernovae if they have enough mass. A longer and more complex series of events are needed to produce the observed density profile flattening than for the DFBC. Indeed, the DFBC only requires the presence of gas clumps to flatten the halo cusp and gives rise to the core. DFBC is therefore more ergonomic and efficient at producing cores than the SNF model.
V Results
We used the model in Sect. II to determine the structure of the objects formed by DM and baryons. The density profile of every object was fitted to obtain the dependence of the inner slope on stellar and DM mass. The fitting method used is similar to that of (Macciò et al., 2020). After determining its center, the halo is divided in fifty spherical shells, each one with constant width in logarithmic scale. The halo density profile is obtained by evaluating, for each shell, the average DM density. The density profile central slope was then obtained, considering the shells with radius in the range 1%-2% of the virial radius666The virial radius is defined as the radius at which the halo overdensity is 200 , being the critical density . The density profile central slope was then computed with a linear fit in the plane.
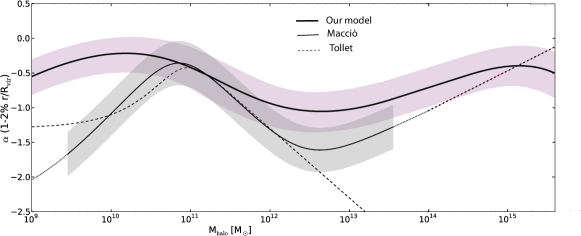
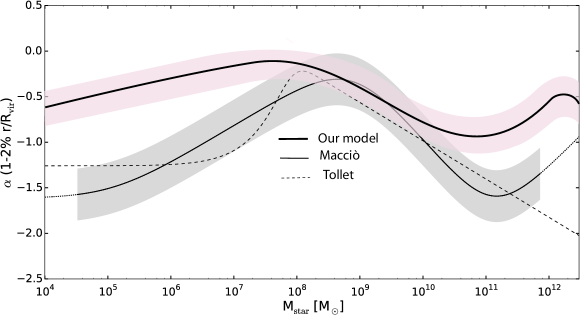
The main results of the paper are plotted in Figs. 1-2, showing the relations between the inner density slope , and the halo mass, or stellar mass, respectively. In both plots, the top solid lines represent the result of this paper, while the bottom ones that of (Macciò et al., 2020). Note that the dotted line in the (Macciò et al., 2020) result is an extrapolation to larger and smaller masses.
The dashed lines represent the Tollet Tollet et al. (2016) result. In the halo mass range, of Fig. 1, the slope of our model flattens from -0.5 to values closer to zero, thus there is a maximum of core formation. In the SNF model (i.e. Macciò et al., 2020, the Macció model), core formation proceeds from significant alteration of the inner DM density profile from stellar feedback: the inner halo then expands, giving rise to a core. In the DFBC model (namely our model), the DF interaction between DM and baryons produces a ”heating” of DM, with a consequent expansion, and the formation of a core.
In this mass range, Fig. 1 displays a similar trend to that of (Tollet et al., 2016; Macciò et al., 2020).
Although the trends are similar, the slopes differ, especially below . In this range as well as in the other ranges, the difference in slope is due to the different ways the DFBC and SNF works. As discussed in the paper, for the DFBC, the flattening of density profiles is due to the ”heating” of DM via interaction with baryons (gas clumps) through dynamical friction. Through this interaction, angular momentum and energy are exchanged between dark matter and clumps, resulting in the profile flattening. For the SNF, mass ejection from the supernovae leads to the same effect. A discriminating issue lies in the onset of the ”heating“ processes: the earlier those processes arise, the more efficiently they flatten the profile. The series of steps SNF and DFBC require to flatten a profile are different. For the SNF, gas must form stars before these can explode as supernovae, if the mass is large enough. A longer and more complex series of events are needed to produce the observed density profile flattening than for the DFBC. To flatten the halo cusp and give rise to the core, the DFBC just requires the presence of gas clumps. Its flattening is therefore more ergonomic and efficient than the SNF model. As a result the process produces smaller slopes than through SNF.
After the maximum, both our result and that of Macció steepen again, reaching values around -1, in our model, and -1.6 for Macció model, for masses of .
That steepening, especially for the Macció model based on SNF, is related to stars forming in the central regions, which deepens the gravitational potential, opposing SN feedback, and the DM expansion process. This produce a cuspier profile.
In the mass range above , the slope starts to flatten.
In the case of the Macció model, the flattening stops at the limit of their simulation, namely at . In our case, the flattening reaches a maximum at , and is related to the AGN feedback. This is similar to the flattening effect of SN feedback on smaller masses. Beyond the maximum, we observe again a steepening of the profile, because AGN feedback becomes less effective.
In Summary, while in (Del Popolo and Pace, 2016), and Tollet et al. (2016), the behavior is non-monotonic with only one maximum of ”core-formation”, the behavior in our model is more complex, and presents two maxima of ”core-formation”. The first maximum is produced by the DFBC mechanism and SN feedback, while the second is produced by the DFBC mechanism and AGN feedback. The situation in the case of (Macciò et al., 2020) is similar to that of Tollet et al. (2016) in the halo mass range , where their slope flattens to a maximum at . A relaxation of the halo is observed for masses larger than , as in the case of our model, with an inner slope flatter than the predictions of DM only N-body simulations.
At this point there are two important remarks. The first concerns an effect in the Macció model that prevents it from producing shallow enough cores in the mass range : the number of stars forming in the central regions is so large that it can efficiently oppose the SN feedback. This produces a region with steeper slopes, with respect to the region . This effect is not so important in the case of our model, and consequently we have shallower slopes. The second provides an extra reason for the slope difference in this region between our model and Macció’s: the larger efficiency of the DFBC model compared with the SNF model, that does not need to wait for stars to form to start producing feedback on DM.
Our model and (Macciò et al., 2020) have similar behavior until . As the Maccio model (Macciò et al., 2020) validity does not extend beyond , the comparison with our model cannot be extended to some of the masses it reaches.
| [M⊙] | [M⊙] | [M⊙] | [M⊙] | [M⊙] | ||
|---|---|---|---|---|---|---|
| -5.32 | 8.60 | |||||
| -0.46 | 3.94 | |||||
| 1- | ||||||
| 1.14 | 0.26 | 0.43 | 1.15 | 0.32 | ||
| 1.16 | 2.53 | 0.22 | 0.71 | 0.28 |
The behavior of the inner slope versus the stellar mass (Fig. (2)), is similar to that discussed for the case of : in our model, we observe the double maxima, as in the case of , at , and . For the (Macciò et al., 2020) model, the situation of is similar to that of . In the (Macciò et al., 2020) model, an up-turn for is observed. The behavior of the inner slope as function of , or , can be represented by the functional forms
| (13) |
Note the functional forms are identical but differ from the values of the functional break limit masses ( or ), of the variables ( or ) and of the parameters, that are shown in Table 1.
Figs. 1-2 also presents the scatter around both our and the (Macciò et al., 2020) relations. These scatters are almost constant, and in the case of the slope-halo mass relation, the value of the average scatter is , while in the case of the slope-stellar mass relation it is . It was calculated using all the galaxies simulated. We do not plot all the galaxies so as to keep the figures legible.
Note that the slope behaviour, and by extension that of the DM density profile, for cluster-type masses can result from a model with two stages. The first dissipative phase sees the formation of the seed for the BCG, while the second, dissipationless stage is driven by the DF, between DM in the halo and the sunk baryonic clumps (to the centre), into flattening the density profile inner slope.
The large scatter of the inner slope among the cluster population reflects 1.) that the total mass density profile is given by the sum of the DM and baryon contents: 2.) haloes follow NFW-like density profiles 3.) the variations in the BCGs masses. This entails DM profile inner slopes ranges from the NFW slope to flatter slopes, depending on the amount of central baryons.
Before concluding, let us emphasize our results, in their differences with Tollet et al. (2016); Macciò et al. (2020). The major difference lies in the larger range, from dwarf galaxies to clusters, described by our model, compared with Tollet et al. (2016); Macciò et al. (2020). Indeed, Fig. (1) reveals that our model produces a flatter slope than Tollet et al. (2016); Macciò et al. (2020) in all mass ranges, except for a very small mass range close to . Our model’s almost always shallower slope compared with Tollet et al. (2016); Macciò et al. (2020) stems from the more efficient flattening from the DFBC model, compared with the SNF model. This is particularly visible in the mass range . Close to , the energy released by supernovae is larger than the gravitational potential due to stars, resulting into a maximum efficiency of the SNF and a corresponding minimum (maximum flattening) for the Tollet et al. (2016); Macciò et al. (2020) slope, while our model outputs similar slopes. The intensity of the stars gravitational potential increases from to , consequently steepening the slope in the Tollet et al. (2016); Macciò et al. (2020) model. This behaviour occurs similarly in our model, due to the decrease in the exchange of energy between clumps and DM. It produces a shallower slope, reflecting the higher efficiency of the DFBC mechanism compared with the SNF, as pointed above. In the mass range , AGN feedback starts to show its effect, in the Macciò et al. (2020) model and in ours, resulting in the observed flattening.
VI Conclusions
Despite the facts that the CDM model has shown many observational successes and that the Cusp/Core problem is better understood compared with a couple of decades ago, the Cusp/Core problem remains one of the prominent problems of the CDM model. It consists in the discrepancy between the inner slope observed in dwarf galaxies, and the cuspy profiles obtained in N-body only simulations. One of its remaining issues concerns the understanding of the observed variations of inner slopes among different kinds of galaxies, as well as among galaxy clusters, with shallower than the standard Navarro-Frenk-White profiles. Following the mass dependence of galaxies inner slopes shown in (Del Popolo, 2010), several SPH simulations studied the problem in detail.
Following the slope-mass relation obtained by (Di Cintio et al., 2014b; Tollet et al., 2016; Del Popolo and Pace, 2016) in the mass range covering dwarf galaxies up to Milky-Way sizes, and its extension by (Macciò et al., 2020) to galaxy groups, this paper further extended the (Macciò et al., 2020) results to the mass range of clusters of galaxies. For more massive structures than galaxies, the inner slope-mass relation continues to steepen until reaching a minimum and increasing again. Specifically, the slope-halo mass profile flattening starts at masses and reaches a maximum of core formation at . This flattening is produced by the action of AGN feedback, in a similar way to the role of SN feedback for smaller galaxy masses. Beyond this maximum of core formation, the trend reverts to steepening. The one-sigma scatter on is approximately constant in the whole mass range (). Our slope-mass relation is a first step in determining a density profile taking into account baryons, for a larger mass range than for the profiles obtained by (Di Cintio et al., 2014b). Indeed, the (Di Cintio et al., 2014b) density profile taking baryons into account is limited to the dwarf galaxies to Milky Way size mass range. We have extended this to clusters of galaxies. In a subsequent paper, we propose to find the density profile of structures, taking into account the role of baryons, in the mass range from dwarf galaxies to clusters. Despite well known limitations in density profile inner slope determination, such model could then be compared with clusters mass extrapolation of the Macciò et al. (2020) results, also considering Milky Way dwarf spheroidals (Hayashi et al., 2020) and clusters from (Newman et al., 2013a, b).
Acknowledgments
MLeD acknowledges the financial support by the Lanzhou University starting fund, the Fundamental Research Funds for the Central Universities (Grant No. lzujbky-2019-25), National Science Foundation of China (grant No. 12047501) and the 111 Project under Grant No. B20063. The authors wish to thank Maksym Deliyergiyev for some calculations.
References
- Planck Collaboration et al. (2016) Planck Collaboration, P. A. R. Ade, N. Aghanim, M. Arnaud, M. Ashdown, J. Aumont, C. Baccigalupi, A. J. Banday, R. B. Barreiro, J. G. Bartlett, and et al., A&A 594, A13 (2016), arXiv:1502.01589 .
- Bertone et al. (2005) G. Bertone, D. Hooper, and J. Silk, Physics Reports 405, 279 (2005), arXiv:hep-ph/0404175 .
- Del Popolo (2014a) A. Del Popolo, International Journal of Modern Physics D 23, 1430005 (2014a), arXiv:1305.0456 [astro-ph.CO] .
- Riess et al. (1998) A. G. Riess, A. V. Filippenko, P. Challis, and et al., AJ 116, 1009 (1998), arXiv:astro-ph/9805201 .
- Perlmutter et al. (1999) S. Perlmutter, G. Aldering, G. Goldhaber, and et al., ApJ 517, 565 (1999), arXiv:astro-ph/9812133 .
- Del Popolo (2007) A. Del Popolo, Astronomy Reports 51, 169 (2007), arXiv:0801.1091 .
- Komatsu et al. (2011) E. Komatsu, K. M. Smith, J. Dunkley, and et al., ApJS 192, 18 (2011), arXiv:1001.4538 [astro-ph.CO] .
- Hinshaw et al. (2013) G. Hinshaw, D. Larson, E. Komatsu, D. N. Spergel, C. L. Bennett, J. Dunkley, M. R. Nolta, M. Halpern, R. S. Hill, and eet al., ApJS 208, 19 (2013), arXiv:1212.5226 [astro-ph.CO] .
- Del Popolo (2013) A. Del Popolo, in AIP Conf. Proc., Vol. 1548 (2013) pp. 2–63.
- Planck Collaboration et al. (2014) Planck Collaboration, P. A. R. Ade, N. Aghanim, C. Armitage-Caplan, M. Arnaud, M. Ashdown, F. Atrio-Barandela, J. Aumont, C. Baccigalupi, A. J. Banday, and et al., A&A 571, A16 (2014), arXiv:1303.5076 .
- Weinberg (1989) S. Weinberg, Reviews of Modern Physics 61, 1 (1989).
- Astashenok and del Popolo (2012) A. V. Astashenok and A. del Popolo, Classical and Quantum Gravity 29, 085014 (2012), arXiv:1203.2290 [gr-qc] .
- Del Popolo et al. (2013a) A. Del Popolo, F. Pace, and J. A. S. Lima, International Journal of Modern Physics D 22, 1350038 (2013a), arXiv:1207.5789 [astro-ph.CO] .
- Del Popolo et al. (2013b) A. Del Popolo, F. Pace, and J. A. S. Lima, MNRAS 430, 628 (2013b), arXiv:1212.5092 [astro-ph.CO] .
- Del Popolo et al. (2013c) A. Del Popolo, F. Pace, S. P. Maydanyuk, J. A. S. Lima, and J. F. Jesus, Phys. Rev. D 87, 043527 (2013c), arXiv:1303.3628 [astro-ph.CO] .
- Bolejko (2018) K. Bolejko, Phys. Rev. D97, 103529 (2018), arXiv:1712.02967 [astro-ph.CO] .
- Raveri (2016) M. Raveri, Phys. Rev. D 93, 043522 (2016).
- Macaulay et al. (2013) E. Macaulay, I. K. Wehus, and H. K. Eriksen, Physical Review Letters 111, 161301 (2013), arXiv:1303.6583 .
- Del Popolo and Gambera (2000) A. Del Popolo and M. Gambera, A&A 357, 809 (2000), astro-ph/9909156 .
- Del Popolo (2002) A. Del Popolo, MNRAS 336, 81 (2002), astro-ph/0205449 .
- Del Popolo and Cardone (2012) A. Del Popolo and V. F. Cardone, MNRAS 423, 1060 (2012), arXiv:1203.3377 [astro-ph.CO] .
- Newman et al. (2013a) A. B. Newman, T. Treu, R. S. Ellis, D. J. Sand, C. Nipoti, J. Richard, and E. Jullo, ApJ 765, 24 (2013a), arXiv:1209.1391 [astro-ph.CO] .
- Newman et al. (2013b) A. B. Newman, T. Treu, R. S. Ellis, and D. J. Sand, ApJ 765, 25 (2013b), arXiv:1209.1392 [astro-ph.CO] .
- Del Popolo et al. (2017) A. Del Popolo, F. Pace, and M. Le Delliou, JCAP 3, 032 (2017), arXiv:1703.06918 .
- Del Popolo et al. (2018) A. Del Popolo, F. Pace, M. Le Delliou, and X. Lee, Phys. Rev. D 98, 063517 (2018), arXiv:1809.10609 [astro-ph.GA] .
- Moore et al. (1999) B. Moore, T. Quinn, F. Governato, J. Stadel, and G. Lake, MNRAS 310, 1147 (1999), astro-ph/9903164 .
- Boylan-Kolchin et al. (2011) M. Boylan-Kolchin, J. S. Bullock, and M. Kaplinghat, MNRAS 415, L40 (2011), arXiv:1103.0007 [astro-ph.CO] .
- Boylan-Kolchin et al. (2012) M. Boylan-Kolchin, J. S. Bullock, and M. Kaplinghat, MNRAS 422, 1203 (2012), arXiv:1111.2048 [astro-ph.CO] .
- Zolotov et al. (2012) A. Zolotov, A. M. Brooks, B. Willman, F. Governato, A. Pontzen, C. Christensen, A. Dekel, T. Quinn, S. Shen, and J. Wadsley, ApJ 761, 71 (2012), arXiv:1207.0007 [astro-ph.CO] .
- Del Popolo et al. (2014) A. Del Popolo, J. A. S. Lima, J. C. Fabris, and D. C. Rodrigues, JCAP 4, 021 (2014), arXiv:1404.3674 .
- Moore (1994) B. Moore, Nature (London) 370, 629 (1994).
- Flores and Primack (1994) R. A. Flores and J. R. Primack, ApJL 427, L1 (1994), astro-ph/9402004 .
- Navarro et al. (1996a) J. F. Navarro, C. S. Frenk, and S. D. M. White, ApJ 462, 563 (1996a), astro-ph/9508025 .
- Navarro et al. (1997) J. F. Navarro, C. S. Frenk, and S. D. M. White, ApJ 490, 493 (1997), astro-ph/9611107 .
- Navarro et al. (2010) J. F. Navarro, A. Ludlow, V. Springel, J. Wang, M. Vogelsberger, S. D. M. White, A. Jenkins, C. S. Frenk, and A. Helmi, MNRAS 402, 21 (2010), arXiv:0810.1522 .
- Moore et al. (1998) B. Moore, F. Governato, T. Quinn, J. Stadel, and G. Lake, ApJL 499, L5+ (1998), astro-ph/9709051 .
- Fukushige and Makino (2001) T. Fukushige and J. Makino, ApJ 557, 533 (2001), astro-ph/0008104 .
- Jing and Suto (2000) Y. P. Jing and Y. Suto, ApJL 529, L69 (2000), astro-ph/9909478 .
- Ricotti (2003) M. Ricotti, MNRAS 344, 1237 (2003), astro-ph/0212146 .
- Ricotti and Wilkinson (2004) M. Ricotti and M. I. Wilkinson, MNRAS 353, 867 (2004), astro-ph/0406297 .
- Ricotti et al. (2007) M. Ricotti, A. Pontzen, and M. Viel, ApJL 663, L53 (2007), arXiv:0706.0856 .
- Del Popolo (2010) A. Del Popolo, MNRAS 408, 1808 (2010), arXiv:1012.4322 [astro-ph.CO] .
- Cardone et al. (2011) V. F. Cardone, A. Del Popolo, C. Tortora, and N. R. Napolitano, MNRAS 416, 1822 (2011), arXiv:1106.0364 [astro-ph.CO] .
- Del Popolo (2011) A. Del Popolo, JCAP 7, 014 (2011), arXiv:1112.4185 [astro-ph.CO] .
- Del Popolo et al. (2013d) A. Del Popolo, V. F. Cardone, and G. Belvedere, MNRAS 429, 1080 (2013d), arXiv:1212.6797 [astro-ph.CO] .
- Di Cintio et al. (2014a) A. Di Cintio, C. B. Brook, A. A. Dutton, A. V. Macciò, G. S. Stinson, and A. Knebe, Mon. Not. Roy. Astron. Soc. 441, 2986 (2014a), arXiv:1404.5959 [astro-ph.CO] .
- Stadel et al. (2009) J. Stadel, D. Potter, B. Moore, J. Diemand, P. Madau, M. Zemp, M. Kuhlen, and V. Quilis, MNRAS 398, L21 (2009), arXiv:0808.2981 .
- Gao et al. (2008) L. Gao, J. F. Navarro, S. Cole, C. S. Frenk, S. D. M. White, V. Springel, A. Jenkins, and A. F. Neto, MNRAS 387, 536 (2008), arXiv:0711.0746 .
- Polisensky and Ricotti (2015) E. Polisensky and M. Ricotti, MNRAS 450, 2172 (2015), arXiv:1504.02126 .
- Governato et al. (2010) F. Governato, C. Brook, L. Mayer, A. Brooks, G. Rhee, J. Wadsley, P. Jonsson, B. Willman, G. Stinson, T. Quinn, and P. Madau, Nature (London) 463, 203 (2010), arXiv:0911.2237 [astro-ph.CO] .
- Governato et al. (2012) F. Governato, A. Zolotov, A. Pontzen, C. Christensen, S. H. Oh, A. M. Brooks, T. Quinn, S. Shen, and J. Wadsley, MNRAS 422, 1231 (2012), arXiv:1202.0554 [astro-ph.CO] .
- Del Popolo (2009) A. Del Popolo, ApJ 698, 2093 (2009), arXiv:0906.4447 [astro-ph.CO] .
- Cardone and Del Popolo (2012) V. F. Cardone and A. Del Popolo, MNRAS 427, 3176 (2012), arXiv:1209.1524 [astro-ph.CO] .
- Del Popolo (2012a) A. Del Popolo, MNRAS 419, 971 (2012a), arXiv:1105.0090 [astro-ph.CO] .
- Del Popolo (2012b) A. Del Popolo, MNRAS 424, 38 (2012b), arXiv:1204.4439 [astro-ph.CO] .
- Del Popolo and Hiotelis (2014) A. Del Popolo and N. Hiotelis, JCAP 1, 047 (2014), arXiv:1401.6577 [astro-ph.GA] .
- Burkert (1995) A. Burkert, ApJL 447, L25 (1995), astro-ph/9504041 .
- de Blok et al. (2003) W. J. G. de Blok, A. Bosma, and S. McGaugh, MNRAS 340, 657 (2003), astro-ph/0212102 .
- Swaters et al. (2003) R. A. Swaters, B. F. Madore, F. C. van den Bosch, and M. Balcells, ApJ 583, 732 (2003), astro-ph/0210152 .
- Kuzio de Naray and Kaufmann (2011) R. Kuzio de Naray and T. Kaufmann, MNRAS 414, 3617 (2011), arXiv:1012.3471 [astro-ph.CO] .
- Oh et al. (2011a) S.-H. Oh, W. J. G. de Blok, E. Brinks, F. Walter, and R. C. Kennicutt, Jr., AJ 141, 193 (2011a), arXiv:1011.0899 [astro-ph.CO] .
- Oh et al. (2011b) S.-H. Oh, C. Brook, F. Governato, E. Brinks, L. Mayer, W. J. G. de Blok, A. Brooks, and F. Walter, AJ 142, 24 (2011b), arXiv:1011.2777 [astro-ph.CO] .
- Sand et al. (2002) D. J. Sand, T. Treu, and R. S. Ellis, ApJL 574, L129 (2002), astro-ph/0207048 .
- Sand et al. (2004) D. J. Sand, T. Treu, G. P. Smith, and R. S. Ellis, ApJ 604, 88 (2004), astro-ph/0309465 .
- Del Popolo et al. (2019) A. Del Popolo, M. Le Delliou, and X. Lee, Phys. Dark Univ. 26, 100342 (2019).
- de Blok and McGaugh (1997) W. J. G. de Blok and S. S. McGaugh, MNRAS 290, 533 (1997), astro-ph/9704274 .
- Spano et al. (2008) M. Spano, M. Marcelin, P. Amram, C. Carignan, B. Epinat, and O. Hernandez, MNRAS 383, 297 (2008), arXiv:0710.1345 .
- Simon et al. (2005) J. D. Simon, A. D. Bolatto, A. Leroy, L. Blitz, and E. L. Gates, ApJ 621, 757 (2005), astro-ph/0412035 .
- de Blok et al. (2008) W. J. G. de Blok, F. Walter, E. Brinks, C. Trachternach, S.-H. Oh, and R. C. Kennicutt, Jr., AJ 136, 2648 (2008), arXiv:0810.2100 .
- Martinsson et al. (2013) T. P. K. Martinsson, M. A. W. Verheijen, K. B. Westfall, M. A. Bershady, D. R. Andersen, and R. A. Swaters, A&A 557, A131 (2013), arXiv:1308.0336 [astro-ph.CO] .
- Simon et al. (2003) J. D. Simon, A. D. Bolatto, A. Leroy, and L. Blitz, ApJ 596, 957 (2003), astro-ph/0307154 .
- Adams et al. (2012) J. J. Adams, K. Gebhardt, G. A. Blanc, M. H. Fabricius, G. J. Hill, J. D. Murphy, R. C. E. van den Bosch, and G. van de Ven, ApJ 745, 92 (2012), arXiv:1110.5951 [astro-ph.CO] .
- Adams et al. (2014) J. J. Adams, J. D. Simon, M. H. Fabricius, R. C. E. van den Bosch, J. C. Barentine, R. Bender, K. Gebhardt, G. J. Hill, J. D. Murphy, R. A. Swaters, J. Thomas, and G. van de Ven, ApJ 789, 63 (2014), arXiv:1405.4854 .
- Battaglia et al. (2013) G. Battaglia, A. Helmi, and M. Breddels, New Astronomy Reviews 57, 52 (2013), arXiv:1305.5965 [astro-ph.CO] .
- Evans et al. (2009) N. W. Evans, J. An, and M. G. Walker, MNRAS 393, L50 (2009), arXiv:0811.1488 .
- Wolf and Bullock (2012) J. Wolf and J. S. Bullock, ArXiv e-prints, 1203.4240 (2012), arXiv:1203.4240 [astro-ph.CO] .
- Hayashi and Chiba (2012) K. Hayashi and M. Chiba, ApJ 755, 145 (2012), arXiv:1206.3888 [astro-ph.CO] .
- Richardson and Fairbairn (2013) T. Richardson and M. Fairbairn, MNRAS 432, 3361 (2013), arXiv:1207.1709 [astro-ph.CO] .
- Jardel and Gebhardt (2012) J. R. Jardel and K. Gebhardt, ApJ 746, 89 (2012), arXiv:1112.0319 [astro-ph.CO] .
- Breddels et al. (2013) M. A. Breddels, A. Helmi, R. C. E. van den Bosch, G. van de Ven, and G. Battaglia, MNRAS 433, 3173 (2013), arXiv:1205.4712 [astro-ph.CO] .
- Jardel and Gebhardt (2013) J. R. Jardel and K. Gebhardt, ApJL 775, L30 (2013).
- Jardel et al. (2013) J. R. Jardel, K. Gebhardt, M. H. Fabricius, N. Drory, and M. J. Williams, ApJ 763, 91 (2013), arXiv:1211.5376 [astro-ph.CO] .
- Battaglia et al. (2008) G. Battaglia, A. Helmi, E. Tolstoy, M. Irwin, V. Hill, and P. Jablonka, ApJL 681, L13 (2008), arXiv:0802.4220 .
- Walker and Peñarrubia (2011) M. G. Walker and J. Peñarrubia, ApJ 742, 20 (2011), arXiv:1108.2404 .
- Agnello and Evans (2012) A. Agnello and N. W. Evans, ApJL 754, L39 (2012), arXiv:1205.6673 [astro-ph.GA] .
- Amorisco and Evans (2012) N. C. Amorisco and N. W. Evans, MNRAS 419, 184 (2012), arXiv:1106.1062 [astro-ph.CO] .
- Hayashi et al. (2020) K. Hayashi, M. Chiba, and T. Ishiyama, Astrophys. J. 904, 45 (2020), arXiv:2007.13780 [astro-ph.GA] .
- Shao et al. (2020) S. Shao, M. Cautun, C. S. Frenk, M. Reina-Campos, A. J. Deason, R. A. Crain, J. D. Kruijssen, and J. Pfeffer, (2020), arXiv:2012.08058 [astro-ph.GA] .
- Zentner and Bullock (2003) A. R. Zentner and J. S. Bullock, ApJ 598, 49 (2003), astro-ph/0304292 .
- Colín et al. (2000) P. Colín, V. Avila-Reese, and O. Valenzuela, ApJ 542, 622 (2000), astro-ph/0004115 .
- Goodman (2000) J. Goodman, New Astronomy 5, 103 (2000), astro-ph/0003018 .
- Hu et al. (2000) W. Hu, R. Barkana, and A. Gruzinov, Physical Review Letters 85, 1158 (2000), astro-ph/0003365 .
- Kaplinghat et al. (2000) M. Kaplinghat, L. Knox, and M. S. Turner, Physical Review Letters 85, 3335 (2000), astro-ph/0005210 .
- Peebles (2000) P. J. E. Peebles, ApJL 534, L127 (2000), astro-ph/0002495 .
- Sommer-Larsen and Dolgov (2001) J. Sommer-Larsen and A. Dolgov, ApJ 551, 608 (2001), astro-ph/9912166 .
- Buchdahl (1970) H. A. Buchdahl, MNRAS 150, 1 (1970).
- Starobinsky (1980) A. A. Starobinsky, Physics Letters B 91, 99 (1980).
- Bengochea and Ferraro (2009) G. R. Bengochea and R. Ferraro, Phys. Rev. D 79, 124019 (2009), arXiv:0812.1205 .
- Linder (2010) E. V. Linder, Phys. Rev. D 81, 127301 (2010), arXiv:1005.3039 [astro-ph.CO] .
- Dent et al. (2011) J. B. Dent, S. Dutta, and E. N. Saridakis, JCAP 1, 9 (2011), arXiv:1010.2215 [astro-ph.CO] .
- Zheng and Huang (2011) R. Zheng and Q.-G. Huang, JCAP 3, 2 (2011), arXiv:1010.3512 [gr-qc] .
- Milgrom (1983a) M. Milgrom, ApJ 270, 371 (1983a).
- Milgrom (1983b) M. Milgrom, ApJ 270, 365 (1983b).
- Navarro et al. (1996b) J. F. Navarro, V. R. Eke, and C. S. Frenk, MNRAS 283, L72 (1996b), astro-ph/9610187 .
- Gelato and Sommer-Larsen (1999) S. Gelato and J. Sommer-Larsen, MNRAS 303, 321 (1999), astro-ph/9806289 .
- Read and Gilmore (2005) J. I. Read and G. Gilmore, MNRAS 356, 107 (2005), astro-ph/0409565 .
- Mashchenko et al. (2006) S. Mashchenko, H. M. P. Couchman, and A. Sills, ApJ 639, 633 (2006), astro-ph/0511361 .
- Mashchenko et al. (2008) S. Mashchenko, J. Wadsley, and H. M. P. Couchman, Science 319, 174 (2008), arXiv:0711.4803 .
- Oñorbe et al. (2015) J. Oñorbe, M. Boylan-Kolchin, J. S. Bullock, P. F. Hopkins, D. Kerěs, C.-A. Faucher-Giguère, E. Quataert, and N. Murray, Mon. Not. Roy. Astron. Soc. 454, 2092 (2015), arXiv:1502.02036 [astro-ph.GA] .
- El-Badry et al. (2017) K. El-Badry, A. R. Wetzel, M. Geha, E. Quataert, P. F. Hopkins, D. Kereš, T. K. Chan, and C.-A. Faucher-Giguère, ApJ 835, 193 (2017), arXiv:1610.04232 [astro-ph.GA] .
- Fitts et al. (2017) A. Fitts et al., Mon. Not. Roy. Astron. Soc. 471, 3547 (2017), arXiv:1611.02281 [astro-ph.GA] .
- El-Zant et al. (2001) A. El-Zant, I. Shlosman, and Y. Hoffman, ApJ 560, 636 (2001), astro-ph/0103386 .
- El-Zant et al. (2004) A. A. El-Zant, Y. Hoffman, J. Primack, F. Combes, and I. Shlosman, ApJL 607, L75 (2004), astro-ph/0309412 .
- Ma and Boylan-Kolchin (2004) C.-P. Ma and M. Boylan-Kolchin, Physical Review Letters 93, 021301 (2004), astro-ph/0403102 .
- Nipoti et al. (2004) C. Nipoti, T. Treu, L. Ciotti, and M. Stiavelli, MNRAS 355, 1119 (2004), astro-ph/0404127 .
- Romano-Díaz et al. (2008) E. Romano-Díaz, I. Shlosman, Y. Hoffman, and C. Heller, ApJL 685, L105 (2008), arXiv:0808.0195 .
- Romano-Díaz et al. (2009) E. Romano-Díaz, I. Shlosman, C. Heller, and Y. Hoffman, ApJ 702, 1250 (2009), arXiv:0901.1317 [astro-ph.CO] .
- Cole et al. (2011) D. R. Cole, W. Dehnen, and M. I. Wilkinson, MNRAS 416, 1118 (2011), arXiv:1105.4050 [astro-ph.CO] .
- Inoue and Saitoh (2011) S. Inoue and T. R. Saitoh, MNRAS 418, 2527 (2011), arXiv:1108.0906 [astro-ph.CO] .
- Nipoti and Binney (2015) C. Nipoti and J. Binney, MNRAS 446, 1820 (2015), arXiv:1410.6169 .
- Teyssier et al. (2013) R. Teyssier, A. Pontzen, Y. Dubois, and J. I. Read, MNRAS 429, 3068 (2013), arXiv:1206.4895 [astro-ph.CO] .
- Chan et al. (2015) T. Chan, D. Kereš, J. Oñorbe, P. Hopkins, A. Muratov, C. A. Faucher-Giguère, and E. Quataert, Mon. Not. Roy. Astron. Soc. 454, 2981 (2015), arXiv:1507.02282 [astro-ph.GA] .
- Tollet et al. (2016) E. Tollet et al., Mon. Not. Roy. Astron. Soc. 456, 3542 (2016), [Erratum: Mon.Not.Roy.Astron.Soc. 487, 1764 (2019)], arXiv:1507.03590 [astro-ph.GA] .
- Bose et al. (2019) S. Bose et al., Mon. Not. Roy. Astron. Soc. 486, 4790 (2019), arXiv:1810.03635 [astro-ph.GA] .
- Walter et al. (2008) F. Walter, E. Brinks, W. J. G. de Blok, F. Bigiel, R. C. Kennicutt, Jr., M. D. Thornley, and A. Leroy, AJ 136, 2563 (2008), arXiv:0810.2125 .
- Oh et al. (2008) S.-H. Oh, W. J. G. de Blok, F. Walter, E. Brinks, and R. C. Kennicutt, Jr., AJ 136, 2761 (2008), arXiv:0810.2119 .
- Trujillo-Gomez et al. (2015) S. Trujillo-Gomez, A. Klypin, P. Colín, D. Ceverino, K. S. Arraki, and J. Primack, MNRAS 446, 1140 (2015), arXiv:1311.2910 .
- Ferrero et al. (2012) I. Ferrero, M. G. Abadi, J. F. Navarro, L. V. Sales, and S. Gurovich, MNRAS 425, 2817 (2012), arXiv:1111.6609 [astro-ph.CO] .
- Peñarrubia et al. (2012) J. Peñarrubia, A. Pontzen, M. G. Walker, and S. E. Koposov, ApJL 759, L42 (2012), arXiv:1207.2772 [astro-ph.GA] .
- Garrison-Kimmel et al. (2013) S. Garrison-Kimmel, M. Rocha, M. Boylan-Kolchin, J. S. Bullock, and J. Lally, MNRAS 433, 3539 (2013), arXiv:1301.3137 [astro-ph.CO] .
- Garrison-Kimmel et al. (2014) S. Garrison-Kimmel, M. Boylan-Kolchin, J. S. Bullock, and E. N. Kirby, MNRAS 444, 222 (2014), arXiv:1404.5313 .
- Papastergis et al. (2015) E. Papastergis, R. Giovanelli, M. P. Haynes, and F. Shankar, A&A 574, A113 (2015), arXiv:1407.4665 .
- Oñorbe et al. (2015) J. Oñorbe, M. Boylan-Kolchin, J. S. Bullock, P. F. Hopkins, D. Kerěs, C.-A. Faucher-Giguère, E. Quataert, and N. Murray, ArXiv e-prints (2015), arXiv:1502.02036 .
- Katz et al. (2017) H. Katz, F. Lelli, S. S. McGaugh, A. Di Cintio, C. B. Brook, and J. M. Schombert, Mon. Not. Roy. Astron. Soc. 466, 1648 (2017), arXiv:1605.05971 [astro-ph.GA] .
- Macciò et al. (2020) A. V. Macciò, S. Crespi, M. Blank, and X. Kang, Mon. Not. Roy. Astron. Soc. 495, L46 (2020), arXiv:2004.03817 [astro-ph.GA] .
- Del Popolo and Pace (2016) A. Del Popolo and F. Pace, Astrophysics and Space Science 361, 162 (2016), arXiv:1502.01947 .
- Del Popolo and Kroupa (2009) A. Del Popolo and P. Kroupa, A&A 502, 733 (2009), arXiv:0906.1146 [astro-ph.CO] .
- Martizzi et al. (2012a) D. Martizzi, R. Teyssier, B. Moore, and T. Wentz, MNRAS 422, 3081 (2012a), arXiv:1112.2752 [astro-ph.CO] .
- Del Popolo and Gambera (1996) A. Del Popolo and M. Gambera, A&A 308, 373 (1996).
- Del Popolo (2014b) A. Del Popolo, JCAP 7, 019 (2014b), arXiv:1407.4347 .
- Lazar et al. (2020) A. Lazar et al., Mon. Not. Roy. Astron. Soc. 497, 2393 (2020), arXiv:2004.10817 [astro-ph.GA] .
- Gunn and Gott (1972) J. E. Gunn and J. R. Gott, III, ApJ 176, 1 (1972).
- Bertschinger (1985) E. Bertschinger, ApJS 58, 39 (1985).
- Hoffman and Shaham (1985) Y. Hoffman and J. Shaham, ApJ 297, 16 (1985).
- Ryden and Gunn (1987) B. S. Ryden and J. E. Gunn, ApJ 318, 15 (1987).
- Ascasibar et al. (2004) Y. Ascasibar, G. Yepes, S. Gottlöber, and V. Müller, MNRAS 352, 1109 (2004), arXiv:astro-ph/0312221 .
- Williams et al. (2004) L. L. R. Williams, A. Babul, and J. J. Dalcanton, ApJ 604, 18 (2004), astro-ph/0312002 .
- Ryden (1988) B. S. Ryden, ApJ 329, 589 (1988).
- Del Popolo and Gambera (1997) A. Del Popolo and M. Gambera, A&A 321, 691 (1997), astro-ph/9610052 .
- Blumenthal et al. (1986) G. R. Blumenthal, S. M. Faber, R. Flores, and J. R. Primack, ApJ 301, 27 (1986).
- Gnedin et al. (2004) O. Y. Gnedin, A. V. Kravtsov, A. A. Klypin, and D. Nagai, ApJ 616, 16 (2004), astro-ph/0406247 .
- Klypin et al. (2002) A. Klypin, H. Zhao, and R. S. Somerville, ApJ 573, 597 (2002), astro-ph/0110390 .
- Gustafsson et al. (2006) M. Gustafsson, M. Fairbairn, and J. Sommer-Larsen, Phys. Rev. D 74, 123522 (2006), astro-ph/0608634 .
- De Lucia and Helmi (2008) G. De Lucia and A. Helmi, MNRAS 391, 14 (2008), arXiv:0804.2465 .
- Li et al. (2010) Y.-S. Li, G. De Lucia, and A. Helmi, MNRAS 401, 2036 (2010), arXiv:0909.1291 [astro-ph.GA] .
- Del Popolo (2016) A. Del Popolo, Astrophysics and Space Science 361, 222 (2016), arXiv:1607.07408 .
- Del Popolo (2016) A. Del Popolo, Astrophys. Space Sci. 361, 222 (2016), arXiv:1607.07408 [astro-ph.GA] .
- Pontzen and Governato (2012) A. Pontzen and F. Governato, MNRAS 421, 3464 (2012), arXiv:1106.0499 [astro-ph.CO] .
- Gunn (1977) J. E. Gunn, ApJ 218, 592 (1977).
- Fillmore and Goldreich (1984) J. A. Fillmore and P. Goldreich, ApJ 281, 1 (1984).
- Komatsu et al. (2009) E. Komatsu, J. Dunkley, M. R. Nolta, and et al., ApJS 180, 330 (2009), arXiv:0803.0547 .
- Hoyle (1953) F. Hoyle, ApJ 118, 513 (1953).
- Peebles (1969) P. J. E. Peebles, ApJ 155, 393 (1969).
- White (1984) S. D. M. White, ApJ 286, 38 (1984).
- Eisenstein and Loeb (1995) D. J. Eisenstein and A. Loeb, ApJ 439, 520 (1995), arXiv:astro-ph/9405012 .
- Avila-Reese et al. (1998) V. Avila-Reese, C. Firmani, and X. Hernández, ApJ 505, 37 (1998), astro-ph/9710201 .
- Toomre (1964) A. Toomre, ApJ 139, 1217 (1964).
- Binney and Tremaine (1987) J. Binney and S. Tremaine, Second Edition, 2008, Princeton, NJ, Princeton University Press, 1987, 747 p. (1987).
- Krumholz and Dekel (2010) M. R. Krumholz and A. Dekel, MNRAS 406, 112 (2010), arXiv:1001.0765 .
- Dekel et al. (2009) A. Dekel, R. Sari, and D. Ceverino, ApJ 703, 785 (2009), arXiv:0901.2458 [astro-ph.GA] .
- Ceverino et al. (2012) D. Ceverino, A. Dekel, N. Mandelker, F. Bournaud, A. Burkert, R. Genzel, and J. Primack, MNRAS 420, 3490 (2012), arXiv:1106.5587 .
- Del Popolo and Le Delliou (2014) A. Del Popolo and M. Le Delliou, JCAP 12, 051 (2014), arXiv:1408.4893 .
- Ceverino et al. (2010) D. Ceverino, A. Dekel, and F. Bournaud, MNRAS 404, 2151 (2010), arXiv:0907.3271 [astro-ph.CO] .
- Perez et al. (2013) J. Perez, O. Valenzuela, P. B. Tissera, and L. Michel-Dansac, MNRAS 436, 259 (2013), arXiv:1308.4396 .
- Perret et al. (2014) V. Perret, F. Renaud, B. Epinat, P. Amram, F. Bournaud, T. Contini, R. Teyssier, and J. C. Lambert, Astron. Astrophys. 562, A1 (2014), arXiv:1307.7130 [astro-ph.CO] .
- Ceverino et al. (2014) D. Ceverino, A. Klypin, E. Klimek, S. Trujillo-Gomez, C. W. Churchill, and J. Primack, Mon. Not. Roy. Astron. Soc. 442, 1545 (2014), arXiv:1307.0943 [astro-ph.CO] .
- Ceverino et al. (2015) D. Ceverino, A. Dekel, D. Tweed, and J. Primack, Mon. Not. Roy. Astron. Soc. 447, 3291 (2015), arXiv:1409.2622 [astro-ph.GA] .
- Bournaud et al. (2014) F. Bournaud, V. Perret, F. Renaud, A. Dekel, B. G. Elmegreen, D. M. Elmegreen, R. Teyssier, P. Amram, E. Daddi, P.-A. Duc, D. Elbaz, B. Epinat, J. M. Gabor, S. Juneau, K. Kraljic, and E. Le Floch’, ApJ 780, 57 (2014), arXiv:1307.7136 [astro-ph.CO] .
- Behrendt et al. (2016) M. Behrendt, A. Burkert, and M. Schartmann, ApJL 819, L2 (2016), arXiv:1512.03430 .
- Elmegreen et al. (2004) D. M. Elmegreen, B. G. Elmegreen, and A. C. Hirst, ApJL 604, L21 (2004), astro-ph/0402477 .
- Elmegreen et al. (2009) D. M. Elmegreen, B. G. Elmegreen, M. T. Marcus, K. Shahinyan, A. Yau, and M. Petersen, ApJ 701, 306 (2009), arXiv:0906.2660 [astro-ph.CO] .
- Genzel et al. (2011) R. Genzel, S. Newman, T. Jones, N. M. Förster Schreiber, K. Shapiro, S. Genel, S. J. Lilly, and et al., ApJ 733, 101 (2011), arXiv:1011.5360 [astro-ph.CO] .
- Guo et al. (2012) Y. Guo, M. Giavalisco, H. C. Ferguson, P. Cassata, and A. M. Koekemoer, ApJ 757, 120 (2012), arXiv:1110.3800 .
- Wuyts et al. (2013) S. Wuyts, N. M. Förster Schreiber, E. J. Nelson, P. G. van Dokkum, G. Brammer, Y.-Y. Chang, S. M. Faber, H. C. Ferguson, M. Franx, M. Fumagalli, R. Genzel, N. A. Grogin, D. D. Kocevski, A. M. Koekemoer, B. Lundgren, D. Lutz, E. J. McGrath, I. Momcheva, D. Rosario, R. E. Skelton, L. J. Tacconi, A. van der Wel, and K. E. Whitaker, ApJ 779, 135 (2013), arXiv:1310.5702 .
- Guo et al. (2015) Y. Guo, H. C. Ferguson, E. F. Bell, D. C. Koo, C. J. Conselice, M. Giavalisco, S. Kassin, Y. Lu, R. Lucas, N. Mandelker, D. M. McIntosh, J. R. Primack, S. Ravindranath, G. Barro, D. Ceverino, A. Dekel, S. M. Faber, J. J. Fang, A. M. Koekemoer, K. Noeske, M. Rafelski, and A. Straughn, ApJ 800, 39 (2015), arXiv:1410.7398 .
- Elmegreen et al. (2007) D. M. Elmegreen, B. G. Elmegreen, S. Ravindranath, and D. A. Coe, ApJ 658, 763 (2007), astro-ph/0701121 .
- Noguchi (1998) M. Noguchi, Nature (London) 392, 253 (1998).
- Noguchi (1999) M. Noguchi, ApJ 514, 77 (1999), astro-ph/9806355 .
- Aumer et al. (2010) M. Aumer, A. Burkert, P. H. Johansson, and R. Genzel, ApJ 719, 1230 (2010), arXiv:1007.0169 .
- Baumgardt and Kroupa (2007) H. Baumgardt and P. Kroupa, MNRAS 380, 1589 (2007), arXiv:0707.1944 .
- Krumholz and Tan (2007) M. R. Krumholz and J. C. Tan, ApJ 654, 304 (2007).
- Elmegreen et al. (2008) B. G. Elmegreen, F. Bournaud, and D. M. Elmegreen, ApJ 688, 67 (2008), arXiv:0808.0716 .
- Elmegreen et al. (2013) B. G. Elmegreen, D. M. Elmegreen, J. Sánchez Almeida, C. Muñoz-Tuñón, J. Dewberry, J. Putko, Y. Teich, and M. Popinchalk, ApJ 774, 86 (2013), arXiv:1308.0306 .
- Garland et al. (2015) C. A. Garland, D. J. Pisano, M.-M. Mac Low, K. Kreckel, K. Rabidoux, and R. Guzmán, ApJ 807, 134 (2015), arXiv:1506.04649 .
- Mandelker et al. (2017) N. Mandelker, A. Dekel, D. Ceverino, C. DeGraf, Y. Guo, and J. Primack, Mon. Not. Roy. Astron. Soc. 464, 635 (2017), arXiv:1512.08791 [astro-ph.GA] .
- Kravtsov et al. (2004) A. V. Kravtsov, O. Y. Gnedin, and A. A. Klypin, ApJ 609, 482 (2004), astro-ph/0401088 .
- White and Frenk (1991) S. D. M. White and C. S. Frenk, ApJ 379, 52 (1991).
- Croton et al. (2006) D. J. Croton, V. Springel, S. D. M. White, G. De Lucia, C. S. Frenk, L. Gao, A. Jenkins, G. Kauffmann, J. F. Navarro, and N. Yoshida, MNRAS 365, 11 (2006), astro-ph/0508046 .
- Chabrier (2003) G. Chabrier, PASP 115, 763 (2003), astro-ph/0304382 .
- Martizzi et al. (2012b) D. Martizzi, R. Teyssier, and B. Moore, MNRAS 420, 2859 (2012b), arXiv:1106.5371 [astro-ph.CO] .
- Booth and Schaye (2009) C. M. Booth and J. Schaye, Monthly Notices of the Royal Astronomical Society 398, 53 (2009).
- Cattaneo et al. (2006) A. Cattaneo, A. Dekel, J. Devriendt, B. Guiderdoni, and J. Blaizot, MNRAS 370, 1651 (2006), astro-ph/0601295 .
- Martizzi et al. (2013) D. Martizzi, R. Teyssier, and B. Moore, MNRAS 432, 1947 (2013), arXiv:1211.2648 .
- Klypin et al. (2011) A. A. Klypin, S. Trujillo-Gomez, and J. Primack, ApJ 740, 102 (2011), arXiv:1002.3660 .
- Benson (2012) A. J. Benson, New Astronomy 17, 175 (2012), arXiv:1008.1786 .
- Gnedin and Zhao (2002) O. Y. Gnedin and H. Zhao, MNRAS 333, 299 (2002), astro-ph/0108108 .
- Di Cintio et al. (2014b) A. Di Cintio, C. B. Brook, A. A. Dutton, A. V. Macciò, G. S. Stinson, and A. Knebe, Mon. Not. Roy. Astron. Soc. 441, 2986 (2014b), arXiv:1404.5959 [astro-ph.CO] .