AnomalyMaxQ: Anomaly-Structured Maximization to Query in Attributed Networks
Abstract
The detection of anomaly subgraphs naturally appears in various real-life tasks, yet label noise seriously interferes with the result. As a motivation for our work, we focus on inaccurate supervision and use prior knowledge to reduce effects of noise, like query graphs. Anomalies in attributed networks exhibit structured-properties, e.g., anomaly in money laundering with “ring structure” property. It is the main challenge to fast and approximate query anomaly in attributed networks. We propose a novel search method: 1) decomposing a query graph into stars; 2) sorting attributed vertices; and 3) assembling anomaly stars under the root vertex sequence into near query. We present AnomalyMaxQ and perform on 68,411 company network (Tianyancha dataset), 7.72m patent networks (Company patents) and so on. Extensive experiments show that our method has high robustness and fast response time. When running the patent dataset, the average running time to query the graph once is about 252 seconds. 00footnotetext: * The corresponding author is Nannan Wu.
1 Introduction
In recent years, high-impact applications, e.g., business investing activities, patent co-author relationships Sun and Luo (2020), cheminformatics Han et al. (2019), and complex network Willett et al. (1998); Yang and Sze (2007), are naturally represented as attributed networks Rivero and Jamil (2017). Anomaly detection in attributed networks has attracted much more attention among users in research and industry fields. In supervised learning scenarios, deep learning typically requires a vast number of training data with accurate labels to obtain good performance Goodfellow et al. (2016). Nonetheless, for a company, such data is barely acquirable due to artificial compilation. Users usually have the prior knowledge to anomalies, e.g., anomaly in money laundering exhibiting with “ring structure”. Given the ring-query graph, users aim to identify the most anomaly subgraph with the ring structure in attributed networks. In this paper, our target is to present a method that can identify anomaly subgraph isomorphism to the query graph approximately in weak supervision setting using prior knowledge.
Example of investment risk anomaly query. We consider one company as one node and the investment relationship (i.e., the company invested in the company ) as one edge . Each node has the attributes (e.g., investment volume, number of accusations or charges, number of contract disputes). We first build the business attributed networks where , , represent the node set, edge set, and the attribute set.
Then the user has the prior knowledge to ring anomaly-structured investment relationship. We assume the three unknown companies have the investment relationship . We take , and denote as investment volume of the company at the time , and as the average investment volume of over a period of time . Given the subgraph and the function , we have if , and otherwise. These investment structures may be money laundering groups. We are target for the investment risk anomaly in the problem (1)
| (1) |
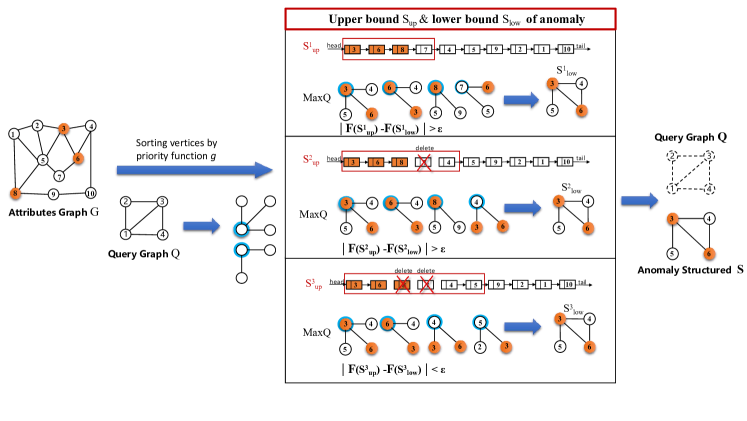
where represents is a subgraph of , and represents is approximate isomorphic to . We can observe that the optimization to and is NP-hard problem. In this paper, we employ two approaches to relax the hard problem: (1) is relaxed to select the top vertices from the sorted as the upper bound of anomaly; and (2) is relaxed to where decomposes and as a sequence of “star” like graphs. We assemble stars into as the lower bound of anomaly.
For the two approaches, we iteratively update the upper bound and lower bound of the anomaly to achieve the most anomaly-structured maximization to the query graph. We develop the algorithm AnomalyMaxQ, which can be applied to bioinformatics and cheminformatics fields.
Related work. Anomaly detection assumes that outliers and normal nodes are generated from different distributions. There are two kinds of anomaly detection methods, including parameterized scanning statistics and non-parametric graph scan (NPGS) statistics Akoglu et al. (2014); Liu et al. (2018); Wu et al. (2019a); Sun et al. (2020). Our work on NPGS, which no longer required assumption of specific forms of node distribution. Existing subgraph matching work can be grouped exact matching methods Yan et al. (2004); He and Singh (2006); Jiang et al. (2007) and inexact matching methods Liu et al. (2019). we propose an algorithm mainly focus on approximate subgraph matching on the large data graph Bhattarai et al. (2019); Lai et al. (2019).
The main contributions of this paper are summarized as follows:
-
•
Linear-time algorithm. A novel algorithm is proposed to fast identify anomaly subgraph isomorphism to the query approximately.
-
•
Performance. Extensive experiments on several benchmark datasets demonstrate that the algorithm performs better than the representative methods for this task on both accuracy and run time.
-
•
Scalability. Our proposed algorithm is suitable for optimization of a variety of graph scan statistics, which satisfy liner time subset scanning property.
2 Methodology
2.1 Problem Formulation
| Symbols | Description |
|---|---|
| an attributed network | |
| a specific shape query graph | |
| a subgraph of | |
| the node attributes | |
| the graph-structure model | |
| the differentiable score funtion | |
| the minimum graph edit distance between and |
Notation. First, we briefly review the terminologies that we will use in this paper. Table 1 lists commonly used symbols in this paper. We use italic uppercase letters to denote sets (e.g., ). The bold uppercase letters are matrices (e.g., ), and the bold lowercase letters are vectors (e.g., ). In this paper, calligraphic letters are networks 111network and graph can be used interchangeably.. An attributed network consists of: (1) the vertex set ; (2) the edge set , where ; (3) the vertex attributes , where the row vector is the attribute values observed within the time span for the vertex . For the node subset , keeps row vectors only in the set . We define subgraph of as if and is restricted from . Let be a query graph.
We refer to as a “priority function”. The score function and priority function satisfy the Linear Time Subset Scanning (LTSS) property Neill (2012) if and only if:
| (2) |
If is already sorted by priority with its record data, this property allows us to maximize in time. Otherwise, we must first sort the records by priority, which requires time.
Problem: Anomaly-Structured Maximization (ASM) Given an attributed network , and the anomaly-structured query graph , we maximize the score function over all subgraphs in attributed networks:
| (3) |
where can employ score functions that satisfy the LTSS property, e.g., Kulldorff’s (KULL) original spatial scan statistic, Expectation-based Poisson (EBP) scan statistic.
2.2 AnomalyMaxQ
The overall idea of this method is to iterate the subgraphs of upper and lower bounds in Algorithm 1.
First (Root Selection, Line 1), AnomalyMaxQ evaluates the matching priority of vertices based on their empirical p-values. Second (Upper-Bound Structure Construction, Lines 3-6), a dynamic filtering and refinement strategy is used to maximizing score function of attribute graph . Finally (Lower-Bound Structure Construction, Line 7), AnomalyMaxQ searches Lower Bound Graph Structure according to the graph edit distance from the query graph to return the approximate optimal results which have the least loss function cost. In the remaining of this section, we highlight each of these three steps.
Root selection. Given an attribute graph , we first select root vertices to start the matching process, where is the number of nodes in query graph . We would choose nodes which (1) have as few candidates as possible, and (2) have most anomaly vertices. For example, in Figure 1, we can choose as the root. Upper-bound of anomaly. It consists of two parts: 1) reserve the previous vertex set , and 2) add next new vertices. We get the vertex set , which is the upper bound score of anomaly without structure property. We must select vertex not computed to ensure will not get stuck in an infinite loop. Lower-bound of anomaly. We consider as root to select star subgraphs, which are isomorphic to stars in the query graph. The matched stars are assembled into one subgraph which are approximate to the query.
2.3 Theoretical analysis
Spatial complexity analysis. In each iteration for numerical conjunctive stars Zhao et al. (2020a), we only keep and in step 6 of Algorithm 1. The space complexity of AnomalyMaxQ is . The size of two subsets is determined by the number of nodes of query graph .
Time complexity analysis. The time complexity of the algorithm is mainly determined by MaxQ in step 7. MaxQ matches the subgraph of each node and its neighbors in with the decomposed query graph to calculate the largest isomorphic part. According to the worst case, the decomposed query graph can have kinds of neighbors, so each node in has matching methods at most. In general, the time complexity of the algorithm is .
3 Experiments on Real Datasets
3.1 Experiment Design
To verify the performance of AnomalyMaxQ approach, we conducted experiments on large-scale artificial toy data and real datasets.
Internet Traffic Network.222The company has more than 0.6 billion users. The real-world *edu.cn network dataset consists of 8,540,966 web sites browsing logs from May 31, 2014 to May 13, 2015. The network with 31,238 vertices and 118,708 edges was built from the browsing logs (i.e., the edge (IP site A, IP site B) denotes that A visited B). The p-value of vertices are under 0.15 if they were attacked, otherwise were not. For testing the robustness of methods, we flipped p-values of percent nodes randomly. Tianyancha Dataset.333Downloaded from https://www.tianyancha.com/ This graph has 68K nodes, each representing an enterprise in Tianjin. An edge represents the investment relationship between two entities. It contains 54 Tags, such as investing information, legal disputes, etc. Company Patents.444Downloaded from http://www.wanfangdata.com.cn/ There are 7.72m nodes and 1.87m edges among them. The patent dataset includes the patent information in China from 1990 to 2020. We consider each inventor and company as a node. Thus an edge represents connection between the inventor and his company. Respiratory Emergency Department (ED) Dataset. We simulate respiratory medical record data sets with different number of nodes, which is ,,,, respectively Wu et al. (2017); Zhao et al. (2020b). The sparsity setting of the graph is 0.4.
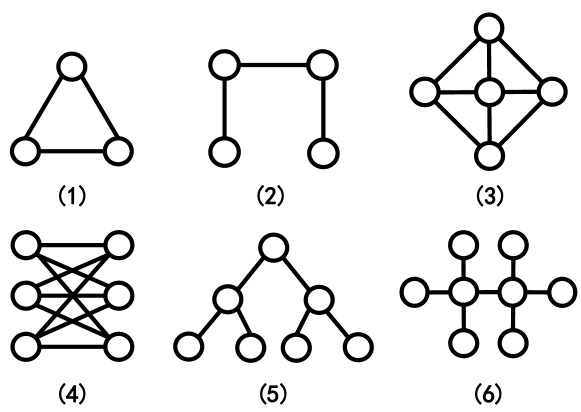
Query-map Setting. We set six query graphs in Figure 2 for each group of data through the work of others. Other graphs can be made up of these basic shapes or close to them. These query graphs can be replicated as hundreds of nodes. We use different shape constraint subgraph to try to find out the anomaly form of the data set. Specifically, Figures 2(1) is a ring-shaped network Zou et al. (2007); Sun et al. (2012b), which represents a state that anomaly subgraphs are interconnected; Figure 2(2) is a linear network graph Wu et al. (2019b), representing the incident effect point to point, like Water Pollution Cases; Figure 2(3),(6) are star-shaped subgraphs Wu et al. (2017) denote that a node infects its neighbors, then the infection from one star-shaped area to another neighbor. Figure 2(4) is a bipartite graph Wu et al. (2017), which means a case of many-to-many communication. And Figure 2(5) is a tree-shaped graph Taha and Yoo (2015); Han et al. (2013) for detecting anomaly subgraphs have a superior-subordinate relationship in the group.
| Dataset | Graph | size | ||
|---|---|---|---|---|
| Computer Access | node | IP Address | 31,238 | |
| link | Attack/Access | 118,708 | ||
| Tianyancha | node | Company | 68,411 | |
| link | Investment relationship | 151,591 | ||
| Company Patents | node | Inventor/Company | 7,729,373 | |
| link | Coauthor/Affiliation | 1,875,139 | ||
| ED Dataset | node | Address | 1,000,000 | |
| link | Contiguous area | 3,996,000 | ||
3.2 Methods
Our Method. As mentioned in Section 3, our method performs subgraph matching in three steps: 1) query decomposition, 2) select the candidate nodes and construct upper bound and lower bound structure, and 3) calculate the graph edit distance between the subgraph and the query graph. Query graph employs the nonparametric scan statistic BJ Berk and Jones (1979) and HC Donoho and Jin (2004) as the objective function to detect specific shape attack subgraphs in the real networks. When the score of upper and lower limits is less than the threshold, the output result finally gets anomaly structured.
Comparative Methods. Several different techniques have been developed for anomaly detection in many real world scenarios, including TSPSD Wu et al. (2016), Graph-TPP Wu et al. (2017), Query-map Wu et al. (2019b) and so on. The baselines are designed for specific shape anomaly discovery in attributed graphs. Source codes of the baseline methods are provided by the original authors. We followed strategies recommended by them to adjust the related model parameters. The algorithm TSPSD is designed in a nonparametric statistical framework, and the specification of parameters are hence relatively straightforward. We set and the number of seed entities to 0.15 and 5 respectively. TSPSD chooses Steiner Tree heuristics for output. Because of it consider just the connected subgraph anomaly without the specific shape anomaly prior. Therefore, we find the subgraphs that are most similar to the query graph for comparison with others.
Performance metrics. We use the following performance metrics: 1) precision. We compute precision of our result, i.e. the ratio of the number of correct anomalous nodes and the number of nodes. The recall metric is ignored for computing as target subgraphs return fixed size of nodes. 2) running time. The optimization power of our method can be examined in the iteration of graph scan statistics scores. We compare it with baseline methods on running times.
3.3 Experiment Results
| Methods | ||||||
|---|---|---|---|---|---|---|
| AnomalyMaxQ(BJ) | (1.00, 0.67, 0.67) | (1.00, 0.50, 0.75) | (1.00, 0.80, 0.70) | (0.83, 0.67, 0.67) | (0.71, 0.57, 0.71) | (1.00, 0.63, 0.72) |
| AnomalyMaxQ(HC) | (1.00, 0.67, 0.67) | (1.00, 0.50, 0.50) | (1.00, 0.80, 0.70) | (0.83, 0.67, 0.67) | (0.71, 0.57, 0.57) | (1.00, 0.63, 0.72) |
| TSPSD(BJ) | (0.33, 0.33, 0.50) | (0.25, 0.25, 0.38) | (0.20, 0.20, 0.30) | (0.17 ,0.17, 0.25) | (0.14 ,0.14, 0.21) | (0.12 ,0.12, 0.19) |
| TSPSD(HC) | (0.33, 0.67, 0.33) | (0.25, 0.50, 0.25) | (0.20, 0.40, 0.20) | (0.17 ,0.33, 0.17) | (0.14 ,0.33, 0.31) | (0.12 ,0.25, 0.25) |
| Graph-TPP | (0.50, 0.50, 0.55) | (0.62, 0.62, 0.41) | (0.20, 0.20, 0.46) | (0.58, 0.58, 0.61) | (0.57, 0.57, 0.47) | (0.43, 0.50, 0.58) |
| Query-map | (0.50, 0.50, 0.33) | (0.83, 0.75, 0.83) | (0.27, 0.20, 0.46) | (0.58, 0.58, 0.46) | (0.57, 0.57, 0.47) | (0.43, 0.50, 0.58) |
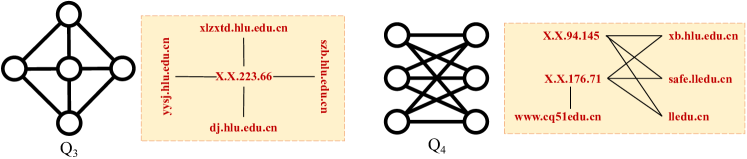
We tested our method AnomalyMaxQ on Internet Traffic Dataset for the star and bipartite-shaped attack patterns. Our algorithm often better able to make connections that were hidden in the jumble of information. Although these IP addresses appear in different places and periods, their attack behaviors are similar. AnomalyMaxQ can obtain some abnormal IP groups by querying specific attack patterns, such as star and bipartite-shaped graph. Our methods successfully discovered the cyber-attack networks without innocent nodes. Star-shaped attacks. As illustrated in Figure 3, we can see clearly that two attack cases were found by star query graph. On March 10, 2015, AnomalyMaxQ found the client X.X.223.66 attacked the other server sites yysj.*.edu.cn and szb.*.edu.cn; however, the server site www.*.edu.cn was attacked by four clients on March 12, 2015, different from the last one. These network attack patterns are the most common forms in the network. Bipartite-shaped attacks. Figure 3 shows AnomalyMaxQ detected some cyber-attack networks. Because attackers often do not use only a single IP address for cyber-attacks. Compared with the star subgraph, we can discover attack group in the meantime. By recording these IP addresses, we find that these IP addresses come from multiple fixed network segments, and the attack mode and location remain unchanged, which means that these IP addresses may come from the same attack source. With this information, we can prevent attacks by blocking the IP of these fixed IP segments.
Precision for target subgraphs detection. We randomly selected the average accuracy of two days as a result. Table 3 shows the results of subgraph isomorphism search performance using specific shape query graphs for the Internet traffic dataset. We present a comparison of precision for methods under different noise conditions in detail. At 5% noise level, our proposed AnomalyMaxQ (i.e., and ) achieved higher precision (close to 1) than competitive baselines (close to 0.7). Moreover, even at 20% noise level, it achieved at least 0.70 precision, and baselines achieved the best precision to 0.50.
3.4 Case Study
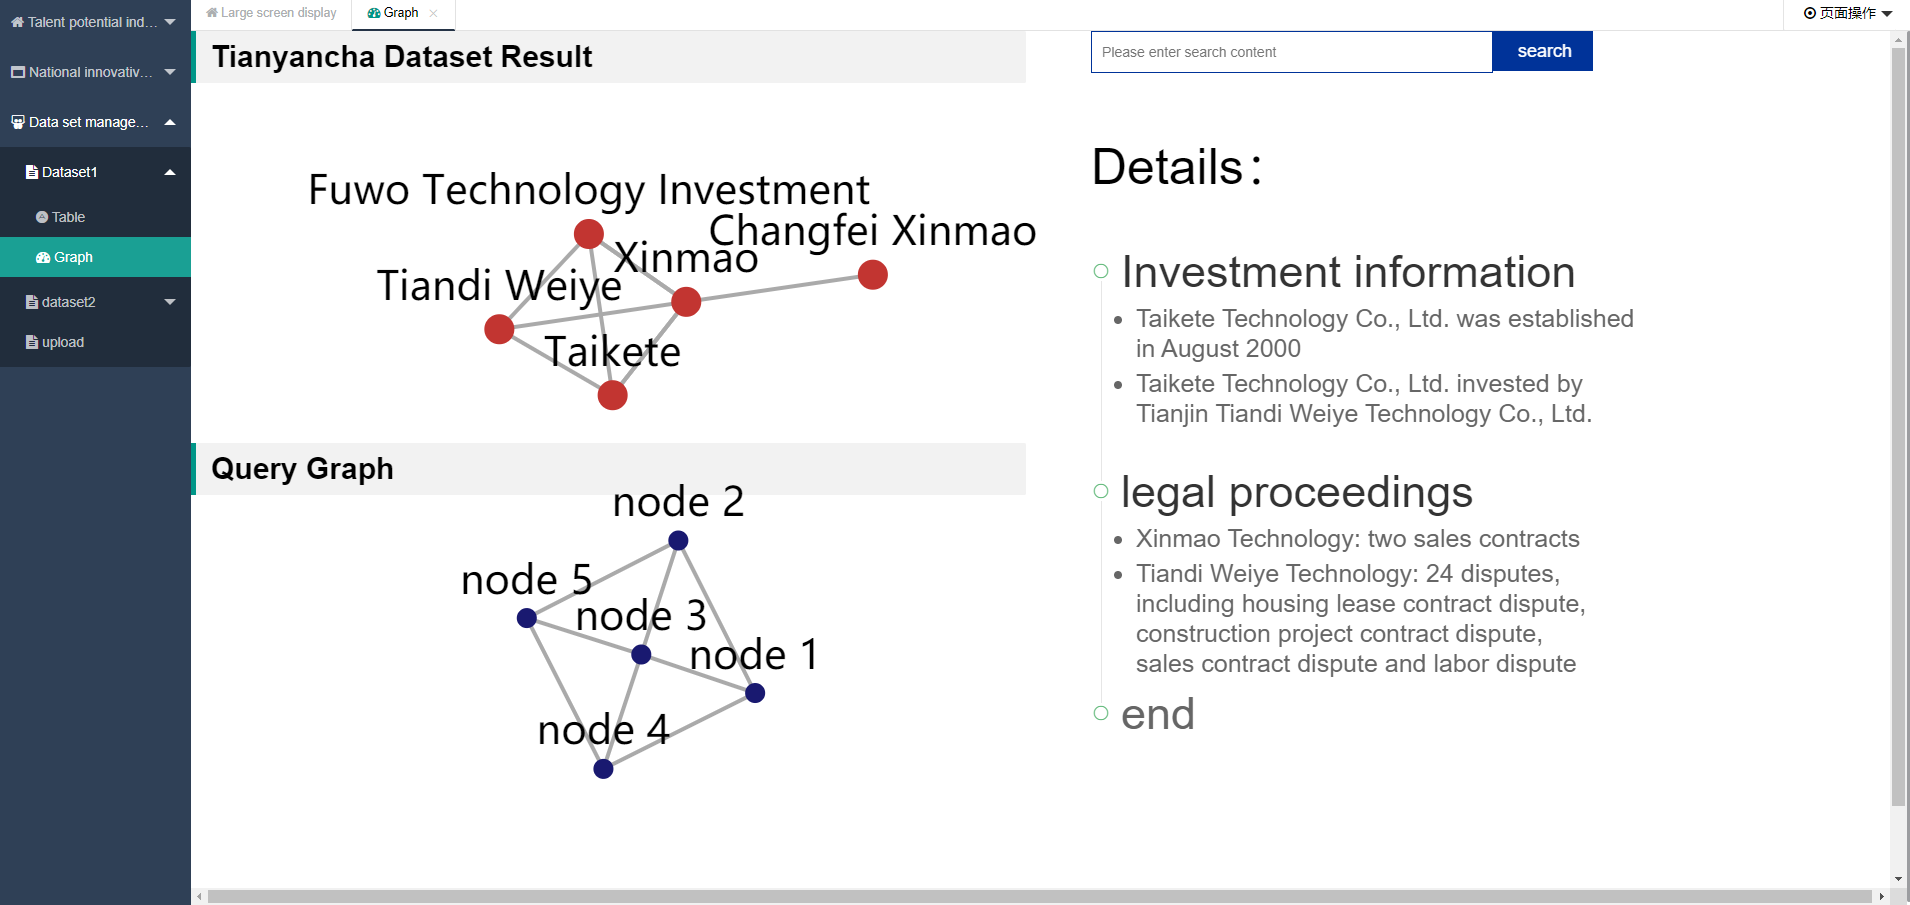
Investment decision support. Cross shareholding would inflated capital or evade tax. Figure 4 shows the results on Tianyancha dataset, including five enterprises. According to the dataset, we can see that Taikete was established in August 2000 and invested by Tiandi Weiye; Fuwo established in December 2001 and invested by Taikete and Tiandi Weiye; Xinmao was established in July 2016, then other companies invested in it. We also examined the legal risks of these companies. Xinmao is involved in two sales contract disputes, both of which are defendants. Tiandi Weiye involves total of 24 disputes, include housing rental contract disputes, construction project contract disputes, sales contract disputes, labor disputes and so on. Last but not least, as the defendant, Changfei Xinmao was also charged with seven labor disputes.
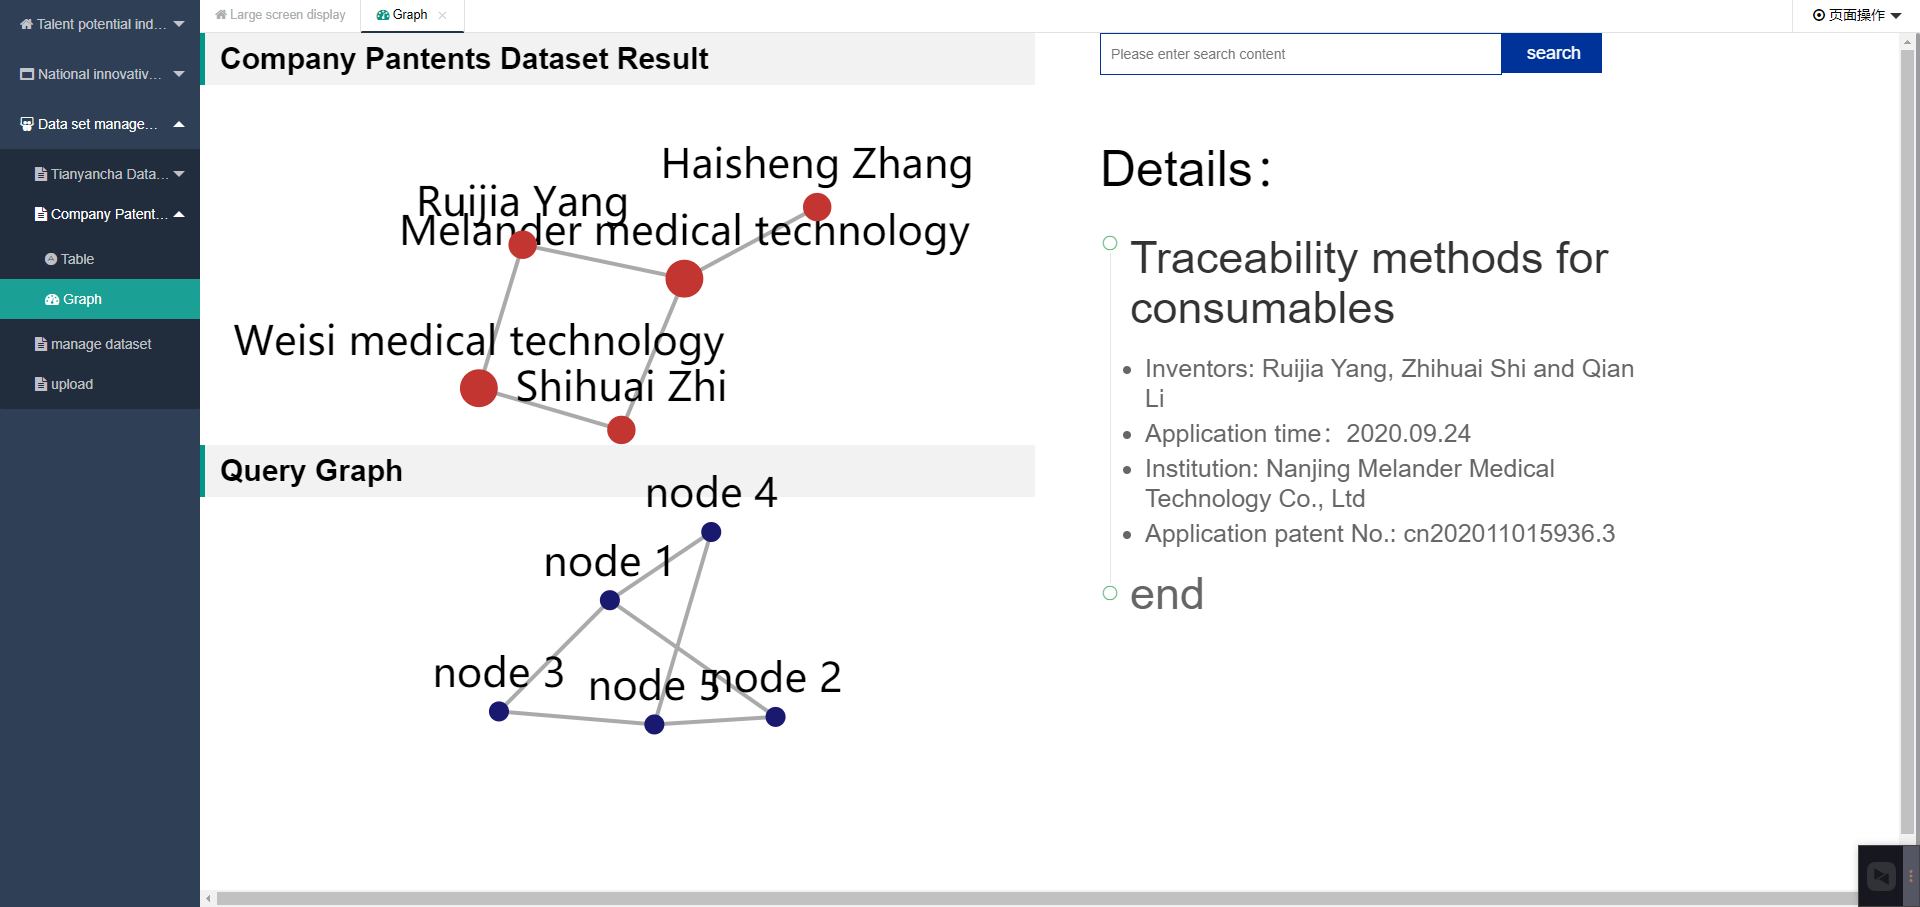
Business Competition Forecast. After calculation, we find that Nanjing Melander Medical Technology Company and Nanjing Weisi Medical Technology Company are consistent with our query graph pattern. Melander is prosecuted by Weisi, whose employees hopping to Melander. There is an identified competitive relationship between the two companies. Through China’s judicial document website, we find that there is more than one patent dispute lawsuit between two companies. Melander was sued for its patent content (No.: 201320752362.7) was as same as the research of Weisi.
3.5 Running Time Analysis
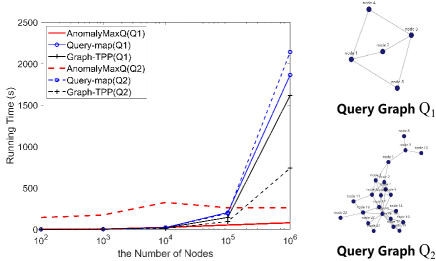
In this part, we compare the running time of our algorithm with that of “Graph-TPP” and “Query-Map” Wu et al. (2017, 2019b). Although TSPSD runs very fast, the precision is not satisfactory. The dataset is a simulated ED Dataset. We set up two query graphs, has five nodes, and has 22 points and 92 edges Sun et al. (2012a). The results show that our proposed method always ran faster than all the baseline methods. On the other hand, the number of nodes and edges in the query graph is more influential than attributes graph.
4 Conclusion
In this paper, we introduce AnomalyMaxQ that is capable of predicting business risks and assisting investment decisions. A large number of experiments show that our algorithm has good scalability and fast computing speed, and it only needs 90 seconds response time to run on 7.72m nodes. In the future work, we will use multi-dimensional data to generate query graphs automatically.
5 Acknowledgments
This work was supported by National Key RD Program of China (No.2018YFC0832103), partly supported by NSFC (No.61902279), and China Postdoctoral Science Foundation (No.2019M650048).
References
- Akoglu et al. [2014] Leman Akoglu, Hanghang Tong, and Danai Koutra. Graph-based anomaly detection and description: A survey. Data Mining and Knowledge Discovery, 29, 04 2014.
- Berk and Jones [1979] Robert H. Berk and Douglas H. Jones. Goodness of fit test statistics that dominate the kolmogorov statistics. Probability Theory & Related Fields, 47(1):47–59, 1979.
- Bhattarai et al. [2019] Bibek Bhattarai, Hang Liu, and H. Howie Huang. Ceci: Compact embedding cluster index for scalable subgraph matching. In Proceedings of the 2019 International Conference on Management of Data, SIGMOD ’19, page 1447–1462, New York, NY, USA, 2019.
- Donoho and Jin [2004] David Donoho and Jiashun Jin. Higher criticism for detecting sparse heterogeneous mixtures. The Annals of Statistics, 32(3), 2004.
- Goodfellow et al. [2016] Ian Goodfellow, Yoshua Bengio, and Aaron Courville. Deep Learning. MIT Press, 2016. http://www.deeplearningbook.org.
- Han et al. [2013] Wook-Shin Han, Jinsoo Lee, and Jeong-Hoon Lee. Turboiso: towards ultrafast and robust subgraph isomorphism search in large graph databases. In Proceedings of the 2013 ACM SIGMOD International Conference on Management of Data, pages 337–348, 2013.
- Han et al. [2019] Myoungji Han, Hyunjoon Kim, Geonmo Gu, Kunsoo Park, and Wook-Shin Han. Efficient subgraph matching: Harmonizing dynamic programming, adaptive matching order, and failing set together. In Proceedings of the 2019 International Conference on Management of Data, SIGMOD ’19, page 1429–1446, New York, NY, USA, 2019.
- He and Singh [2006] Huahai He and A.K. Singh. Closure-tree: An index structure for graph queries. volume 0, pages 38– 38, 2006.
- Jiang et al. [2007] Haoliang Jiang, Haixun Wang, Philip Yu, and Shuigeng Zhou. Gstring: A novel approach for efficient search in graph databases. pages 566–575, 05 2007.
- Lai et al. [2019] Longbin Lai, Zhu Qing, Zhengyi Yang, Xin Jin, Zhengmin Lai, Ran Wang, Kongzhang Hao, Xuemin Lin, Lu Qin, Wenjie Zhang, Ying Zhang, Zhengping Qian, and Jingren Zhou. Distributed subgraph matching on timely dataflow. Proc. VLDB Endow., 12(10):1099–1112, June 2019.
- Liu et al. [2018] Wen Liu, Weixin Luo, Dongze Lian, and Shenghua Gao. Future frame prediction for anomaly detection–a new baseline. In Proceedings of the IEEE Conference on Computer Vision and Pattern Recognition, pages 6536–6545, 2018.
- Liu et al. [2019] Lihui Liu, Boxin Du, Jiejun Xu, and Hanghang Tong. G-finder: Approximate attributed subgraph matching. In 2019 IEEE International Conference on Big Data (Big Data), 2019.
- Neill [2012] D. B. Neill. Fast subset scan for spatial pattern detection. Journal of the Royal Statistical Society, Series B. Statistical Methodology, 2012.
- Rivero and Jamil [2017] Carlos R Rivero and Hasan M Jamil. Efficient and scalable labeled subgraph matching using sgmatch. Knowledge and Information Systems, 51(1):61–87, 2017.
- Sun and Luo [2020] S. Sun and Q. Luo. Subgraph matching with effective matching order and indexing. IEEE Transactions on Knowledge and Data Engineering, pages 1–1, 2020.
- Sun et al. [2012a] Z. Sun, H. Wang, H. Wang, B. Shao, and J. Li. Efficient subgraph matching on billion node graphs. Proceedings of the Vldb Endowment, 5(9):788–799, 2012.
- Sun et al. [2012b] Zhao Sun, Hongzhi Wang, Haixun Wang, Bin Shao, and Jianzhong Li. Efficient subgraph matching on billion node graphs. arXiv preprint arXiv:1205.6691, 2012.
- Sun et al. [2020] Ying Sun, Wenjun Wang, Nannan Wu, Wei Yu, and Xue Chen. Anomaly subgraph detection with feature transfer. In Mathieu d’Aquin, Stefan Dietze, Claudia Hauff, Edward Curry, and Philippe Cudré-Mauroux, editors, CIKM ’20: The 29th ACM International Conference on Information and Knowledge Management, Virtual Event, Ireland, October 19-23, 2020, pages 1415–1424. ACM, 2020.
- Taha and Yoo [2015] Kamal Taha and Paul D Yoo. Siimco: A forensic investigation tool for identifying the influential members of a criminal organization. IEEE Transactions on Information Forensics and Security, 11(4):811–822, 2015.
- Willett et al. [1998] Peter Willett, John M. Barnard, and Geoffrey M. Downs. Chemical similarity searching. jchem inf comput sci. Journal of Chemical Information & Modeling, 38(6):983–996, 1998.
- Wu et al. [2016] Nannan Wu, Feng Chen, Jianxin Li, Baojian Zhou, and Naren Ramakrishnan. Efficient nonparametric subgraph detection using tree shaped priors. In Proceedings of the AAAI Conference on Artificial Intelligence, volume 30, 2016.
- Wu et al. [2017] Nannan Wu, Feng Chen, Jianxin Li, Jinpeng Huai, and Bo Li. Query-driven discovery of anomalous subgraphs in attributed graphs. pages 3105–3111, 08 2017.
- Wu et al. [2019a] Nannan Wu, Feng Chen, Jianxin Li, Jinpeng Huai, Baojian Zhou, Bo Li, and Naren Ramakrishnan. A nonparametric approach to uncovering connected anomalies by tree shaped priors. IEEE Trans. Knowl. Data Eng., 31(10):1849–1862, 2019.
- Wu et al. [2019b] Nannan Wu, Wenjun Wang, Feng Chen, Jianxin Li, Bo Li, and Jinpeng Huai. Uncovering specific-shape graph anomalies in attributed graphs. Proceedings of the AAAI Conference on Artificial Intelligence, 33:5433–5440, 07 2019.
- Yan et al. [2004] Xifeng Yan, Philip Yu, and Jiawei Han. Graph indexing: A frequent structure-based approach. Proceedings of the ACM SIGMOD International Conference on Management of Data, 06 2004.
- Yang and Sze [2007] Qingwu Yang and Sing Hoi Sze. Path matching and graph matching in biological networks. Journal of Computational Biology, 14(1):56–67, 2007.
- Zhao et al. [2020a] Liang Zhao, Feng Chen, and Yanfang Ye. Efficient learning with exponentially-many conjunctive precursors for interpretable spatial event forecasting. IEEE Trans. Knowl. Data Eng., 32(10):1923–1935, 2020.
- Zhao et al. [2020b] Liang Zhao, Jiangzhuo Chen, Feng Chen, Fang Jin, Wei Wang, Chang-Tien Lu, and Naren Ramakrishnan. Online flu epidemiological deep modeling on disease contact network. GeoInformatica, 24(2):443–475, 2020.
- Zou et al. [2007] Lei Zou, Lei Chen, and Yansheng Lu. Top-k subgraph matching query in a large graph. pages 139–146, 01 2007.