X
Diagnosis of Acute Myeloid Leukaemia Using Machine Learning
Abstract
We train a machine learning model on a dataset of 2177 individuals using as features 26 probe sets and their age in order to classify if someone has acute myeloid leukaemia or is healthy. The dataset is multicentric and consists of data from 27 organisations, 25 cities, 15 countries and 4 continents. The accuracy or our model is 99.94% and its F1-score is 0.9996. To the best of our knowledge the performance of our model is the best one in the literature, as regards the prediction of AML using similar or not data. Moreover, there has not been any bibliographic reference associated with acute myeloid leukaemia for the 26 probe sets we used as features in our model.
1 Introduction
Acute myeloid leukaemia (AML) [1] is often characterized by non detectable early symptoms and its quick prognosis, even in an intensive care unit could have a huge impact on the overall survival [2]. The use of machine learning can be helpful on the diagnosis of this disease and therefore in the creation of a screening tool [3], [4]. Here we focus on the primary diagnosis of AML using the minimum number of probe sets possible in order to achieve excellent performance. In addition, we use the age as feature to our final model since its prognostic value is high regarding the survival of patients with AML [5]. Another reason we include the age is that from deep learning work in radiology, in particular in ultrasound with even small data sets of 100 data instances [6], [7], and with CatBoost [8] using features coming from different sources we can achieve high performance in binary classification problems both on sensitivity and specificity.
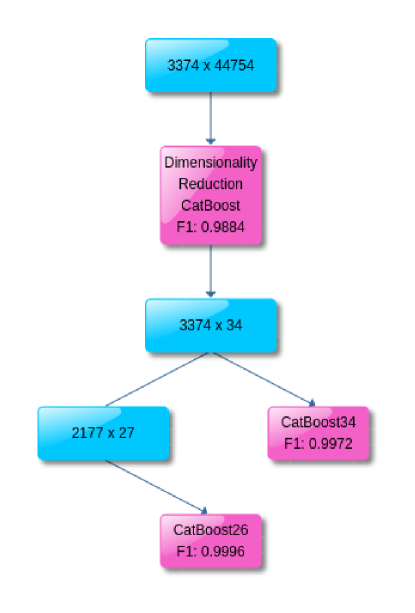
We first tune a CatBoost [9] on a curated publicly available Affymetrix microarray gene expression and normalized batch corrected dataset consisted of probe sets of 3374 individuals [3], in order to classify if an individual has AML or is healthy. CatBoost library offers the option to return the set of features’ importance of CatBoost algorithm and also the set of features’ importance of the loss function change. The above two sets can differ.
We keep the 100 most important features for each of the above two sets and then we take the intersection of these which consists of 34 probe sets. The idea of intersection comes from the fact that we would like to include features of high importance regarding the predictability of CatBoost algorithm and at the same time its loss function change during the training process.
We randomly split the dataset of the 34 probe sets and the 3374 data instances using 80% for training and 20% for validation. We use 10 fold cross validation (10CV) [10] in order to tune a CatBoost on the training set, and then we validate it on the test set.
From these 34 probe sets we keep only those for which we cannot find any bibliographic reference regarding their correlation to AML, Table 9. The only correlated to AML feature we include in our final machine learning model is the age of each individual.
We randomly split the dataset of 2177 individuals using 80% for training and 20% for validation. We use 10CV in order to tune the CatBoost on the training set, and then we validate it on the test set.
In Figure 1 we show diagram of the three models and the corresponding datasets of our approach.
2 Models
The dimensionality reduction CatBoost model has 200 iterators, depth 6 and learning rate 0.1. We randomly split the initial dataset of 3374 data instances and 44754 probe sets. The performance of the tuned model appears in Table 1.
| Metrics | Validation Set | 10CV |
|---|---|---|
| Spec. | 0.9929 | 0.9805 |
| Sens. | 1.0000 | 0.9991 |
| AUC | 0.9965 | 0.9898 |
| F1-score | 0.9964 | 0.9884 |
| Metrics | Validation Set | 10CV |
|---|---|---|
| Spec. | 1.0000 | 0.9929 |
| Sens. | 1.0000 | 0.9926 |
| AUC | 1.0000 | 0.9920 |
| F1-score | 1.0000 | 0.9972 |
We compute the intersection of the sets of the most important features, regarding the predictability of CatBoost, and the most important features regarding the loss function change during the training process. We set the number of elements of each set to be 100. The intersection has only 34 probe sets. We tune a CatBoost model (CatBoost34) of 200 iterators, depth 5 and learning rate 0.1 on the dataset of 3374 data instances. The results in Table 2 show that using only 34 probe sets our machine learning model is able to achieve great performance.
From the 34 probe sets we exclude all which are correlated from bibliographic references to AML so we keep only the 26 probe sets of Table 9. The tuned CatBoost model which we use for the diagnosis of AML (CatBoost26) has 100 iterators and depth 11 with learning rate 0.1.
In all three models above we use the weight balance parameters of CatBoost library since our datasets are imbalanced. Moreover, we keep all the other parameters of them similar to the default values provided by CatBoost library.
3 Data
The initial dataset is a curated publicly available Affymetrix microarray gene expression one and it consists of 34 datasets derived from 32 studies [3]. It is an international multicentric dataset since its data instances come from 27 organisations, 25 cities, 15 countries and 4 continents. The data come from different transcriptomic platforms: Affymetrix Human Genome U133 Plus 2.0 microarray, Affymetrix Human Genome U133A microarray and Affymetrix Human Genome U133B microarray.
At first, the dataset consisted of 44754 probe sets and 3374 data instances which corresponded to 3374 individuals. From the 3374 data instances 2668 (79.08%) were labelled as AML and 706 (20.92%) as healthy.
The dimensionality reduction tuned model is applied on this dataset. We keep the 26 probe sets of the 34 {227923_at, 212549_at, 219386_s_at, 207754_at, 208022_s_at, 209543_s_at, 210244_at, 207206_s_at, 210789_x_at, 239766_at, 241688_at, 244719_at, 236952_at, 241611_s_at, 217901_at, 229963_at, 230527_at, 222312_s_at, 214705_at, 203294_s_at, 209603_at, 243659_at, 230753_at, 204777_s_at, 234632_x_at, 217680_x_at, 219513_s_at, 214719_at, 211772_x_at, 207636_at, 243272_at, 214945_at, 226311_at, 242056_at} for which, to the best of our knowledge, there has not been any reference regarding their correlation to AML yet. Since we want to use also the age of the individuals as feature to our diagnostic CatBoost model, we drop-out all the data instances with no age filled-in.
The final dataset consists of 2177 data instances and it has 27 features (26 probe sets and the age). Tables 6, 7 and 8 provide detailed information about the dataset, including the number of samples used, the sample source, the sex and the age of the individuals, the organisations which provided the data, the AML subtypes and statistics about the overall survival when available, as well as the total number of AML patients and healthy individuals.
From the 2177 individuals, 1013 are female (46.53%), 943 are male (43.32%) and 221 are unknown (10.15%). In addition, 1629 are AML patients (74.83%) and 548 are healthy (25.17%). The mean and the standard deviation of age are 48.87 and 17.01, respectively. As regards the number of data instances per age group in the data set we have: 99 [0-19], 217 [20-29], 340 [30-39], 393 [40-49], 487 [50-59], 390 [60-69], 212 [70-79] and 39 [80-89].
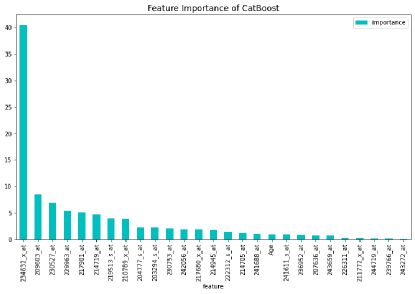
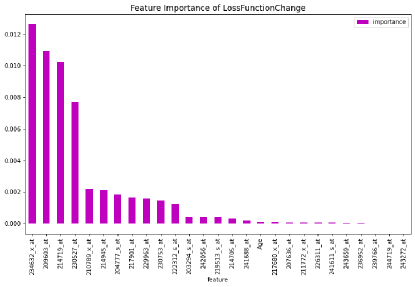
We randomly split the final dataset in two sets: training and validation (Table 6, Table 7). The training set consists of 1740 data instances (79.93%) and the validation set of the rest 437 (20.07%). Since the dataset is relatively small we use 10 fold cross validation in order to tune our model. In the Figure 2 we observe the feature importance of the 27 features as regards the predictability of the CatBoost model using the 10CV, while in the Figure 3 we can see the feature importance of the loss change for each one of the 27 features.
4 Results
At Table 3 we see that our diagnosis model, CatBoost26, performs really well. The confusion matrix, Table 4, shows the true-positives (down-right), the true-negatives (up-left), false-positives (down-left) and false-negatives (up-right). Here, a positive data instance is a data instance labelled as AML and negative as a healthy one.
| Metrics | Validation Set | 10CV |
|---|---|---|
| Spec. | 1.0000 | 1.0000 |
| Sens. | 1.0000 | 0.9992 |
| AUC | 1.0000 | 0.9988 |
| F1-score | 1.0000 | 0.9996 |
| 437 | 1 |
|---|---|
| 0 | 1302 |
The mean area under the curve (AUC) from the 10CV is 0.9988 with standard deviation 0.0023 and 95% confidence interval: . The mean accuracy is 0.9994 with standard deviation 0.0011.
From Figures 2 and 3 we observe that the probe set: 234632_x_at, which is “cDNA”, is the most important probe set as regards both, the predictability of the CatBoost and the loss function change.
Our CatBoost34 model is transcriptomic platform agnostic [11] since the label if a data instance comes either from Affymetrix Human Genome U133 Plus 2.0 microarray or the Affymetrix Human Genome U133A microarray or the Affymetrix Human Genome U133B microarray, has not been used as feature. This helps in the robustness and universality of our model’s application in the diagnosis of AML. As regards the diagnosis model CatBoost26, all the data instances comes from the Affymetrix Human Genome U133 Plus 2.0.
From Figure 2 we observe that the first 8 probe sets have the highest impact on the predictability of CatBoost26, including 6 named genes {GATA3, BEX5, DSG2, SLC46A3, SH2D3A, CEACAM3}, 1 uncharacterized gene {LOC101926907} and 1 cDNA probe set. The first probe set has remarkably high feature importance compared to the others, more than 4 times higher. To the best of our knowledge these genes have not been correlated to AML yet. The gene GATA3 has been correlated to acute lymphoblastic leukemia [52] and other types of cancer as well breast cancer [53], bladder cancer [54]; the gene DSG2 is implicated in various kinds of cancer including cervical cancer [56], epithelial-derived carcinomas [57], pancreatic cancer [58], breast cancer [59], colon cancer [60], lung cancer [61], [62], gastric cancer [63], [64], ovarian cancer [65], laryngeal cancer [66] and liver cancer [67]. In addition, SLC46A3 is correlated to liver cancer [68] and BEX5, SH2D3A, CEACAM3 have not been correlated to any type of cancer yet.
In Figure 3 we observe that the first 11 probe sets have the highest importance of loss function change of CatBoost26, including 10 named genes {GATA3, BEX5, DSG2, SLC46A3, FAM153A, FAM153B, FAM153C, PATL2, CEACAM3, MAL}, 3 uncharacterized genes {LOC101926907, LOC100507387, LOC105377751}, 1 expressed sequence tag and 1 cDNA probe set. The 234632_x_at probe set has at least 4 times higher feature importance than the 210789_x_at, while 230527_at is approximately 3 times more important feature than 210789_x_at. Moreover, the gene MAL has been correlated to gastric cancer [70], breast cancer [71], ovarian cancer [72] and colorectal cancer [73]. The genes {PATL2, FAM153A, FAM153B, FAM153C} have not been correlated to any type of cancer yet.
5 Related Work
The first machine learning approach on a subset of the dataset of 3374 individuals with the 44754 probe sets, has been done in [3]. Statistical methods have been used in order to reduce the dimensionality of the dataset, which dropped down to 984 probe sets. Here we trained the k-NN machine learning model of [3] on the same 80% train set as we did with our dimensionality reduction CatBoost model, using 10CV. The results, Table 5, shows that the dimensionality reduction CatBoost model as well as CatBoost34, outperforms k-NN (Tables 1, 2).
| Metrics | Validation Set | 10CV |
|---|---|---|
| Spec. | 0.9716 | 0.9546 |
| Sens. | 0.9925 | 0.9920 |
| AUC | 0.9821 | 0.9788 |
| F1-score | 0.9925 | 0.9899 |
Using similar to our work data of Affymetrix Human Genome U133A microarray, Affymetrix Human Genome U133 2.0 microarray and Illumina RNA-seq, different machine learning models and statistical learning techniques have been used (k-NN, LASSO, linear discriminant analysis, random forest, linear SVM, polynomial SVM, radial SVM, sigmoid SVM) in [11] in order to predict if an individual has AML or is healthy. The best results regarding the accuracy are the following: 97.6%, 98.0% and 99.1%. These results have been achieved by training and validating the LASSO algorithm on each of the Affymetrix Human Genome U133A microarray, Affymetrix Human Genome U133 2.0 microarray and Illumina RNA-seq datasets accordingly. The first dataset consisted of 2500 data instances from which 1049 (41.96%) were labelled as AML and 1451 (58.04%) as healthy. The second dataset consisted of 8348 data instances from which 2588 (31.00%) were labelled as AML and 5760 (69%) as healthy. Finally, the third dataset consisted of 1181 data instances from which 508 (43.01%) were labelled as AML and 673 (56.99%) as healthy.
The last work related directly to ours is [12] in which using microarrays a deep neural network (DNN) has been trained to classify AML from healthy individuals. The corresponding dataset consisted of only 26 data instances. DNN’s accuracy score was 96.67%.
All methods above use datasets from gene expression profiling (GEP) to diagnose AML. Another approach on different type of data like histopathology slides, using machine techniques has a been tried out but the performance of the corresponding model, as regards accuracy, is around 95% [13].
Using invariant cluster genomic signatures a machine learning approach has been developed in [14] for the classification of primary and secondary AML reaching an accuracy score of 97%.
6 Conclusion
We develop a model which using CatBoost and gene expression profiling data from Affymetrix Human Genome U133A, Affymetrix Human Genome U133B and Affymetrix Human Genome U133 2.0 is able to diagnose with the highest performance in literature if an individual has acute myeloid leukaemia or is healthy. We use CatBoost not only as a predictor to our problem, but also as a dimensionality reduction technique. In our approach both machine learning models, CatBoost34 and CatBoost26, outperform other machine learning approaches which use a variety of different classifiers and similar or different datasets.
On the clinical side, for the very first time in the literature we show that it is possible using probe sets, which have not been correlated yet to AML, and the state of the art machine learning gradient boosted tree algorithm CatBoost, to claim that we are able to diagnose AML. It would be of great importance to further investigate the role of these 26 probe sets, not only as regards the AML, but also other types of cancer. Machine learning can provide to us different insights from conventional approaches. As regards the explainability part, we hope the scientific community will use the importance of the probe sets shown in Figures 2 and 3 in order to explain further their behavior in AML. In addition, from the 26 probe sets some of them have not been yet related to known genes.
Acute myeloid leukaemia can appear suddenly to anyone. The importance of a screening tool where its sensitivity and specificity is close to 1.00, where the sample source is peripheral blood and the cost is low, it would have a tremendous impact to humanity. We hope our approach will inspire others to use machine learning in order to solve cancer problems.
Acknowledgements
We thank Michael Filippakis of University of Piraeus for his feedback and valuable discussions.
| Index | Train #Sam. & Sam. Source | % | Val. #Sam. & Sam. Source | % |
|---|---|---|---|---|
| 0 | 6 BM | 75.00% | 2 BM | 25.00% |
| 1 | 245 BM | 81.67% | 55 BM | 18.33% |
| 2 | 22 PB | 84.62% | 4 PB | 15.38% |
| 3 | 56 (52 BM & 4 PB) | 71.80% | 22 (21 BM & 1 PB) | 28.20% |
| 4 | 412 (379 BM & 33 PB) | 78.48% | 113 (103 BM & 10 PB) | 21.52% |
| 5 | 14 BM | 87.50% | 2 BM | 12.50% |
| 6 | 194 (177 BM & 17 PB) | 77.29% | 57 (54 BM & 3 PB) | 22.71% |
| 7 | 6 PB | 75.00% | 2 PB | 25.00% |
| 8 | 18 PB | 81.82% | 4 PB | 18.18% |
| 9 | 11 PB | 78.57% | 3 PB | 21.43% |
| 10 | 13 PB | 76.47% | 4 PB | 23.53% |
| 11 | 20 PB | 80.00% | 5 PB | 20.00% |
| 12 | 50 PB | 79.37% | 13 PB | 20.63% |
| 13 | 22 (12 BM & 10 PB) | 64.71% | 12 (9 BM & 3 PB) | 35.29% |
| 14 | 11 PB | 91.67% | 1 PB | 8.33% |
| 15 | 1 PB | 50.00% | 1 PB | 50.00% |
| 16 | 11 (9 BM & 2 PB) | 91.67% | 1 BM | 8.33% |
| 17 | 28 PB | 80.00% | 7 PB | 20.00% |
| 18 | 120 BM | 85.71% | 20 BM | 14.29% |
| 19 | 37 PB | 80.43% | 9 PB | 19.57% |
| 20 | 12 (10 BM & 2 PB) | 92.30% | 1 BM | 7.70% |
| 21 | 19 PB | 79.17% | 5 PB | 20.83% |
| 22 | 9 (6 BM & 3 PB) | 75.00% | 3 (2 BM & 1 PB) | 25.00% |
| 23 | 148 BM | 80.87% | 35 BM | 19.13% |
| 24 | 12 PB | 100.00% | - | 00.00% |
| 25 | 3 PB | 100.00% | - | 00.00% |
| 26 | 42 (23 BM & 19 PB) | 93.33% | 3 (2 BM & 1 PB) | 6.67% |
| 27 | 26 PB | 86.67% | 4 PB | 13.33% |
| 28 | 25 PB | 71.43% | 10 PB | 28.57% |
| 29 | 49 PB | 76.56% | 15 PB | 23.44% |
| 30 | 99 PB | 81.82% | 22 PB | 18.18% |
| 31 | - | 00.00% | 1 PB | 100.00% |
| Train set | Validation set | ||
|---|---|---|---|
| Age group: # Number of patients | % | Age group: # Number of patients | % |
| 0 to 19: 75 | 4.31% | 0 to 19: 24 | 5.5% |
| 20 to 29: 180 | 10.34% | 20 to 29: 37 | 8.49% |
| 30 to 39: 272 | 15.62% | 30 to 39: 68 | 15.6% |
| 40 to 49: 313 | 17.98% | 40 to 49: 80 | 18.35% |
| 50 to 59: 378 | 21.71% | 50 to 59: 109 | 25% |
| 60 to 69: 319 | 18.32% | 60 to 69: 71 | 16.28% |
| 70 to 79: 171 | 9.82% | 70 to 79: 41 | 9.4% |
| 80 to 100: 33 | 1.9% | 80 to 100: 6 | 1.38% |
| Index | Reference | GEO Acc. | AML/Healthy | City, Country, Org. | AML subtypes | OS |
|---|---|---|---|---|---|---|
| 0 | [17] | GSE10258 | AML | Vienna, Austria, Medical University of Vienna | M1, M5 | n/a |
| 1 | [18], [19] | GSE10358 | AML | St Louis, USA, Washington University School of Medicine | M0, M1, | n/a |
| M2, M3, | ||||||
| M4, M5, | ||||||
| M6, M7 | ||||||
| 2 | [20] | GSE11375 | Healthy | Boston, USA, Massachusetts General Hospital | n/a | n/a |
| 3 | [21], [22] | GSE12417 | AML | Munich, Germany, University of Munich | M0, M1, | Mean: 614.76, |
| M2, M4, | Std: 503.59 | |||||
| M5, M6 | ||||||
| 4 | [23], [24], [25] | GSE14468 | AML | Houston, USA, MD Anderson Cancer Center | M0, M1, | n/a |
| M2, M3, | ||||||
| M4, M4 eos, | ||||||
| M5, M6 | ||||||
| 5 | [26] | GSE14479 | AML | Rotterdam, Netherlands, Erasmus University Medical Center | n/a | n/a |
| 6 | [27] | GSE15434 | AML | New York, USA, Columbia University Medical Center | n/a | n/a |
| 7 | Wu 2012 (NYP) | GSE15932 | Healthy | Hangzhou, China, Second Affiliated Hospital, School of Medicine, Zhejiang University | n/a | n/a |
| 8 | [28] | GSE16028 | Healthy | Basel, Switzerland, F.Hoffmannn/La Roche AG | n/a | n/a |
| 9 | Krug 2011 (NYP) | GSE17114 | Healthy | Lisbon, Portugal, Instituto de Medicina Molecular | n/a | n/a |
| 10 | [29] | GSE18123 | Healthy | Boston, USA, Boston Children’s Hospital | n/a | n/a |
| 11 | [30] | GSE18781 | Healthy | Portland, USA, Oregon Health & Science University | n/a | n/a |
| 12 | [31] | GSE19743 | Healthy | Palo Alto, USA, Stanford Genome Technology Center | n/a | n/a |
| 13 | [32] | GSE23025 | AML | Duarte, USA, City of Hope Beckman Research Institute | n/a | n/a |
| 14 | [33] | GSE25414 | Healthy | Barcelona, Spain, Institut de Recerca Hospital Vall d’Hebron | n/a | n/a |
| 15 | [34] | GSE2842 | Healthy | Bolzano, Italy, EURAC | n/a | n/a |
| 16 | [35] | GSE29883 | AML | Berlin, Germany, Charité | t(8;21), t(16;16) | n/a |
| 17 | [36] | GSE36809 | Healthy | Boston, USA, Massachusetts General Hospital | n/a | n/a |
| 18 | [37], [38], [39], [40] | GSE37642 | AML | Munich, Germany, University Hospital Grosshadern, Ludwign/Maximiliansn/University (LMU) | M0, M1, | Mean: 962.32, |
| M2, M3, | Std: 1106.70 | |||||
| M4, M5, | ||||||
| M6, M7 | ||||||
| 19 | [41], [42] | GSE39088 | Healthy | Brussels, Belgium, Université catholique de Louvain | n/a | n/a |
| 20 | Bullinger 2014 (NYP) | GSE39363 | AML | Berlin, Germany, Charité | t(3;3) | n/a |
| 21 | [43] | GSE46449 | Healthy | New York, USA, Columbia University Medical Center | n/a | n/a |
| 22 | [44], [45] | GSE46819 | AML | Berlin, Germany, Charité | t(16;16) | n/a |
| 23 | Leong 2015 (NYP) | GSE68833 | AML | Rockville, USA, NCI | M0, M1, | n/a |
| M2, M3, | ||||||
| M4, M5, | ||||||
| M6, M7 | ||||||
| 24 | [46] | GSE69565 | AML | Singapore, Singapore, Cancer Science Institute of Singapore | n/a | n/a |
| 25 | Meng 2015 (NYP) | GSE71226 | Healthy | Changchun, China, the Department of Cardiology, China-Japan Union Hospital, Jilin University | n/a | n/a |
| 26 | Bohl 2016 (NYP) | GSE84334 | AML | Ulm, Germany, University Hospital of Ulm | n/a | n/a |
| 27 | [47] | GSE84844 | Healthy | Fujisawa, Japan, Takeda Pharmaceutical Company Limited | n/a | n/a |
| 28 | [48] | GSE93272 | Healthy | Fujisawa, Japan, Takeda Pharmaceutical Company Limited | n/a | n/a |
| 29 | [49] | GSE98793 | Healthy | Cambridge, United Kingdom, University of Cambridge | n/a | n/a |
| 30 | [50] | GSE99039 | Healthy | Tel Aviv, Israel, Tel Aviv University | n/a | n/a |
| 31 | Green 2009 (NYP) | GSE14845 | Healthy | Southport, Australia, Griffith Insitute for Health & Medical Research | n/a | n/a |
| Probe set ID | Gene Symbol/NCBI Accesion Number | Blood Malignancies | Other types of cancer | General |
|---|---|---|---|---|
| 234632_x_at | AK026267 | n/a | n/a | cDNA: FLJ22614 fis, clone HSI05089 [51] |
| 209603_at | GATA3 | Acute Lymphoblastic Leukemia (ALL)[52] | Breast Cancer [53], Bladder Cancer [54] | This gene encodes a protein, which plays a role as regulator of T-cell development [51] |
| 230527_at | LOC101926907 | n/a | n/a | Uncharacterized Gene [51] |
| 229963_at | BEX5 | n/a | n/a | The protein encoded by this gene plays a role in neuronal development [55] |
| 217901_at | DSG2 | n/a | Cervical Cancer [56], Epithelial-derived Carcinomas [57], Pancreatic Cancer [58], Breast Cancer [59], Colon Cancer [60], Lung Cancer [61], [62], Gastric Cancer [63], [64], Ovarian Cancer [65], Laryngeal Cancer [66], Liver Cancer [67] | This gene encodes a calcium-binding transmembrane glycoprotein component of desmosomes, which plays a role in cell-cell junctions between epithelial, myocardial, and other types of cells [51] |
| 214719_at | SLC46A3 | n/a | Liver Cancer [68] | This gene encodes a protein, which is involved in transportation of small molecules across membranes [51] |
| 219513_s_at | SH2D3A | n/a | n/a | This gene encodes a protein, which may play a role in JNK activation [69] |
| 210789_x_at | CEACAM3 | n/a | n/a | The protein encoded by this gene it is thought to play an important role in controlling human-specific pathogens [51] |
| 204777_s_at | MAL | n/a | Gastric Cancer [70], Breast Cancer [71], Ovarian Cancer [72], Colorectal Cancer [73] | This gene encodes a protein, which plays a central role in the formation, stabilization and maintenance of glycosphingolipid-enriched membrane microdomains [51] |
| 203294_s_at | LMAN1 | n/a | n/a | This gene encodes a protein, which is involved in glycoprotein transportation [51] |
| 230753_at | PATL2 | n/a | n/a | This gene encodes an RNA-binding protein, which plays a role as translational repressor in regulation of maternal mRNAs during oocyte maturation [74] |
| 242056_at | TRIM45 | n/a | Lung Cancer [75], Glioma [76] | The encoded protein acts as a transcriptional repressor of the mitogen-activated protein kinase pathway [51] |
| 217680_x_at | RPL10 | T-cell Acute Lymphoblastic Leukemia (T-ALL) [77], [78] | Ovarian Cancer [79], Pancreatic Cancer [80] | The encoded protein is a component of the 60S ribosome subunit [51] |
| 214945_at | FAM153A & FAM153B & FAM153C & LOC100507387 & LOC105377751 | n/a | n/a | Unknown function/Uncharacterized gene [51] |
| 222312_s_at | AW969803 | n/a | n/a | Expressed sequence tag [51] |
| 214705_at | PATJ | n/a | n/a | This gene encodes a protein, which is located in tight junctions and in the apical membrane of epithelial cells [51] |
| 241688_at | AA677700 | n/a | n/a | Expressed sequence tag [51] |
| 241611_s_at | FNDC3A | Multiple Myeloma [81] | n/a | The protein encoded by this gene plays a role in spermatid-Sertoli adhesion during spermatogenesis [82] |
| 236952_at | AI309861 | n/a | n/a | Expressed sequence tag [51] |
| 207636_at | SERPINI2 | Chronic Lymphocytic Leukemia (CLL) [83] | pancreatic cancer [84] | The encoded protein is involved in the regulation of a variety of physiological processes, including coagulation, fibrinolysis, development, malignancy, and inflammation [51] |
| 243659_at | N63876 | n/a | n/a | Expressed sequence tag [51] |
| 226311_at | ADAMTS2 | Mixed Phenotype Acute Leukemias (MPAL) [85] | Gastric Cancer [86], Kidney Cancer [87] | This gene encodes an extracellular metalloproteinase, which plays a significant role in the excision of the N-propeptides of procollagens I-III and type V [51] |
| 211772_x_at | CHRNA3 | T-cell Acute Lymphoblastic Leukemia (T-ALL) [88] | Lung Cancer [89] | The protein encoded by this gene is a ligand-gated ion channel, which plays a role in neurotransmission [51] |
| 244719_at | AA766704 | n/a | n/a | Expressed sequence tag [51] |
| 239766_at | BF507518 | n/a | n/a | Expressed sequence tag [51] |
| 243272_at | LOC101593348 | n/a | n/a | Uncharacterized gene [51] |
References
- [1] Short NJ, Rytting ME, Cortes JE. Acute myeloid leukaemia.Lancet. 2018, 392(10147):593-606. doi:10.1016/S0140-6736(18)31041-9
- [2] Mottal N, Issa N, Dumas PY, et al. Reduce Mortality and Morbidity in Acute Myeloid Leukemia With Hyperleukocytosis With Early Admission in Intensive Care Unit: A Retrospective Analysis. J Hematol. 2020, 9(4):109-115. doi:10.14740/jh691
- [3] Roushangar R, Mias GI. Multi-study reanalysis of 2,213 acute myeloid leukemia patients reveals age- and sex-dependent gene expression signatures. Sci Rep. 2019, 9(1):12413. Published 2019 Aug 27. doi:10.1038/s41598-019-48872-0
- [4] Abelson S, Collord G, Ng SWK, et al. Prediction of acute myeloid leukaemia risk in healthy individuals. Nature. 2018, 559(7714):400-404.doi:10.1038/s41586-018-0317-6
- [5] Mosquera Orgueira A, Peleteiro Raíndo A, Cid López M, et al. Personalized Survival Prediction of Patients With Acute Myeloblastic Leukemia Using Gene Expression Profiling. Front Oncol. 2021, 11:657191. Published 2021 Mar 29. doi:10.3389/fonc.2021.657191
- [6] Angelakis A, Gatos I, Theotokas I et al. A deep-learning approach to the significant liver fibrosis binary classification problem using gender, morphologic and haemodynamic measurements derived from B-mode ultrasound images, Insights Imaging. 2018, p.S279,9(Suppl 1):1.doi:10.1007/s13244-018-0603-8
- [7] Angelakis A, Gatos I, Theotokas I et al. Binary Classification of Chronic Liver Disease Patients Using Deep Learning on Morphologic B-Mode and Demographic Data, Journal of Ultrasound in Medicine. 2018, AIUM 2018 Annual Convention,S3,doi:10.1002/jum.14750
- [8] Angelakis A., Cats On The Classification Of Benign And Malignant Breast Lesions Using Ultrasound Shear Wave Elastography Features And BI-RADS Score, Journal of Ultrasound in Medicine. 2021, AIUM 2021 Annual Convention,doi:10.1002/jum.15752
- [9] Prokhorenkova L, Gusev G, Vorobev A, et al. CatBoost: unbiased boosting with categorical features. Advances in Neural Information Processing Systems. 2018, vol. 31
- [10] Kohavi R, A study of cross-validation and bootstrap for accuracy estimation and model selection. Proceedings of the 14th international joint conference on Artificial intelligence. 1995, vol. 2
- [11] Warnat-Herresthal S, Perrakis K, Taschler B, et al. Scalable Prediction of Acute Myeloid Leukemia Using High-Dimensional Machine Learning and Blood Transcriptomics. iScience. 2020, 23(1):100780. doi:10.1016/j.isci.2019.100780
- [12] Nazari E, Farzin AH, Aghemiri M, Avan A, Tara M, Tabesh H. Deep Learning for Acute Myeloid Leukemia Diagnosis. emphJ Med Life. 2020, 13(3):382-387. doi:10.25122/jml-2019-0090
- [13] Kazemi F, Najafabadi TA, Araabi BN. Automatic Recognition of Acute Myelogenous Leukemia in Blood Microscopic Images Using K-means Clustering and Support Vector Machine. J Med Signals Sens. 2016, 6(3):183-193.
- [14] Awada H, Durmaz A, Gurnari C, et al. Machine Learning Integrates Genomic Signatures for Subclassification Beyond Primary and Secondary Acute Myeloid Leukemia. [published online ahead of print, 2021 Jun 1]. Blood. 2021, blood.2020010603. doi:10.1182/blood.2020010603
- [15] Zhao S, Dong X, Shen W, et al. Machine learning-based classification of diffuse large B-cell lymphoma patients by eight gene expression profiles. Cancer Med. 2016, 5(5):837-852. doi:10.1002/cam4.650
- [16] Castillo D, Galvez JM, Herrera LJ, et al. Leukemia multiclass assessment and classification from Microarray and RNA-seq technologies integration at gene expression level. PLoS One. 2019, 14(2):e0212127. Published 2019 Feb 12. doi:10.1371/journal.pone.0212127
- [17] Zatkova A, Merk S, Wendehack M, et al., AML/MDS with 11q/MLL amplification show characteristic gene expression signature and interplay of DNA copy number changes. Genes Chromosomes Cancer. 2009, 48(6):510-520. doi:10.1002/gcc.20658
- [18] Tomasson MH, Xiang Z, Walgren R, et al. Somatic mutations and germline sequence variants in the expressed tyrosine kinase genes of patients with de novo acute myeloid leukemia. Blood. 2008, 111(9):4797-4808. doi:10.1182/blood-2007-09-113027
- [19] Walter MJ, Payton JE, Ries RE, et al. Acquired copy number alterations in adult acute myeloid leukemia genomes. Proc Natl Acad Sci U S A. 2009, 106(31):12950-12955. doi:10.1073/pnas.0903091106
- [20] Warren HS, Elson CM, Hayden DL, et al. A genomic score prognostic of outcome in trauma patients. Mol Med. 2009, 15(7-8):220-227. doi:10.2119/molmed.2009.00027
- [21] Metzeler KH, Hummel M, Bloomfield CD, et al. An 86-probe-set gene-expression signature predicts survival in cytogenetically normal acute myeloid leukemia. Blood. 2008, 112(10):4193-4201. doi:10.1182/blood-2008-02-134411
- [22] Wang YH, Lin CC, Hsu CL, et al. Distinct clinical and biological characteristics of acute myeloid leukemia with higher expression of long noncoding RNA KIAA0125. Ann Hematol. 2021, 100(2):487-498. doi:10.1007/s00277-020-04358-y
- [23] Wouters BJ, Löwenberg B, Erpelinck-Verschueren CAJ, et al. Double CEBPA mutations, but not single CEBPA mutations, define a subgroup of acute myeloid leukemia with a distinctive gene expression profile that is uniquely associated with a favorable outcome. Blood. 2009, doi:10.1182/blood-2008-09-179895
- [24] Taskesen E, Bullinger L, Corbacioglu A, et al. Prognostic impact, concurrent genetic mutations, and gene expression features of AML with CEBPA mutations in a cohort of 1182 cytogenetically normal AML patients: Further evidence for CEBPA double mutant AML as a distinctive disease entity. Blood. 2011, 117(8):2469-2475. doi:10.1182/blood-2010-09-307280
- [25] Taskesen E, Babaei S, Reinders MMJ, de Ridder J. Integration of gene expression and DNA-methylation profiles improves molecular subtype classification in acute myeloid leukemia. BMC Bioinformatics. 2015, 16(4):1-8. doi:10.1186/1471-2105-16-S4-S5
- [26] Figueroa ME, Wouters BJ, Skrabanek L, et al. Genome-wide epigenetic analysis delineates a biologically distinct immature acute leukemia with myeloid/T-lymphoid features. Blood. 2009, 113(12):2795-2804. doi:10.1182/blood-2008-08-172387
- [27] Klein HU, Ruckert C, Kohlmann A, et al. Quantitative comparison of microarray experiments with published leukemia related gene expression signatures. BMC Bioinformatics. 2009, 10:1-11. doi:10.1186/1471-2105-10-422
- [28] Karlovich C, Duchateau-Nguyen G, Johnson A, et al. A longitudinal study of gene expression in healthy individuals. BMC Med Genomics. 2009, 2:1-16. doi:10.1186/1755-8794-2-33
- [29] Kong SW, Collins CD, Shimizu-Motohashi Y, et al. Characteristics and Predictive Value of Blood Transcriptome Signature in Males with Autism Spectrum Disorders. PLoS One. 2012, 7(12). doi:10.1371/journal.pone.0049475
- [30] Sharma SM, Choi D, Planck SR, et al. Insights in to the pathogenesis of axial spondyloarthropathy based on gene expression profiles. Arthritis Res Ther. 2009, 11(6):1-9. doi:10.1186/ar2855
- [31] Zhou B, Xu W, Herndon D, et al. Analysis of factorial time-course microarrays with application to a clinical study of burn injury. Proc Natl Acad Sci U S A. 2010, 107(22):9923-9928. doi:10.1073/pnas.1002757107
- [32] Li L, Li M, Sun C, et al. Altered Hematopoietic Cell Gene Expression Precedes Development of Therapy-Related Myelodysplasia/Acute Myeloid Leukemia and Identifies Patients at Risk. Cancer Cell. 2011, 20(5):591-605. doi:10.1016/j.ccr.2011.09.011
- [33] Rosell A, Vilalta A, García-Berrocoso T, et al. Brain perihematoma genomic profile following spontaneous human intracerebral hemorrhage. PLoS One. 2011, 6(2). doi:10.1371/journal.pone.0016750
- [34] Schmidt S, Rainer J, Riml S, et al. Identification of glucocorticoid-response genes in children with acute lymphoblastic leukemia. Blood. 2006, 107(5):2061-2069. doi:10.1182/blood-2005-07-2853
- [35] Lück SC, Russ AC, Botzenhardt U, et al. Deregulated apoptosis signaling in core-binding factor leukemia differentiates clinically relevant, molecular marker-independent subgroups. Leukemia. 2011, 25(11):1728-1738. doi:10.1038/leu.2011.154
- [36] Xiao W, Mindrinos MN, Seok J, et al. A genomic storm in critically injured humans. J Exp Med. 2011, 208(13):2581-2590. doi:10.1084/jem.20111354
- [37] Li Z, Herold T, He C, et al. Identification of a 24-gene prognostic signature that improves the european LeukemiaNet risk classification of acute myeloid leukemia: An international collaborative study. J Clin Oncol. 2013, 31(9):1172-1181. doi:10.1200/JCO.2012.44.3184
- [38] Herold T, Metzeler KH, Vosberg S, et al. Isolated trisomy 13 defines a homogeneous AML subgroup with high frequency of mutations in spliceosome genes and poor prognosis. Blood. 2014, 124(8):1304-1311. doi:10.1182/blood-2013-12-540716
- [39] Kuett A, Rieger C, Perathoner D, et al. IL-8 as mediator in the microenvironment-leukaemia network in acute myeloid leukaemia. Sci Rep. 2015, 5(December):1-11. doi:10.1038/srep18411
- [40] Herold T, Jurinovic V, Batcha AMN, et al. A 29-gene and cytogenetic score for the prediction of resistance to induction treatment in acute myeloid leukemia. Haematologica. 2018, 103(3):456-465. doi:10.3324/haematol.2017.178442
- [41] Lauwerys BR, Hachulla E, Spertini F, et al. Down-regulation of interferon signature in systemic lupus erythematosus patients by active immunization with interferon -kinoid. Arthritis Rheum. 2013, 65(2):447-456. doi:10.1002/art.37785
- [42] Ducreux J, Houssiau FA, Vandepapelière P, et al. Interferon -kinoid induces neutralizing anti-interferon antibodies that decrease the expression of interferon-induced and B cell activation associated transcripts: Analysis of extended follow-up data from the interferon kinoid phase I/II study. Rheumatol (United Kingdom). 2016, 55(10):1901-1905. doi:10.1093/rheumatology/kew262
- [43] Clelland CL, Read LL, Panek LJ, Nadrich RH, Bancroft C, Clelland JD. Utilization of Never-Medicated Bipolar Disorder Patients towards Development and Validation of a Peripheral Biomarker Profile. PLoS One. 2013, 8(6):1-11. doi:10.1371/journal.pone.0069082
- [44] Opel D, Schnaiter A, Dodier D, et al. Targeting inhibitor of apoptosis proteins by Smac mimetic elicits cell death in poor prognostic subgroups of chronic lymphocytic leukemia. Int J Cancer. 2015, 137(12):2959-2970. doi:10.1002/ijc.29650
- [45] Lueck SC, Russ AC, Botzenhardt U, et al. Smac mimetic induces cell death in a large proportion of primary acute myeloid leukemia samples, which correlates with defined molecular markers. Oncotarget. 2016, doi:10.18632/oncotarget.10390
- [46] Cao Q, Gearhart MD, Gery S, et al. BCOR regulates myeloid cell proliferation and differentiation. Leukemia. 2016, 30(5):1155-1165. doi:10.1038/leu.2016.2
- [47] Tasaki S, Suzuki K, Nishikawa A, et al. Multiomic disease signatures converge to cytotoxic CD8 T cells in primary Sjögren’s syndrome. Ann Rheum Dis. 2017, 76(8):1458-1466. doi:10.1136/annrheumdis-2016-210788
- [48] Tasaki S, Suzuki K, Kassai Y, et al. Multi-omics monitoring of drug response in rheumatoid arthritis in pursuit of molecular remission. Nat Commun. 2018, doi:10.1038/s41467-018-05044-4
- [49] Leday GGR, Vértes PE, Richardson S, et al. Replicable and Coupled Changes in Innate and Adaptive Immune Gene Expression in Two Case-Control Studies of Blood Microarrays in Major Depressive Disorder. Biol Psychiatry. 2018, 83(1):70-80. doi:10.1016/j.biopsych.2017.01.021
- [50] Shamir R, Klein C, Amar D, et al. Analysis of blood-based gene expression in idiopathic Parkinson disease. Neurology. 2017, 89(16):1676-1683. doi:10.1212/WNL.0000000000004516
- [51] NCBI Resource Coordinators. Database resources of the National Center for Biotechnology Information. Nucleic Acids Res. 2016, 44(D1):D7-D19. doi:10.1093/nar/gkv1290
- [52] Hou Q, Liao F, Zhang S, et al. Regulatory network of GATA3 in pediatric acute lymphoblastic leukemia. Oncotarget. 2017, 8(22):36040-36053. doi:10.18632/oncotarget.16424
- [53] Mehra R, Varambally S, Ding L, et al. Identification of GATA3 as a breast cancer prognostic marker by global gene expression meta-analysis. Cancer Res. 2005, 65(24):11259-11264. doi:10.1158/0008-5472.CAN-05-2495
- [54] Li Y, Ishiguro H, Kawahara T, et al. Loss of GATA3 in bladder cancer promotes cell migration and invasion. Cancer Biol Ther. 2014, 15(4):428-435. doi:10.4161/cbt.27631
- [55] Kazi JU, Kabir NN, Rönnstrand L. Brain-Expressed X-linked (BEX) proteins in human cancers. Biochim Biophys Acta - Rev Cancer. 2015, 1856(2):226-233. doi:10.1016/j.bbcan.2015.09.001
- [56] Qin S, Liao Y, Du Q, et al. DSG2 expression is correlated with poor prognosis and promotes early-stage cervical cancer. Cancer Cell Int. 2020, 20(1):1-13. doi:10.1186/s12935-020-01292-x
- [57] Brennan D, Mahoney MG. Increased expression of Dsg2 in malignant skin carcinomas: A tissue-microarray based study. Cell Adhes Migr. 2009, 3(2):148-154. doi:10.4161/cam.3.2.7539
- [58] Hütz K, Zeiler J, Sachs L, et al. Loss of desmoglein 2 promotes tumorigenic behavior in pancreatic cancer cells. Mol Carcinog. 2017, 56(8):1884-1895. doi:10.1002/mc.22644
- [59] Davies EL, Cochrane RA, Hiscox S, et al. The role of desmoglein 2 and E-cadherin in the invasion and motility of human breast cancer cells. Int J Oncol. 1997, 11(2):415-419. doi:10.3892/ijo.11.2.415
- [60] Yang T, Gu X, Jia L, et al. DSG2 expression is low in colon cancer and correlates with poor survival. BMC Gastroenterol. 2021, 21(1):1-10. doi:10.1186/s12876-020-01588-2
- [61] Cai F, Zhu Q, Miao Y, et al. Desmoglein-2 is overexpressed in non-small cell lung cancer tissues and its knockdown suppresses NSCLC growth by regulation of p27 and CDK2. J Cancer Res Clin Oncol. 2017, 143(1):59-69. doi:10.1007/s00432-016-2250-0
- [62] Saaber F, Chen Y, Cui T, et al. Expression of desmogleins 1-3 and their clinical impacts on human lung cancer. emphPathol Res Pract. 2015, 211(3):208-213. doi:10.1016/j.prp.2014.10.008
- [63] Yashiro M, Nishioka N, Hirakawa K. Decreased expression of the adhesion molecule desmoglein-2 is associated with diffuse-type gastric carcinoma. Eur J Cancer. 2006, 42(14):2397-2403. doi:10.1016/j.ejca.2006.03.024
- [64] Biedermann K, Vogelsang H, Becker I, et al. Desmoglein 2 is expressed abnormally rather than mutated in familial and sporadic gastric cancer. J Pathol. 2005, 207(2):199-206. doi:10.1002/path.1821
- [65] Kim J, Beidler P, Wang H, et al. Desmoglein-2 as a prognostic and biomarker in ovarian cancer. Cancer Biol Ther. 2020, 21(12):1154-1162. doi:10.1080/15384047.2020.1843323
- [66] Cury SS, Lapa RML, de Mello JBH, et al. Increased DSG2 plasmatic levels identified by transcriptomic-based secretome analysis is a potential prognostic biomarker in laryngeal carcinoma. Oral Oncol. 2020, 103(January):104592. doi:10.1016/j.oraloncology.2020.104592
- [67] Han CP, Yu YH, Wang AG, et al. Desmoglein-2 overexpression predicts poor prognosis in hepatocellular carcinoma patients. Eur Rev Med Pharmacol Sci. 2018, 22(17):5481-5489. doi:10.26355/eurrev_201809_15808
- [68] Zhao Q, Zheng B, Meng S, et al. Increased expression of SLC46A3 to oppose the progression of hepatocellular carcinoma and its effect on sorafenib therapy. Biomed Pharmacother. 2019, 114(March):108864. doi:10.1016/j.biopha.2019.108864
- [69] Bateman A, Martin MJ, Orchard S, et al. UniProt: The universal protein knowledgebase in 2021. Nucleic Acids Res. Published online 2021. doi:10.1093/nar/gkaa1100
- [70] Buffart TE, Overmeer RM, Steenbergen RDM, et al. MAL promoter hypermethylation as a novel prognostic marker in gastric cancer. Br J Cancer. 2008, 99(11):1802-1807. doi:10.1038/sj.bjc.6604777
- [71] Horne HN, Lee PS, Murphy SK, et al. Inactivation of the MAL gene in breast cancer is a common event that predicts benefit from adjuvant chemotherapy. Mol Cancer Res. 2009, 7(2):199-209. doi:10.1158/1541-7786.MCR-08-0314
- [72] Lee PS, Teaberry VS, Bland AE, et al. Elevated MAL expression is accompanied by promoter hypomethylation and platinum resistance in epithelial ovarian cancer. Int J Cancer. 2010, 126(6):1378-1389. doi:10.1002/ijc.24797
- [73] Kalmár A, Péterfia B, Hollósi P, et al. DNA hypermethylation and decreased mRNA expression of MAL, PRIMA1, PTGDR and SFRP1 in colorectal adenoma and cancer. BMC Cancer. 2015, 15(1):1-14. doi:10.1186/s12885-015-1687-x
- [74] Cao Q, Zhao C, Wang C, et al. The Recurrent Mutation in PATL2 Inhibits Its Degradation Thus Causing Female Infertility Characterized by Oocyte Maturation Defect Through Regulation of the Mos-MAPK Pathway. Front Cell Dev Biol. 2021, doi:10.3389/fcell.2021.628649
- [75] Peng X, Wen Y, Zha L, et al. TRIM45 Suppresses the Development of Non-small Cell Lung Cancer. Curr Mol Med. 2019, doi:10.2174/1566524019666191017143833
- [76] Zhang J, Zhang C, Cui J, et al. Trim45 functions as a tumor suppressor in the brain via its e3 ligase activity by stabilizing p53 through k63-linked ubiquitination. Cell Death Dis. 2017, 8(5):1-11. doi:10.1038/cddis.2017.149
- [77] Raiser DM, Narla A, Ebert BL. The emerging importance of ribosomal dysfunction in the pathogenesis of hematologic disorders. Leuk Lymphoma. 2014, 55(3):491-500. doi:10.3109/10428194.2013.812786
- [78] De Keersmaecker K, Atak ZK, Li N, et al. Exome sequencing identifies mutation in CNOT3 and ribosomal genes RPL5 and RPL10 in T-cell acute lymphoblastic leukemia. Nat Genet. 2013, 45(2):186-190. doi:10.1038/ng.2508
- [79] Shi J, Zhang L, Zhou D, et al. Biological function of ribosomal protein L10 on cell behavior in human epithelial ovarian cancer. J Cancer. 2018, 9(4):745-756. doi:10.7150/jca.21614
- [80] Yang J, Chen Z, Liu N, et al. Ribosomal protein L10 in mitochondria serves as a regulator for ROS level in pancreatic cancer cells. Redox Biol. 2018, 19(May):158-165. doi:10.1016/j.redox.2018.08.016
- [81] Manfrini N, Mancino M, Miluzio A, et al. FAM46C and FNDC3A are multiple myeloma tumor suppressors that act in concert to impair clearing of protein aggregates and autophagy. Cancer Res. 2020, 80(21):4693-4706. doi:10.1158/0008-5472.CAN-20-1357
- [82] Obholz KL, Akopyan A, Waymire KG, et al. FNDC3A is required for adhesion between spermatids and Sertoli cells. Dev Biol. 2006, 298(2):498-513. doi:10.1016/j.ydbio.2006.06.054
- [83] Farfsing A, Engel F, Seiffert M, et al. Gene knockdown studies revealed CCDC50 as a candidate gene in mantle cell lymphoma and chronic lymphocytic leukemia. Leukemia. 2009, 23(11):2018-2026. doi:10.1038/leu.2009.144
- [84] Ozaki K, Nagata M, Suzuki M, et al. Isolation and characterization of a novel human pancreas-specific gene, pancpin, that is down-regulated in pancreatic cancer cells. Genes Chromosom Cancer. 1998, 22(3):179-185. doi:10.1002/(SICI)1098-2264(199807)22:3<179::AID-GCC3>3.0.CO;2-T
- [85] Tota G, Coccaro N, Zagaria A, et al. ADAMTS2 gene dysregulation in T/myeloid mixed phenotype acute leukemia. BMC Cancer. 2014, 14(1):1-6. doi:10.1186/1471-2407-14-963
- [86] Jiang C, Zhou Y, Huang Y, et al. Overexpression of ADAMTS-2 in tumor cells and stroma is predictive of poor clinical prognosis in gastric cancer. Hum Pathol. 2019, 84:44-51. doi:10.1016/j.humpath.2018.08.030
- [87] Roemer A, Schwettmann L, Jung M, et al. The membrane proteases ADAMs and hepsin are differentially expressed in renal cell carcinoma. Are they potential tumor markers? J Urol. 2004, 172(6 I):2162-2166. doi:10.1097/01.ju.0000144602.01322.49
- [88] Laukkanen S, Liuksiala T, Nykter M, et al. Identification of Novel Drug Targets in T-Cell Acute Lymphoblastic Leukemia. Blood. 2015, 126(23):3646-3646. doi:10.1182/blood.v126.23.3646.3646
- [89] Wassenaar CA, Dong Q, Wei Q, et al. Relationship between CYP2A6 and CHRNA5-CHRNA3-CHRNB4 variation and smoking behaviors and lung cancer risk. J Natl Cancer Inst. 2011, 103(17):1342-1346. doi:10.1093/jnci/djr237