[a]Pavel Klimov
Main results of the TUS experiment on board the Lomonosov satellite
Abstract
The TUS detector was the first space-based mission aimed for ultra-high-energy cosmic ray (UHECR) measurements. The detector was designed to register the fluorescent signal of extensive air showers (EAS) developing in the night atmosphere of Earth in the UV range of 300-400 nm. TUS was launched on board the Lomonosov satellite in April, 2016 and operated till December, 2017. Almost 90 thousand events were recorded during the mission, among them lightning discharges, meteors, transient luminous events, polar lights and anthropogenic signals. Some puzzling bright UV flashes in a clear sky far from possible artificial sources were also registered. Besides this, a number of EAS candidates were found in the TUS database. The majority of candidates analysed so far were recorded above populated areas near airports or similar objects, and the energy of the signals corresponds to at least 1 ZeV if they were generated by an UHECR, which does not allow one to consider these events as UHECRs. We briefly present the main results of the TUS experiment and discuss its importance for the development of the future orbital missions.
1 Introduction
One of the main problems in ultra-high energy cosmic ray (UHECR) studies is their extremely low flux at energies eV, above the so-called Greisen–Zatsepin–Kuzmin cut-off. This necessitates running ground experiments occupying huge areas, which allows obtaining sufficiently large exposures. In early 1980’s, Benson and Linsley suggested to increase dramatically the exposure of UHECR experiments by a totally different approach. They suggested to put a wide-field-of view fluorescence telescope into a low-Earth orbit and employ it for registering fluorescence and Cherenkov emission of extensive air showers born by UHECRs in the nocturnal atmosphere [1]. TUS (Tracking Ultraviolet Setup), launched into orbit on 28 April 2016, was the world’s first telescope aimed to verify the applicability of the idea by Benson and Linsley to UHECR studies.
2 The TUS detector
The design of TUS was developed in early 2000’s [2]. The telescope consisted of two main parts: a mirror-concentrator and a photodetector in its focal plane. The photodetector had 256 channels (“pixels”) with square windows of mm covering the field of view of . Pixel sensors were the photoelectron multiplier tubes (PMTs) R1463 of Hamamatsu with a 13 mm diameter cathode. Near-UV (NUV) filters were placed in front of PMTs in order to limit the wavelength range of measurements to 300–400 nm. Special light guides with square entrance apertures (15 mm15 mm) and circular outputs were employed to uniformly fill the detector’s field of view with PMT pixels. Sixteen PMTs were combined into separate clusters (photodetector modules), and each of the 16 clusters of the photodetector had its own digital data processing system for the first-level trigger, based on a Xilinx FPGA as well as a high-voltage power supply controlled by the FPGA to adjust the PMT gains to the intensity of UV radiation.
Using PMTs as sensors and a Fresnel mirror with an area m2 resulted in sensitive measurements with a high temporal resolution (0.8 s) and a spatial resolution about 5 km at sea level. A digital oscilloscope implemented in the FPGA of the photodetector had four operation modes with different time sampling windows: 0.8 s, 25.6 s, 0.4 ms and 6.6 ms.
An automatic gain control (AGC) system was an important part of the TUS electronics. The PMT gains of were continuously (with a frequency of 20 Hz) adjusted during the detector operation by tuning the high voltage so that the average current in the anode circuit remained constant (A). The PMT high voltage used to reach its maximum value (1100 V) under conditions of the minimum background illumination. The voltage was lowered with an increasing illumination thus decreasing the sensitivity of the PMTs. This allowed an adjustment of the detector to highly variable conditions of observation in nocturnal segments of the orbit, see [3] for details.
A malfunction of the AGC system occurred during the first detector turn-ons in the orbit. This was caused by the inoperability of the voltage-lowering algorithm when the photodetector module was partially exposed to a high-intensity light flux. In these conditions, a high current took place in several PMTs bypassing the high voltage divider and, thereby, lowering the signal in all other channels. As a result, the detector spent some time on the day side of the orbit with maximum gains before the AGC algorithm was corrected. Due to this, two modules and several channels in other modules of the photodetector became completely inoperative, and sensitivities of other channels decreased. Together with the design solutions made in early 2000’s, before the discovery of the GZK cut-off, this resulted in an increase of the energy threshold up to EeV.
As another consequence, the pre-flight calibration became irrelevant and it became necessary to develop and test a method for an in-flight detector calibration, i.e., for determining PMT gains and sensitivity of the data-acquisition channels basing on the data registered by the detector. The proposed method is based on the linear dependence of the variance of the stationary signal on its baseline level (the mean value): the slope of this dependence is proportional to the PMT gain. The proportionality coefficient varies from one PMT to another and depends on the position of the channel in the module; therefore, the accuracy of the technique is low (the error is 30% or larger), see [4] for details.
3 Main results
It became clear soon after the beginning of the TUS experiment that all events in its data set can be roughly divided into four groups basing on their phenomenology [5]:
-
•
events with stationary noise-like waveforms; these included events with a strongly non-uniform illumination of the focal surface with bright regions correlated with geographical positions of cities and objects like airports, power plants, offshore platforms etc.
-
•
instant track-like flashes caused by charged particles hitting the UV filters of the photodetector;
-
•
flashes produced by light coming outside of the FOV of the detector and scattered on its mirror; they were called “slow flashes” because of the long signal rise time in comparison with track-like flashes; and
-
•
events with complex spatio-temporal dynamics; these included events with waveforms that could be expected from fluorescence originating from extensive air showers produced by extreme energy cosmic rays, ELVEs, as well as violent flashes of a yet unknown origin.
In what follows, we will briefly discuss the most remarkable groups of events registered in two modes of operation.
3.1 EAS-like events
Some of the registered events have spatio-temporal pattern typical for the EAS fluorescence:
-
•
a large number of hit pixels (channels whose signal significantly exceeds the background) that line up on the pixel map along some direction (a “thick” track);
-
•
the total signal of the hit pixels with a subtracted background (the light curve) has a characteristic fast increase with the subsequent slightly slower decline (the full duration is about 0.1 ms).
-
•
noticeable time shifts of the signal peaks in the hit pixels indicating a motion of the image along the track.
The most interesting of these events, recorded on 3 October 2016 above Minnesota, was analyzed in detail in paper [6] in an assumption of its EAS origin. In work [7], the event is considered in the context of a scenario of so-called relativistic dust grains.
More than 120 EAS-like events were found in the data set registered by TUS during its 1.5-year mission. Besides the signal registered above Minnesota, five other events demonstrated a clear motion of the signal similar to that expected from an EAS generated by an UHECR. However, all of them were registered above the United States in a close vicinity of airports,111Hereinafter TUS events are identified by indicating the registration date, so the first event in Table 1 was triggered on 3 October 2016. To distinguish two events recorded within one day, suffixes a and b are used. see Table 1.
| Event | Time (UTC) | Latitude | Longitude | Location | # hit pixels |
|---|---|---|---|---|---|
| TUS161003 | 05:48:59 | 44.08∘N | 92.71∘W | Minnesota | 10 |
| TUS161031 | 10:25:18 | 61.30∘N | 155.69∘W | Alaska | 8 |
| TUS170915 | 06:30:18 | 40.31∘N | 107.07∘W | Colorado | 12 |
| TUS171010 | 04:26:04 | 34.83∘N | 77.39∘W | North Carolina | 15 |
| TUS171029a | 06:39:09 | 35.27∘N | 110.78∘W | Arizona | 8 |
| TUS171029b | 11:13:26 | 65.90∘N | 168.07∘W | Alaska | 9 |
A typical light curve can be seen in the left panel of Fig. 1 (colors represents different hit pixel signals). The duration of the EAS-like events at half-amplitude is in the range of 50–70 s, and the track length when projected onto the earth’s surface varies from 5 to 12 km. It should be noted that the motion of the source has a pronounced relativistic character: the reconstructed angular velocity of movement of the source is from 100 to 200 rad/s, which corresponds to the component of the linear velocity across the line of sight from to ( is the speed of light). The reconstructed values of the zenith angles, assuming a source velocity equal to , lie in the range from 11∘ to 38∘.
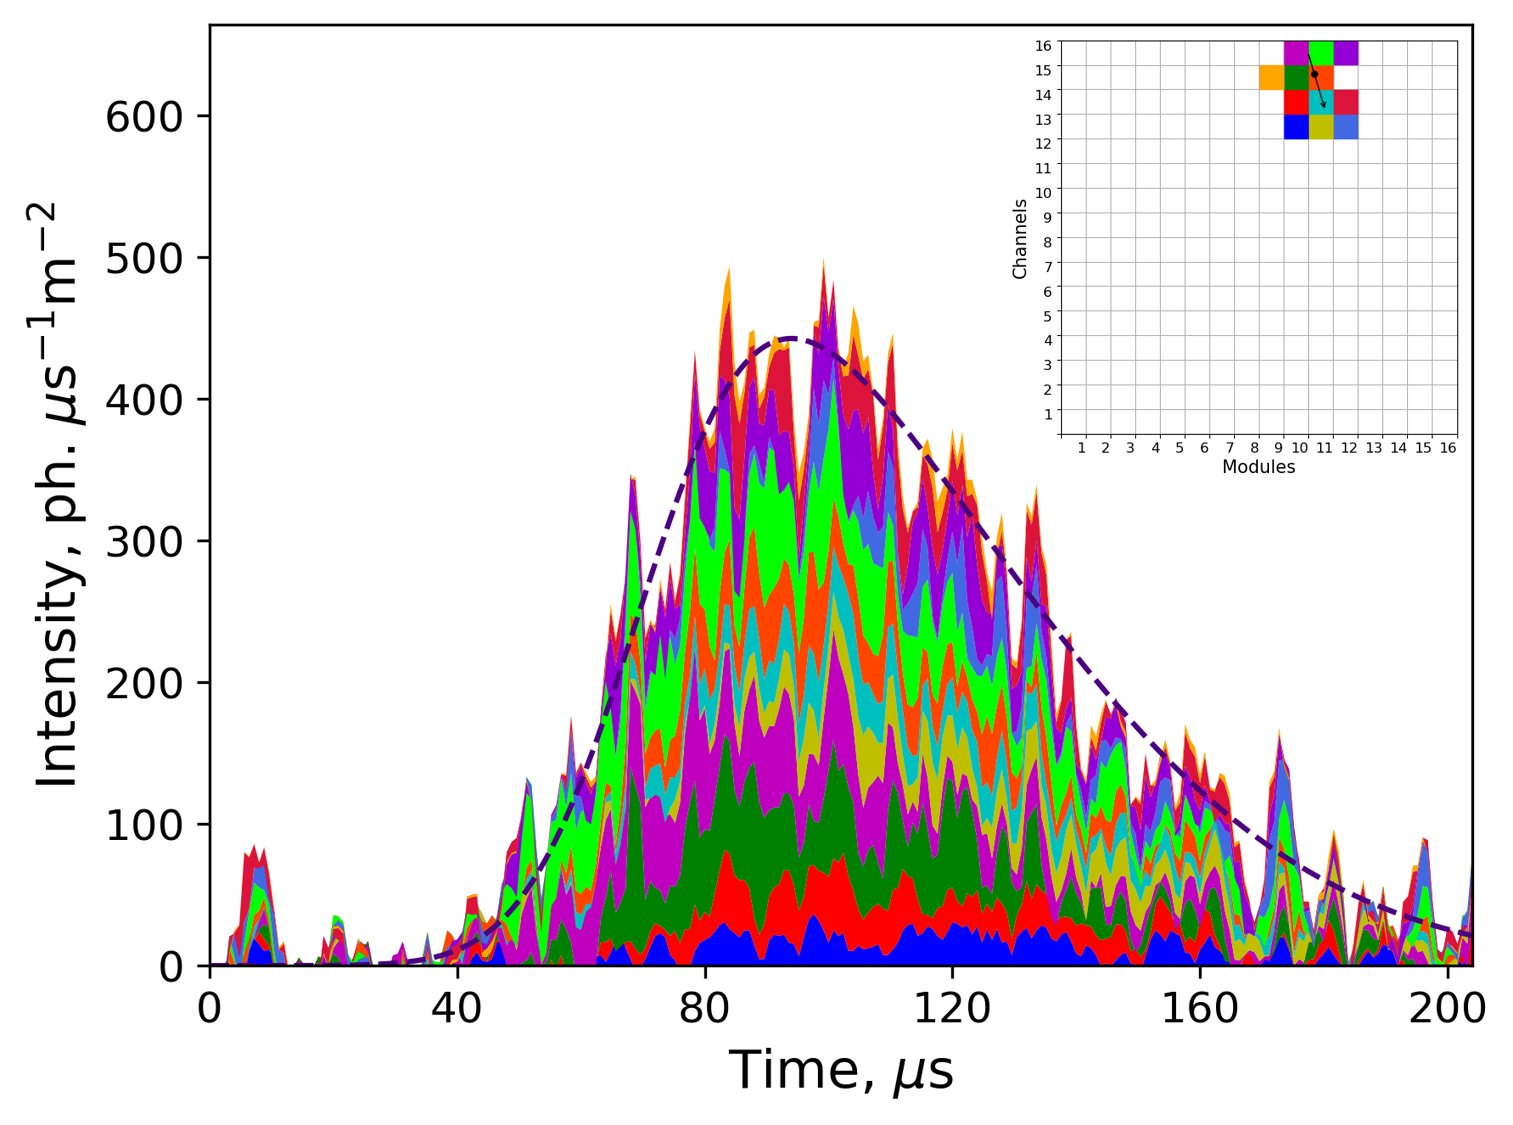
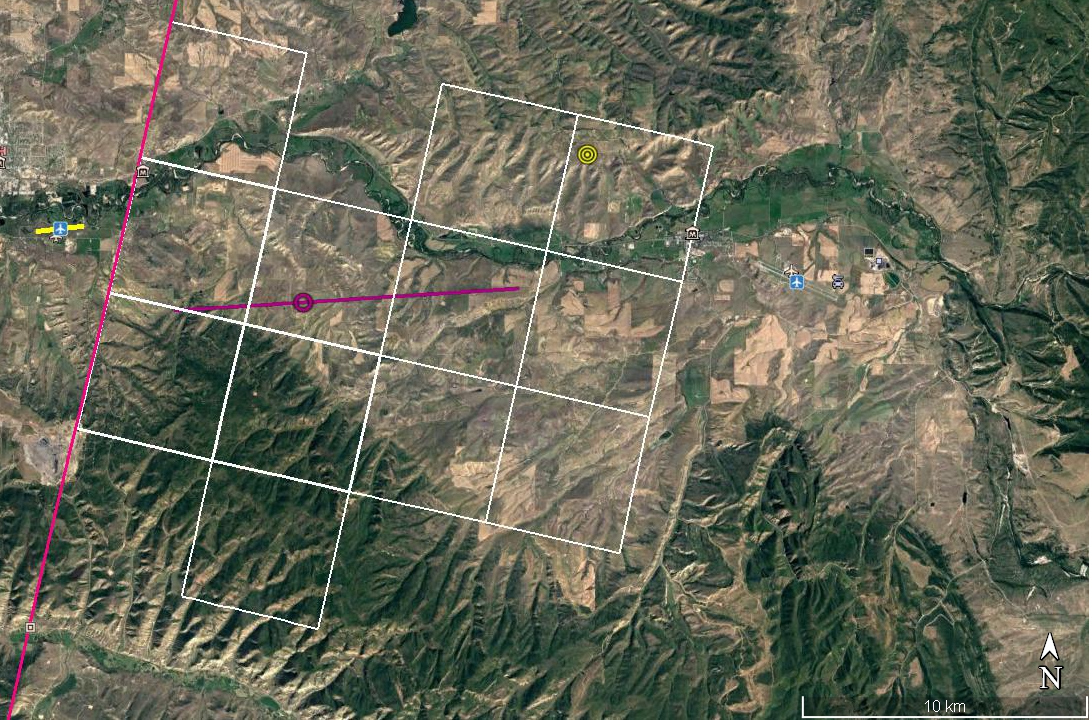
The origin of these EAS-like events is still unclear. It is difficult to interpret them as an EAS fluorescence due to their significant signal amplitudes: they vary in the range from 120 to 450 photons per m2 per s, which corresponds to a primary energy of a proton the order of 1 ZeV and higher. The probability of registering such an UHECR is of the order of –, see [6]. Therefore, a special attention was paid to the search of possible artificial sources. In particular, a strong correlation was found between the reconstructed tracks and the location of nearest airports for 5 out of 6 events. The right panel of Fig. 1 shows a Google map with a part of the field of view of the TUS170915 event, the reconstructed track indicated by a violet line with a circle (“maximum point”), and the Craig Moffat County airport runaway indicated by a yellow segment. White squares show boundaries of the fields of view of the hit pixels.
3.2 Polar lights
Due to the telescope construction providing the high sensitivity and the spacecraft polar orbit, the TUS detector observed NUV pulsations of the atmospheric glow at high latitudes: the threshold energy of the UV emitted from the atmosphere measurements of the TUS detector is less than the average intensity of auroral luminosity. The observed signals have a very diverse structure with characteristic frequencies of the order of 1–10 Hz. The luminescence regions are localized spatially with a characteristic size about 10 km. Several different pulsation regions with different temporal structures (waveforms) were observed simultaneously in the FOV of the telescope.
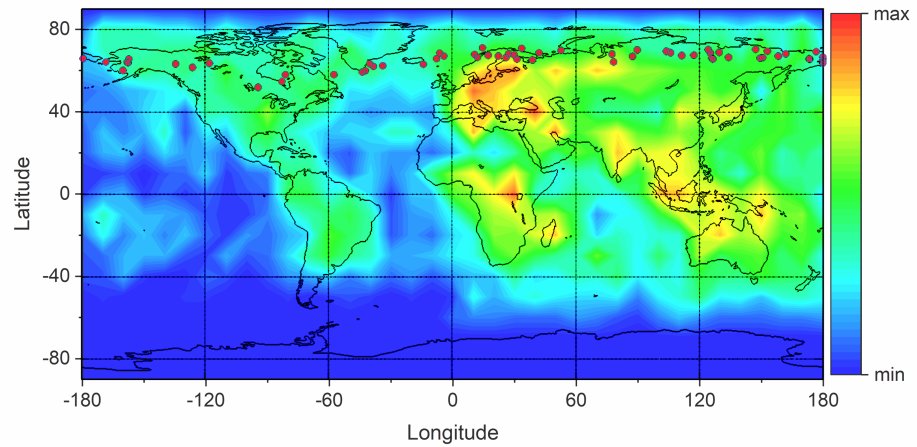
The geographic distribution and geomagnetic conditions analysis indicates that the events are measured at the equatorial border of the auroral zone, see Fig. 2. Their location does not depend on geomagnetic activity level which is typical for the other auroral events. The maximum portion of the pulsations is recorded in the L-shells range from 4 to 6. Although, the event’s occurrence frequency correlates with geomagnetic activity.
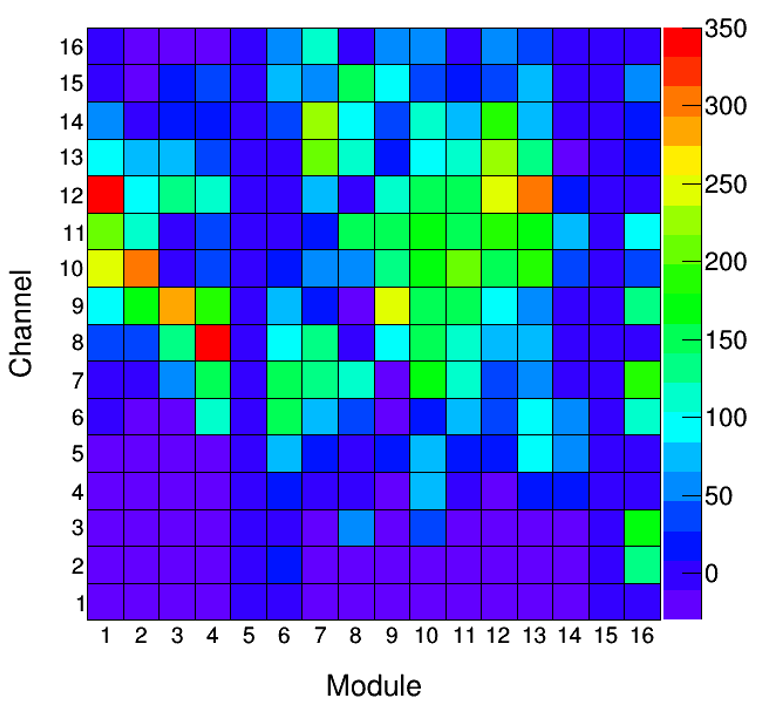
In terms of the event spatio-temporal structure, these signals are similar to flickering auroras observed earlier [8] and internal modulations of pulsating auroras related to a high-energy part of precipitating electrons caused by LBC waves. An example of one event (one of the waveforms and a pixel map) is shown in Fig. 3 However, the nature and the occurrence mechanism of such signals is not obvious yet. A further research based on high-sensitive orbital detector observations is required to obtain detailed characteristics of these events. A comparison with optical data of ground-based geophysical observatories and satellite data on charged particles fluxes will help to clarify the nature of the phenomenon. The TUS detector had a 2 m2 mirror which provided a very high sensitivity of the detector to measure faint emissions which can not be registered by ground-based all-sky cameras. High sensitivity and temporal resolution allows such a detector to measure rare events with faster pulsations (for example, such as those presented in [9]) if a sufficient exposure is achieved.
3.3 Elves
Elves (“ELVE” stands for Emission of Light and Very Low Frequency perturbation from an Electromagnetic Pulse) are the type of transient luminous events (TLEs) that represent expanding luminous rings in the ionosphere at the height of 80–90 km. The duration of an elve is less than 1 ms and they can expand over 300 km laterally. It is believed that they are the result of ionospheric electrons heating by the upward electromagnetic impulse radiated by the lightning discharge current [10]. According to the ISUAL global experimental data [11], elves are the most common type of TLEs: around 50% of all TLEs were found to be elves.
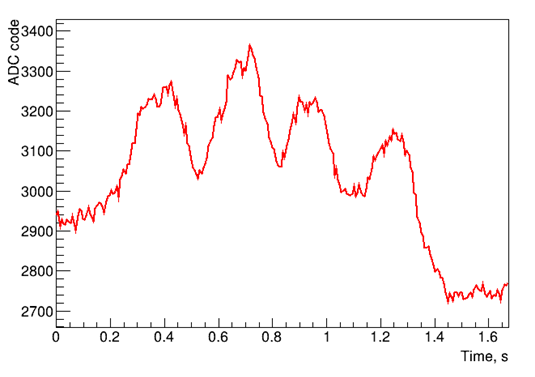
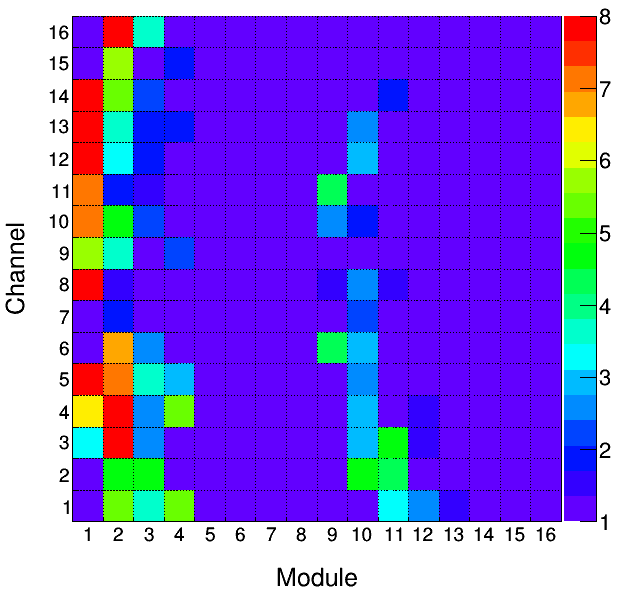
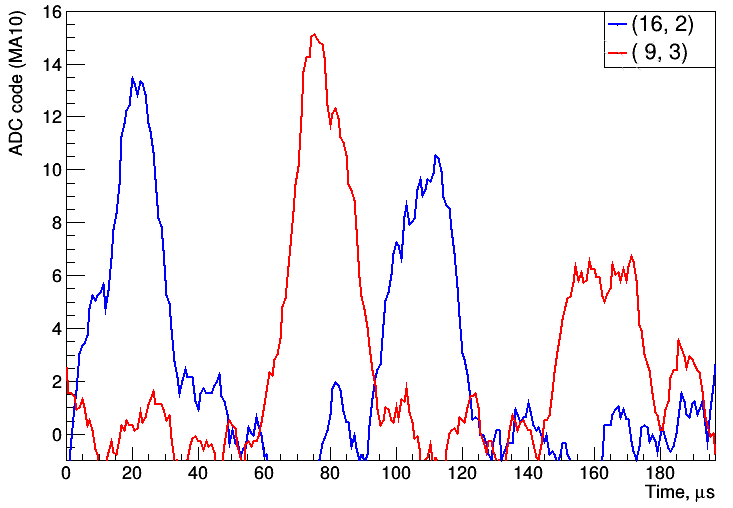
Usually ordinary (single) elves are caused by a cloud-to-ground lightning of any polarity. The TUS detector measured at least twenty six events that can be classified as elves. Several of them have a more complicated space-time pattern: two or more rings were moving with a high speed across the field of view. An example of such a “double elve” is presented in Fig. 4. Two separate rings are clearly seen on the pixel map (the signal was integrated over 6.4 s). These rings correspond to two peaks in the waveforms. Signals of two channels are given for comparison in the right panel of the figure. The first ring is brighter. It arises as a result of the action of a direct electromagnetic impulse from a lightning on the ionosphere. The second ring is caused by a pulse reflected from the ground.
4 Discussion and Conclusions
The TUS detector was the first space-based mission aimed for ultra-high-energy cosmic ray measurements. Its mission lasted from 19 May 2016 till 30 November 2017, and the total exposure reached 1550 km2 sr yr [12]. A number of EAS-like events were measured that have a typical light curve and demonstrate a movement in the FOV at a relativistic velocity. The energy evaluation for these events (for example, TUS161003 event) provides a value of one order of magnitude higher than could be expected from UHECRs. This can be interpreted in several ways. Most probable is the anthropogenic origin of the events. However, an astrophysical hypothesis associated with relativistic dust grains is also considered.
The TUS detector used to register various UV phenomena which constitute the background for UHECR measurements. Among them are anthropogenic lights, thunderstorm activity and lightning discharges, upper atmosphere transient luminous events, polar lights etc. The analysis of the TUS data is still ongoing. One of the recent studies includes an application of neural networks to classification of its data [13].
The orbital fluorescent technique proved a possibility to measure and recognize a relativistic motion in the UV range in the atmosphere, to reconstruct the direction and energy of the event. On the other hand, the experience of the TUS mission revealed difficulties of a space-based experiment that needs an accurate monitoring of the rapidly changing background illumination and a high-quality control of the sensitivity of the equipment.
Acknowledgments
This work was supported by Space State Corporation ROSCOSMOS, and by Lomonosov Moscow State University in frame of Interdisciplinary Scientific and Educational School of Moscow University “Fundamental and Applied Space Research.” The Italian group acknowledges financial contribution from the agreement ASI-INAF n.2017-14-H.O.
References
- [1] R. Benson and J. Linsley, Satellite observation of cosmic-ray air showers, in Bulletin of the American Astronomical Society, vol. 12 of Bulletin of the American Astronomical Society, p. 818, Sept., 1980.
- [2] V.V. Alexandrov, D.I. Bugrov, G.K. Garipov, V.M. Grebenyuk, M. Finger, B.A. Khrenov et al., Space experiment TUS for study of ultra high energy cosmic rays, International Cosmic Ray Conference 2 (2001) 831.
- [3] P.A. Klimov, M.I. Panasyuk, B.A. Khrenov, G.K. Garipov, N.N. Kalmykov, V.L. Petrov et al., The TUS detector of extreme energy cosmic rays on board the Lomonosov satellite, Space Science Reviews (2017) 1.
- [4] P.A. Klimov, K.F. Sigaeva and S.A. Sharakin, Flight calibration of the photodetector in the TUS detector, Instruments and Experimental Techniques 64 (2021) 450.
- [5] B.A. Khrenov, P.A. Klimov, M.I. Panasyuk, S.A. Sharakin, L.G. Tkachev, M.Y. Zotov et al., First results from the TUS orbital detector in the extensive air shower mode, Journal of Cosmology and Astroparticle Physics 9 (2017) 006 [1704.07704].
- [6] B.A. Khrenov, G.K. Garipov, M.A. Kaznacheeva, P.A. Klimov, M.I. Panasyuk, V.L. Petrov et al., An extensive-air-shower-like event registered with the TUS orbital detector, J. Cosmology Astropart. Physics 2020 (2020) 033 [1907.06028].
- [7] B. Khrenov, N. Kalmykov, P. Klimov, S. Sharakin and M. Zotov, “Relativistic dust grains: a new subject of research with orbital fluorescence detectors.” these proceedings, 2021.
- [8] K. Sakanoi, H. Fukunishi and Y. Kasahara, A possible generation mechanism of temporal and spatial structures of flickering aurora, Journal of Geophysical Research 110 (2005) .
- [9] R. Kataoka, Y. Miyoshi, D. Hampton, T. Ishii and H. Kozako, Pulsating aurora beyond the ultra-low-frequency range, J. of Geophys. Research (Space Physics) 117 (2012) A08336.
- [10] U.S. Inan, T.F. Bell and J.V. Rodriguez, Heating and ionization of the lower ionosphere by lightning, Geophysical Research Letters 18 (1991) 705.
- [11] A.B. Chen, C.-L. Kuo, Y.-J. Lee, H.-T. Su, R.-R. Hsu, J.-L. Chern et al., Global distributions and occurrence rates of transient luminous events, Journal of Geophysical Research: Space Physics 113 (2008) .
- [12] F. Fenu, K. Shinozaki, M. Zotov, M. Bertaina and P. Klimov, “Estimation of the exposure of the TUS space-based cosmic ray observatory.” these proceedings, 2021.
- [13] M. Zotov, Application of neural networks to classification of data of the TUS orbital telescope, Universe 7 (2021) .
- [14] P. Klimov, M. Casolino and JEM-EUSO Collaboration, Status of the KLYPVE-EUSO detector for EECR study on board the ISS, in 35th International Cosmic Ray Conference (ICRC2017), vol. 301 of International Cosmic Ray Conference, p. 412, Jan., 2017.
- [15] A. Olinto, J. Krizmanic, J. Adams, R. Aloisio, L. Anchordoqui, A. Anzalone et al., The POEMMA (Probe of Extreme Multi-Messenger Astrophysics) observatory, Journal of Cosmology and Astroparticle Physics 2021 (2021) 007.
The Lomonosov-UHECR/TLE Collaboration
G.K. Garipova, B.A. Khrenova, P.A. Klimova, M.I. Panasyuka,b, V.L. Petrova, S.A. Sharakina, A.V. Shirokova, I.V. Yashina, M.Yu. Zotova, A.A. Grinyukc, V.M. Grebenyukc, M.V. Lavrovac, L.G. Tkachevc,d, A.V. Tkachenkoc, O.A. Saprykine, A.A. Botvinkoe, A.N. Senkovskye, A.E. Puchkove, M. Bertainaf, F. Fenuf
aLomonosov Moscow State University, Skobeltsyn Institute
of Nuclear Physics, GSP-1, Leninskie Gory, Moscow, 119991, Russia
bPhysics Department, Lomonosov Moscow State University,
Leninskie Gory, Moscow, 119991, Russia
cJoint Institute for Nuclear Research,
Joliot-Curie, 6, Dubna, 141980, Moscow region, Russia
dDubna State University,
University str., 19, Bld.1, Dubna, Moscow region, Russia
eSpace Regatta Consortium,
ul. Lenina, 4a, Korolev, 141070, Moscow region, Russia
fUniversità degli studi di Torino,
Via Pietro Giuria 1, 10125 Turin, Italy