Local electronic structure of rutile RuO2
Abstract
Recently, rutile RuO2 has raised interest for its itinerant antiferromagnetism, crystal Hall effect, and strain-induced superconductivity. Understanding and manipulating these properties demands resolving the electronic structure and the relative roles of the rutile crystal field and spin-orbit coupling (SOC). Here, we use O-K and Ru x-ray absorption (XAS) and Ru resonant inelastic x-ray scattering (RIXS) to disentangle the contributions of crystal field, SOC, and electronic correlations in RuO2. The locally orthorhombic site symmetry of the Ru ions introduces significant crystal field contributions beyond the approximate octahedral coordination yielding a crystal field energy scale of eV breaking the degeneracy of the orbitals. This splitting exceeds the Ru SOC ( meV) suggesting a more subtle role of SOC, primarily through the modification of itinerant (rather than local) electronic states, ultimately highlighting the importance of the local symmetry in RuO2. Remarkably, our analysis can be extended to other members of the rutile family, thus advancing the comprehension of the interplay among crystal field symmetry, electron correlations, and SOC in transition metal compounds with the rutile structure.
I Introduction
Transition metal dioxides of the rutile structure exhibit many paradigmatic electronic phenomena arising from the delicate balance of strong electron correlations and spin-orbit coupling (SOC). Few examples include the metal-insulator transition in VO2 Goodenough (1971a, b); He et al. (2016); Hiroi (2015), the half-metallic ferromagnetism of CrO2 Korotin et al. (1998), and the SOC-mediated spin Hall effect in IrO2 Fujiwara et al. (2013); Sun et al. (2017); Sinova et al. (2015). Many of these phenomena stem from the unique rutile structural symmetry, wherein transition metal sites of orthorhombic () site-symmetry are coordinated to distorted oxygen octahedra, forming a bonding network with mixed edge- and corner-sharing octahedral configurations. The importance of this reduced symmetry was recognized early on Goodenough (1971a, b); Sorantin and Schwarz (1992); however, an analysis that treats the SOC, electronic correlations, and reduced symmetry crystal field on equal footing is, so far, absent. Thus, accounting for the mixed degree of itinerancy and localization among the active -orbitals is essential for understanding the origins of their structural, transport and magnetic properties.
In the context of rutile oxides, RuO2 is a special case due to intermediate SOC and electronic correlation strength. RuO2 has long been regarded as a Pauli paramagnetic semi-metal, with early studies focusing on band structure descriptions of transport properties and optical/photoemission spectra Mattheiss (1976); Glassford and Chelikowsky (1994); Lin et al. (2004); Krasovska et al. (1995); De Almeida and Ahuja (2006); Cox et al. (1986). Only recently was it realized that the Fermi surface of RuO2 exhibits a propensity for an itinerant antiferromagnetic (AFM) ground state Berlijn et al. (2017); Ping et al. (2015). Subsequently, the antiferromagnetism has been confirmed and room temperature collinear AFM order has been observed Berlijn et al. (2017); Zhu et al. (2019). Finally, the rutile symmetry, magnetic order, and SOC in RuO2 have elicited further interest on transport properties that led to the observation of spin Sun et al. (2017); Jovic et al. (2018) and crystal Šmejkal et al. (2020); Feng et al. (2020) Hall conductivities, and recently, to the discovery of strain-induced superconductivity Ruf et al. (2020); Uchida et al. (2020).
A microscopic understanding of these properties in the / rutile systems demands knowledge on the precise role of SOC and crystal field splitting Sun et al. (2017); Jovic et al. (2018); Xu et al. (2019); Ping et al. (2015); Kahk et al. (2014); Hu et al. (2000); Hirata et al. (2013); Clancy et al. (2012); Kim et al. (2018). On this front, resonant inelastic x-ray scattering (RIXS) is an ideal tool for investigating -orbital levels including relative SOC and orbital energetics de Groot and Kotani (2008); Moretti Sala et al. (2011); Bisogni et al. (2016); Sala et al. (2014). While significant progress has been made in the study of oxides using -edge RIXS (in the tender x-ray regime) Suzuki et al. (2019); Gretarsson et al. (2019), -edge () RIXS (in the soft x-ray regime) is in many ways analogous to the former Miedema et al. (2019); Wray et al. (2015); Chiuzbăian et al. (2005) and offers an alternative for investigating physics Lebert et al. (2020).
Here, we study RuO2 () with O -edge () and Ru -edge () x-ray absorption spectroscopy (XAS), Ru -edge RIXS, and multiplet calculations. Our O -edge XAS quantifies the octahedral () crystal field component to eV and identifies a pronounced polarization anisotropy in the oxygen ligands associated with the Ru-O bonding network. Despite the delocalized nature of the states, our RIXS measurements uncover clear Raman-like -excitations allowing us to resolve the local orbital levels. Our combined experimental evidence and crystal field multiplet (CFM) simulations underscore the dominant role of lower-symmetry (below ) crystal field splitting ( eV) over the SOC (160 meV), which has the effect of breaking the degeneracy. This defines how the orbital and band degeneracies are lifted from a high-symmetry coordination due to structural rather than relativistic effects, marking important constraints to explain the unconventional properties in RuO2. More broadly, the intermediate nature of RuO2 with respect to crystal field, SOC, and electron filling permits a clear comparison of the local electronic structure across the // rutile systems, which reveals striking and unexpected similarity, verifying the universal role of low-symmetry effects in rutile oxides Kahk et al. (2014); He et al. (2016); Ping et al. (2015).
We structured our work in the following sections: in Section II we discuss XAS and RIXS experimental data, in Section III we introduce the different theoretical frameworks and how they compare with experimental data, in Section IV we discuss the implications of our theory and data, and in Section V we summarize our work.
II Experiment
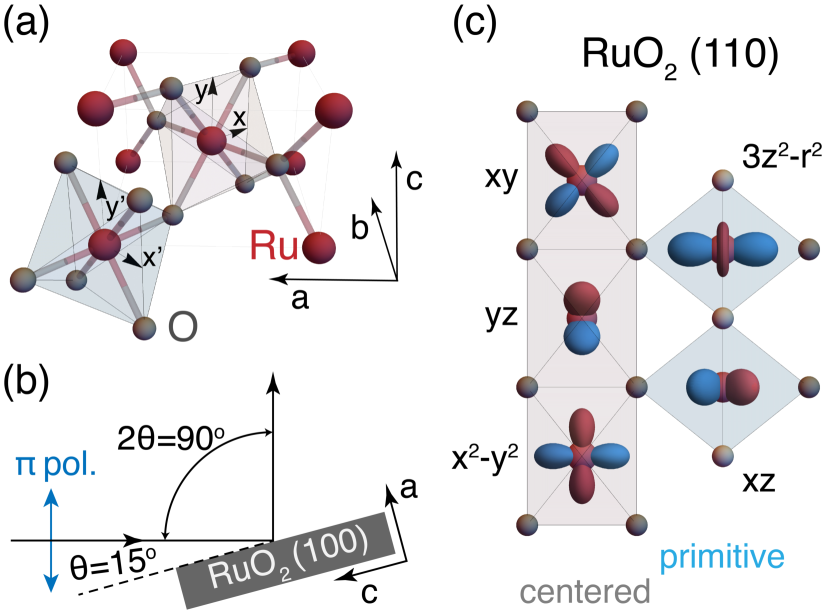
A large, high-quality single crystal of RuO2 with a well-oriented and polished facet was used for all measurements Zhu et al. (2019); Lister et al. (2002). The rutile crystal structure is shown in Fig. 1(a) with the scattering geometry used for all measurements depicted in Fig. 1(b). Figure 1(a) defines both the crystallographic and local orbital axes at the two (centered and primitive) Ru sites, which are used to define the real orbitals in Fig. 1(c). XAS linear dichroism at the oxygen -edge and RIXS experiments at the ruthenium -edge ( eV and eV, respectively) were performed at the 2ID-SIX beamline at NSLS-II, Brookhaven National Laboratory (USA) Dvorak et al. (2016). XAS measurements were collected in Total Fluorescence Yield (TFY) with linear horizontal () and vertical () polarizations and all measurements utilized a combined energy resolution of meV.
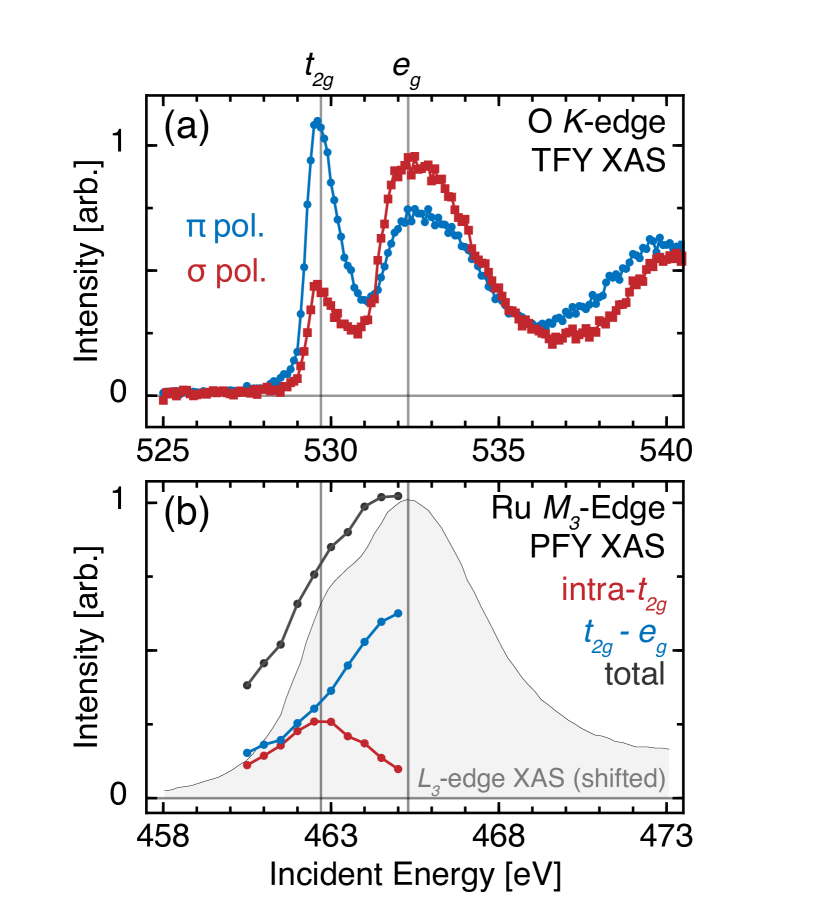
We report linear dichroic O -edge XAS taken under incident and polarizations in Fig. 2(a). Besides the main edge onset ( eV), two prominent pre-edge peaks arise from O- – Ru- hybridization. These represent the O- projection of the unoccupied anti-bonding molecular orbitals based on ( eV) and ( eV) Ru states. The separation between these peaks provides an estimated crystal field splitting between the unoccupied and states, which is eV as indicated in Fig. 2. We highlight the large degree of linear dichroism, particularly at the hybridization pre-edge peak. Considering the global tetragonal lattice symmetry and the polarization projections in the crystal axes (; ), one finds a remarkable sensitivity to the in- vs. out-of-plane polarization component Das et al. (2018). The origin of the large linear dichroism at the resonance has been discussed in the context of other rutile oxides Kim et al. (2016); Stagarescu et al. and represents a partial quenching of the -bonding strength for the and orbitals, leaving the latter essentially non-bonding with respect to the O- orbitals. The origin of this effect is due to the longer-range connectivity of RuO6 octahedra in rutile structure, where O- orbitals that have the symmetry properties for -bonding are instead activated in strong -bonds with neighboring Ru ions Sorantin and Schwarz (1992). This is in contrast to oxides of perovskite symmetry, where a unique separation of oxygen orbitals into global sets which are active in pure - and -bonding is possible. These observations directly support a strong anisotropy in the Ru-O bonding properties, particularly with the orbitals Goodenough (1971b); Sorantin and Schwarz (1992); Kahk et al. (2014); Das et al. (2018).
In Fig. 2(b), we report the Ru -edge XAS spectrum collected with incident polarization. The grey data points represent XAS signal in partial fluorescence yield (PFY) (energy transfer window eV), which is plotted over the -edge powder XAS spectrum (from Ref. Hu et al., 2000) shifted by the tabulated - edge separation ( eV) Thompson et al. (2009). We note both a strong agreement between the XAS profiles at the Ru and edges over the region measured, as well as a close correspondence of the characteristic two-peak structure at the Ru edges and O pre-edge. The latter is highlighted by aligning the incident energy axes in Fig. 2(a,b) to the lower energy -derived peaks (at energies 529.6 and 462.6 eV, respectively), indicated by the vertical grey lines. This corroborates the energy scale eV from both measurements.
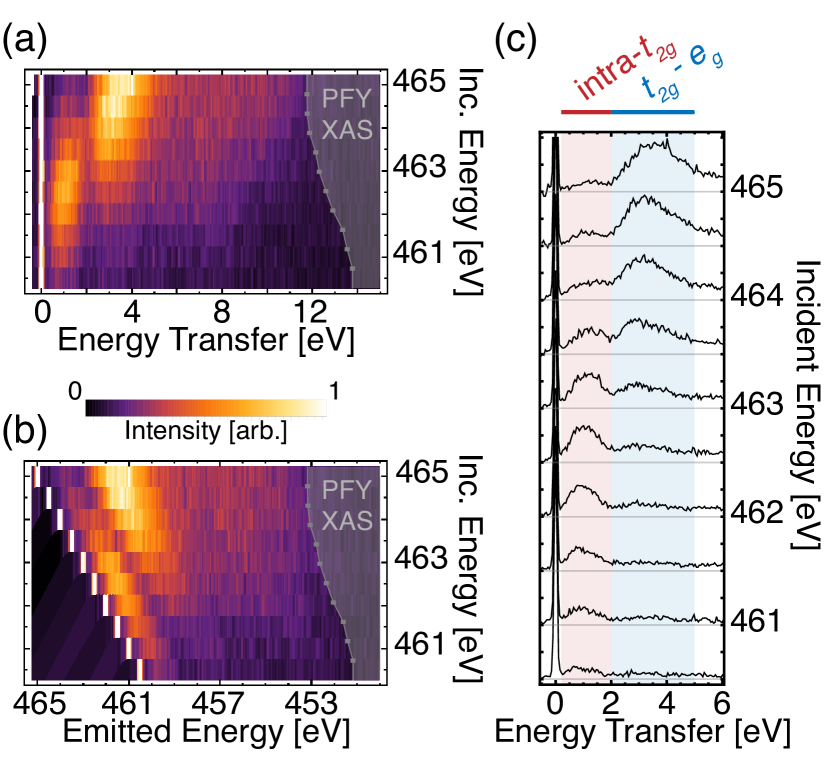
While XAS can assess the coarse crystal field energies (e.g. ), they provide less direct insight into the orbital energies of particular importance for RuO2, a multi-orbital system. To glean further information, we perform RIXS with incident polarization across the Ru edge (460.5-465 eV). The resultant RIXS maps plotted against energy transfer and emitted photon energy are depicted in Fig. 3(a) and (b), respectively. These measurements reveal two Raman-like -excitations around and eV which are respectively identified as intra- and - excitations. This identification is unequivocally confirmed by the incident-energy dependent intensity of these peaks, whose regions are defined in Fig. 3(c) and plotted against the XAS in Fig. 2(b). We find a remarkably close correspondence, with the two excitations peaking with incidence energy at the and intermediate states as suggested by the O -edge and Ru -edge XAS with a splitting of eV. This splitting in incident energy is accompanied by a corresponding shift of the excitations along the energy transfer axis (Fig. 2) by the same value. These features directly confirm the origin of each peak, but raise an important question regarding the energy scale of the intra- excitations ( eV) in the RIXS spectra. In symmetry, levels are nearly degenerate and split solely through SOC (160 meV for Ru4+) which cannot account for the observed splitting. This feature, along with the large Ru-O bonding anisotropy deduced from the O -edge dichroism, is suggestive of an additional structural component breaking the orbital degeneracies.
III Modeling
To test these predictions, one must recall the sensitivity of RIXS to the multi-electron multiplet structure in both the initial and intermediate RIXS state Moretti Sala et al. (2011); He et al. (2016). Therefore, to resolve the interplay between low-symmetry crystal field and SOC, the effects of electron correlations must be properly included for a quantitative comparison to the RIXS spectra. To achieve this, we employ crystal field multiplet and core-level spectra calculations for the local Ru4+ ion as implemented in Quanty Haverkort et al. (2014, 2012); Lu et al. (2014, 2019); Qua . In the calculations, we include the full rutile crystal field, electronic correlations and SOC. Details for the calculations, including all parameters, are included in Appendix B. The calculations (Fig. 4) account for the experimental geometry and polarization conditions.
III.1 symmetry
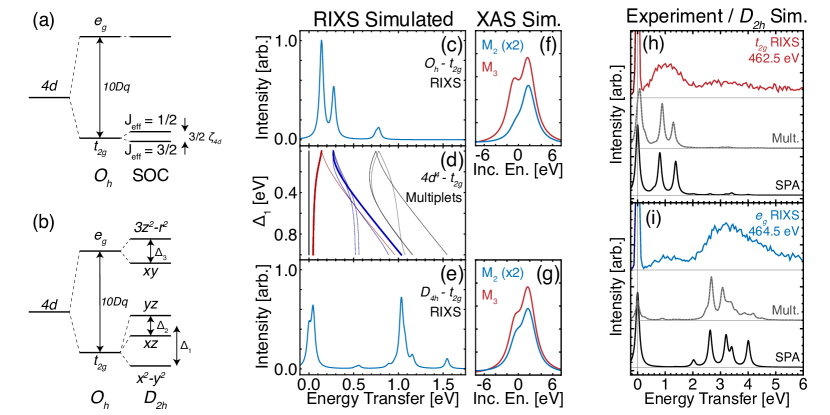
Beyond the cubic crystal field energy ( eV), it was argued that SOC in RuO2 is the second dominant contribution with a negligible crystal field component Hu et al. (2000); Hirata et al. (2013). In the single particle limit, this results in a SOC split , -subspace [see Fig. 4(a)], which is a typical model for nearly octahedral and oxides Das et al. (2018); Gretarsson et al. (2019); Sala et al. (2014); Kim et al. (2008). A consequence of this assumption is a quenching of the channel in the XAS spectrum in the single particle limit. This necessitates a further inclusion of electron correlations to maintain agreement with the XAS doublet at the and edges Hu et al. (2000). We note that the scenario is successful in understanding the /-edge RIXS spectra of the more localized RuCl3 Lebert et al. (2020); Suzuki et al. (2020).
We reformulate this model elaborated for the -edges to the edge through an appropriate replacement of the intermediate state correlation parameters. This is required to describe the interaction of the valence electrons with the core-hole created after the absorption step in the RIXS process. The core-hole at the -edges is shallower than the core-hole of the -edges, which modulates the interaction of this core-hole with the valence electrons Miedema et al. (2019); Wray et al. (2015); Chiuzbăian et al. (2005). The intra-atomic electron interactions amongst the valence electrons (‘’ correlations) and the intermediate state interaction of the valence electrons with the core -shell (‘’ correlations), are introduced through the direct (Slater) and exchange Coulomb interaction integrals (see Appendix B). These quantities are reduced from the atomic values (obtained through ab-initio Hartree-Fock calculations Haverkort (2005)) due to screening effects introduced in the solid state de Groot and Kotani (2008); Haverkort et al. (2012); Hu et al. (2000). For our model, we use a uniform screening of the correlation parameters leading to a value of compared to atomic values. For the correlation parameters, which are screened less effectively De Groot et al. (1994), we use a decreased value of of atomic values. We report the expected RIXS spectrum within the intra- excitation region in Fig. 4(c). The dominant low-energy -excitations in the experimental polarization conditions are expected to arise near the : with energy ( meV240 meV), rather than the much higher energy excitations observed ( eV).
We find that increasing the Slater integral scaling above of atomic values leads to a loss of agreement with experiment, due to an overestimation of the multiplet effects for oxides (see Appendix B and Ref. Hu et al., 2000). The primary effect is the loss of the characteristic double-peaked structure of the XAS spectrum at both the / edges, due to a strong mixing between the and intermediate state resonances. Furthermore, we find a low sensitivity of the XAS/RIXS spectra to the intermediate state correlation scaling, which is due to the larger relative intermediate-state spin-orbit splitting between the edges compared to TM edges De Groot et al. (1994). This also implies only small quantitative differences between spectra at the and the edges. We therefore fix the correlation parameters as typical values for Ru4+ ions De Groot et al. (1994) and further explore the multiplet spectrum as the symmetry is reduced to and report our results in Fig. 4(d). The multiplet energies are plotted with respect to the effective total angular momentum singlet ground state as a function of increasing CF parameter [see Fig. 4(b)], raising the orbitals above the state. The dominant excitations in the RIXS spectra are identified as transitions to two doublets with (thick red line, - spin magnetic quantum number) and (thick blue line, - orbital magnetic quantum number), which are split from a triplet and quintet in symmetry, respectively Gretarsson et al. (2019). The remaining multiplets have substantially lower RIXS intensity. The RIXS spectrum for the endpoint ( eV) is plotted in Fig. 4(e). We find that the dominant higher-energy intra- multiplet excitation ( doublet) is determined by the CF energy scale once the splitting exceeds the SOC coupling scale. In contrast the low-energy, doublet excitation becomes very low in energy, meV for eV. We conclude from these experimentally-accessible multiplet excitations that a large CF splitting in the sector is required to reproduce the high intra- excitation energy observed in RIXS experiment. With the introduction of this CF component, the orbital energetics become dominantly determined by the CF as opposed to the SOC. This is in contrast to the model, where SOC is the only interaction breaking the degeneracy.
For the and models in Fig. 4(c,e), respectively, we also report the expected XAS spectra in Fig. 4(f,g), respectively. The -edge in each case is multiplied by 2 in intensity to highlight deviations from the statistical branching ratio (BR). This model leads to a very large BR , far in excess of the experimental value of 2.15 Hu et al. (2000). On the other hand, the model maintains the double-peaked structure at both edges along with a substantial decrease in the BR to , closer to experiment. Physically, the BR is related to the expectation value of the spin-orbit operator, , in the ground state Thole and Van Der Laan (1988); Clancy et al. (2012). In symmetry with eV, this expectation value is large for the ground state ( eV) while it is substantially lower in the low-lying doublet ( eV). Therefore, admixture of the doublet into the ground state by covalency/superexchange interactions may provide further reduction of the BR, while also endowing a finite magnetic moment at Ru sites. This is a known essential feature for understanding magnetism in Ru4+ -systems with the formal singlet (non-magnetic) ground state Khaliullin (2013).
III.2 symmetry
With this information in hand, we turn to the optimization of the CF parameters in the full symmetry with respect to the experimental results. We begin within the same multiplet model, with meV and / correlation scaling of / atomic values, respectively. We further employ the constraint that , which ensures a splitting between the unoccupied and states of eV in accordance with the Ru and ligand (O ) XAS (Fig. 2). An optimal agreement is found with the parameters eV, eV and eV. The simulated RIXS spectra at the and resonances in the multiplet model are compared to the experimental data in Fig. 4(h,i) (dashed grey lines), respectively. We broadened the calculations by a Lorentzian of linewidth eV to highlight the individual excitations. We find a much better agreement at the intra- excitation region compared to a near octahedral model and a consistent behavior at the - excitation region.
In Fig. 4(h,i), we also report an equivalent model of CF transitions within the single particle approximation (SPA), shown as solid black lines. These calculations are simulated by assuming the same CF parameters as the symmetry multiplet model, with a corresponding single-particle energy diagram of Fig. 4(b). The SPA model is calculated with the intra-atomic Slater integrals set to zero and a simulated spin-triplet ground state, with a filling of to agree with the shell filling known from first-principles calculations Mattheiss (1976); Berlijn et al. (2017). The necessity to impose this ground state implies that RuO2 is moderately correlated, due to the Hund’s coupling that is required to stabilize the appropriate electron filling. This assignment is in general agreement with transport and band-structure studies, which reveal only modest deviations due to electron-electron interactions Glassford and Chelikowsky (1994); Ruf et al. (2020). The use of the SPA calculations is employed here as a minimal model to capture the dominant CF interactions in the determination of the core-level spectra. This eases the interpretation of the spectral features, as discussed below.
With the SPA, we find an improved consistency compared to the multiplet model with respect to the high bandwidth of the - resonance and also a lack of the low-energy singlet doublet transitions meV which are not resolved within experiment. The SPA is a more natural description provided the distinct incident energy dependence, wherein higher energy excitations resonate at higher incident energies (Fig. 3) as well as for understanding the similar RIXS spectra available from metallic rutile-phase oxides, discussed in more details below.
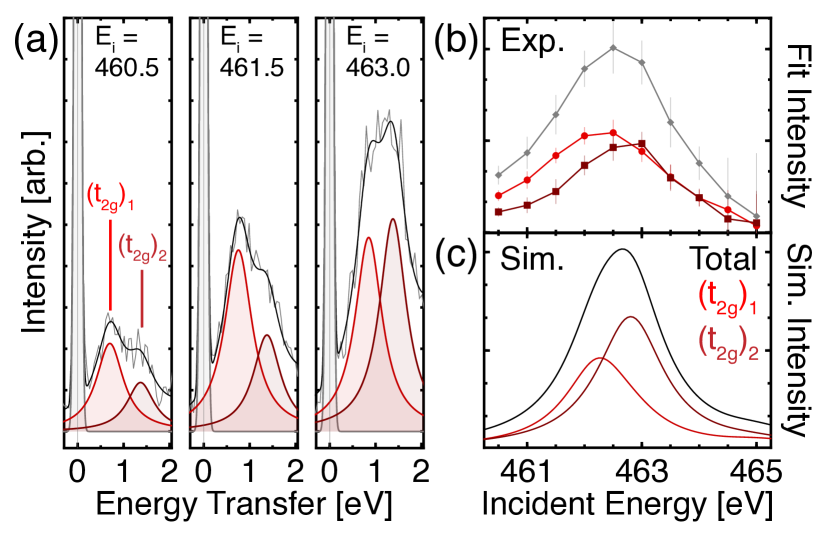
To further examine the SPA interpretation in the context of RuO2, we highlight the doublet structure at the intra- RIXS resonance reported in Fig. 5, where fits reveal a different resonant behavior of the two components (see Appendix A). We interpret these features as excitations, labelled as in Fig. 5, respectively. The near-equal RIXS cross-section of these features is associated with the same (half-filled) occupancy of the orbitals. We particularly note that the splitting of the features in the energy transfer axis [Fig. 5(a)] is nearly equal to the splitting of their resonances along the incidence energy axis [Fig. 5(b)], a behavior consistent with the SPA model of -transitions between CF levels [Fig. 5(c)]. This incident energy dependence and a splitting on this energy scale is difficult to justify in the higher symmetry CF models [Fig. 4]. These peak energies were used to fix the intra- CF parameters in the models above to eV and eV. The consideration of the experimental polarization condition confirms the level ordering in Fig. 4(b), in agreement with ab-initio predictions Mattheiss (1976). In particular, we have , matching the expected destabilization of the -bonding orbitals with respect to the non-bonding state Sorantin and Schwarz (1992).
III.3 Interpretation of crystal field parameters
The local projection of the CF components () in RuO2, as deduced from our RIXS measurements, are large compared to typical values in distorted octahedral environments commonly encountered in perovskite oxides. In general, the CF splitting experienced in a solid can be decomposed into an ionic contribution, due to the symmetry of the local coordination of TM sites, and a covalent contribution due to the hybridization strength of the TM with the neighboring ligands Haverkort et al. (2012); Ushakov et al. (2011); Scaramucci et al. (2015). We attribute these large CF contributions to the inherent difference in the bonding properties amongst the orbitals, and therefore to a highly anisotropic covalent CF contribution. Evidence for this situation is provided by the large bonding anisotropy amongst the orbitals as revealed by the large dichroism as the O pre-edge (Fig. 2(a)).
The appearance of a large CF splitting has been previously noted in the XAS spectrum of isostructural, rutile TiO2 de Groot et al. (1990) which was later attributed to a band structure effect appearing only for cluster sizes exceeding a full coordination of neighboring octahedra Krüger (2010). The necessity for cluster sizes beyond the local MO6 octahedron (M transition metal) to explain the full CF effects in rutile oxides can be equivalently viewed as introducing competition for bonding with shared O: orbitals between neighboring TM sites. Therefore, we suggest that there is additional anisotropy in the covalent CF contribution beyond that suggested by the local environment alone which is the origin of the large intra- energy between the non-bonding and -bonding active / orbitals, related to longer-range structural symmetry of the rutile lattice. Finally, we note that through the interaction with bosonic excitations in the system (e.g. phonons Lee et al. (2014)), the -excitations can be broadened and shifted to apparently higher energy-transfer in RIXS spectra. Therefore, the orbital energies resolved in our RIXS experiments should be interpreted to represent an upper bound for the energies of the bare CF levels.
IV Discussion
IV.1 Implications for RuO2
From our evidence, we are able to fill in a gap concerning the electronic structure of RuO2. Overall, the spectra are characterized by a high-energy transfer intra- resonance and a higher energy - excitation, indicating that SOC alone is insufficient for a quantitative interpretation of the RIXS data. This directly supports a reduced-symmetry crystal field mechanism, as we have resolved in the model of Fig. 4(h,i). However, one has to be careful as the dominance of the low symmetry splitting does not naturally imply the irrelevance of SOC. While our measurements reveal that the CF dominates the effects of SOC in the determination of the local energy levels, the rutile structure hosts symmetry-protected band degeneracies (due to crystalline symmetries between sublattices) which are split only by SOC Sun et al. (2017); Jovic et al. (2018). Therefore, SOC may have dramatic effects on transport properties (e.g. spin Hall conductivity) while playing only a modest role in the locally-probed orbital structure. The lack of identification of these states in RIXS may derive from their itinerant/delocalized nature which would produce incoherent fluorescence rather than sharp excitations.
Beyond SOC, the importance of the space and local point group symmetries has been discussed in several contexts, including the possible crystal Hall effect Šmejkal et al. (2020). The effect of this reduced symmetry in our model shall be further used to refine the interpretation of the spectral lineshape in resonant diffraction experiments Zhu et al. (2019); Hirata et al. (2013) along with its connection to magnetic order. Furthermore, the orbital energetics in connection to the lattice symmetry are of particular importance for interpreting the mechanism of strain-induced superconductivity in thin films of RuO2, whether due to modulation of the electronic structure Ruf et al. (2020), lattice instability/enhanced electron-phonon coupling Uchida et al. (2020), or both. The local -orbital level energies have a direct connection to particular Ru-O and Ru-Ru bond strengths within a molecular bonding interpretation Goodenough (1971a); Sorantin and Schwarz (1992) making the system prone to modification of lattice parameters through strain. Our work directly supports this molecular orbital picture. The Ru-O hybridization yields significant bonding anisotropy and breaks orbital degeneracies, the effects of which are directly probed by our measurements through their projection onto both the O- and Ru- states as measured through O- XAS and Ru- XAS/RIXS, respectively. Therefore, the experiments presented here are needed to assess the modification of the orbital energies under external perturbation such as strain.
IV.2 Comparison among metallic states in rutile oxides
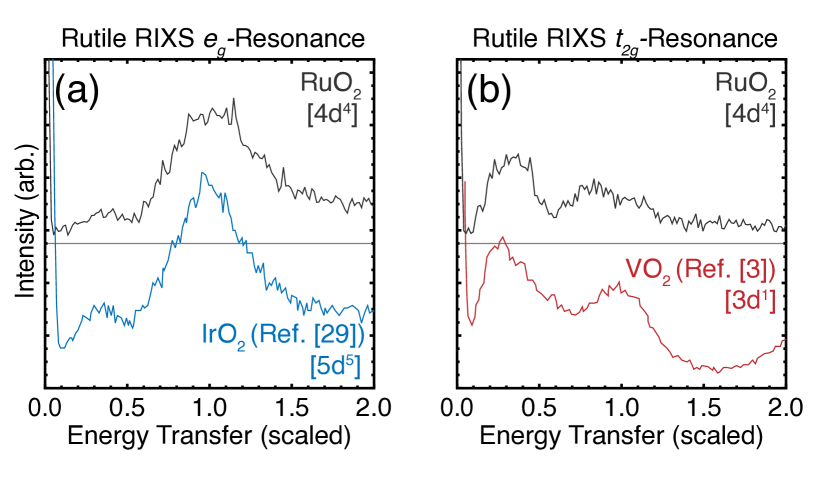
It is worth mentioning the similarity among the RIXS spectra in the metallic phase of the rutile oxides VO2, RuO2, and IrO2 He et al. (2016); Kim et al. (2018). The available RIXS data for VO2 He et al. (2016) and IrO2 Kim et al. (2018) are near the / final-state resonances of the V/Ir edges, respectively. These are compared to the Ru -edge scans at the corresponding resonances (: eV, : eV) in Fig. 6. The energy-transfer axes for the RIXS spectra in Fig. 6 are normalized by the respective energies of the high-energy -excitation. The increase of the -excitation energies across the V/Ru/Ir series is attributed to larger radial extension of higher orbitals and the resulting increase in CF energy scales Khomskii and Streltsov (2020). In all cases, we find the spectra are characterized by a high-energy transfer intra- excitation and a higher-energy - excitation, all with similarly broad -excitation linewidth. This is irrespective of the distinct // nature of each system and, therefore, the broad range of SOC strength [meV (V), meV (Ru), meV (Ir)]. Given the smooth energetic trend of the intra- and the - features across all systems, SOC alone is insufficient for a quantitative interpretation of the data. This directly supports a common reduced-symmetry CF mechanism in all cases, as we have unambiguously resolved in the model of Fig. 4(h,i), consistent with the interpretation in VO2 He et al. (2016).
The consistency of the spectra also spans a wide range of formal -electron count ( for V-Ru-Ir), which have dramatically distinct multiplet structures that are not clearly reflected in experiments. This strengthens the SPA interpretation of -excitations between CF levels introduced in the modelling above. The single-particle behavior may derive from the itinerancy of the higher-energy -orbitals - except the non-bonding level - in rutile systems. This characteristic mixture of localized/itinerant electronic states may lead to a spectrum of partial excitations, where the emission stage of the coherent RIXS process is only active from the state, which forms a sharp peak in the occupied density of states Berlijn et al. (2017). In this case, other pathways would be expected to be dominated by incoherent decay channels between broad, itinerant bands resulting in an unresolvable continuum of particle-hole excitations Monney et al. (2012, 2020). Such a contribution is potentially evidenced by the reduction of quasi-elastic spectral weight in the RIXS spectrum of VO2 when crossing the MIT He et al. (2016) which is concomitant with an enhanced orbital polarization Haverkort et al. (2005). This scenario would explain well the apparent lack of intra-atomic correlation effects in rutile RIXS spectra as in our supported model of Fig. 4(h,i). Importantly, this model traces the characteristic RIXS response in rutile oxides to the inherent orbital anisotropy of the rutile structure and the the differential degree of covalent CF splitting among the orbital states, providing additional support for our interpretation here for RuO2.
V Conclusion
In conclusion, we have measured Ru edge RIXS and O -edge XAS linear dichroism in RuO2. Through the detection of the -excitation spectrum and multiplet modelling, our results firmly establish the dominance of low-symmetry crystal field in the local electronic structure. This hierarchy is tightly bound to the rutile structure and its octahedral distortions and connectivity which indicates the need for a different treatment than conventional perovskite-based Ru compounds (such as Srn+1RunO3n+1). In RuO2, the intermediate nature of the Ru configuration highlights characteristic features of the RIXS spectra in rutile oxides, corroborating the universal role of the unique and often overlooked crystal field levels across the rutile family. This represents a key discovery in the interplay of SOC and low-symmetry CF in / oxides and is an essential step toward resolving the mechanisms of the novel physical properties (including the recently discovered superconductivity) in RuO2.
Acknowledgements.
We gratefully acknowledge Robert Green and Frank de Groot for insightful discussions. Work at MIT was supported by the Air Force Office of Scientific Research Young Investigator Program under grant FA9550-19-1-0063. Work at Brookhaven National Laboratory was supported by the DOE Office of Science under Contract No. DE-SC0012704. This work was supported by the U.S. Department of Energy (DOE) Office of Science, Early Career Research Program. This work was supported by the Laboratory Directed Research and Development project of Brookhaven National Laboratory No. 21-037. The work at Argonne National Laboratory (crystal synthesis and pre-characterizations) was supported by the U.S. Department of Energy, Office of Science, Basic Energy Sciences, Materials Science and Engineering Division. This research used beamline 2-ID of the National Synchrotron Light Source II, a U.S. Department of Energy (DOE) Office of Science User Facility operated for the DOE Office of Science by Brookhaven National Laboratory under Contract No. DE-SC0012704.Appendix A Fit Results for Experimental Data
The incident energy dependent RIXS spectra presented in the main text were fit to a model consisting of a Gaussian elastic line, 2 Lorentzian curves in the intra- region, 4 Lorentzian curves in the multi-peaked energy region and a broader Lorentzian feature above eV energy transfer. The identification of two excitations at the intra- region is motivated by (i) the clear transfer of spectral weight to higher energy transfer at higher incident energies above the resonance [Fig. 2 c)], and (ii) the clearly resolved double peak structure for incident energies below the final state resonance [ eV, see in particular Fig. 5 (b)]. Due to the large core-hole broadening (- eV) along the incident energy axis, the double peaked structure must persist over a broad range of incident energies. Therefore, the same model was employed to fit all incident energies with the same initial values and parameter restrictions, with freedom in the energy transfer position and amplitude. The linewidth of the intra- Lorentzians were restricted to be equal, with a similar restriction for the peaks.
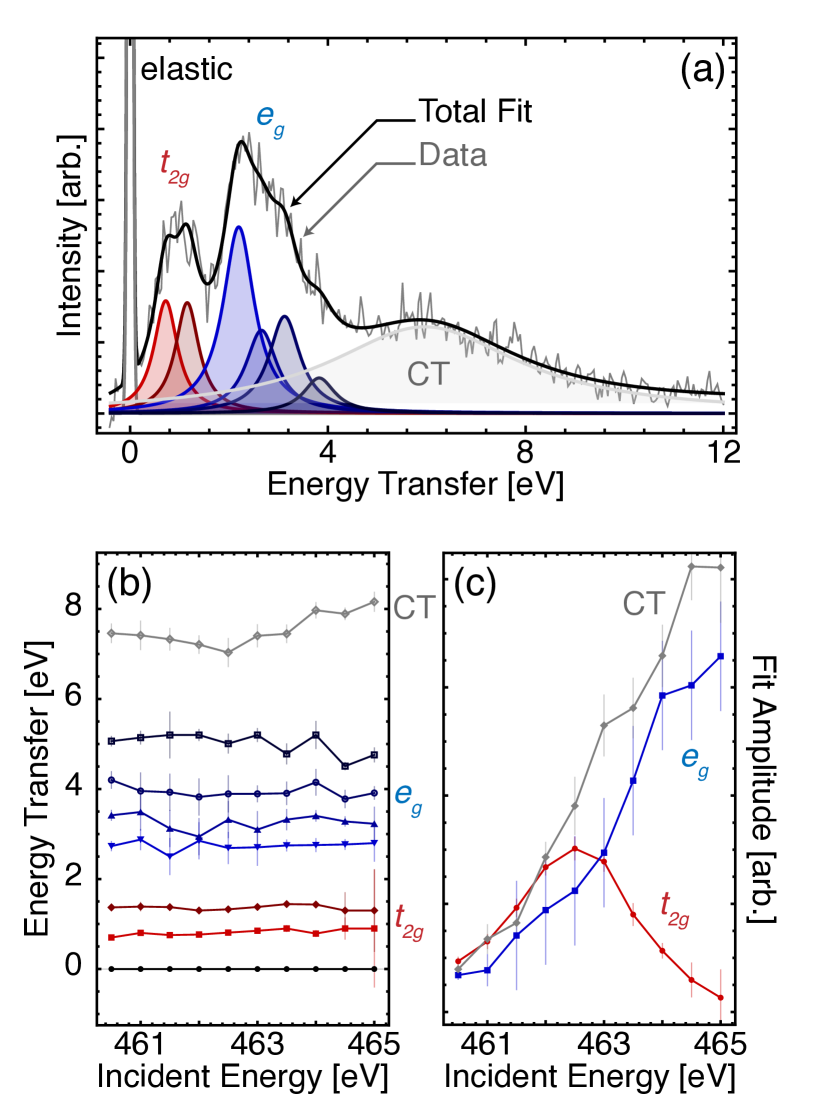
The supported crystal field model with reduced symmetry described in the main text [Fig. 4(h,i)] predicts additional peaks in the region (2.0 to 5.2 eV energy transfer), which are not immediately resolvable in the data due to linewidths significantly in excess of the measurement resolution and overlap in energy transfer. Despite not being able to resolve all spectral features, we attempt to fit this energy loss region using the minimal number of curves and present the resulting energy positions in Fig. 7(b). Such energy positions in this energy window must be interpreted keeping in mind the limitations of the data, set by the intrinsically broad linewidth of the -excitations. A representative fit for eV is shown in Fig. 7(a). The fit full width at half maximum (FWHM) of the elastic line is meV, and nearly constant as a function of incident energy. We therefore conclude that the elastic line in the experimental data is completely dominated by the diffuse scattering of the incident beam and we find no evidence of quasielastic signal in the measurement.
In Fig. 7(b), we summarize the peak positions in energy transfer versus incident energy for the individual contributions highlighted in Fig. 7(a). The intra- peaks are discussed in the main text. At the pre-edge region (eV), the fit suggests a Raman-like peak around eV, which begins to crossover to fluorescence-like behavior above eV. In Fig. 7(c), we display the intensity of the total intra-, , and charge transfer fits as a function of incident energy. As can be seen, the intensity of the charge transfer transition tracks closely with the increase of the intensity. Furthermore, the crossover point from Raman- to fluorescence-like behavior is concomitant with the resonance position of the intra- -excitation. The incident energy dependence from the fits for the and excitations agree well with the energy-transfer window integrations used for PFY analysis presented in Fig. 2 in the main text.
Appendix B Crystal Field Multiplet Calculations
Core-level X-Ray Absorption and Resonant Inelastic X-Ray Scattering spectra at the Ru -edge are calculated with crystal field multiplet calculations as implemented in the Quanty software Haverkort et al. (2014, 2012); Lu et al. (2014, 2019); Qua . The main idea of this approach is to model the system as atomic Ru4+, with modifications to the Hamiltonian to account for the effects of the crystalline environment de Groot and Kotani (2008). Such an approach permits an exact treatment of both multielectronic effects and the fully relativistic core-levels, both of which are essential for the description the / edges of transition metal systems De Groot et al. (1994); Haverkort et al. (2012). For the calculations considered here, we use a basis consisting of the Ru- shell (10 single-particle states: 5 -orbitals + spin up/down), occupied by the nominal four valence electrons. For calculations of spectra at the edge, involving a dipole transition between the Ru core-level and the Ru- level, we also include the Ru shell into the basis. The oxygen orbitals are not explicitly accounted for in the calculations. Instead, the crystalline environment is modeled through a single-electron crystal field contribution to the Hamiltonian which obeys the local site-symmetry (orthorhombic, ) of the Ru ions induced by the coordination of oxygen ligands in the rutile structure.
The multielectron ground state () is determined by exact diagonalization within the Ru shell, considering the SOC (), the crystal field and the intra-atomic electronic correlations amongst the electrons. The latter are parametrized through the Slater integrals: , , and . In the RIXS intermediate state (), there is an additional contribution that considers the Coulomb interaction between the core-hole and the valence electrons which are parametrized by the Slater and exchange integrals , and . These multielectron interactions are used as defined in the theory of atomic spectra Cowan (1981). For the calculation of both XAS and RIXS spectra, we consider dipole () transitions using dipole operators that reflect the experimental polarization conditions.
The crystalline environment of the Ru ions is modeled as a phenomenological average introduced through the crystal field, as well as a reduction (or screening) of both the and intra-atomic correlation parameters from atomic values. Such a screening of the electronic correlations from atomic values is a well-known procedure for calculating the core-level spectra of transition metal ions in crystalline environments De Groot et al. (1994); de Groot and Kotani (2008); Hu et al. (2000); Haverkort et al. (2012). In our case, we use screened values of the / Slater and exchange integrals to of atomic values, respectively. These values for the screened parameters represent an established parameter regime for transition metal oxides Hu et al. (2000); De Groot et al. (1994); Gretarsson et al. (2019). For the SOC, the atomic value for the Ru4+ ion ( meV) is used. We provide below in Table 1 the values of all parameters used for calculations at the edges, taken from the thesis of M. Haverkort Haverkort (2005) and the Crispy database Retegan (2019). These values represent the bare Hartree-Fock values.
| Init. State | - | |||
|---|---|---|---|---|
| Ru | 0.161 | 9.211 | 6.093 | - |
| Inter. State | ||||
| Ru | 14.999 | 4.971 | 1.060 | 1.071 |
The crystal field acting on the Ru 4d shell is introduced through a single-electron contribution to the Hamiltonian in both the ground and intermediate states which defines the single-particle energies for the different real 4d orbitals. Since the oxygen ligands are not explicitly accounted for in our calculations, the crystal field values assigned represent the total of the ionic and covalent contributions to the splittings Haverkort et al. (2014), which in general are separable based on the bare Coulomb contribution and the contribution due to hybridization Ushakov et al. (2011); Scaramucci et al. (2015), as discussed in the main text. We stress this fact so the parameters may be interpreted accordingly. For modelling the crystal field, we define a distinct set of parameters from typical approaches, which is more well-suited to the splittings observed in the rutile symmetry. First, is defined so that the states ( and ) are raised in energy , while the levels (, , ) are lowered by . As a note, the and are switched with respect to typical definitions of the and orbitals. This is due to the principle axes of the orthorhombic crystal field being oriented away from the standard axes [see Main Fig. 1(a)]. This is consistent to prior discussions of the orbital projections for rutile oxides, albeit sometimes with different notations Mattheiss (1976); Kahk et al. (2014); Ping et al. (2015); He et al. (2016). Further crystal field parameters are defined by for deviations from the octahedral symmetry. is the splitting between non-bonding and the -bonding orbitals, while is the splitting between the latter subspace. is defined as the splitting between the orbitals.
Overall the onsite energies are as thus, defined so that the average configuration energy is constant with respect to each parameter:
The optimized parameters for the crystal field model in Fig. 3(b) of the main text are eV and eV, restricted by the energy of the intra- doublet in the RIXS spectrum (main text Fig. 5 and Fig. 7), eV and eV, the latter being restricted by the unoccupied state splitting as suggested by the resonant energy dependence and the Ru /-edge/O -edge absorption profile. Our sensitivity to is less restrictive compared to other parameters, due to the many overlapping, broad peaks at the excitations. This parameter was optimized to best reproduce the broad bandwidth of the features without creating additional, lower-energy excitations of a nature that occur below the noticeable gap between the intra- and features around eV.
References
- Goodenough (1971a) J. B. Goodenough, Journal of Solid State Chemistry 3, 490 (1971a).
- Goodenough (1971b) J. B. Goodenough, Progress in Solid State Chemistry 5, 145 (1971b).
- He et al. (2016) H. He, A. X. Gray, P. Granitzka, J. W. Jeong, N. P. Aetukuri, R. Kukreja, L. Miao, S. A. Breitweiser, J. Wu, Y. B. Huang, P. Olalde-Velasco, J. Pelliciari, W. F. Schlotter, E. Arenholz, T. Schmitt, M. G. Samant, S. S. Parkin, H. A. Dürr, and L. A. Wray, Physical Review B 94, 161119 (2016).
- Hiroi (2015) Z. Hiroi, Progress in Solid State Chemistry 43, 47 (2015).
- Korotin et al. (1998) M. A. Korotin, V. I. Anisimov, D. I. Khomskii, and G. A. Sawatzky, Physical Review Letters 80, 4305 (1998).
- Fujiwara et al. (2013) K. Fujiwara, Y. Fukuma, J. Matsuno, H. Idzuchi, Y. Niimi, Y. Otani, and H. Takagi, Nature Communications 4, 2893 (2013).
- Sun et al. (2017) Y. Sun, Y. Zhang, C. X. Liu, C. Felser, and B. Yan, Physical Review B 95, 1 (2017).
- Sinova et al. (2015) J. Sinova, S. O. Valenzuela, J. Wunderlich, C. H. Back, and T. Jungwirth, Reviews of Modern Physics 87, 1213 (2015).
- Sorantin and Schwarz (1992) P. I. Sorantin and K. Schwarz, Inorganic Chemistry 31, 567 (1992).
- Mattheiss (1976) L. F. Mattheiss, Physical Review B 13, 2433 (1976).
- Glassford and Chelikowsky (1994) K. M. Glassford and J. R. Chelikowsky, Physical Review B 49, 7107 (1994).
- Lin et al. (2004) J. J. Lin, S. M. Huang, Y. H. Lin, T. C. Lee, H. Liu, X. X. Zhang, R. S. Chen, and Y. S. Huang, Journal of Physics Condensed Matter 16, 8035 (2004).
- Krasovska et al. (1995) O. V. Krasovska, E. E. Krasovskii, and V. N. Antonov, Physical Review B 52, 11825 (1995).
- De Almeida and Ahuja (2006) J. S. De Almeida and R. Ahuja, Physical Review B - Condensed Matter and Materials Physics 73, 1 (2006).
- Cox et al. (1986) P. A. Cox, J. B. Goodenough, P. J. Tavener, D. Telles, and R. G. Egdell, Journal of Solid State Chemistry 62, 360 (1986).
- Berlijn et al. (2017) T. Berlijn, P. C. Snijders, O. Delaire, H. D. Zhou, T. A. Maier, H. B. Cao, S. X. Chi, M. Matsuda, Y. Wang, M. R. Koehler, P. R. Kent, and H. H. Weitering, Physical Review Letters 118, 2 (2017).
- Ping et al. (2015) Y. Ping, G. Galli, and W. A. Goddard, Journal of Physical Chemistry C 119, 11570 (2015).
- Zhu et al. (2019) Z. H. Zhu, J. Strempfer, R. R. Rao, C. A. Occhialini, J. Pelliciari, Y. Choi, T. Kawaguchi, H. You, J. F. Mitchell, Y. Shao-Horn, and R. Comin, Physical Review Letters 122, 17202 (2019).
- Jovic et al. (2018) V. Jovic, R. J. Koch, S. K. Panda, H. Berger, P. Bugnon, A. Magrez, K. E. Smith, S. Biermann, C. Jozwiak, A. Bostwick, E. Rotenberg, and S. Moser, Physical Review B 98, 1 (2018).
- Šmejkal et al. (2020) L. Šmejkal, L. Šmejkal, L. Šmejkal, R. González-Hernández, R. González-Hernández, T. Jungwirth, T. Jungwirth, J. Sinova, and J. Sinova, Science Advances 6, 8809 (2020).
- Feng et al. (2020) Z. Feng, X. Zhou, L. Šmejkal, L. Wu, Z. Zhu, H. Guo, R. González-Hernández, X. Wang, H. Yan, P. Qin, X. Zhang, H. Wu, H. Chen, C. Jiang, M. Coey, J. Sinova, T. Jungwirth, and Z. Liu, arXiv preprint (2020), arXiv:2002.08712 .
- Ruf et al. (2020) J. P. Ruf, H. Paik, N. J. Schreiber, H. P. Nair, L. Miao, J. K. Kawasaki, J. N. Nelson, B. D. Faeth, Y. Lee, B. H. Goodge, B. Pamuk, C. J. Fennie, L. F. Kourkoutis, D. G. Schlom, and K. M. Shen, arXiv preprint (2020), arXiv:2005.06543 .
- Uchida et al. (2020) M. Uchida, T. Nomoto, M. Musashi, R. Arita, and M. Kawasaki, Physical Review Letters 125, 147001 (2020).
- Xu et al. (2019) X. Xu, J. Jiang, W. J. Shi, V. Süß, C. Shekhar, S. C. Sun, Y. J. Chen, S. K. Mo, C. Felser, B. H. Yan, H. F. Yang, Z. K. Liu, Y. Sun, L. X. Yang, and Y. L. Chen, Physical Review B 99, 195106 (2019).
- Kahk et al. (2014) J. M. Kahk, C. G. Poll, F. E. Oropeza, J. M. Ablett, D. Céolin, J. P. Rueff, S. Agrestini, Y. Utsumi, K. D. Tsuei, Y. F. Liao, F. Borgatti, G. Panaccione, A. Regoutz, R. G. Egdell, B. J. Morgan, D. O. Scanlon, and D. J. Payne, Physical Review Letters 112 (2014), 10.1103/PhysRevLett.112.117601.
- Hu et al. (2000) Z. Hu, H. von Lips, M. Golden, J. Fink, and G. Kaindl, Physical Review B 61, 5262 (2000).
- Hirata et al. (2013) Y. Hirata, K. Ohgushi, J. I. Yamaura, H. Ohsumi, S. Takeshita, M. Takata, and T. H. Arima, Physical Review B 87, 161111 (2013).
- Clancy et al. (2012) J. P. Clancy, N. Chen, C. Y. Kim, W. F. Chen, K. W. Plumb, B. C. Jeon, T. W. Noh, and Y. J. Kim, Physical Review B 86, 195131 (2012).
- Kim et al. (2018) Y.-J. Kim, J. P. Clancy, H. Gretarsson, G. Cao, Y. Singh, J. Kim, M. H. Upton, D. Casa, and T. Gog, arXiv preprint (2018), arXiv:1805.03612 .
- de Groot and Kotani (2008) F. de Groot and A. Kotani, Core Level Spectroscopy of Solids (CRC Press, 2008) pp. 1–491.
- Moretti Sala et al. (2011) M. Moretti Sala, V. Bisogni, C. Aruta, G. Balestrino, H. Berger, N. B. Brookes, G. M. De Luca, D. Di Castro, M. Grioni, M. Guarise, P. G. Medaglia, F. Miletto Granozio, M. Minola, P. Perna, M. Radovic, M. Salluzzo, T. Schmitt, K. J. Zhou, L. Braicovich, and G. Ghiringhelli, New Journal of Physics 13, 043026 (2011).
- Bisogni et al. (2016) V. Bisogni, S. Catalano, R. J. Green, M. Gibert, R. Scherwitzl, Y. Huang, V. N. Strocov, P. Zubko, S. Balandeh, J. M. Triscone, G. Sawatzky, and T. Schmitt, Nature Communications 7, 13017 (2016).
- Sala et al. (2014) M. M. Sala, K. Ohgushi, A. Al-Zein, Y. Hirata, G. Monaco, and M. Krisch, Physical Review Letters (2014), 10.1103/PhysRevLett.112.176402.
- Suzuki et al. (2019) H. Suzuki, H. Gretarsson, H. Ishikawa, K. Ueda, Z. Yang, H. Liu, H. Kim, D. Kukusta, A. Yaresko, M. Minola, J. A. Sears, S. Francoual, H. C. Wille, J. Nuss, H. Takagi, B. J. Kim, G. Khaliullin, H. Yavaş, and B. Keimer, Nature Materials 18, 563 (2019).
- Gretarsson et al. (2019) H. Gretarsson, H. Suzuki, H. Kim, K. Ueda, M. Krautloher, B. J. Kim, H. Yavaş, G. Khaliullin, and B. Keimer, Physical Review B 100, 045123 (2019).
- Miedema et al. (2019) P. S. Miedema, N. Thielemann-Kühn, I. A. Calafell, C. Schüßler-Langeheine, and M. Beye, Physical Chemistry Chemical Physics 21, 21596 (2019).
- Wray et al. (2015) L. A. Wray, S.-W. Huang, I. Jarrige, K. Ikeuchi, K. Ishii, J. Li, Z. Q. Qiu, Z. Hussain, and Y.-D. Chuang, Frontiers in Physics 3, 32 (2015).
- Chiuzbăian et al. (2005) S. G. Chiuzbăian, G. Ghiringhelli, C. Dallera, M. Grioni, P. Amann, X. Wang, L. Braicovich, and L. Patthey, Physical Review Letters 95 (2005), 10.1103/PhysRevLett.95.197402.
- Lebert et al. (2020) B. W. Lebert, S. Kim, V. Bisogni, I. Jarrige, A. M. Barbour, and Y. J. Kim, Journal of Physics Condensed Matter 32, 144001 (2020).
- Lister et al. (2002) T. E. Lister, Y. Chu, W. Cullen, H. You, R. M. Yonco, J. F. Mitchell, and Z. Nagy, Journal of Electroanalytical Chemistry 524-525, 201 (2002).
- Dvorak et al. (2016) J. Dvorak, I. Jarrige, V. Bisogni, S. Coburn, and W. Leonhardt, Review of Scientific Instruments 87, 115109 (2016).
- Das et al. (2018) L. Das, F. Forte, R. Fittipaldi, C. G. Fatuzzo, V. Granata, O. Ivashko, M. Horio, F. Schindler, M. Dantz, Y. Tseng, D. E. McNally, H. M. Rønnow, W. Wan, N. B. Christensen, J. Pelliciari, P. Olalde-Velasco, N. Kikugawa, T. Neupert, A. Vecchione, T. Schmitt, M. Cuoco, and J. Chang, Physical Review X 8, 011048 (2018).
- Kim et al. (2016) W. J. Kim, S. Y. Kim, C. H. Kim, C. H. Sohn, O. B. Korneta, S. C. Chae, and T. W. Noh, Physical Review B 93, 045104 (2016).
- (44) C. Stagarescu, X. Su, D. Eastman, K. Altmann, and F. Himpsel, Physical Review B - Condensed Matter and Materials Physics 61, R9233.
- Thompson et al. (2009) Thompson, A. Thompson, D. Attwood, E. Gullikson, M. Howells, K.-J. Kim, J. Kirz, J. Kortright, I. Lindau, Y. Liu, P. Pianetta, A. Robinson, J. Scofield, J. Underwood, G. Williams, and H. Winick, “X-Rray Data Booklet,” (2009), arXiv:1509.01292 .
- Haverkort et al. (2014) M. W. Haverkort, G. Sangiovanni, P. Hansmann, A. Toschi, Y. Lu, and S. Macke, Europhysics Letters 108, 57004 (2014).
- Haverkort et al. (2012) M. W. Haverkort, M. Zwierzycki, and O. K. Andersen, Physical Review B 85, 1 (2012).
- Lu et al. (2014) Y. Lu, M. Höppner, O. Gunnarsson, and M. W. Haverkort, Physical Review B 90, 85102 (2014).
- Lu et al. (2019) Y. Lu, X. Cao, P. Hansmann, and M. W. Haverkort, Physical Review B 100, 115134 (2019).
- (50) “Quanty - a quantum many body script language.” .
- Rudowicz et al. (1992) C. Rudowicz, Z. Yi-Yang, and Y. Wan-Lun, Journal of Physics and Chemistry of Solids 53, 1227 (1992).
- Kim et al. (2008) B. J. Kim, H. Jin, S. J. Moon, J. Y. Kim, B. G. Park, C. S. Leem, J. Yu, T. W. Noh, C. Kim, S. J. Oh, J. H. Park, V. Durairaj, G. Cao, and E. Rotenberg, Physical Review Letters 101, 076402 (2008).
- Suzuki et al. (2020) H. Suzuki, H. Liu, J. Bertinshaw, K. Ueda, H. Kim, S. Laha, D. Weber, Z. Yang, L. Wang, H. Takahashi, K. Fürsich, M. Minola, B. V. Lotsch, B. J. Kim, H. Yavaş, M. Daghofer, J. Chaloupka, G. Khaliullin, H. Gretarsson, and B. Keimer, arXiv preprint (2020), arXiv:2008.02037 .
- Haverkort (2005) M. W. Haverkort, Thesis (2005), arXiv:0505214 [cond-mat] .
- De Groot et al. (1994) F. M. De Groot, Z. W. Hu, M. F. Lopez, G. Kaindl, F. Guillot, and M. Tronc, The Journal of Chemical Physics 101, 6570 (1994).
- Thole and Van Der Laan (1988) B. T. Thole and G. Van Der Laan, Physical Review B 38, 3158 (1988).
- Khaliullin (2013) G. Khaliullin, Physical Review Letters 111, 1 (2013), arXiv:1310.0767 .
- Ushakov et al. (2011) A. V. Ushakov, S. V. Streltsov, and D. I. Khomskii, Journal of Physics Condensed Matter 23, 445601 (2011).
- Scaramucci et al. (2015) A. Scaramucci, J. Ammann, N. A. Spaldin, and C. Ederer, Journal of Physics Condensed Matter 27, 175503 (2015).
- de Groot et al. (1990) F. M. F. de Groot, J. C. Fuggle, B. T. Thole, and G. A. Sawatzky, Physical Review B 41, 928 (1990).
- Krüger (2010) P. Krüger, Physical Review B - Condensed Matter and Materials Physics 81 (2010), 10.1103/PhysRevB.81.125121.
- Lee et al. (2014) J. J. Lee, B. Moritz, W. S. Lee, M. Yi, C. J. Jia, A. P. Sorini, K. Kudo, Y. Koike, K. J. Zhou, C. Monney, V. Strocov, L. Patthey, T. Schmitt, T. P. Devereaux, and Z. X. Shen, Physical Review B - Condensed Matter and Materials Physics 89, 1 (2014), arXiv:1312.2639 .
- Khomskii and Streltsov (2020) D. I. Khomskii and S. V. Streltsov, arXiv (2020), arXiv: 2006.05920.
- Monney et al. (2012) C. Monney, K. J. Zhou, H. Cercellier, Z. Vydrova, M. G. Garnier, G. Monney, V. N. Strocov, H. Berger, H. Beck, T. Schmitt, and P. Aebi, Physical Review Letters (2012), 10.1103/PhysRevLett.109.047401.
- Monney et al. (2020) C. Monney, M. Herzog, A. Pulkkinen, Y. Huang, J. Pelliciari, P. Olalde-Velasco, N. Katayama, M. Nohara, H. Takagi, T. Schmitt, and T. Mizokawa, Physical Review B 102, 85148 (2020).
- Haverkort et al. (2005) M. W. Haverkort, Z. Hu, A. Tanaka, W. Reichelt, S. V. Streltsov, M. A. Korotin, V. I. Anisimov, H. H. Hsieh, H. J. Lin, C. T. Chen, D. I. Khomskii, and L. H. Tjeng, Physical Review Letters 95 (2005), 10.1103/PhysRevLett.95.196404.
- Cowan (1981) R. D. Cowan, The Theory of Atomic Structure and Spectra (University of California Press, 1981).
- Retegan (2019) M. Retegan, “Crispy: v0.7.3,” (2019).