An Interpretable Algorithm for Uveal Melanoma Subtyping from Whole Slide Cytology Images
Abstract
Algorithmic decision support is rapidly becoming a staple of personalized medicine, especially for high-stakes recommendations in which access to certain information can drastically alter the course of treatment, and thus, patient outcome; a prominent example is radiomics for cancer subtyping. Because in these scenarios the stakes are high, it is desirable for decision systems to not only provide recommendations but supply transparent reasoning in support thereof. For learning-based systems, this can be achieved through an interpretable design of the inference pipeline. Herein we describe an automated yet interpretable system for uveal melanoma subtyping with digital cytology images from fine needle aspiration biopsies. Our method embeds every automatically segmented cell of a candidate cytology image as a point in a 2D manifold defined by many representative slides, which enables reasoning about the cell-level composition of the tissue sample, paving the way for interpretable subtyping of the biopsy. Finally, a rule-based slide-level classification algorithm is trained on the partitions of the circularly distorted 2D manifold. This process results in a simple rule set that is evaluated automatically but highly transparent for human verification. On our in house cytology dataset of 88 uveal melanoma patients, the proposed method achieves an accuracy of that compares favorably to all competing approaches, including deep “black box” models. The method comes with a user interface to facilitate interaction with cell-level content, which may offer additional insights for pathological assessment.
WSI short=WSI, long=whole slide image, foreign-plural= \DeclareAcronymFNAC short=FNAC, long=Cytology of Fine Needle Aspirates, foreign-plural= \DeclareAcronymFNAB short=FNAB, long=Fine Needle Aspiration Biopsy, foreign-plural= \DeclareAcronymGEP short=GEP, long=Gene Expression Profile, foreign-plural= \DeclareAcronymUM short=UM, long=Uveal Melanoma, foreign-plural= \DeclareAcronymROI short=ROI, long=Region of Interest, foreign-plural= \DeclareAcronymmAP short=mAP, long=Mean Average Precision, foreign-plural= \DeclareAcronymIoU short=IoU, long=Intersection-Over-Union, foreign-plural= \DeclareAcronymHCI short=HCI, long=Human Computer Interaction, foreign-plural= \DeclareAcronymSVM short=SVM, long=Support Vector Machine, foreign-plural=
1 Introduction
UM is the most common primary intraocular malignancy in adults (Singh et al., 2011). As standard care for \acUM, \acFNAB is often performed to confirm the diagnosis and enable \acUM prognostication. To this end, a molecular test, \acGEP, is performed and microscopic Cytology of Fine Needle Aspirates images are created from the biopsy. According to a recent study, there exist two subtypes in \acUM that can be identified based on its \acGEP: The first subtype exhibits low metastatic risk, while the second subtype has been linked to high metastatic risk. There is a stark contrast in long-term survival between the two classes: the 92-month survival probability in class 1 patients is 95%, versus 31% in class 2 patients (Onken et al., 2004). It is evident that access to \acUM subtype information is critical for proper management of patients by providing appropriate recommendation for metastasis surveillance. However, even after 10 years of development, \acGEP is still only available in the United States. The technique is also expensive and has a long turn around time. A more accessible test for \acUM subtyping is, therefore, highly desirable.
There is increasing evidence that the underlying genetic profile affects cancer growth on multiple scales. Radiomics, for example, exploits this observation to develop imaging-derived biomarkers that are informative for prognosis (Grossmann et al., 2017). In the particular case of \acUM prognostication, there is huge potential in using imaging-derived biomarkers to determine \acGEP subtype and metastatic risk directly from cytology slides. While it is impossible even for highly trained pathologists to derive this information from cytology images, learning-based algorithms that discover associations between intensity patterns in cytology images and \acGEP subtype are promising (Liu et al., 2020; Chen et al., 2020). However, as “black box” models that perform a super-human task, these algorithms do not offer insights beyond the final recommendation to the human decision makers, which has been linked to automation bias and over-trust or dis-trust in such systems (Nourani et al., 2020; Gaube et al., 2021). A more transparent algorithm design may enable humans to better calibrate their trust in the recommendation, which would be an important feat for high-stakes decision making.
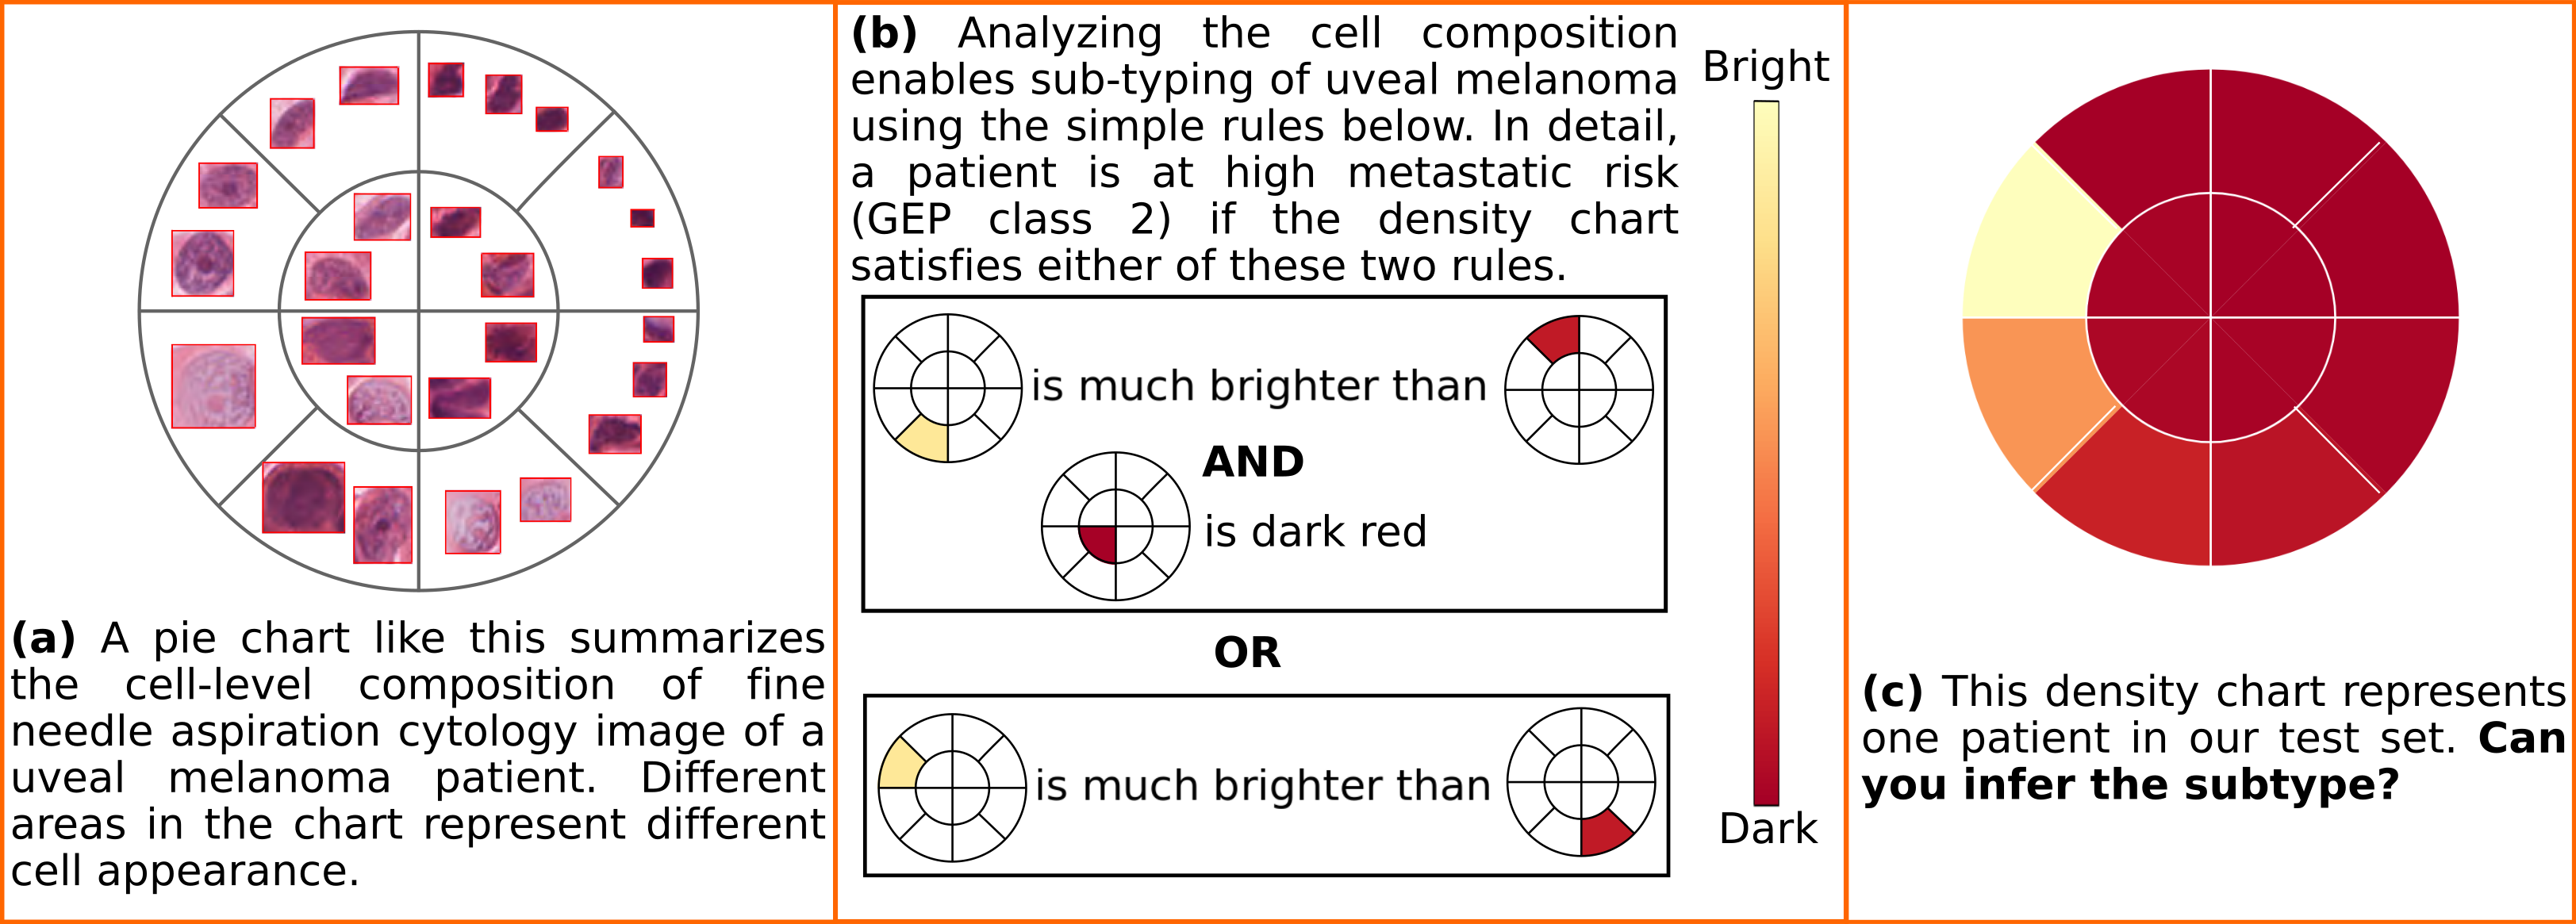
In this paper, we develop an automatic system for interpretable \acUM subtype classification from cytology images. The method is based on the idea that biopsy samples of the two \acUM subtypes should differ in overall cell composition. Thus, an algorithm that enables high level, rule-based reasoning on the cell composition of the sample, would be interpretable and could easily be verified by human users. To create this algorithm, we have developed automated methods for cell instance segmentation in cytology images from weak supervision, techniques to aggregate and represent whole slide-level cell appearance information in an intuitive embedding space, and rule-based classification algorithms to infer \acUM subtype from this representation. Figure 1 provides a concise overview of the user-facing side of the method. Because subtyping now amounts to evaluating simple instructions, the rule-based system is highly transparent and offers insight into whether a specific sample “barely” or “strongly” obeys the rules, which may enable calibration of trust in the system. The present manuscript details the technical developments that were necessary to devise this system, and our future work will focus on human factors, including trust and over-reliance issues, in this high-stakes, high-knowledge imbalance scenario.
2 Related work
The high resolution and complexity of \acpWSI make cell-level annotations difficult or impossible to obtain, which is why many of the annotated datasets are limited to slide-level labels that correspond to the overall diagnosis. However, standard automatic cancer subtyping and analysis in \acpWSI is based on multiple small regions extracted from slides, that then need to be aggregated to a single prediction on the slide level. These methods include majority voting, coarse-to-fine techniques (Liu et al., 2017; Hou et al., 2016; Xu et al., 2017; Zhang et al., 2020), and multiple instance learning approaches (Chikontwe et al., 2020; Campanella et al., 2019). While most of the deep learning approaches in \acpWSI analysis consider black box models, recent works attempt to introduce features that enhance model understanding by mimicking the decision process of pathologists. For instance, content-based histopathological image retrieval (Peng et al., 2019; Hegde et al., 2019) contrasts a query image with a large database to determine the search results with more similar histological features. Making intelligent systems interpretable is another frontier in developing trustworthy medical decision support applications (Rudin, 2019). In contrast to explainable models that rely on post hoc analysis, interpretable models aim to explain the reasoning behind a prediction. In a histopathologic context, patch-based regions visualizations introduced in (Pirovano et al., 2020) display features related to tumor tissue, in addition to providing slide-level heatmaps that improve \acWSI classification. Different from previous methods that attempt to provide human-meaningful visualizations, either from learned representations or image retrieval, our method is interpretable by nature.
3 Method
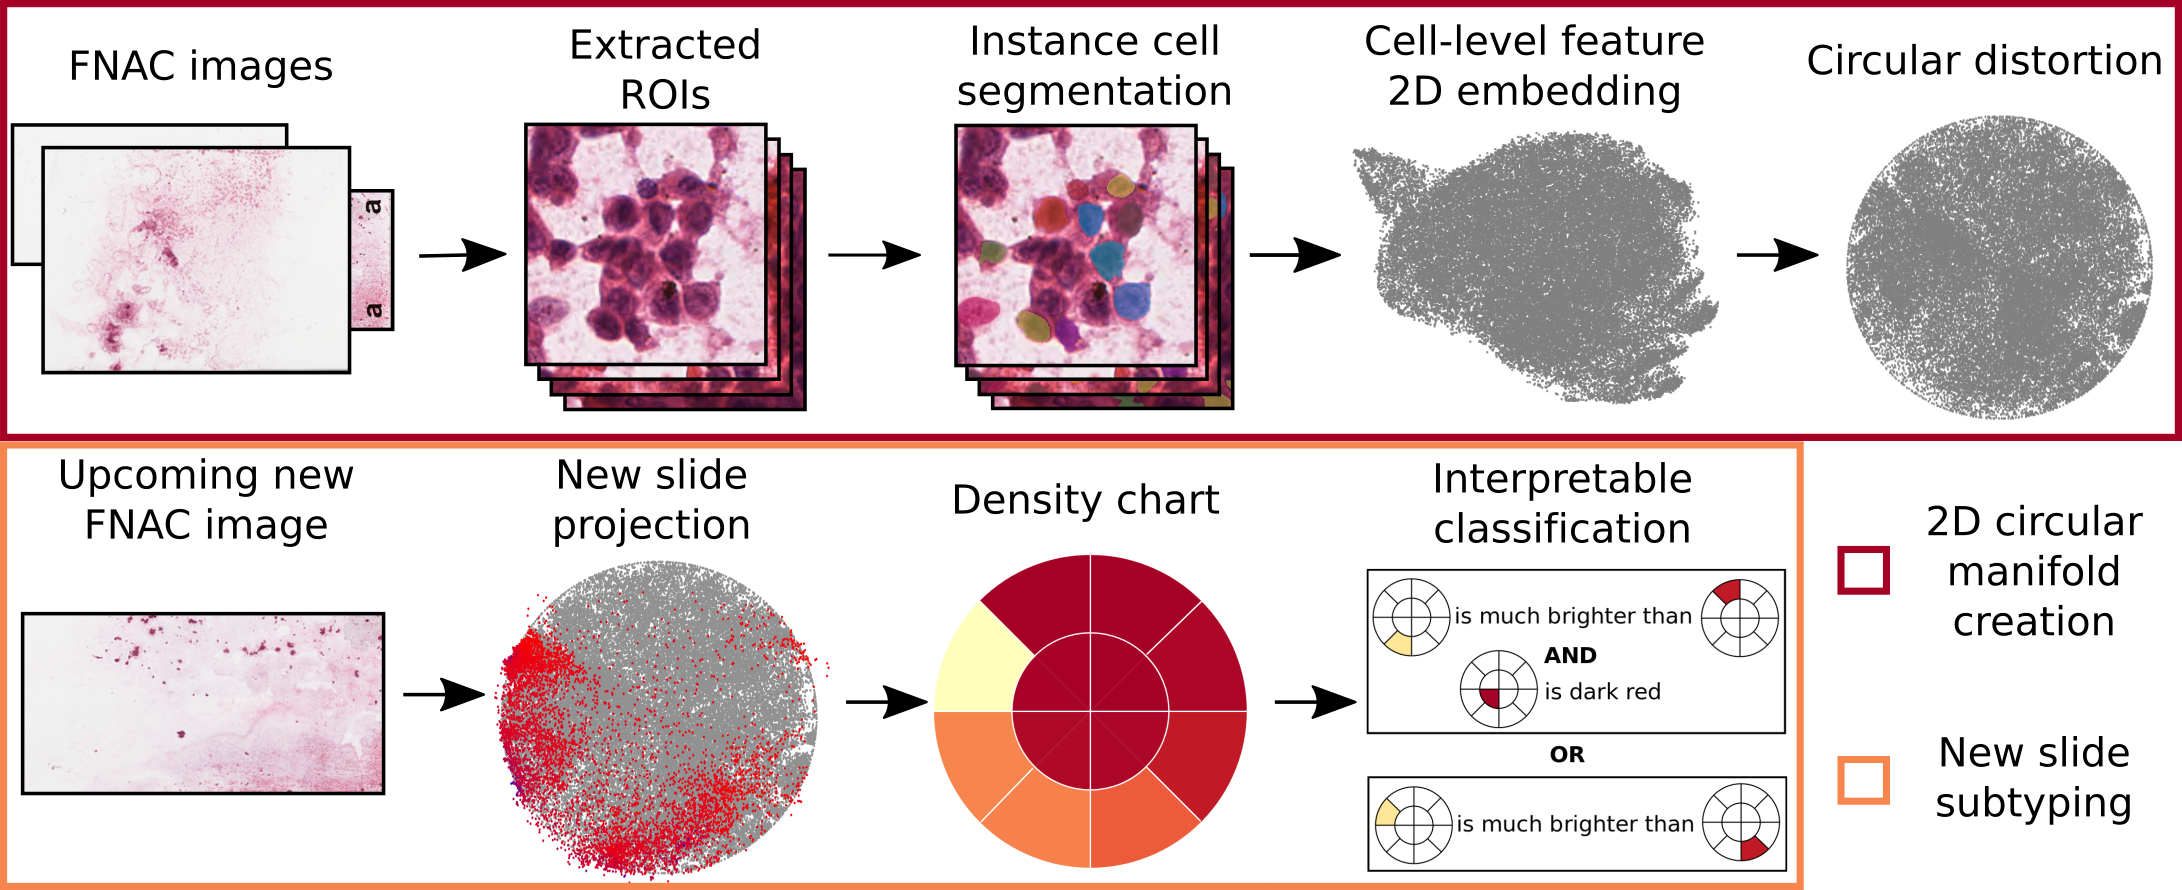
Given high-quality \acpROI extracted from cytology images, we create an interpretable system to analyze \acUM biopsy cytology and reveal \acGEP subtype based on overall cell composition of the sample. Our learning-based system comprises of three parts: 1) instance-level cell segmentation, 2) cell feature embedding, and 3) interpretable classification. We note that the specifics of each component may easily be replaced by other techniques since aspects pertaining to the exact method choice are not the main focus of our work. In the remainder of this chapter, we describe a cost-efficient way of weakly labeling our dataset to enable supervised learning of the cell segmentation network (Section 3.2). Cell-level features are then generated and embedded into a 2D space for further classification as described in Section 3.3. Finally, we define an interpretable classification model within the 2D space to distinguish \acUM \acGEP classes by cell composition (Section 3.4). The system overview is shown in Figure 2.
3.1 Considerations around interpretability
Before we introduce the technical details of the proposed method, we first frame our model in the current interpretability definition. As proposed in (Murdoch et al., 2019), interpretable machine learning is defined to be the use of machine-learning models for the extraction of relevant knowledge about domain relationships contained in data. Knowledge is considered to be relevant if it provides insight for a particular audience into a chosen domain problem. Our proposed method aims to provide an interpretable model for \acUM \acGEP classification to pathologists, who already possess substantial expertise in reading cytology slides. Indeed, clinicopathologic features of \acUM tumors, e. g. epithelioid cell type and aggressiveness of cancer cells, can be readily estimated from cytology images and have been associated with worse patient prognosis and a higher incidence of metastatic disease (Worley et al., 2007). These risk factors are widely used by pathologists, however, their accuracy to predict metastatic potential has been shown to be limited (Schopper & Correa, 2016). Our interpretability mechanism is motivated by the fact that clinicopathologic features of \acUM tumors, e. g., cell appearance, are relevant knowledge for pathologists to predict \acUM metastatic risk. Instead of building interpretable models with the clinicopathologic information manually extracted by pathologists themselves, our system automatically extracts clinicopathologic features (cell appearance features) and summarizes the cell appearance distribution in a 2-dimensional space, which is further classified by a simple and interpretable rule set. While the algorithm was developed in close collaboration with ophthalmic oncologists and pathologists, this manuscript is limited to describing the proposed system and characterizing its performance and does not empirically demonstrate its interpretability on a larger user group. Doing so will remain subject of future work.
3.2 Instance cell segmentation
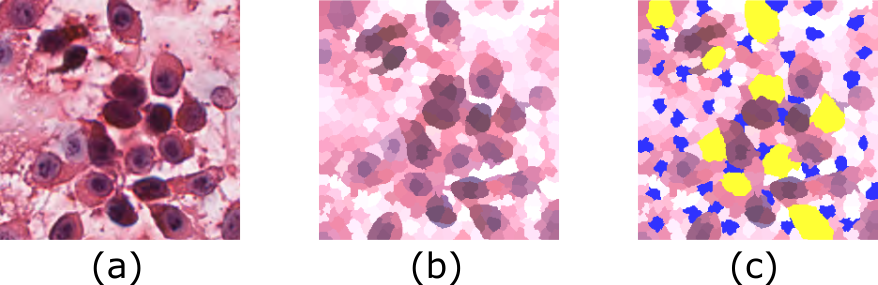
There exist no cell annotations for the high-quality \acpROI that are automatically extracted from cytology images using the method described in (Chen et al., 2020). However, instance cell segmentation is essential for further cell-level analysis. Thus, we prepare annotations on a small sub-set with minimal manual labor to enable supervised training of an instance segmentation network. Figure 3 presents the annotation procedure. In detail, we randomly select 500 \acpROI from the 131k pool and partially annotate super-pixels generated by SLIC (Achanta et al., 2010) to reduce the annotation workload. We group all super-pixels within any annotated cells to generate instance-level annotations. We trained the instance segmentation network YOLACT (Bolya et al., 2019) on the annotated \acpROI, by converting annotated super-pixels into pixel level annotations. We chose YOLACT because it can be easily modified to enable training on partially annotated data. Unlike two-stage segmentation networks, e. g. Mask RCNN (He et al., 2017), which first detects candidate regions to then classify and segment these regions in the second stage, YOLACT breaks the instance segmentation into two parallel tasks: (1) generating a dictionary of non-local prototype masks over the entire image, and (2) predicting a set of linear combination coefficients per instance. We compute all loss functions, e. g. semantic segmentation loss, only in annotated areas. All \acpROI are finally tested to extract cells.
3.3 Cell-level feature embedding
Previously, pathologists have attempted to quantify different cell components, such as nuclear size and nucleolar size, to predict the behavior of tumors. Our approach is similar to this process as it extracts network feature representations of cells, which we assume contain information about cell appearance. Cell-level features for cell are then extracted from the entire feature map using the segmentation mask with masked average pooling:
| (1) |
where is the output of the backbone network architecture.
To prepare subtype classification based on cell composition, and improve classification performance, we embed all cell-level features in 20 \acGEP class 1 slides to create a 2D embedding space with UMAP (McInnes et al., 2020). All other slides are then embedded into that space, to represent the respective cell composition. We expect slides of distinct \acGEP classes have different cell composition, and thus distribution in the 2D embedding space. The embedding space is created using slides of one \acGEP class only to potentially maximize the difference of \acGEP class 1 and class 2 representation in the embedding space.
3.4 Interpretable Classification
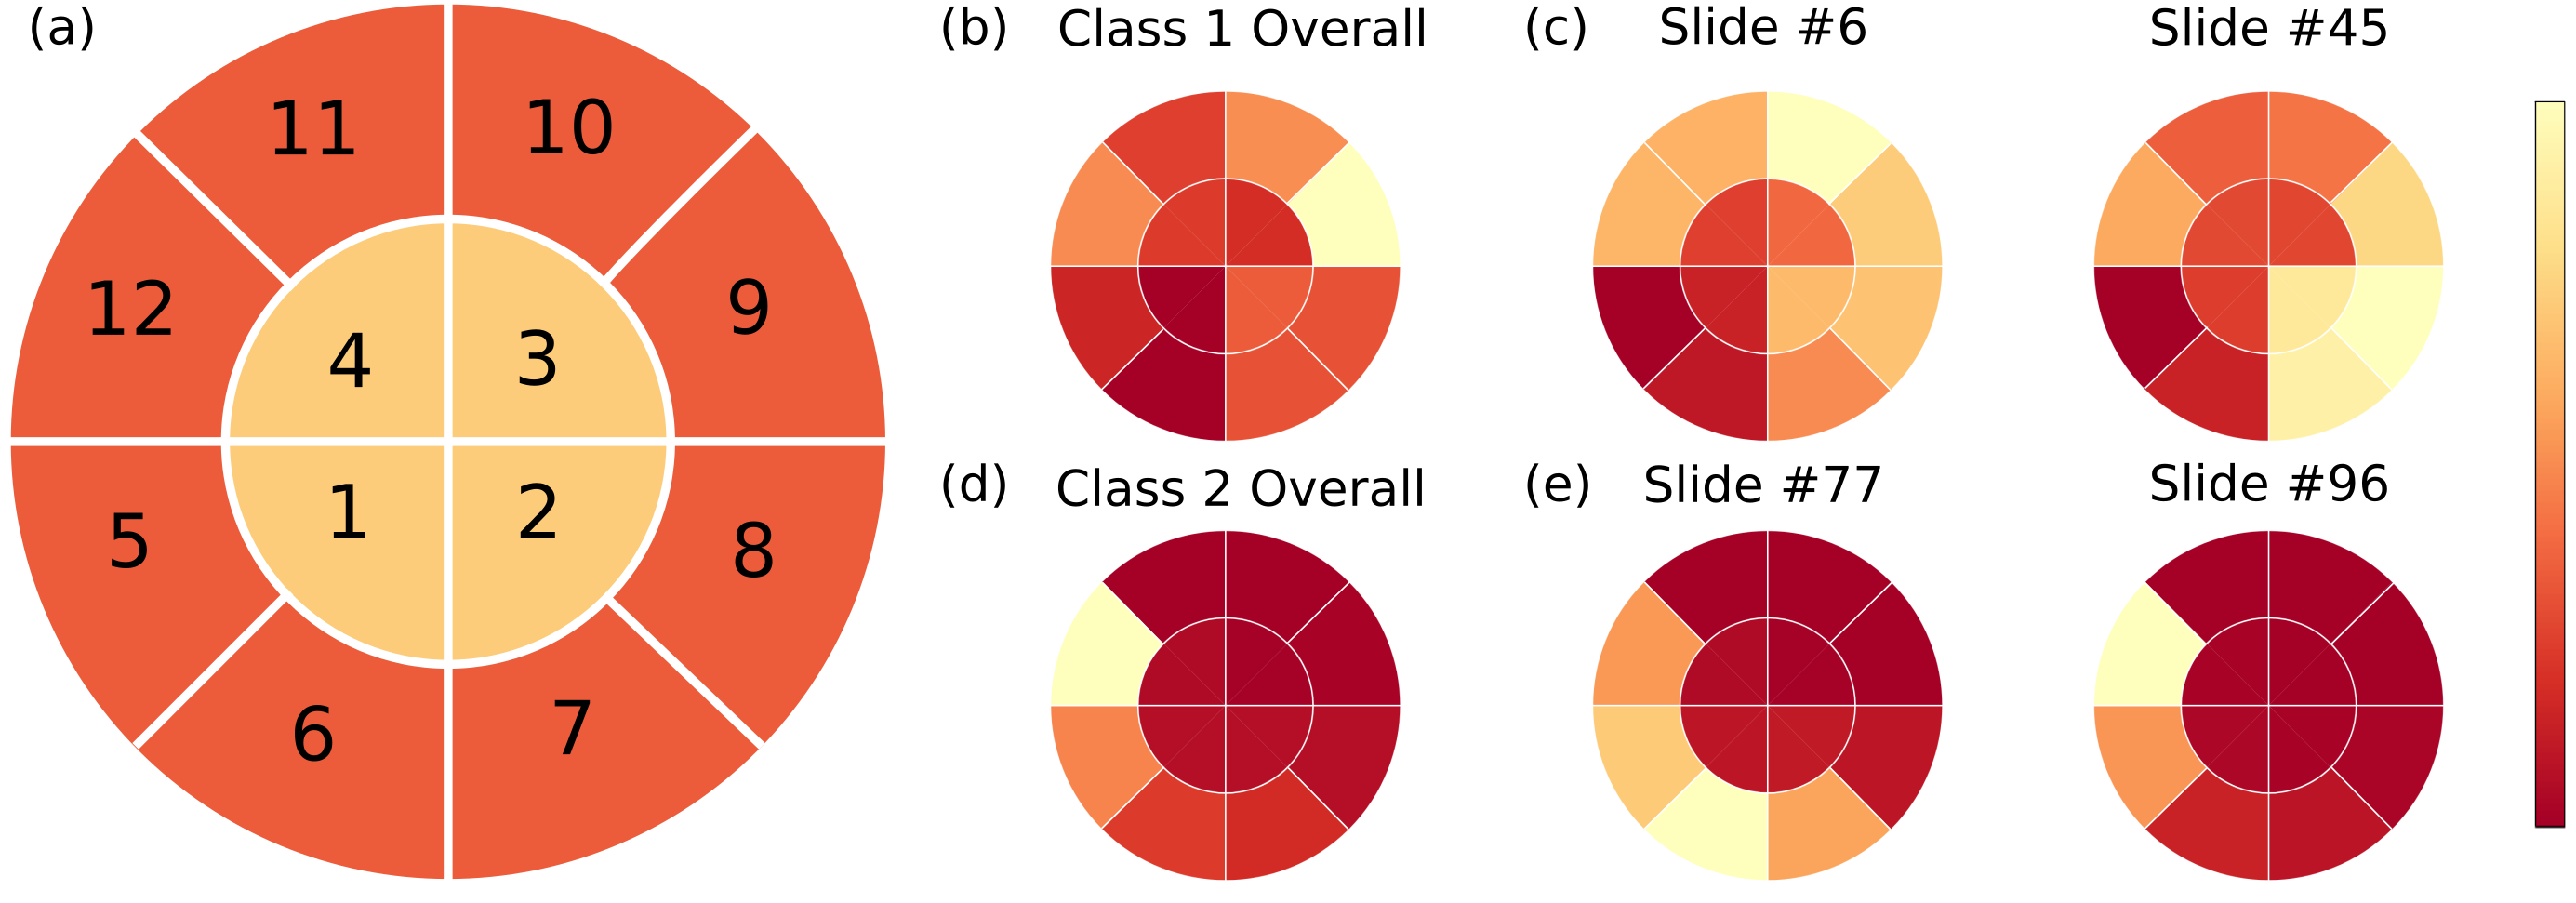
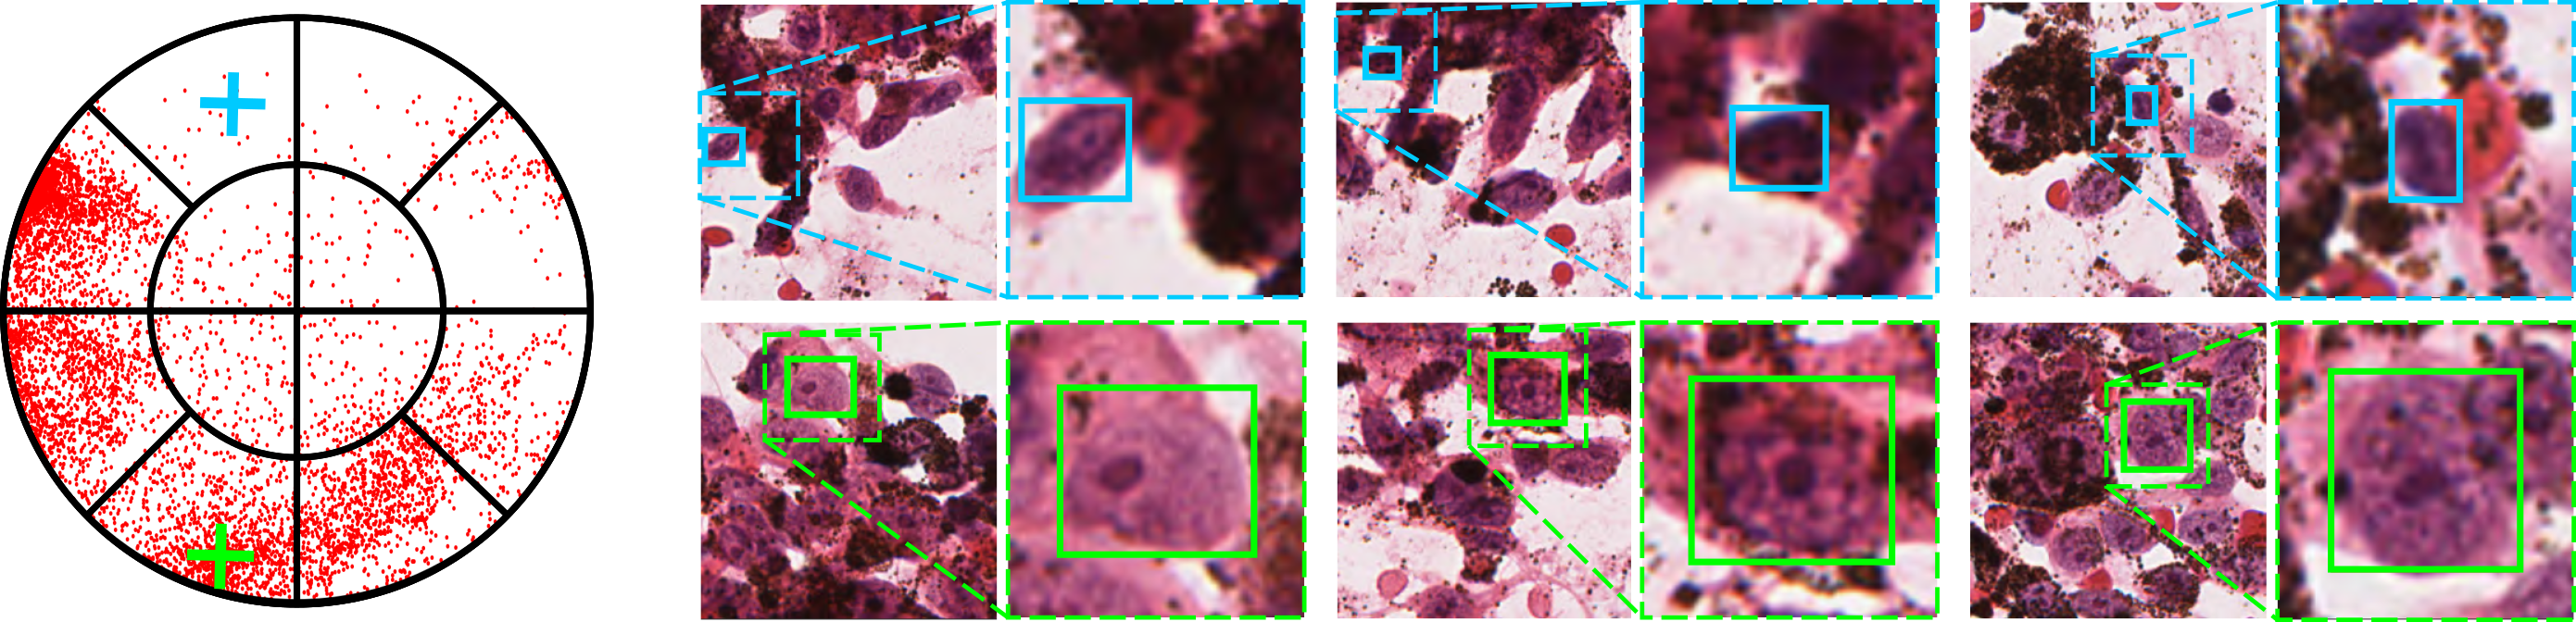
Based on our hypothesis that slide-level cell composition, and thus distributions in the 2D cell appearance embedding space, should be different between \acGEP classes, we devise an interpretable algorithm that reasons based on these representations. Direct comparisons between distributions, e. g. chi-square test (Pearson, 1900) and Kolmogorov-Smirnov tests (Kolmogorov, 1933), are complicated and not usually interpretable. Instead, we partition the embedding space and analyze the region densities. Because cells with similar appearance, thus similar features, are close to each other in the embedding space, the density of each region represents the portion of cells with a specific kind of cell appearance in the slide. To make it easier to define the spatial partitioning of the embedding space, we first distort the space into a unit circle. We treat the center of gravity of all embedded cells as the origin. Then, we normalize to unity the scale of all embedded cells in every degree of angle in polar coordinate, so that the whole embedding space is distorted to a unit circle. Parameters in circular distortion are determined simultaneously with the embedding generation and are fixed when embedding new slides. Finally, we divide the unit circle equally into 12 regions, as shown in Figure 4. Since we posit that each \acGEP class will have different densities in distinct regions, in addition to the individual densities of these regions (), we define the relative densities () as input variables for classification. Finally, an interpretable bayesian rule set algorithm (Wang et al., 2017) takes all these 78 input variables (12 values (), and 66 relations ()) for \acGEP classification.
Different from logistic regression (which is only interpretable in low dimensional problem settings because humans can handle at most cognitive entities at once (Miller, 2020; Cowan, 2010)), the rule set algorithm is not limited by the number of input variables. The number of arguments in each rule can be controlled, as simple as determining the largest allowed depth of a tree. In addition, it is different from a random forest (which uses majority vote, and is thus not interpretable) since here, the predicted output is determined once the sample obeys at least one rule in the rule set.
4 Experiments
We demonstrate that our proposed interpretable learning pipeline does not compromise on performance of \acUM subtyping when compared to deep black box models. We also demonstrate an additional, interactive tool for expert review of cell level composition through interaction with the 2D embedding space. By simply clicking on areas of interest in the density charts, users may retrieve and visually inspect cells that are representative of the appearance in that specific embedding location. Details are shown in Figure 5.
4.1 Experimental setting
Dataset: The dataset we use includes 100 cytology samples from 88 uveal melanoma patients. To the best of our knowledge, this is the largest dataset on \acUM cytology. The dataset contains 50 slides from 43 patients with \acGEP class 1 and 50 slides from 45 patients with \acGEP class 2. The cellular aspirates obtained from cytology of each tumor were submitted for cytology and \acGEP testing. The cytology specimen was flushed on a standard pathology glass slide, smeared, and stained with hematoxylin and eosin. The specimen submitted for \acGEP was flushed into a tube containing extraction buffer and submitted for DecisionDx-UM testing. Whole slide scanning was performed for each cytology slide at a magnification of 40x. Automatic \acROI extraction is performed using (Chen et al., 2020), resulting in a total of high-quality \acpROI across all slides.
Implementation details: Super-pixel algorithm SLIC (Achanta et al., 2010) is implemented following (Kim, ), where the number of components is , and the Euclidean distance ratio is . On average, each of the 500 randomly sampled \acROI for manual annotation has 9 cells and 38 background super-pixels annotated. The number of prototypes in YOLACT is doubled to 64 to potentially segment more cells within every \acROI. The segmentation model is optimized using Adam (Kingma & Ba, 2014) with a learning rate of and 4000 iterations with a batch size of . We train the model on annotated \acpROI and validate on the other \acpROI. We empirically split the circular embedding space into 12 partitions, as shown in Figure 4, which in internal development was found to yield the best performance compared to other split approaches. All cells that map outside the circular embedding space are projected to the nearest region. For the interpretable classification, we use of the projected slides in both class 1 and class 2 for training (64) and the other for testing (16). The rule set algorithm is trained with simulated annealing procedure as described in (Wang et al., 2017). The maximal length of each rule in the rule set is set to 2 to preserve its intelligibility.
4.2 Cell Segmentation Performance
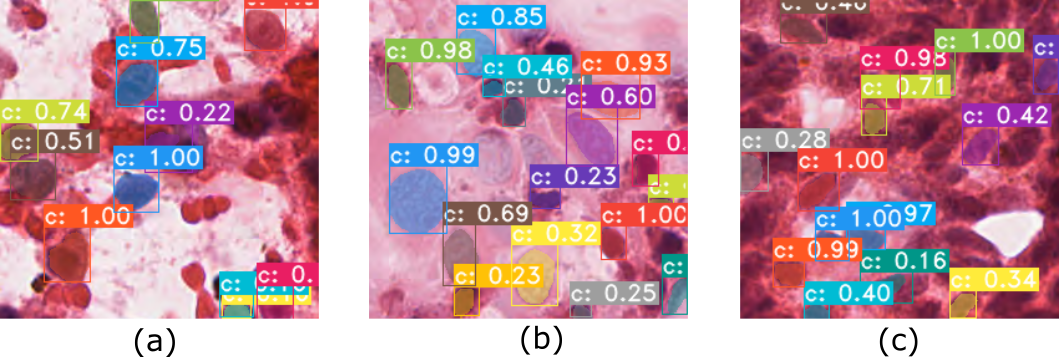
We use \acmAP as the main evaluation metric for cell segmentation performance. The \acmAP is about when \acIoU is larger than , which indicates that the segmentation process catches a fairly good number of cancer cells. However, \acmAP is low with high \acIoU threshold, because of the low quality of super-pixel-based annotations on the cells’ boundary. Table 1 and Figure 6 present both quantitative and qualitative results, respectively. The algorithm can easily tell apart cancer cells from blood cells, while some cancer cells with ambiguous boundaries are missed. We attribute this to the low quality of super-pixels for these cells during annotation. As a result, cells with ambiguous boundaries are usually skipped in annotation if more clear cells exist in the same \acROI. Because there exist numerous cells in each slide, missing some cells at random will not significantly impact the overall cell composition, and further, the classification performance.
4.3 \acUM subtype classification
We compare our proposed method with a previously proposed deep black box model (Coudray et al., 2018; Liu et al., 2020) evaluated on the same dataset, which classifies \acUM subtype directly from \acpROI. In (Coudray et al., 2018), slide-level subtype prediction is obtained by simply averaging class predictions for all corresponding \acpROI. Both, the black box and our proposed method have the same backbone network architecture (ResNet-50 (He et al., 2015)) and the same training and testing split for a fair comparison. We find that the accuracy performance of our method (87.5%) compares favorably to the black box approach following (Coudray et al., 2018) (83.3%), and more importantly, is interpretable based on the following rule set over the density chart (), and thus, over the cell appearance composition of the whole slide:
| (2) |
There only exist arguments in the rule set, which makes algorithmic recommendations transparent and verifiable, while enabling users to understand overall cell composition. This rule set was visually represented already in Figure 1.
| IoU | |||||
|---|---|---|---|---|---|
| box | |||||
| mask |
| w/o Ensemble | w/ Ensemble | |||
| Accuracy | # of rules | Accuracy | # of rules | |
| LR | N/A | N/A | ||
| SVM | N/A | N/A | ||
| ANN | N/A | N/A | ||
| Rule Set (class 1) | ||||
| Rule Set (class 2) | ||||
4.4 Ablation Study
We conduct an ablation study of the rule-based interpretable classification to benchmark its performance against other classification methods, i. e. logistic regression, \acSVM and Artificial Neural Network (ANN). We also compare different embeddings, by creating the initial UMAP embedding space with either, \acGEP class 1 or \acGEP class 2 slides. After the embedding space creation, only 80 slides remain to train and evaluate the classification models. Therefore, we also introduce an ensemble method to enrich the input data by creating synthetic cell compositions. To create a synthetic slide, we randomly selected cells from one slide and cells from all the other slides in the same class as all the cells in the synthetic slide. Then, the synthetic slide will represent the main pattern of one observed slide but also introduce other variations. We created 100 synthetic slides for each class using this approach, which is indicated as ”Ensemble” in Table 2. The simple ANN we used is , where in means the number of output channels. To evaluate the methods, we then perform 100 random training/testing splits of our dataset on the patient-level and train all models on every split. The mean results and the corresponding confidence intervals are summarized in Table 2.
Logistic regression has the lowest testing accuracy () and the rule set achieves the highest performance (), which is comparable to SVM () and ANN (). Creating the embedding from distinct \acGEP classes results in similar accuracy of the rule set algorithm ( v.s. ). As in the previous comparisons to black box models, the rule set approach has the added benefit of being interpretable. Logistic regression and SVM models suffer in this regard due to the high dimensionality of the input representation (78). Dimensionality reduction techniques, e. g. principle component analysis (PCA), exist but are not applicable here because the number of input variables (78) is larger than the number of training samples (64). Finally, all models reach higher accuracy with the ensemble except SVM.
Due to the fact that our segmentation model is not perfect, we also evaluate the rule set model for different segmentation results. During early training, the segmentation model will first identify the most clear cancer cells, but along with plenty of false positives. As the optimization progresses, fewer cancer cells are segmented but much fewer false positives occur. The accuracy of the rule set algorithm for segmentation results after 2000, 3000 and 4000 training iterations is , and , which suggests that the algorithm favors the output of a highly specific cell segmentation algorithm.
5 Discussion
Our overall system utilizes the segmentation features to generate the embedding and classify \acUM subtypes based on slide-level cell composition. We assume that cell composition will be different across the two \acGEP classes, which will result in different cell density chart representations of slides from the two subtypes that can then be distinguished using an interpretable rule-based algorithm. This hypothesis is supported by our experiments. One aspect of the current approach is that we do not currently interpret the embedded features themselves, e. g., by classifying cell types, so that regions in the density chart do not immediately carry semantic information. This circumstance may limit the interpretability of our tool for non-subject matter experts, however, we emphasize that the tool is designed with pathologists as primary user group in mind who possess substantial domain expertise. While the algorithm does not currently identify specific cell types during embedding, pathologists are domain experts and will be able to explore and contextualize cell appearance in different embedding regions using the graphical user interface (Figure 5). Doing so as part of a training period may allow pathologists to understand and identify the major cell types in specific embedding regions, linking pie chart sectors to semantic cell types. Experience in observing how \acGEP class 1 and class 2 slides behave in the pie chart embedding space combined with the above training may further add to the interpretability of the model. Future work will investigate how this paradigm compares to other approaches and black box models in building trust and confidence in the user group.
In the current form, the circular space is evenly partitioned into 12 parts. However, this partitioning process could be further guided by other semantic information, e. g. clustering of specific cell types. If cell type annotations are available, the segmentation network could also output cell types for every extracted cells. We would expect to see clusters of cells types in the embedding space and the partitioning process could be further guided by the cell type clusters. However, such information is not available in our dataset and it is also unclear whether such approach would prove beneficial.
The boundary defined by the interpretable rule set could also be used as a criterion for user trust calibration. If a slide maps close to the boundary, a little variation could change the prediction result. Thus, the prediction of that slide may be perceived as less reliable. We will investigate in future work whether proximity to the decision boundary indeed correlates with prediction performance, and more importantly, other clinical outcome measures such as survival.
6 Conclusion
We have presented an automated yet interpretable system for \acUM subtyping from fine needle aspiration cytology images that does not compromise performance compared to conventional deep black box models. In future work, we will study how our interpretable model affects treatment decisions and user trust, as a next step to realize the huge potential of image-based tests for \acUM subtyping.
Acknowledgement: We gratefully acknowledge funding from the Emerson Collective Cancer Research Fund and internal funds provided by the Wilmer Eye Institute and the Malone Center for Engineering in Healthcare at Johns Hopkins University.
References
- Achanta et al. (2010) Achanta, R., Shaji, A., Smith, K., Lucchi, A., Fua, P., and Süsstrunk, S. Slic superpixels, 2010.
- Bolya et al. (2019) Bolya, D., Zhou, C., Xiao, F., and Lee, Y. J. Yolact: Real-time instance segmentation. In Proceedings of the IEEE/CVF International Conference on Computer Vision (ICCV), October 2019.
- Campanella et al. (2019) Campanella, G., Hanna, M. G., Geneslaw, L., Miraflor, A., Silva, V. W. K., Busam, K. J., Brogi, E., Reuter, V. E., Klimstra, D. S., and Fuchs, T. J. Clinical-grade computational pathology using weakly supervised deep learning on whole slide images. Nature medicine, 25(8):1301–1309, 2019.
- Chen et al. (2020) Chen, H., Liu, T. A., Correa, Z., and Unberath, M. An interactive approach to region of interest selection in cytologic analysis of uveal melanoma based on unsupervised clustering. In International Workshop on Ophthalmic Medical Image Analysis, pp. 114–124. Springer, 2020.
- Chikontwe et al. (2020) Chikontwe, P., Kim, M., Nam, S. J., Go, H., and Park, S. H. Multiple instance learning with center embeddings for histopathology classification. In International Conference on Medical Image Computing and Computer-Assisted Intervention, pp. 519–528. Springer, 2020.
- Coudray et al. (2018) Coudray, N., Ocampo, P. S., Sakellaropoulos, T., Narula, N., Snuderl, M., Fenyö, D., Moreira, A. L., Razavian, N., and Tsirigos, A. Classification and mutation prediction from non–small cell lung cancer histopathology images using deep learning. Nature medicine, 24(10):1559–1567, 2018.
- Cowan (2010) Cowan, N. The magical mystery four: How is working memory capacity limited, and why? Current directions in psychological science, 19(1):51–57, 2010.
- Gaube et al. (2021) Gaube, S., Suresh, H., Raue, M., Merritt, A., Berkowitz, S. J., Lermer, E., Coughlin, J. F., Guttag, J. V., Colak, E., and Ghassemi, M. Do as ai say: susceptibility in deployment of clinical decision-aids. npj Digital Medicine, 4(1):1–8, 2021.
- Grossmann et al. (2017) Grossmann, P., Stringfield, O., El-Hachem, N., Bui, M. M., Velazquez, E. R., Parmar, C., Leijenaar, R. T. H., Haibe-Kains, B., Lambin, P., Gillies, R. J., and Aerts, H. J. Defining the biological basis of radiomic phenotypes in lung cancer. In eLife, 2017.
- He et al. (2015) He, K., Zhang, X., Ren, S., and Sun, J. Deep residual learning for image recognition. arXiv preprint arXiv:1512.03385, 2015.
- He et al. (2017) He, K., Gkioxari, G., Dollár, P., and Girshick, R. Mask r-cnn. In Proceedings of the IEEE international conference on computer vision, pp. 2961–2969, 2017.
- Hegde et al. (2019) Hegde, N., Hipp, J. D., Liu, Y., Emmert-Buck, M., Reif, E., Smilkov, D., Terry, M., Cai, C. J., Amin, M. B., Mermel, C. H., et al. Similar image search for histopathology: Smily. NPJ digital medicine, 2(1):1–9, 2019.
- Hou et al. (2016) Hou, L., Samaras, D., Kurc, T. M., Gao, Y., Davis, J. E., and Saltz, J. H. Patch-based convolutional neural network for whole slide tissue image classification. In Proceedings of the IEEE conference on computer vision and pattern recognition, pp. 2424–2433, 2016.
- (14) Kim, A. Fastslic: Optimized slic superpixel. URL https://github.com/Algy/fast-slic.
- Kingma & Ba (2014) Kingma, D. P. and Ba, J. Adam: A method for stochastic optimization. arXiv preprint arXiv:1412.6980, 2014.
- Kolmogorov (1933) Kolmogorov, A. Sulla determinazione empirica di una lgge di distribuzione. Inst. Ital. Attuari, Giorn., 4:83–91, 1933.
- Liu et al. (2020) Liu, T. A., Zhu, H., Chen, H., Arevalo, J. F., Hui, F. K., Paul, H. Y., Wei, J., Unberath, M., and Correa, Z. M. Gene expression profile prediction in uveal melanoma using deep learning: A pilot study for the development of an alternative survival prediction tool. Ophthalmology. Retina, 4(12):1213–1215, 2020.
- Liu et al. (2017) Liu, Y., Gadepalli, K., Norouzi, M., Dahl, G. E., Kohlberger, T., Boyko, A., Venugopalan, S., Timofeev, A., Nelson, P. Q., Corrado, G. S., et al. Detecting cancer metastases on gigapixel pathology images. arXiv preprint arXiv:1703.02442, 2017.
- McInnes et al. (2020) McInnes, L., Healy, J., and Melville, J. Umap: Uniform manifold approximation and projection for dimension reduction, 2020.
- Miller (2020) Miller, G. A. 11. The magical number seven, plus-or-minus two or some limits on our capacity for processing information. University of California Press, 2020.
- Murdoch et al. (2019) Murdoch, W. J., Singh, C., Kumbier, K., Abbasi-Asl, R., and Yu, B. Definitions, methods, and applications in interpretable machine learning. Proceedings of the National Academy of Sciences, 116(44):22071–22080, 2019. ISSN 0027-8424. doi: 10.1073/pnas.1900654116. URL https://www.pnas.org/content/116/44/22071.
- Nourani et al. (2020) Nourani, M., King, J., and Ragan, E. The role of domain expertise in user trust and the impact of first impressions with intelligent systems. In Proceedings of the AAAI Conference on Human Computation and Crowdsourcing, volume 8, pp. 112–121, 2020.
- Onken et al. (2004) Onken, M. D., Worley, L. A., Ehlers, J. P., and Harbour, J. W. Gene expression profiling in uveal melanoma reveals two molecular classes and predicts metastatic death. Cancer research, 64(20):7205–7209, 2004.
- Pearson (1900) Pearson, K. X. on the criterion that a given system of deviations from the probable in the case of a correlated system of variables is such that it can be reasonably supposed to have arisen from random sampling. The London, Edinburgh, and Dublin Philosophical Magazine and Journal of Science, 50(302):157–175, 1900.
- Peng et al. (2019) Peng, T., Boxberg, M., Weichert, W., Navab, N., and Marr, C. Multi-task learning of a deep k-nearest neighbour network for histopathological image classification and retrieval. In International Conference on Medical Image Computing and Computer-Assisted Intervention, pp. 676–684. Springer, 2019.
- Pirovano et al. (2020) Pirovano, A., Heuberger, H., Berlemont, S., Ladjal, S., and Bloch, I. Improving interpretability for computer-aided diagnosis tools on whole slide imaging with multiple instance learning and gradient-based explanations. In Interpretable and Annotation-Efficient Learning for Medical Image Computing, pp. 43–53. Springer, 2020.
- Rudin (2019) Rudin, C. Stop explaining black box machine learning models for high stakes decisions and use interpretable models instead. Nature Machine Intelligence, 1(5):206–215, 2019.
- Schopper & Correa (2016) Schopper, V. J. and Correa, Z. M. Clinical application of genetic testing for posterior uveal melanoma. International journal of retina and vitreous, 2(1):1–6, 2016.
- Singh et al. (2011) Singh, A. D., Turell, M. E., and Topham, A. K. Uveal melanoma: Trends in incidence, treatment, and survival. Ophthalmology, 118(9):1881 – 1885, 2011. ISSN 0161-6420.
- Wang et al. (2017) Wang, T., Rudin, C., Doshi-Velez, F., Liu, Y., Klampfl, E., and MacNeille, P. A bayesian framework for learning rule sets for interpretable classification. The Journal of Machine Learning Research, 18(1):2357–2393, 2017.
- Worley et al. (2007) Worley, L. A., Onken, M. D., Person, E., Robirds, D., Branson, J., Char, D. H., Perry, A., and Harbour, J. W. Transcriptomic versus chromosomal prognostic markers and clinical outcome in uveal melanoma. Clinical Cancer Research, 13(5):1466–1471, 2007.
- Xu et al. (2017) Xu, Y., Jia, Z., Wang, L.-B., Ai, Y., Zhang, F., Lai, M., Eric, I., and Chang, C. Large scale tissue histopathology image classification, segmentation, and visualization via deep convolutional activation features. BMC bioinformatics, 18(1):1–17, 2017.
- Zhang et al. (2020) Zhang, H., Kalirai, H., Acha-Sagredo, A., Yang, X., Zheng, Y., and Coupland, S. E. Piloting a deep learning model for predicting nuclear bap1 immunohistochemical expression of uveal melanoma from hematoxylin-and-eosin sections. Translational Vision Science & Technology, 9(2):50–50, 2020.