Asteria: Deep Learning-based AST-Encoding for Cross-platform Binary Code Similarity Detection
Abstract
Binary code similarity detection is a fundamental technique for many security applications such as vulnerability search, patch analysis, and malware detection. There is an increasing need to detect similar code for vulnerability search across architectures with the increase of critical vulnerabilities in IoT devices. The variety of IoT hardware architectures and software platforms requires to capture semantic equivalence of code fragments in the similarity detection. However, existing approaches are insufficient in capturing the semantic similarity. We notice that the abstract syntax tree (AST) of a function contains rich semantic information. Inspired by successful applications of natural language processing technologies in sentence semantic understanding, we propose a deep learning-based AST-encoding method, named Asteria, to measure the semantic equivalence of functions in different platforms. Our method leverages the Tree-LSTM network to learn the semantic representation of a function from its AST. Then the similarity detection can be conducted efficiently and accurately by measuring the similarity between two representation vectors. We have implemented an open-source prototype of Asteria. The Tree-LSTM model is trained on a dataset with 1,022,616 function pairs and evaluated on a dataset with 95,078 function pairs. Evaluation results show that our method outperforms the AST-based tool Diaphora and the-state-of-art method Gemini by large margins with respect to the binary similarity detection. And our method is several orders of magnitude faster than Diaphora and Gemini for the similarity calculation. In the application of vulnerability search, our tool successfully identified 75 vulnerable functions in 5,979 IoT firmware images.
I Introduction
Over recent years, we have witnessed the rapid development and deployment of the Internet of Things (IoT). However, the pressure of time to market of IoT development increasingly raises security and privacy concerns [61]. Firmware of IoT devices could contain vulnerabilities, which have already caused destructive attacks [42]. IoT firmware security analysis is considered an effective approach to ensuring the security of IoT devices [26].
Due to the lack of source code, analyzing binary code has naturally become an important means of firmware security analysis. On the other hand, code is often reused to facilitate fast software development. Unfortunately, the reused code such as a third-party library could cause the same vulnerability to spread among different vendors and different versions of firmware [27]. Moreover, the symbol information such as function names is generally stripped during the firmware compilation. Finding such vulnerable functions simply based on function names is impossible. To this end, the binary code similarity detection (BCSD) technique is applied to quickly find such homologous vulnerabilities in a large amount of firmware [28]. The BCSD technique focuses on determining the similarity between two binary code pieces. As to the vulnerability search, the BCSD focuses on finding other homologous vulnerable functions given a known vulnerability function. In addition to the vulnerability search, BCSD has been widely used for other security applications such as code plagiarism detection [19, 56, 49], malware detection [45, 46], and patch analysis [39, 60, 33]. Despite many existing research efforts, the diversity of IoT hardware architectures and software platforms poses challenges to BCSD for IoT firmware. There are many different instruction set architectures (ISA) such as ARM, PowerPC, MIPS, and X86 for IoT firmware. The instructions are different and the rules, such as the calling convention and the stack layout, also differ across different ISAs [52]. It is non-trivial to find homologous vulnerable functions across platforms.
BCSD can be generally classified into two categories: i) dynamic analysis-based methods and ii) static analysis-based methods. The methods based on dynamic analysis capture the runtime behavior as function features by running a program, where the function features can be I/O pairs of function [52] or system calls during the program execution [34], etc. But this kind of method is not scalable for large-scale firmware analysis since running firmware requires specific devices and emulating firmware is also difficult [68, 40, 23]. The methods based on static analysis mainly extract function features from assembly code. An intuitive way is to calculate the edit distance between assembly code sequences [29]. But this method cannot be directly applied in cross-architecture BCSD since instructions are different across architectures. Architecture-independent statistical features of functions are proposed for the similarity detection [36]. These features are less affected across architectures such as the number of function calls, strings, and constants. Furthermore, the control flow graph (CFG) at the assembly code level is utilized by conducting a graph isomorphism comparison for improving the similarity detection [36, 38]. Based on statistical features and CFG, Gemini [62] leverages the graph embedding network to encode functions to vectors for similarity detection. Static analysis-based methods are faster and more scalable for large-scale firmware analysis but often produce false positives due to the lack of semantic information. Since homologous vulnerable functions in different architectures usually share the same semantics, it is desirable that a cross-platform BCSD can capture the function semantic information in a scalable manner.
Abstract syntax tree (AST) is a tree representation of code, which is usually used in semantic analysis of source code compilation [47], and preserves well-defined statement components, explicit order of statements, and the execution logic. AST contains rich semantic information and is easy to generate by decompiling the function during binary analysis. Therefore, the semantics contained in an AST can be potentially used for identifying homologous functions across architectures. Considering the similarities between the natural language and the assembly language such as words and instructions, sentences and basic blocks, and the successful application of natural language processing (NLP) technologies in programming language analysis [53], in this work, we propose Asteria, a deep learning-based AST-encoding method for cross-platform function similarity detection.
Tree-LSTM network has been shown to provide a better performance in predicting the semantic relatedness of two sentences than the plain LSTM [58, 59]. We utilize the Tree-LSTM network to encode ASTs into semantic representation vectors. Given a binary program, we first extract ASTs by decompiling its functions. Then we preprocess the ASTs and encode them into representation vectors by Tree-LSTM for semantic representation. After the encoding, we adopt the Siamese Network [24] to integrate two Tree-LSTM networks for calculating the similarity between the encoding vectors as the AST similarity. Then, we further calibrate the AST similarity with function call relationships to calculate the final function similarity. We construct a large number of cross-architecture AST pairs to train the Tree-LSTM network so that it can recognize the semantic equivalent AST pairs. We conduct a series of evaluations, and the results show that our method outperforms the baseline approaches. In terms of the similarity detection accuracy, our method Asteria outperforms Diaphora [3] by and Gemini by . Remarkably, our method takes an average of seconds for the similarity calculation of a pair of AST encodings, which is times faster than Gemini and times faster than Diaphora.
Contribution. The main contributions of this paper are as follows:
-
•
We present a new method named Asteria, to encode ASTs at binary level with the Tree-LSTM network into semantic representation vectors for BCSD. To facilitate the model training, we utilize the Siamese Network to integrate two identical Tree-LSTM model for AST similarity detection. Furthermore, we introduce an additional similarity calibration scheme to improve the similarity calculation accuracy.
-
•
We implement and open-source a prototype of Asteria111https://github.com/Asteria-BCSD/Asteria. For the model training, we build a large-scale cross-platform dataset containing 49,725 binary files by cross-compiling 260 open-source software. We compare our model against the state-of-the-art approach Gemini [62] and an AST-based method Diaphora [3]. The evaluation results show that our Asteria outperforms Diaphora and Gemini.
-
•
In the application of IoT vulnerability search, we collect 5,979 firmware images and 7 vulnerable functions from CVE database [2]. we perform a similarity detection between firmware functions and vulnerable functions. Asteria successfully identified 75 vulnerable functions in IoT firmware images. From the analysis of the search results, our method can efficiently and accurately capture the semantic equivalence of code fragments for the cross-platform BCSD.
II Preliminary
In this section, we first briefly describe the AST structure. Then we compare the architectural stability of AST and CFG across different platforms. Next we introduce the Tree-LSTM network adopted in our method. Finally, we introduce the problem definition of function similarity calculation.
II-A Abstract Syntax Tree
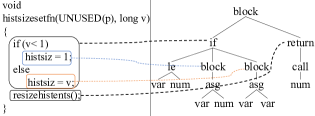
An AST is a tree representation of the abstract syntactic structure of code in the compilation and decompilation process. Different subtrees in an AST correspond to different code scopes in the source code. Figure 1 shows a decompiled AST corresponding to the source code of function histsizesetfn in zsh v5.6.2 in the left. The zsh is a popular shell software designed for interactive use, and the function histsizesetfn sets the value of a parameter. The lines connecting the source code and AST in Figure 1 show that a node in the AST corresponds to an expression or a statement in the source code. A variable or a constant value is represented by a leaf node in AST. We group nodes in an AST into two categories: i) statement nodes and ii) expression nodes according to their functionalities shown in Table I. Statement nodes control the function execution flow while expression nodes perform various calculations. Statement nodes include if, for, while, return, break and so on. Expression nodes include common arithmetic operations and bit operations.
| Node Type | Label | Note | |
| Statement | if | 1 | if statement |
| block | 2 | instructions executed sequentially | |
| for | 3 | for loop statement | |
| while | 4 | while loop statement | |
| switch | 5 | switch statement | |
| return | 6 | return statement | |
| goto | 7 | unconditional jump | |
| continue | 8 | continue statement in a loop | |
| break | 9 | break statement in a loop | |
| Expression | asgs | 1017 | assignments, including assignment, assignment after or, xor, and, add, sub, mul, div |
| cmps | 1823 | comparisons including equal, not equal, greater than, less than, greater than or equal to, and less than or equal to. | |
| ariths | 2434 | arithmetic operations including or, xor, addition, subtraction, multiplication, division, not, post-increase, post-decrease, pre-increase, and pre-decrease | |
| other | 3443 | others including indexing, variable, number, function call, string, asm, and so on. |
II-B AST vs. CFG
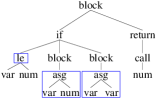
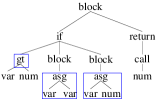
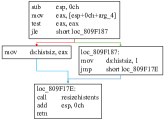
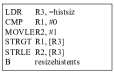
Both CFG and AST are structural representations of a function. The CFG of a function contains the jump relationships between basic blocks that contain straight-line code sequences [41]. Though CFG has been used for similarity measurement in BCSD [36], David et al. [29] demonstrated that CFG structures are greatly affected by different architectures. We find AST shows better architectural stability across architectures compared with CFG since the AST is generated from the machine independent intermediate representations which are disassembled from assemble instructions during the decompilation process [25]. Figure 2 shows the changes of ASTs and CFGs in x86 and ARM architectures, respectively. For the CFGs from x86 to ARM, we observe that the number of basic blocks changes from 4 to 1, and the number of assembly instructions has changed a lot. However, the ASTs, based on higher level intermediate representation, slightly change from x86 to ARM, where the changes are highlighted with blue boxes. Besides, AST preserves the semantics of functionality and is thus an ideal structure for cross-platform similarity detection.
II-C Tree-LSTM
In natural language processing, Recursive Neural Networks (RNN) are widely applied and perform better than Convolutional Neural Networks [66]. RNNs take sequences of arbitrary lengths as inputs considering that a sentence can consist of any number of words. However, standard RNNs are not capable of handling long-term dependencies due to the gradient vanishing and gradient exploding problems. As one of the variants of RNN, Long Short-Term Memory (LSTM) [43] has been proposed to solve such problems. LSTM introduces a gate mechanism including the input, forget, and output gates. As described in § III-B, the gates control the information transfer to avoid the gradient vanishing and exploding. Nevertheless, LSTM can only process sequence input but not structured input. Tree-LSTM is proposed to process tree-structured inputs [58]. The calculation by Tree-LSTM model is from the bottom up. For each non-leaf node in the tree, all information from child nodes is gathered and used for the calculation of the current node. In sentiment classification and semantic relatedness tasks, Tree-LSTM performs better than a plain LSTM structure network. There are two types of Tree-LSTM proposed in the work [59]: Child-Sum Tree-LSTM and Binary Tree-LSTM. Researchers have shown that Binary Tree-LSTM performs better than Child-Sum Tree-LSTM [59]. Since the Child-Sum Tree-LSTM does not take into account the order of child nodes, while the order of statements in AST reflects the function semantics, we use the Binary Tree-LSTM for our AST encoding.
II-D Problem Definition
Given two binary functions and , let and denote the corresponding ASTs of and which can be extracted after the decompilation of binary code. An AST is denoted as where and are the sets of vertices and edges, respectively. In node set , every node corresponds to a number listed in Table I, and is the number of vertices in the AST. For an edge in , it means vertex and are connected, and is the parent node of . Given two ASTs and , we define a model to calculate the similarity between them, where the similarity score ranges from 0 to 1. In an ideal case, when and are homologous, the model is expected to output a score of 1 (in an ideal case). And when and are non-homologous, is expected to output a score of 0. In addition, based on the semantic similarity of ASTs, we leverage the numbers of callee functions of and for similarity calibration. Let and denote the numbers of callee functions corresponding to functions and , respectively. We define the calibration function , where the range is also from 0 to 1. The final function similarity calculation is defined as . The larger the score, the higher similarity for the two binary functions and .
III Methodology
In this section, we first present the overview of Asteria. Then we detail the similarity calculation for two ASTs, consisting of the AST encoding of and the similarity calculation between the encodings of . Then we introduce the calibration in the final function similarity calculation of .
III-A Overview
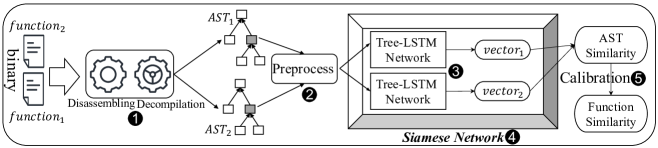
Figure 3 delineates the workflow of Asteria. Given two binary functions, we first disassemble and decompile them to extract the ASTs. Before encoding the ASTs into the Tree-LSTM network, AST preprocessing is performed, including the digitalization and format transformation. AST digitalization means that each node in an AST is mapped and replaced with an integer value, where the specific mapping relationship is shown in Table I. For example, the node of an assignment statement is replaced with a value of 10. Since we adopt the Binary Tree-LSTM [58], which takes binary trees as inputs, ASTs are transformed to the left-child right-sibling format [54] after the digitalization. After that, each node’s first child node in the original AST is made its left child and its nearest sibling to the right in the original tree is made its right child. Next, the two ASTs are encoded into two vectors by the two Tree-LSTM networks in Siamese Network [24]. Then the Siamese Network utilizes two encoding vectors to compute the similarity as the AST similarity (§ III-B). Finally, we use the function calling relationship to calibrate the AST similarity (§ III-C).
III-B AST Similarity Calculation
We present the Tree-LSTM network and Siamese Network. The Tree-LSTM network is used for AST encoding. The Siamese Network utilizes the outputs of the Tree-LSTM network for calculating the AST similarity.
AST Encoding
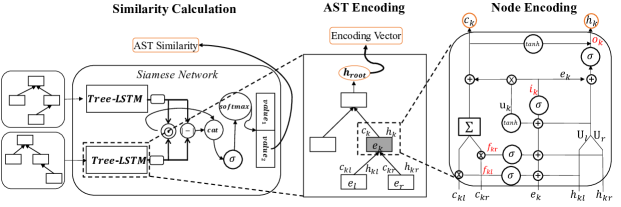
Tree-LSTM network is firstly proposed to encode the tree representation of a sentence and summarize the semantic information in natural language processing. Tree-LSTM network can preserve every property of the plain LSTM gating mechanisms while processing tree-structured inputs. The main difference between the plain LSTM and the Tree-LSTM is the way to deal with the outputs of predecessors. The plain LSTM utilizes the output of only one predecessor in the sequence input. We utilize Tree-LSTM to integrate the outputs of all child nodes in the AST for calculation of the current node. The process of node encoding for node in Tree-LSTM is shown in Figure 4. The Tree-LSTM takes three types of inputs: node embedding , hidden states and , and cell states and . The node embedding is generated by embedding the node to a high-dimensional representation vector. , , , and are outputs from the encoding of child nodes. During the node encoding in Tree-LSTM, there are three gates and three states which are important in the calculation. The three gates are calculated for filtering information to avoid gradient explosion and gradient vanishing [58]. They are input, output, and forget gates. In Binary Tree-LSTM, there are two forget gates and , filtering the cell states from the left child node and right child node separately. As shown in Node Encoding in Figure 4, the forget gates are calculated by combining , , and . Similar to the forget gates, the input gate, and the output gate are also calculated by combining , , and . The details of the three types of gates are as follows:
| (1) |
| (2) |
| (3) |
| (4) |
where and denote the input gate and the output gate respectively, and the symbol denotes the sigmoid activation function. The weight matrix , , and bias are different corresponding to different gates. After the gates are calculated, there are three states , , and in Tree-LSTM to store the intermediate encodings calculated based on inputs , , and . The cached state combines the information from the node embedding and the hidden states and (Equation 5). And note that utilizes tanh as the activation function rather than for holding more information from the inputs. The cell state combines the information from the cached state and the cell states and filtered by forget gates (Equation 6). The hidden state is calculated by combining the information from cell state and the output gate (Equation 7). The three states are computed as follows:
| (5) |
| (6) |
| (7) |
where the means Hadamard product [44]. After the hidden state and input state are calculated, the encoding of the current node is finished. The states and will then be used for the encoding of ’s parent node. During the AST encoding, Tree-LSTM encodes every node in the AST from bottom up as shown in AST Encoding in Figure 4. After encoding all nodes in the AST, the hidden state of the root node is used as the encoding of the AST.
Siamese Network
After two ASTs are encoded by Tree-LSTM, the Siamese Network utilizes AST encodings to calculate the similarity between these two ASTs. The details of the Siamese Network are shown in Figure 4. The Siamese Network consists of two identical Tree-LSTM networks that share the same parameters. In the process of similarity calculation, the Siamese Network first utilizes Tree-LSTM to encode ASTs into vectors. We design the Siamese Network with subtraction and multiplication operations to capture the relationship between the two encoding vectors. After the operations, the two resulting vectors are concatenated into a larger vector. Then the resulting vector goes through a layer of softmax function to generate a 2-dimensional vector. The calculation is defined as:
| (8) | ||||
where is a matrix, the represents Hadamard product [44], denotes the operation of making an absolute value, the function denotes the operation of concatenating vectors. The softmax function normalizes the vector into a probability distribution. Since is a weight matrix, the output of Siamese Network is a vector. The format of output is , where the first value represents the dissimilarity score and the second represents the similarity score. During the model training, the input format of Siamese Network is . In our work, the label vector means and are from non-homologous function pairs and the vector means homologous. The resulting vector and the label vector are used for model loss and gradient calculation. During model inference, the second value in the output vector is taken as the similarity of the two ASTs.
III-C AST Similarity Calibration
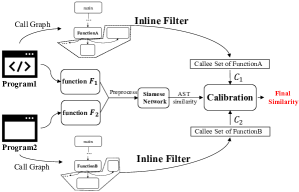
Considering other potential attributes (e.g., the number of variables and statements) change with different architectures as shown in Figure 2 (c) and (d), the number of callee functions is an architecture-independent feature. The number of calllee functions is easy to count during the reverse engineering. We combine the number of the callee functions and AST similarity to calculate the function similarity as shown in Figure 5. The callee functions of function are the functions called in function . Homologous functions likely have the same number of callee functions since they share the same source code. Considering that function inlining may occur during compilation [18, 69], which will reduce the number of callee functions, we refine callee functions by filtering the functions that may be inlined. Specifically, we filter out the callee functions whose number of assembly instructions are less than the threshold , and the rest are used as the callee function set of function F. With the introduction of the callee functions, non-homologous functions which may generate similar ASTs can be better distinguished. We define as the size of the callee function set of function . We use the size to calibrate the AST similarity. We use the exponential function to measure the similarity between callee functions. The calculation for callee functions is as follows:
| (9) |
where and are the size of callee function set of binary function and , respectively. The final function pair similarity calculation combines the AST similarity and the callee function similarity is as follows:
| (10) |
where is the AST decompiled from binary function and is the AST decompiled from binary function . We conduct a comparative evaluation in § IV-E1 to show the performance gain of our AST similarity calibration.
IV Evaluation
IV-A Experiment Settings
We utilize IDA Pro 7.3 [7] and its plug-in Hexray Decompiler to decompile binary code for AST extraction. Since the Hexray Decompiler currently only supports the architectures of x86, x64, PowerPC (PPC), and ARM, our approach cannot handle the binaries which belong to the MIPS architecture. After the AST extraction, we perform preprocessing of AST as described in § III-A. Before the AST encoding by the Tree-LSTM, the nodes in an AST are embedded into 16-dimensional vectors by the nn.Embedding of PyTorch [17]. For the encoding of leaf nodes in Formulas (1)-(6), we assign the state vectors , , , and to zero vectors. The loss function for model training is BCELoss, which measures the binary cross entropy between the labels and the predictions. The AdaGrad optimizer is applied for gradient computation and weight-matrix updating after losses are computed. Since the The computation steps of Tree-LSTM depend on the shape of the AST, therefore, we cannot perform parallel batch computation, which makes the batch size always to be 1. The model is trained for 60 epochs. We do not include the calibration scheme introduced in § III-C during the model training, so that the Tree-LSTM network effectively learns semantic differences between ASTs. Our experiments are performed on a local server equipped with two Intel(R) Xeon(R) CPUs E5-2620 v4 @ 2.10GHz, each with 16 cores, 128GB of RAM, and 4T of storage. The code of Asteria runs in a Python 3.6 environment. We use gcc v5.4.0 compiler to compile source code in our dataset, and use the buildroot-2018.11.1 [1] for the Buildroot dataset (details in § IV-B) construction. We use the tool binwalk [8] to unpack the firmware for obtaining the binaries to conduct further analysis.
| Name | Platform | # of binaries | # of functions |
|---|---|---|---|
| OpenSSL | ARM | 6 | 6,401 |
| x86 | 6 | 6,420 | |
| x64 | 6 | 6,539 | |
| PPC | 6 | 6,317 | |
| Buildroot | ARM | 10,142 | 1,139,168 |
| x86 | 17,823 | 1,765,547 | |
| x64 | 11,005 | 1,088,411 | |
| PPC | 10,755 | 1,133,647 | |
| Firmware | ARM | 5,661 | 1,869,601 |
| x86 | 129 | 70,400 | |
| x64 | 202 | 79,383 | |
| PPC | 1,098 | 392,268 | |
| Total | 56,839 | 7,564,102 |
IV-B Datasets
We create three datasets: Buildroot dataset, OpenSSL dataset, and Firmware dataset. The Buildroot dataset is used for model training and testing. We obtain the optimal model weights with the best performance based on the results of model training and model testing (§ IV-E2). The OpenSSL dataset is used for the comparative evaluation in § IV-E1. The Firmware dataset is used to perform the task of practical vulnerability search with our approach. As shown in Table II, the third column shows the number of binary files for different architectures, and the fourth column shows the number of functions in the corresponding dataset. Noting that in OpenSSL and Buildroot datasets, the symbols such as function names in binaries are retained during the compilation while these symbols are usually stripped in the release version of firmware. We utilize the function names together with the library names since function names in different binaries might be duplicated but having different functionalities to construct function pairs with ground truth labels for the model training, testing, and evaluation. Functions that have the same name from the same binary are called homologous function pairs, otherwise, they are considered non-homologous function pairs. After the compilation, each function in the same source code corresponds to the different versions of binary functions , , , and . The two binary functions which are homologous, for example and , form the homologous pair . Two ASTs corresponding to the homologous pair are extracted and form the homologous AST pair , where the ground truth label ”” indicates that the two ASTs are from homologous functions. The non-homologous functions, such as and , form a non-homologous AST pair , where ”” indicates that the two ASTs are from non-homologous functions, and F and G are two different functions. We construct six different architecture combinations of function pairs including ARM vs. PPC, ARM vs. x64, PPC vs. x64, x86 vs. ARM, x86 vs. PPC, and x86 vs. x64. Function names in the Firmware dataset are deleted, IDA tags them with name sub_xxx, where xxx is the function offset address.
Buildroot Dataset
We build this dataset for model training and testing with a multi-platform cross-compilation tool buildroot [1]. We utilize the buildroot to download the source code of 260 different software which contains benchmark datasets including busybox, binutils, and compile them with the default compilation option for different architectures. As a result, each software has four different binary versions corresponding to different architectures. As shown in Table II, 49,725 binaries in total are compiled by the buildroot. Then we randomly select functions from different architecture binaries to construct cross-architecture function pairs. The details of function pairs of different architecture combinations are shown in Table III. Since we remove the AST pairs which contain ASTs with the node number less than 5, the number of function pairs are different among different architecture combinations. We divide the Buildroot dataset into two parts according to the ratio of 8:2 for the training set and testing set.
OpenSSL Dataset
Considering Gemini uses OpenSSL dataset for the evaluation, to conduct a fair comparative experiments, we also build the OpenSSL dataset. We compile the source code of OpenSSL 1.1.0a [16] under four different architectures with the default compilation settings. We randomly select function pairs with different architecture combinations. The final dataset consists of 37,541 homologous AST pairs and 57,537 non-homologous AST pairs.
Firmware Dataset
We download 5,979 firmware from the websites and FTP servers of IoT device vendors. There are 2,300 firmwares from NetGear [5], 1,021 from Schneider [6], and 3,679 from Dlink [4]. After unpacking firmware with binwalk [8], 7,090 binary files are generated. Note that not all firmware can be unpacked since binwalk cannot identify certain firmware format. As shown in Table II, binaries mainly come from the ARM and the PPC architectures.
| Arch-Comb | # of pairs | Arch-Comb | # of pairs |
|---|---|---|---|
| x86-ARM | 174,776 | ARM-PPC | 174,916 |
| x86-PPC | 182,596 | ARM-x64 | 157,976 |
| x86-x64 | 167,436 | PPC-x64 | 164,916 |
IV-C Baseline Approaches
There have been several previous works for BCSD study: discovRE [36], Genius [38], Gemini [62], and Diaphora [3]. Xu et al. have demonstrated that Gemini is both more accurate and efficient than the other approaches [62]. In our evaluation, Gemini is chosen as one of the baseline approaches. Considering that Diaphora [3] also uses the AST as the features for similarity calculation and is not compared with other works, we also choose it as a baseline for comparison.
Gemini
Gemini encodes ACFGs (attributed CFGs) into vectors with a graph embedding neural network. The ACFG is a graph structure where each node is a vector corresponding to a basic block. We have obtained Gemini’s source code and its training dataset. Notice that in [62] authors mentioned it can be retrained for a specific task, such as the bug search. To obtain the best accuracy of Gemini, we first use the given training dataset to train the model to achieve the best performance. Then we re-train the model with the part of our training dataset. For the Gemini evaluation, we construct ACFG pairs from the same function pairs with AST pairs in our OpenSSL dataset.
Diaphora
We download the Diaphora source code from github [3]. Diaphora maps nodes in an AST to primes and calculates the product of all prime numbers. Then it utilizes a function to calculate the similarity between the prime products. We extract Diaphora’s core algorithm for AST similarity calculation for comparison.
IV-D Evaluation Metric
The Receiver Operating Characteristic (ROC) curve and Area Under Curve (AUC) are used for measuring the model performance. The ROC curve [70] illustrates the diagnostic ability of a model as its discrimination threshold is varied. For our evaluation, the AUC reflects the probability that the model will correctly identify whether an AST pair is from a homologous pair or not. In our evaluation, the similarity of a function pair is calculated as a score of . Assuming the threshold is , if the similarity score of a function pair is greater than or equal to , the function pair is regarded as a positive result, otherwise a negative result. For a homologous pair, if its similarity score is greater than or equal to , it is a true positive (TP). If a similarity score of is less than , the calculation result is a false negative (FN). For a non-homologous pair, if a similarity score is greater than or equal to , it is a false positive (FP). When the similarity score is less than , it is a true negative (TN). After classifying all the calculation results, two important metrics (true positive rate) and (false positive rate) under certain threshold are calculated as:
| (11) |
| (12) |
The ROC curve can be generated by plotting points whose coordinates consist of s and s with many different thresholds. After ROC curves being plotted, the area under the ROC curve, called AUC for short, can be calculated. The larger the , the better the model’s discrimination ability.
IV-E Evaluation Results
We conduct comparative experiments to assess the performances of three approaches: Asteria, Gemini and Diaphora. To measure the performance gain of the calibration scheme described in § III-C, we also test the performance of Asteria without calibration (i.e., Asteria-WOC), where the calibration algorithm is not included and the AST similarity is directly used as the final function similarity. We conduct two comparative experiments: the mixed cross-architecture experiment and the pair-wise cross-architecture experiment. In the mixed cross-architecture experiment, the function pairs are randomly constructed from any architecture combinations. In particular, the functions in such function pairs could come from any platform of x64, x86, PPC, or ARM. The pair-wise cross-architecture experiments aim to compare the performance in a specific architecture combination. Therefore, six different function combinations are constructed: ARM-PPC, ARM-x64, PPC-x64, x86-ARM, x86-PPC, and x86-x64, respectively. In each individual combination, function pairs are selected from two specific different architectures. For example, in the ARM-PPC cross-architecture experiment, the functions in the pairs only come from the ARM or PPC architecture.
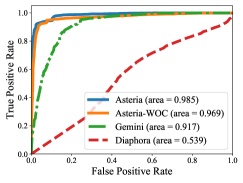
IV-E1 ROC Comparison
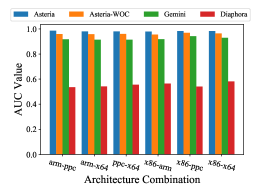
Figure 6 plots the ROC curves of the different approaches in cross-architecture experiments. The result shows that Asteria outperforms Gemini by around 7.5% and Diaphora by 82.7%, and the similarity detection accuracy of Asteria has been enhanced with the similarity calibration (§ III-C). Note that our approach achieves a high true positive rate with a low false positive rate, which brings out high confidence of calculation results in practical applications. For example, from Figure 6, with a low false-positive of 5%, our approach achieves a true positive rate of 93.2%, while Gemini has a true positive rate of 55.2%. As shown in Figure 7, we calculate the AUC values of different approaches in six different pair-wise experiments. The results show that Asteria outperforms Gemini and Diaphora in each pair-wise architecture combination by similar margins as in the mixed cross-architecture experiment. The major difference between Asteria and Gemini is that we take AST as our function feature, which shows that AST is better than CFG as a semantically related feature. Compared to Diaphora, the results show that the application of NLP technology greatly improves the performance of AST based BCSD.
IV-E2 Impact of Model Settings
We illustrate the impact of four hyperparameters on the model performance: epochs, siamese structure, embedding size, and leafnode calculation. The experimental settings are the same as those described in Section IV-A during evaluation except for the parameters being measured.
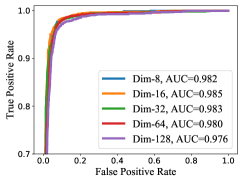
Embedding Size
The embedding size is the dimension of the vector outputted by the embedding layer during the AST encoding (§ III-B). To show the difference of model performance with different embedding sizes, we increase the embedding size from to for model training and testing as shown in Figure 8. We take the highest AUC value from the model testing in each embedding size setting. The results show that the model achieves the highest AUC of with the embedding size of 16, and reaches the lowest AUC of with the embedding size of 128. The embedding size of 128 used to represent 43 kinds of nodes in Table I increases the model complexity and may cause the overfitting problem. Considering the tradeoff between model performance (AUC) and computational complexity, we choose the embedding size of 16 in Asteria.
Siamese Structure
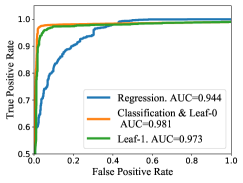
The similarity calculation between AST encoding vectors in Siamese Network is introduced in § III-B. There is another common way to calculate the similarity between two encoding vectors called the regression method, which utilizes the cosine distance [31]. Different similarity calculation methods correspond to different Siamese Network internal structures. In contrast, we adopt a calculation method similar to the binary classification as shown in Equation (8) in Asteria. For comparison with the regression method, we use the same model settings except for the similarity calculation step. We record the s and s and plot the ROC curve corresponding to the different internal structures. As Figure 9 shows, the curve with the label “Regression” corresponds to the calculation with the cosine distance, and the curve with the label ”Classification” corresponds to the calculation in Asteria. The result shows that the model with our calculation method yields a higher AUC value of , which means a better model performance.
Leafnode Calculation
According to Equation (6) in § III-B, the calculation for leaf nodes also takes the hidden state input and cell state input. Since leaf nodes have no children, we assign the input vectors of the leaf nodes manually. There are two ways for vector initialization in general: all zeros vector or all ones vector. According to these two different initialization methods, we train and test the model, and then plot the ROC curves. As shown in Figure 9, the curve with label “Leaf-0” corresponds to the model with all zeros initialization, and the curve with label “Leaf-1” corresponds to the model with all ones initialization. The results show the model performs better with all zeros initialization.
IV-F Computational Overhead
IV-F1 AST Statistics
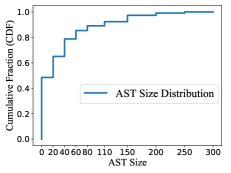
We define the AST size as the number of nodes in an AST. Since there are global offset table functions [21] which are automatically generated by the compiler, we filter out such functions. 25,569 ASTs are retained after filtering from 25,667 ASTs. We sort the sizes of 25,569 AST samples in ascending order from the OpenSSL dataset. Figure 10 plots the cumulative distribution of AST size of the sorted AST samples. It shows that most AST sizes are smaller than 200. Specifically, the ASTs with sizes less than 20, 40, 80, and 200 account for 48.6%, 65.1%, 85.4%, and 97.4%, respectively. We then measure the computational overhead of AST extracting and encoding with Asteria and similarity calculation with different approaches.
IV-F2 Time Consumption
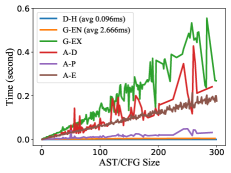
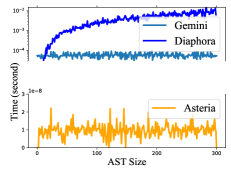
The process of function similarity calculation consists of two phases: offline phase (AST extraction, preprocessing, and encoding) and online phase (similarity calculation between encoding vectors). We separately measure the extraction time, preprocessing time, encoding time, and similarity calculation time on the OpenSSL dataset. The decompilation is the most time-consuming part in the AST extraction. The average time for each function decompilation is around 41 milliseconds, and the average time for preprocessing is around 6 milliseconds. We only consider ASTs whose sizes are less than 300 since they account for the majority of ASTs, as illustrated in Figure 10. Figure 10 shows the encoding time of ASTs, which is about the same as the decompilation time. In the figure, D-H denotes the AST hashing time of Diaphora. G-EN denotes the ACFG encoding time of Gemini and G-EX denotes the ACFG extraction time. A-D, A-P, A-E respectively represent the decompilation time, preprocessing time, encoding time of Asteria. Asteria has a more time-consuming offline stage than Gemini and Diaphora. The similarity calculation time in the online phase is shown in Figure 10. Asteria takes second on average to calculate the similarity for a pair of encoded ASTs. However, the average calculation time of Diaphora and Gemini is second and second for a pair of ASTs, respectively. Remarkably, it shows that Asteria is much faster than Diaphora and Gemini in terms of the similarity calculation. The root cause of better performance is that we use the subtraction and production of vectors for the similarity calculation, while Gemini uses the cosine function which is much more time-consuming.
| # | CVE | software version | vulnerable function | Confirmed # | Vendor | Affected model |
| 1 | 2016-2105 [13] | OpenSSL before 1.0.1t and 1.0.2 before 1.0.2t | EVP_EncodeUpdate | 24 | NetGear | D7000, R7000, FVS318Gv2, R8000, R7500, R7800, R6250, R7900, R7900, R7800 |
| 2 | 2014-4877 [12] | Wget before 1.16 | ftp_retrieve_glob | 14 | NetGear | R7000, D7800, R7800, R6250, R8000, R7900, R6700 |
| 3 | 2014-0195 [11] | OpenSSL before 0.9.8za, 1.0.0 before 1.0.0m, and 1.0.1 before 1.0.1h | dtls1_reassemble_fragment | 13 | NetGear | R7000, R8000, R6250, R7900, R7500, D7800 |
| Dlink | DSN-6200 | |||||
| 4 | 2016-6303 [14] | OpenSSL before 1.1.0 | MDC2_Update | 13 | NetGear | R7000, D7000, FVS318Gv2, R8000 |
| 5 | 2016-8618 [15] | Libcurl before 7.51.0 | curl_maprintf | 7 | NetGear | D7000, R8000, R6700, R7500, D7800, R7800 |
| 6 | 2013-1944 [10] | Libcurl before 7.30.0 | tailmatch | 3 | NetGear | R7500, D7800, R7800 |
| 7 | 2011-0762 [9] | vsftpd before 2.3.3 | vsf_filename_passes_filter | 1 | NetGear | FVS318Gv2 |
V Vulnerability Search
We conduct a vulnerability search using the Firmware dataset and successfully find a total of 75 vulnerabilities. We first encode all the functions in the Firmware dataset with the Tree-LSTM network and obtain the encoding vectors and the number of callee functions. We build a vulnerability library that contains vulnerable functions exposed in commonly used open-source software. In the library, seven vulnerable functions of CVE are integrated and the details of vulnerable functions are listed in Table IV. Specifically, three of seven come from OpenSSL software, and two of them come from libcurl, and one comes from wget, and the other comes from vsftpd. For each vulnerable function, we also encode it with the Tree-LSTM network, and record the encoding vector and the number of callee functions. Then we perform the similarity calculation between the encoding vectors of vulnerable functions and the encoding vectors of all functions in the Firmware database with the Siamese Network. After the calculation, each function in the Firmware dataset is tagged with a similarity score of with the vulnerable function . According to the Youden Index [67], which measures model performance at a certain threshold. Since our model performs best at the threshold value of , we set the threshold to be to filter out candidate functions. A score of greater than the threshold indicates that function may be a homologous vulnerable function of . If is considered a vulnerable function, we further conduct a manual analysis to confirm whether it is indeed a homologous function of or not. In our analysis, we define two criteria: A) function comes from the same version of the same software as the vulnerable function , and B) the score of is 1. The candidate functions that satisfy the criteria A and B are considered as homologous functions of the corresponding vulnerable functions with high confidence, so that we won’t conduct further manual analysis. For those candidate functions that satisfy the criteria A but not B, we further analyze the semantic functionality of their assembly code to determine whether they are homologous functions of the corresponding vulnerable functions. From the search results, 68 vulnerable functions satisfy criteria A, 13 vulnerability functions satisfy criteria B, and 6 functions satisfy A and B. The number of homologous vulnerable functions corresponding to each vulnerable function of CVE is listed in Table IV. Since a device model corresponds to multiple versions of firmware and different versions likely hold the same vulnerability, the number of the device models is less than the number of confirmed vulnerable functions.
We also conduct a comparison between Asteria and Gemini in terms of the end-to-end time consumption and accuracy for the vulnerable function search. We compare the end-to-end time consumption and accuracy for the top 10 vulnerable functions in the search results. Asteria takes 0.414 seconds on average for a pair of functions and achieves 78.7% accuracy. The Gemini takes 0.159 seconds for a pair and achieves 20% accuracy. By checking the results of Gemini, we find that most of the vulnerable functions being ranked outside the top 10000 functions, which means a high false negative rate of results. In comparison, Asteria produces less false negatives, which means Asteria is more effective than Gemini.
VI Related Work
Feature-based Methods
When considering the similarity of binary functions, the most intuitive way is to utilize the assembly code content to calculate the edit distance for similarity detection between functions. Khoo et al. concatenated consecutive mnemonics from assembly language into the N-grams for similarity calculation [48]. David et al. proposed Trecelet, which concatenates the instructions from adjacent basic blocks in CFGs for similarity calculation [29]. Saebjornsen et al. proposed to normalize/abstract the operands in instructions, e.g., replacing registers such as eax or ebx with string “reg”, and conduct edit distance calculation based on normalized instructions [55]. However, binary code similarity detection methods based on disassembly text can not be applied to cross-architecture detection since the instructions are typically different in different architectures. The works in [52], [22], [36], [63] utilize cross-architecture statistical features for binary code similarity detection. Eschweiler et al. [36] defined statistical features of functions such as the number of instructions, size of local variables. They utilized these features to calculate and filter out candidate functions. Then they performed a more accurate but time-consuming calculation with the graph isomorphism algorithm based on CFGs. Although this method takes a pre-filtering mechanism, the graph isomorphism algorithm makes similarity calculation extremely slow. To improve the computation efficiency, Feng et al. proposed Genius which utilizes machine learning techniques for function encoding [38]. Genius uses the statistical features of the CFG proposed in [36] to compose the attributed CFG (ACFG). Then it uses a clustering algorithm to calculate the center points of ACFGs and forms a codebook with the center points. Finally, a new ACFG is encoded into a vector by computing the distance with ACFGs in the codebook and the similarity between ACFGs is calculated based on the encoded vectors. But the codebook calculation and ACFG encoding in Genius are still inefficient. Xu et al. proposed Gemini based on Genius to encode ACFG with a graph embedding network [62] for improving the accuracy and efficiency. However, the large variance of binary code across different architectures makes it difficult to find architecture-independent features [32].
Semantic-based Methods
For more accurate detection, semantic-based features are proposed and applied for code similarity detection. The semantic-based features model the code functionality, and are not influenced by different architectures. Khoo et al. applied symbolic execution technique for detecting function similarity [50]. Specifically, they obtained input and output pairs by executing basic blocks of a function. But the input and output pairs can not model the functionality of the whole function accurately. Ming et al. leveraged the deep taint and automatic input generation to find semantic differences in inter-procedural control flows for function similarity detection [51]. Feng et al. proposed to extract conditional formulas as higher-level semantic features from the raw binary code to conduct the binary code similarity detection [37]. In their work, the binary code is lifted into a platform-independent intermediate representation (IR), and the data-flow analysis is conducted to construct formulas from IR. Egele et al. proposed the blanket execution, a novel dynamic equivalence testing primitive that achieves complete coverage by overwriting the intended program logic to perform the function similarity detection [35]. These semantic-based features capture semantic functionalities of a function to reduce the false positives. However, the methods above depend heavily on emulation or symbolic execution, which are not suitable for program analysis in large-scale IoT firmware since the emulation requires peripheral devices [68, 40, 23] and symbolic execution suffers from the problems of path explosion.
AST in Source Code Analysis
Since the AST can be easily generated from source code, there has been research work proposed to detect source code clone based on AST. Ira D. Baxter et al. proposed to hash ASTs of functions to buckets and compare the ASTs in the same bucket [20] to find clones. Because the method proposed in [20] is similar to Diaphora which hash ASTs, we only perform a comparative evaluation with Diaphora. In addition to the code clone detection, AST is also used in vulnerability extrapolation from source code [65, 64]. In order to find vulnerable codes that share a similar pattern, Fabian et al. [65] encoded AST into a vector and utilized the latent semantic analysis [30] to decompose the vector to multiple structural pattern vectors and compute the similarity between these pattern vectors. Yusuke Shido et al. proposed an automatic source code summary method with extended Tree-LSTM [57].
VII Discussion
In this section, we discuss the limitation of this work and future research to address these limitations.
Our work focuses on a more accurate and faster method for cross-platform binary code similarity detection. In Asteria, we use AST as a feature to capture semantic information of a function. Considering the complexity of decompilation in multiple platforms, we use the commercial tool IDA Pro. Our work relies on the correctness of the decompilation result of IDA Pro.
For the digitization of nodes before encoding an AST into the Tree-LSTM network, we remove the constant values and strings in the AST since they correspond to unlimited instances. Without the constant values and strings, the semantic information of a function may be relatively incomplete and may cause false positives. For the more accurate semantic representation of a function, we may introduce another embedding system to embed constants and strings into embedding vectors, and combine the embedding vectors with the AST encoding in Asteria to get a new AST representation. There is no doubt that adding a new embedded system will increase the computational overhead. But it achieves a good tradeoff between the computational cost and accuracy.
For the organization strategy of function pairs introduced in Section IV-B, it may introduce few noises in case two functions with different names have the exactly same code logic within the same project (despite rarely in practice based on our observation). Considering the small probability of data noise and the tolerance of Tree-LSTM to data noise, we believe that our method is minimally affected. In terms of the computational overhead, Asteria is based on the Tree-LSTM network, where the model training is time-consuming if the size of an AST is large. In addition, the offline encoding is time-consuming since LSTM cannot take full advantage of GPU for parallel computing. As our future research, we plan to employ more efficient NLP techniques for AST encoding.
We conduct a vulnerability search in our firmware dataset and analyze the search results. Through our analysis, we find that the results with score of 1 are all confirmed as vulnerable cases. The functions with high scores hold similar code patterns with the vulnerable function. We hope that this work can inspire researchers about the connection between natural language and assemble language or intermediate language for binary security analysis. Notice that vulnerability verification is a very important follow-up work after the vulnerability search. We only manually confirm whether the functions are vulnerable or not, without conducting the exploitability analysis.
VIII Conclusion
In this paper, we proposed Asteria, a deep learning-based AST encoding scheme to measure the semantic equivalence of functions across platforms. We used AST as the function feature and adopted the Tree-LSTM network to encode the AST into semantic representation vectors. We then employed the Siamese Network for integrating two identical Tree-LSTM networks to calculate the similarity between two AST encodings. We implemented a prototype of Asteria. For the model training, we built a large-scale cross-platform dataset containing 49,725 binary files by cross-compiling 260 open-source software. We compared our model against the state-of-the-art approach Gemini and an AST-based method Diaphora. Comprehensive evaluation results show that our Asteria outperforms Diaphora and Gemini in both accuracy and efficiency. We also conducted a vulnerability search in an IoT firmware dataset and found 75 vulnerable functions.
IX Acknowledgement
This work is partly supported by Guangdong Province Key Area R&D Program of China (Grant No.2019B010137004), Key Program of National Natural Science Foundation of China (Grant No.U1766215), National Natural Science Foundation of China (Grant No.U1636120) and Industrial Internet Innovation and Development Project (Grant No.TC190H3WU).
References
- [1] Buildroot making embedded linux easy. https://buildroot.org. [Online; accessed 26-February-2020].
- [2] Cve - cve. https://cve.mitre.org/. (Accessed on 03/23/2021).
- [3] Diaphora. https://github.com/joxeankoret/diaphora. Accessed jan 4, 2020.
- [4] Dlink all products. https://support.dlink.com/AllPro.aspx. [Online; Accessed May 19, 2020].
- [5] Netgear download. http://support.netgear.cn/download.asp. [Online; Accessed May 19, 2020].
- [6] Schneider support. https://www.schneider-electric.cn/zh/download. [Online; Accessed May 19, 2020].
- [7] IDA Pro. https://www.hex-rays.com/products/ida/index.shtml, 2019. [Online; accessed 3-April-2020].
- [8] Binwalk. https://www.refirmlabs.com/binwalk/, 2020. [Online; accessed 5-April-2020].
- [9] Cve-cve-2011-0762. https://cve.mitre.org/cgi-bin/cvename.cgi?name=CVE-2011-0762, 2020. [Online; accessed 5-April-2020].
- [10] Cve-cve-2013-1944. https://cve.mitre.org/cgi-bin/cvename.cgi?name=CVE-2013-1944, 2020. [Online; accessed 5-April-2020].
- [11] Cve-cve-2014-0195. https://cve.mitre.org/cgi-bin/cvename.cgi?name=CVE-2014-0195, 2020. [Online; accessed 5-April-2020].
- [12] Cve-cve-2014-4877. https://cve.mitre.org/cgi-bin/cvename.cgi?name=CVE-2014-4877, 2020. [Online; accessed 5-April-2020].
- [13] Cve-cve-2016-2105. https://cve.mitre.org/cgi-bin/cvename.cgi?name=CVE-2016-2105, 2020. [Online; accessed 5-April-2020].
- [14] Cve-cve-2016-6303. https://cve.mitre.org/cgi-bin/cvename.cgi?name=CVE-2016-6303, 2020. [Online; accessed 5-April-2020].
- [15] Cve-cve-2016-8618. https://cve.mitre.org/cgi-bin/cvename.cgi?name=CVE-2016-8618, 2020. [Online; accessed 5-April-2020].
- [16] Openssl. https://www.openssl.org/source/old/1.1.0/, 2020. [Online; accessed 5-April-2020].
- [17] Pytorch. https://pytorch.org/, 2020. [Online; accessed 5-April-2020].
- [18] Andrew Ayers, Richard Schooler, and Robert Gottlieb. Aggressive inlining. ACM SIGPLAN Notices, 32(5):134–145, 1997.
- [19] Hamid Abdul Basit and Stan Jarzabek. Detecting higher-level similarity patterns in programs. SIGSOFT Softw. Eng. Notes, 30(5):156–165, September 2005.
- [20] Ira D Baxter, Andrew Yahin, Leonardo Moura, Marcelo Sant’Anna, and Lorraine Bier. Clone detection using abstract syntax trees. In Proceedings. International Conference on Software Maintenance (Cat. No. 98CB36272), pages 368–377. IEEE, 1998.
- [21] Jose E Cabrero and Ian M Holland. System and method for providing shared global offset table for common shared library in a computer system, July 10 2001. US Patent 6,260,075.
- [22] Mahinthan Chandramohan, Yinxing Xue, Zhengzi Xu, Yang Liu, Chia Yuan Cho, and Hee Beng Kuan Tan. Bingo: Cross-architecture cross-os binary search. In Proceedings of the 2016 24th ACM SIGSOFT International Symposium on Foundations of Software Engineering, pages 678–689. ACM, 2016.
- [23] Daming D Chen, Maverick Woo, David Brumley, and Manuel Egele. Towards automated dynamic analysis for linux-based embedded firmware. 2016.
- [24] Sumit Chopra, Raia Hadsell, and Yann LeCun. Learning a similarity metric discriminatively, with application to face verification. In 2005 IEEE Computer Society Conference on Computer Vision and Pattern Recognition (CVPR’05), volume 1, pages 539–546. IEEE, 2005.
- [25] Cristina Cifuentes and K John Gough. Decompilation of binary programs. Software: Practice and Experience, 25(7):811–829, 1995.
- [26] Andrei Costin, Jonas Zaddach, Aurélien Francillon, and Davide Balzarotti. A large-scale analysis of the security of embedded firmwares. In 23rd USENIX Security Symposium (USENIX Security 14), pages 95–110, 2014.
- [27] Ang Cui, Michael Costello, and Salvatore Stolfo. When firmware modifications attack: A case study of embedded exploitation. 2013.
- [28] Yaniv David, Nimrod Partush, and Eran Yahav. Firmup: Precise static detection of common vulnerabilities in firmware. ACM SIGPLAN Notices, 53(2):392–404, 2018.
- [29] Yaniv David and Eran Yahav. Tracelet-based code search in executables. In Proceedings of the 35th ACM SIGPLAN Conference on Programming Language Design and Implementation, PLDI ’14, pages 349–360, New York, NY, USA, 2014. ACM.
- [30] Scott Deerwester, Susan T Dumais, George W Furnas, Thomas K Landauer, and Richard Harshman. Indexing by latent semantic analysis. Journal of the American society for information science, 41(6):391–407, 1990.
- [31] Najim Dehak, Reda Dehak, James R Glass, Douglas A Reynolds, Patrick Kenny, et al. Cosine similarity scoring without score normalization techniques. In Odyssey, page 15, 2010.
- [32] Vijay D’Silva, Mathias Payer, and Dawn Song. The correctness-security gap in compiler optimization. In 2015 IEEE Security and Privacy Workshops, pages 73–87. IEEE, 2015.
- [33] Thomas Dullien and Rolf Rolles. Graph-based comparison of executable objects (english version). SSTIC, 5(1):3, 2005.
- [34] Manuel Egele, Maverick Woo, Peter Chapman, and David Brumley. Blanket execution: Dynamic similarity testing for program binaries and components. In 23rd USENIX Security Symposium (USENIX Security 14), pages 303–317, 2014.
- [35] Manuel Egele, Maverick Woo, Peter Chapman, and David Brumley. Blanket execution: Dynamic similarity testing for program binaries and components. In 23rd USENIX Security Symposium (USENIX Security 14), pages 303–317, San Diego, CA, 2014. USENIX Association.
- [36] Sebastian Eschweiler, Khaled Yakdan, and Elmar Gerhards-Padilla. discovre: Efficient cross-architecture identification of bugs in binary code. In NDSS, 2016.
- [37] Qian Feng, Minghua Wang, Mu Zhang, Rundong Zhou, Andrew Henderson, and Heng Yin. Extracting conditional formulas for cross-platform bug search. In Proceedings of the 2017 ACM on Asia Conference on Computer and Communications Security, pages 346–359, 2017.
- [38] Qian Feng, Rundong Zhou, Chengcheng Xu, Yao Cheng, Brian Testa, and Heng Yin. Scalable graph-based bug search for firmware images. In Proceedings of the 2016 ACM SIGSAC Conference on Computer and Communications Security, pages 480–491. ACM, 2016.
- [39] Debin Gao, Michael K Reiter, and Dawn Song. Binhunt: Automatically finding semantic differences in binary programs. In International Conference on Information and Communications Security, pages 238–255. Springer, 2008.
- [40] Eric Gustafson, Marius Muench, Chad Spensky, Nilo Redini, Aravind Machiry, Yanick Fratantonio, Davide Balzarotti, Aurelien Francillon, Yung Ryn Choe, Christopher Kruegel, et al. Toward the analysis of embedded firmware through automated re-hosting. pages 135–150, 2019.
- [41] John L Hennessy and David A Patterson. Computer architecture: a quantitative approach. Elsevier, 2011.
- [42] G. Hernandez, F. Fowze, D. J. Tang, T. Yavuz, P. Traynor, and K. R. B. Butler. Toward automated firmware analysis in the iot era. IEEE Security & Privacy, 17(5):38–46, 2019.
- [43] Sepp Hochreiter and Jürgen Schmidhuber. Long short-term memory. Neural Computation, 9(8):1735–1780.
- [44] Roger A Horn. The hadamard product. In Proc. Symp. Appl. Math, volume 40, pages 87–169, 1990.
- [45] Xin Hu, Tzi-cker Chiueh, and Kang G Shin. Large-scale malware indexing using function-call graphs. In Proceedings of the 16th ACM conference on Computer and communications security, pages 611–620, 2009.
- [46] Xin Hu, Kang G Shin, Sandeep Bhatkar, and Kent Griffin. Mutantx-s: Scalable malware clustering based on static features. In Presented as part of the 2013 USENIX Annual Technical Conference (USENIXATC 13), pages 187–198, 2013.
- [47] Joel Jones. Abstract syntax tree implementation idioms. In Proceedings of the 10th conference on pattern languages of programs (plop2003), page 26, 2003.
- [48] Wei Ming Khoo, Alan Mycroft, and Ross Anderson. Rendezvous: A search engine for binary code. In Proceedings of the 10th Working Conference on Mining Software Repositories, pages 329–338. IEEE Press, 2013.
- [49] Lannan Luo, Jiang Ming, Dinghao Wu, Peng Liu, and Sencun Zhu. Semantics-based obfuscation-resilient binary code similarity comparison with applications to software plagiarism detection. In Proceedings of the 22nd ACM SIGSOFT International Symposium on Foundations of Software Engineering, pages 389–400, 2014.
- [50] Lannan Luo, Jiang Ming, Dinghao Wu, Peng Liu, and Sencun Zhu. Semantics-based obfuscation-resilient binary code similarity comparison with applications to software plagiarism detection. In ACM SIGSOFT International Symposium on Foundations of Software Engineering, FSE 2014, pages 389–400, New York, NY, USA, 2014. ACM.
- [51] Jiang Ming, Meng Pan, and Debin Gao. ibinhunt: Binary hunting with inter-procedural control flow. In International Conference on Information Security and Cryptology, pages 92–109. Springer, 2012.
- [52] Jannik Pewny, Behrad Garmany, Robert Gawlik, Christian Rossow, and Thorsten Holz. Cross-architecture bug search in binary executables. In 2015 IEEE Symposium on Security and Privacy, pages 709–724. IEEE, 2015.
- [53] Edward Raff, Jon Barker, Jared Sylvester, Robert Brandon, Bryan Catanzaro, and Charles K Nicholas. Malware detection by eating a whole exe. In Workshops at the Thirty-Second AAAI Conference on Artificial Intelligence, 2018.
- [54] Frank Ruskey and TC Hu. Generating binary trees lexicographically. SIAM Journal on Computing, 6(4):745–758, 1977.
- [55] Andreas Sæbjørnsen, Jeremiah Willcock, Thomas Panas, Daniel Quinlan, and Zhendong Su. Detecting code clones in binary executables. In Proceedings of the Eighteenth International Symposium on Software Testing and Analysis, ISSTA ’09, pages 117–128, New York, NY, USA, 2009. ACM.
- [56] Andrew Schulman. Finding binary clones with opstrings function digests: Part iii. Dr. Dobb’s Journal, 30(9):64, 2005.
- [57] Yusuke Shido, Yasuaki Kobayashi, Akihiro Yamamoto, Atsushi Miyamoto, and Tadayuki Matsumura. Automatic source code summarization with extended tree-lstm. In 2019 International Joint Conference on Neural Networks (IJCNN), pages 1–8. IEEE, 2019.
- [58] Kai Sheng Tai, Richard Socher, and Christopher D Manning. Improved semantic representations from tree-structured long short-term memory networks. arXiv preprint arXiv:1503.00075, 2015.
- [59] Kai Sheng Tai, Richard Socher, and Christopher D. Manning. Improved semantic representations from tree-structured long short-term memory networks. CoRR, abs/1503.00075, 2015.
- [60] Zheng Wang, Ken Pierce, and Scott McFarling. Bmat-a binary matching tool for stale profile propagation. The Journal of Instruction-Level Parallelism, 2:1–20, 2000.
- [61] J. Wurm, K. Hoang, O. Arias, A. Sadeghi, and Y. Jin. Security analysis on consumer and industrial iot devices. In 2016 21st Asia and South Pacific Design Automation Conference (ASP-DAC), pages 519–524, 2016.
- [62] Xiaojun Xu, Chang Liu, Qian Feng, Heng Yin, Le Song, and Dawn Song. Neural network-based graph embedding for cross-platform binary code similarity detection. In Proceedings of the 2017 ACM SIGSAC Conference on Computer and Communications Security, pages 363–376. ACM, 2017.
- [63] Yinxing Xue, Zhengzi Xu, Mahinthan Chandramohan, and Yang Liu. Accurate and scalable cross-architecture cross-os binary code search with emulation. IEEE Transactions on Software Engineering, 45(11):1125–1149, 2018.
- [64] Fabian Yamaguchi, Felix Lindner, and Konrad Rieck. Vulnerability extrapolation: Assisted discovery of vulnerabilities using machine learning. In Proceedings of the 5th USENIX conference on Offensive technologies, pages 13–13, 2011.
- [65] Fabian Yamaguchi, Markus Lottmann, and Konrad Rieck. Generalized vulnerability extrapolation using abstract syntax trees. In Proceedings of the 28th Annual Computer Security Applications Conference, pages 359–368, 2012.
- [66] Wenpeng Yin, Katharina Kann, Mo Yu, and Hinrich Schütze. Comparative study of cnn and rnn for natural language processing. arXiv preprint arXiv:1702.01923, 2017.
- [67] William J Youden. Index for rating diagnostic tests. Cancer, 3(1):32–35, 1950.
- [68] Jonas Zaddach, Luca Bruno, Aurelien Francillon, Davide Balzarotti, et al. Avatar: A framework to support dynamic security analysis of embedded systems’ firmwares. In NDSS, pages 1–16, 2014.
- [69] Peng Zhao and José Nelson Amaral. To inline or not to inline? enhanced inlining decisions. In International Workshop on Languages and Compilers for Parallel Computing, pages 405–419. Springer, 2003.
- [70] Mark H Zweig and Gregory Campbell. Receiver-operating characteristic (roc) plots: a fundamental evaluation tool in clinical medicine. Clinical chemistry, 39(4):561–577, 1993.