Department of Child and Adolescent Psychiatry,
Ludwig-Maximilians-Universität, Munich, Germany
22institutetext: Department of Radiology and Imaging Sciences, and
the Indiana Alzheimer’s Disease Research Center,
Indiana University School of Medicine, Indianapolis, IN, USA
Alzheimer’s Disease Diagnosis via Deep Factorization Machine Models
Abstract
The current state-of-the-art deep neural networks (DNNs) for Alzheimer’s Disease diagnosis use different biomarker combinations to classify patients, but do not allow extracting knowledge about the interactions of biomarkers. However, to improve our understanding of the disease, it is paramount to extract such knowledge from the learned model. In this paper, we propose a Deep Factorization Machine model that combines the ability of DNNs to learn complex relationships and the ease of interpretability of a linear model. The proposed model has three parts: (i) an embedding layer to deal with sparse categorical data, (ii) a Factorization Machine to efficiently learn pairwise interactions, and (iii) a DNN to implicitly model higher order interactions. In our experiments on data from the Alzheimer’s Disease Neuroimaging Initiative, we demonstrate that our proposed model classifies cognitive normal, mild cognitive impaired, and demented patients more accurately than competing models. In addition, we show that valuable knowledge about the interactions among biomarkers can be obtained.
Keywords:
Alzheimer’s Disease Biomarkers Interactions Factorization Machines.1 Introduction
Alzheimer’s Disease (AD) patients account for 60–80% of all dementia cases [3]. Worldwide, 50 million patients have dementia and their number is estimated to triple by 2050 [17]. AD is a neurodegenerative disease whose progression is highly heterogeneous and not yet fully understood [22]. Mild cognitive impairment (MCI) is a pre-dementia stage which results in cognitive decline, but not to an extent that it impairs patients’ daily live [18]. Subjects with MCI are at an increased risk of developing dementia due to AD, which would make them completely dependent upon caregivers [18]. This transition is complex and not yet fully understood. Therefore, research in the last decade focused on identifying biomarkers to infer which stage of the disease a patient is in [11]. Important biomarkers include demographics, brain atrophy measured by magnetic resonance images (MRI), and predispositions due to genetic alterations in the form of single nucleotide polymorphisms (SNPs) (see [22] for a detailed overview).
For accurate patient stratification it is important to also consider the inter-relationships between biomarkers and model their interactions. Deep learning techniques excel at implicitly learning complex interactions, but extracting this knowledge is challenging due to their black-box nature [1]. At the other end of the spectrum are linear models that are highly interpretable, but only account for interactions when those are explicitly specified. Hence, approaches that can model complex interactions while preserving interpretability are required to further improve our understanding of the interaction between biomarkers.
In this work, we propose a model that is able to utilize both low- and high-order feature interactions. Our model comprises two parts: (i) a Factorization Machine (FM) that explicitly learns pairwise feature interactions without the need of feature engineering, and (ii) a deep neural network (DNN) that can learn arbitrary low- and high-order feature interactions implicitly. Consequently, our model preserves the best of both worlds: the interpretability of linear models – via the FM – and the discriminatory power of DNNs. In our experiments, we demonstrate that our proposed model outperforms competing methods for classifying healthy controls, patients with MCI, and patients with AD.
2 Related Work
Several existing works study the fusion of multi-modal data for AD diagnosis and the interaction between features. Zhang et al. [33] use MRI, FDG-PET, and biomarkers derived from cerebrospinal fluid (CSF). They use a multiple-kernel SVM that uses one kernel per modality and combines modalities by a weighted sum of modality-specific kernels. This way, interactions can only be addressed implicitly by absorbing them into the sum of kernels and interpretability is lost.
Tong et al. [28] introduce a non-linear graph fusion approach for multi-modal AD diagnosis. Their approach can assign an overall importance value to each modality in a manner that scales independently of the number of features. However, this does not allow for modelling interactions between single features. Khatri et al. [12] use an Extreme Learning Machine (ELM) – a single layer feed-forward neural network (NN). They use regional volume and thickness measurements, CSF biomarkers ApoE allele information, and the Mini-Mental State Examination (MMSE) cognitive score. Because of the use of MMSE, their model is not solely based on biological measurements, but includes diagnostic information, which usually is among the variables of interest. Moreover, ELMs are a type of neural network, which makes their interpretation difficult [16, 29]. In [30], a “Multimodal deep learning [model] for early detection of Alzheimer’s Disease stage” is proposed. They account for the lack of interpretability of DNNs, by running the model multiple times with one feature masked at a time. The sharper the drop in performance, the higher they rank the importance of the masked feature. While this provides a measure of importance on a per-feature level, it ignores how the model utilizes feature interactions. Ning et al. [15] use a two hidden layer NN to perform AD diagnosis based on MRI-derived features and genetics. They attempt to determine the importance of features and feature interactions via back-propagation based on the partial derivatives method [5]. The authors point out that it remains to be tested how well the computed importance measure reflects the actual prediction computation by their model.
Finally, we want to emphasize that all the existing approaches only study feature interactions by trying to disentangle what the model learned in a post-hoc manner, but not how changes to the model architecture can make the model itself more interpretable.
3 Methods
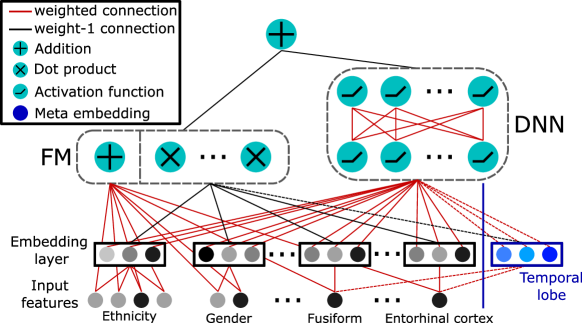
The proposed model comprises three major parts for improved AD diagnosis (see fig. 1). The first part is an embedding layer to deal with sparse data [6]. The second part is based on the Factorization Machine [20], which models pairwise feature interactions as an inner product of latent vectors from the embedding layer. The third part is a Deep Neural Network (DNN) that has the potential to implicitly learn complex feature interactions. The combined model is closely related to the DeepFM [6] for click-through-rate prediction. We train our model to differentiate between three groups: AD, MCI and CN patients.
3.1 Embedding Layer
The first layer is an embedding layer, similar to the one in [6]. The layer serves two purposes: First, DNNs are unable to train on sparse data, and second, one feature can span multiple columns if it is e.g. a one-hot encoded categorical feature. Via the embedding, each feature is represented as one dense vector, which leads to a more comprehensible representation. The embedding layer condenses each -dimensional feature into a vector with fixed length : , where is the learned embedding matrix for feature . The embedding vector represents the entire feature and eliminates the problems that arise when training neural networks on sparse data – in particular, when categorical features with many categories are present, because the embedding layer reduces the dimensionality compared to a one-hot encoding.
Another advantage of the embedding layer is that it can be used to combine sets of features describing whole brain areas. For instance, one can combine the volume measurements of all regions belonging to the temporal lobe into one embedding vector. Therefore, the embedding layer can be used as a mean to incorporate domain knowledge about the structural or functional relationship between features. As AD is a highly heterogeneous disease and brain regions are strongly interrelated, this can improve predictive performance as well as interpretability of interaction effects, which we will discuss next.
3.2 Factorization Machine
The Factorization Machine (FM; [20]) consists of three parts: a bias, a linear predictor, and a pairwise-interaction term (for simplicity, we omit the bias in fig. 1). For an -dimensional feature vector , the FM for class is defined as:
| (1) |
The key idea of the FM is to not learn interaction weights explicitly, which would scale quadratically in the number of features, but implicitly through the dot product . Hence, weights are shared across interaction terms and one has to learn embedding matrices instead of weights that would be required for explicit interaction modelling. To preserve the linear complexity of the linear model, while still accounting for pairwise interactions, we reformulate the pairwise-interaction computation as in [20], resulting in a runtime.
3.3 Deep Factorization Machine
So far, our model only accounts for linear and pairwise interactions. We account for high-order interactions implicitly by employing a DNN alongside the FM from above [6] (see fig. 1). The DNN receives the concatenated embedding vectors , and thus is equipped to learn from high-dimensional sparse data. The DNN contains two hidden layers with ReLU activation function :
| (2) |
where and are the weight matrix and bias of the -th layer, respectively. Finally, the overall prediction for class of our DeepFM model is:
| (3) |
where is the factorization machine defined in equation (1). During training, we optimize the weights of the FM part (), the embedding matrices , which are shared among the FM and deep part of our model, and the parameters of the DNN ().
4 Experiments
We evaluated the proposed model on data provided by the Alzheimer’s Disease Neuroimaging Initiative [10]. Table 1 summarizes the data. Our dataset contains a total of 1492 patients with 6844 visits and three class labels: AD (1536 visits), MCI (3131 visits), cognitive normal (CN; 2177 visits). In addition to demographic data, we collected for each patient MRIs and processed them with FreeSurfer [4] to obtain 20 volume and 34 thickness measurements. Moreover, we collected Amyloid- (A), Tau, and phosphorylated Tau (pTau) concentration in CSF. Finally, we collected 41 genetic markers, previously shown to be associated with AD and atrophy [8, 13], as described in [31]. Except for CSF measurements, which are only available for 1863 visits, each modality is available for all patients. A, Tau, and pTau are important biomarkers and in order to not heavily reduce the available data, we keep them and handle missing values as zero, to get as good as a prediction as possible. In total, we used 109 features.
| Feature | AD-patients | MCI-patients | NC-patients | ||||||
|---|---|---|---|---|---|---|---|---|---|
| min | mean | max | min | mean | max | min | mean | max | |
| MMSE | 10.0 | 21.9 | 30.0 | 10.0 | 27.5 | 30.0 | 20.0 | 29 | 30.0 |
| Age | 55.0 | 74.4 | 90.9 | 54.4 | 73.1 | 91.4 | 55.0 | 73.9 | 90.1 |
| Education (Years) | 4.0 | 15.45 | 20.0 | 6.0 | 16.03 | 20.0 | 6.0 | 16.43 | 20.0 |
| Gender | 58.3 % Male | 61.8% Male | 52.3 % Male | ||||||
To avoid data leakage due to confounding effects of age and sex [32], we split the data into 5 non-overlapping folds using only baseline visits such that diagnosis, age and sex are balanced across folds [9]. We used one fold as test set and combined the remaining folds such that 80% of it comprise the training set and 20% the validation set. We extended the training set, but not validation or test, by including each patient’s longitudinal data.
We optimized the models’ hyperparameters (see table 2) for each of the five folds separately via Bayesian black-box optimization on the validation set [7]. We compare the proposed DeepFM to a standalone DNN, the FM [20], and a linear logistic regression model that explicitly accounts for all pairwise interactions. Each model is evaluated by the balanced accuracy on the respective test set.
| Hyperparameter | DeepFM | FM | DNN | Linear |
|---|---|---|---|---|
| Neurons Layer 1 | - | - | ||
| Neurons Layer 2 | - | - | ||
| Neurons Layer 3 | - | - | - | |
| Length Embedding Vector | - | |||
| Learning Rate | ||||
| L1-Regu. Weight | ||||
| L2-Regu. Weight | ||||
| Dropout | - | - |
5 Results & Discussion
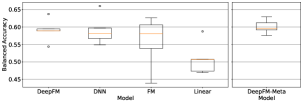
Performance.
With a median balanced accuracy of 0.589, DeepFM has the highest performance of all models (see fig. 2). It is slightly better than DNN () and FM (). DeepFM improves over the DNN thanks to the added FM model. Solely the linear model is unable to achieve similar performance. This shows the effectiveness of the FM approach and its capability to learn interactions among many features. In addition, we explored meta-embeddings, which combine volume measurements of larger brain regions into a single embedding vector. We only combine brain volume features as those are the largest feature group and combining them by brain region is medically reasonable. Our results demonstrate that this leads to a slightly higher balanced accuracy of 0.596, but most importantly lowers the variance across folds (fig. 2, right). By combining larger brain regions, the pairwise interaction space shrinks and the model is less prone to overfitting.
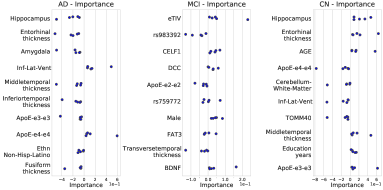
Feature Importance.
We get a direct measure of feature importance by looking at the weights of the linear part of the DeepFM in (1). Figure 3 displays the weights of the ten most important features for each fold (sorted by their mean weight over all folds). Because weights are class-specific, we obtain three rankings. As the top ten features for the AD (CN) model account for 42% (39.8%) of the total feature importance, we only analyze those in more detail.
The first and third most important features for AD are the volumes of Hippocampus and Amygdala, both lie in the temporal lobe, a region typically affected by AD [23, 27]. The thickness measures in the top features for AD lie in the parietal and temporal lobe. Both regions were previously shown to exhibit atrophy in AD patients [2, 24]. The volume of the lateral ventricle is dependent on the atrophy of the brain regions surrounding it. Two variants of the genetic marker ApoE, e3-e3 and e4-e4, are important for prediction, which is reassuring because it is an important marker for AD [19, 21]. Being not Hispanic, or not Latino has a slightly positive influence on the AD risk, which is supported by previous studies [25, 26].
It is striking that the learned impact of all the top features for AD and CN prediction is in line with medical findings. Consequently, the weights’ signs for the prediction of CN have the opposite sign compared to those for AD. For MCI, the picture is less clear. As MCI patients are part of a complex transition, this group is more heterogeneous. While for AD and CN a few very important features are sufficient for prediction, for MCI, the top ten features only make up for 23.7% of the total feature importance and learned weights are incoherent.
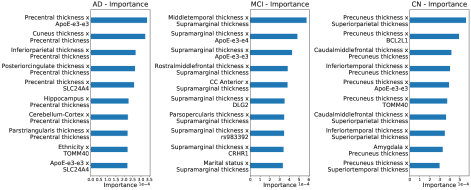
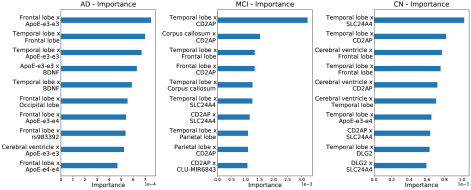
Feature Interactions.
The second information that is easily accessible is the importance of feature interactions (see fig. 4). This gives DeepFM an advantage over DNNs, for which extracting information about learned interactions is challenging. The information of a feature in an interaction is interconnected with their own and their partners embedding matrix. We extract the importance information by running the model with the test data and computing the relative importance of each single interaction and the output of the rest of the model for every patient. We can then plot the importance value for each interaction as the mean over all patients. The 109 features per patient accumulate to 5886 pairwise interactions. Thus, a single interaction has a relatively small contribution.
AD affects multiple brain regions at every stage of disease progression. The difficulty of pinpointing AD to a specific region becomes apparent for the pairwise interactions, where multiple brain regions interact. Numerous interactions consist of regions in or near the Hippocampus. Some genetic markers also appear. The interactions between them and different brain regions are an interesting finding that needs to be further explored in the future. However, in this setup the brain is scattered in many volumes and small differences or measurement errors become much more pronounced. This makes the interpretation difficult.
At this point, the advantage of the embedding layer comes into play. While interactions between single small brain regions are hard to interpret, the embedding layer can be used to embed larger regions into a so-called meta embedding. The interactions between these larger regions give a better picture of important regions (see fig. 5). Small deviations have less influence and overfitting is reduced. Using meta embedding, DeepFM is especially utilizing interactions between ApoE and temporal or frontal lobe volumes. Comparing the most important feature interactions to distinguish AD from the rest, with the ones used for CN patients, it becomes even clearer that DeepFM learns medically explainable features. The CN-model focuses especially on the temporal lobe and cerebral ventricle. Both regions are known to be affected early on in the disease [27, 14].
6 Conclusion
We proposed a Deep Factorization Machine model that combines the strength of deep neural networks to implicitly learn feature interactions and the ease of interpretability of a linear model. Our experiments on Alzheimer’s Disease diagnosis demonstrated that the proposed architecture is able accurately classify patients than competing methods and can reveal valuable insights about the interaction between biomarkers.
Acknowledgements.
This research was supported by the Bavarian State Ministry of Science and the Arts and coordinated by the Bavarian Research Institute for Digital Transformation, and the Federal Ministry of Education and Research in the call for Computational Life Sciences (DeepMentia, 031L0200A).
References
- [1] Barredo Arrieta, A., Díaz-Rodríguez, N., Del Ser, J., Bennetot, A., Tabik, S., et al.: Explainable Artificial Intelligence (XAI): Concepts, taxonomies, opportunities and challenges toward responsible AI. Information Fusion 58, 82–115 (2020)
- [2] Dickerson, B.C., Bakkour, A., Salat, D.H., Feczko, E., Pacheco, J., et al.: The cortical signature of alzheimer’s disease: Regionally specific cortical thinning relates to symptom severity in very mild to mild AD dementia and is detectable in asymptomatic amyloid-positive individuals. Cereb Cortex 19(3), 497–510 (2008)
- [3] Fan, L., Mao, C., Hu, X., Zhang, S., Yang, Z., et al.: New insights into the pathogenesis of alzheimer’s disease. Front Neurol 10, 1312 (2020)
- [4] Fischl, B.: FreeSurfer. NeuroImage 62(2), 774–781 (2012)
- [5] Gevrey, M., Dimopoulos, I., Lek, S.: Review and comparison of methods to study the contribution of variables in artificial neural network models. Ecol Modell 160(3), 249–264 (2003)
- [6] Guo, H., Tang, R., Ye, Y., Li, Z., He, X.: DeepFM: A Factorization-Machine Based Neural Network for CTR Prediction. In: Proc. 26th International Joint Conference on Artificial Intelligence. pp. 1725–1731 (2017)
- [7] Head, T., Kumar, M., Nahrstaedt, H., Louppe, G., Shcherbatyi, I.: scikit-optimize/scikit-optimize v0.8.1 (Sep 2020). https://doi.org/10.5281/zenodo.4014775
- [8] Hibar, D.P., Stein, J.L., Renteria, M.E., Arias-Vasquez, A., Desrivières, S., et al.: Common genetic variants influence human subcortical brain structures. Nature 520(7546), 224–229 (2015)
- [9] Ho, D.E., Imai, K., King, G., Stuart, E.A.: Matching as Nonparametric Preprocessing for Reducing Model Dependence in Parametric Causal Inference. Political Analysis 15(3), 199–236 (2007)
- [10] Jack, C.R., Bernstein, M.A., Fox, N.C., Thompson, P., Alexander, G., et al.: The Alzheimer’s disease neuroimaging initiative (ADNI): MRI methods. J Magn Reson Imaging 27(4), 685–691 (2008)
- [11] Jack, C.R., Knopman, D.S., Jagust, W.J., Petersen, R.C., Weiner, M.W., Aisen, P.S., Shaw, L.M., Vemuri, P., et al.: Tracking pathophysiological processes in Alzheimer’s disease: an updated hypothetical model of dynamic biomarkers. Lancet Neurol 12(2), 207–216 (2013)
- [12] Khatri, U., Kwon, G.R.: An efficient combination among sMRI, CSF, cognitive score, and APOE 4 biomarkers for classification of AD and MCI using extreme learning machine. Comput Intell Neurosci 2020, 1–18 (2020)
- [13] Lambert, J.C., Ibrahim-Verbaas, C.A., Harold, D., Naj, A.C., Sims, R., et al.: Meta-analysis of 74,046 individuals identifies 11 new susceptibility loci for alzheimer’s disease. Nat Genet 45(12), 1452–1458 (2013)
- [14] Nestor, S.M., Rupsingh, R., Borrie, M., Smith, M., Accomazzi, V., et al.: Ventricular enlargement as a possible measure of alzheimer’s disease progression validated using the alzheimer’s disease neuroimaging initiative database. Brain 131(9), 2443–2454 (2008)
- [15] Ning, K., Chen, B., Sun, F., Hobel, Z., Zhao, L., Matloff, W., Toga, A.W.: Classifying alzheimer’s disease with brain imaging and genetic data using a neural network framework. Neurobiol Aging 68, 151–158 (2018)
- [16] Olden, J.D., Joy, M.K., Death, R.G.: An accurate comparison of methods for quantifying variable importance in artificial neural networks using simulated data. Ecol Modell 178(3-4), 389–397 (2004)
- [17] Patterson, C., et al.: World alzheimer report 2018. Tech. rep., Alzheimer’s Disease International (2018)
- [18] Petersen, R.C.: Mild Cognitive Impairment. N Engl J Med 364(23), 2227–2234 (2011)
- [19] Reiman, E.M., Arboleda-Velasquez, J.F., Quiroz, Y.T., Huentelman, M.J., Beach, T.G., et al.: Exceptionally low likelihood of Alzheimer’s dementia in APOE2 homozygotes from a 5,000-person neuropathological study. Nat Commun 11 (2020)
- [20] Rendle, S., Schmidt-Thieme, L.: Pairwise interaction tensor factorization for personalized tag recommendation. In: Proc. third ACM international conference on Web search and data mining. pp. 81–90 (2010)
- [21] Saykin, A.J., Shen, L., Foroud, T.M., Potkin, S.G., et al.: Alzheimer’s disease neuroimaging initiative biomarkers as quantitative phenotypes: Genetics core aims, progress, and plans. Alzheimers Dement 6(3), 265–273 (2010)
- [22] Scheltens, P., Blennow, K., Breteler, M.M.B., de Strooper, B., Frisoni, G.B., Salloway, S., der Flier, W.M.V.: Alzheimer’s disease. The Lancet 388(10043), 505–517 (2016)
- [23] Scott, S.A., DeKosky, S.T., Scheff, S.W.: Volumetric atrophy of the amygdala in alzheimer's disease: Quantitative serial reconstruction. Neurology 41(3), 351–351 (1991)
- [24] Singh, V., Chertkow, H., Lerch, J.P., Evans, A.C., Dorr, A.E., Kabani, N.J.: Spatial patterns of cortical thinning in mild cognitive impairment and alzheimer’s disease. Brain 129(11), 2885–2893 (2006)
- [25] Tang, M.X., Cross, P., Andrews, H., Jacobs, D., Small, S., Bell, K., Merchant, C., Lantigua, R., Costa, R., Stern, Y., et al.: Incidence of AD in African-Americans, Caribbean hispanics, and caucasians in northern Manhattan. Neurology 56(1), 49–56 (2001)
- [26] Tang, M.X., Stern, Y., Marder, K., Bell, K., Gurland, B., Lantigua, R., Andrews, H., Feng, L., Tycko, B., Mayeux, R.: The APOE-4 Allele and the Risk of Alzheimer Disease Among African Americans, Whites, and Hispanics. JAMA 279(10), 751–755 (1998)
- [27] Teipel, S.J., Pruessner, J.C., Faltraco, F., Born, C., Rocha-Unold, M., et al.: Comprehensive dissection of the medial temporal lobe in AD: measurement of hippocampus, amygdala, entorhinal, perirhinal and parahippocampal cortices using MRI. J Neurol 253(6), 794–800 (2006)
- [28] Tong, T., Gray, K., Gao, Q., Chen, L., Rueckert, D.: Nonlinear graph fusion for multi-modal classification of alzheimer’s disease. In: Machine Learning in Medical Imaging. pp. 77–84 (2015)
- [29] Tsang, M., Cheng, D., Liu, Y.: Detecting statistical interactions from neural network weights. In: International Conference on Learning Representations (2018)
- [30] Venugopalan, J., Tong, L., Hassanzadeh, H.R., Wang, M.D.: Multimodal deep learning models for early detection of alzheimer’s disease stage. Sci Rep 11(1) (2021)
- [31] Wachinger, C., Nho, K., Saykin, A.J., Reuter, M., Rieckmann, A.: A longitudinal imaging genetics study of neuroanatomical asymmetry in alzheimer’s disease. Biol Psychiatry 84(7), 522–530 (2018)
- [32] Wen, J., Thibeau-Sutre, E., Diaz-Melo, M., Samper-González, J., et al.: Convolutional neural networks for classification of Alzheimer’s disease: Overview and reproducible evaluation. Med Image Anal 63, 101694 (2020)
- [33] Zhang, D., Wang, Y., Zhou, L., Yuan, H., Shen, D.: Multimodal classification of alzheimer's disease and mild cognitive impairment. NeuroImage 55(3), 856–867 (2011)